Biblioteca de design
Novos designs Merch
Camisetas
Vectores
Designs de Merch de Tendência
PNGs & SVGs
Mockups
Modelos de T-Shirt PSD
Explorar Desenhos
Designs KDP
Pôsteres
Canecas
Capas para celular
Sacos de compras
Almofadas
Ferramentas de desenho
Merch Designer
Novo!
Mockup Generator
Gerador de Design de AI
Vetorizador
Quote Generator
T-Shirt Maker (Antigo)
Ajuda
Merch Digest
Blog
Centro de Ajuda
Saiba mais sobre o Merch
Feedback
Soluções Corporativas
Empresa
Acesso à API
Estúdio de Design
Design em Lote
Preços
Carregando...
Inscrever-se
Conecte-se
All
chart
Biblioteca de design
Novos designs Merch
Camisetas
Vectores
Designs de Merch de Tendência
PNGs & SVGs
Mockups
Modelos de T-Shirt PSD
Explorar Desenhos
Designs KDP
Pôsteres
Canecas
Capas para celular
Sacos de compras
Almofadas
Ferramentas de desenho
Merch Designer
Novo!
Mockup Generator
Gerador de Design de AI
Vetorizador
Quote Generator
T-Shirt Maker (Antigo)
Ajuda
Merch Digest
Blog
Centro de Ajuda
Saiba mais sobre o Merch
Feedback
Soluções Corporativas
Empresa
Acesso à API
Estúdio de Design
Design em Lote
PLANOS
All
chart
515 Gráficos e Designs de chart para Camisetas e Merch print on demand
Baixar designs de camisetas e para merch, como capas de livro, capas de celular, tote bags e mais de chart
Relacionado:
chartoon
,
grafico
,
graficos
Ordenar por
Mais relevante
Resultados patrocinados da
Ganhe 15% de desconto com o código: VEXELS15
veja mais detalhes
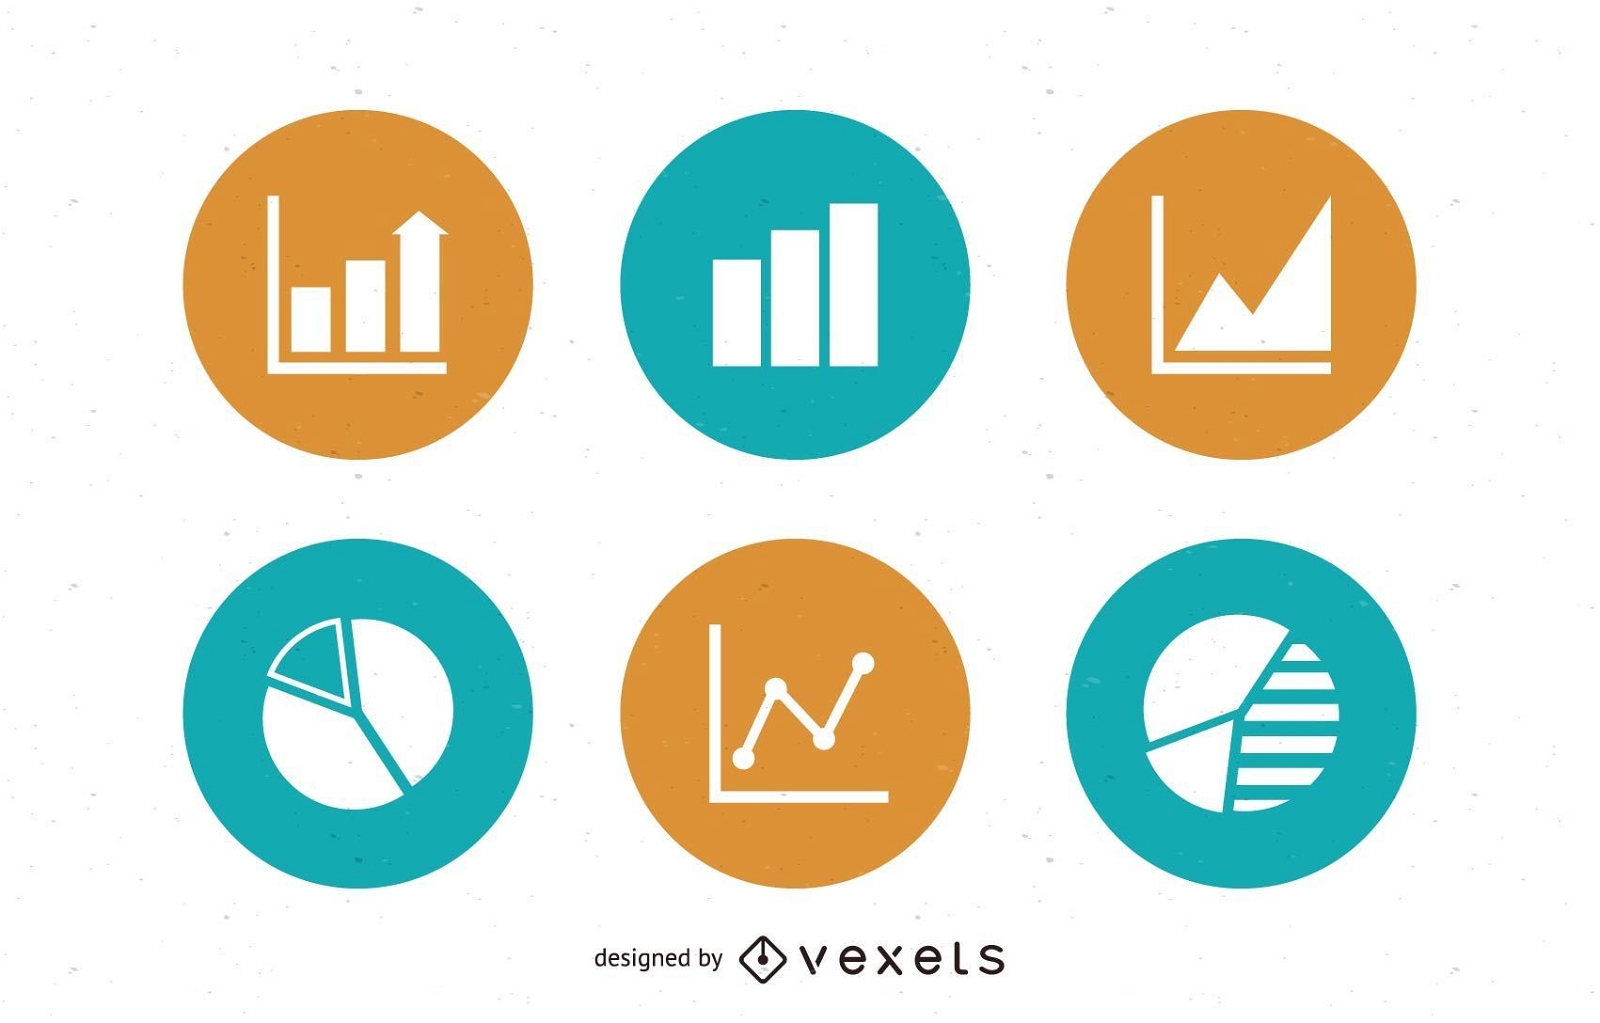
Pacote de ícones de gráficos e círculos
Escolha uma pasta
Todos os favoritos
Criar novo
Salvar
Pacote de ícones de gráficos e círculos
Pronto para imprimir
para Merch
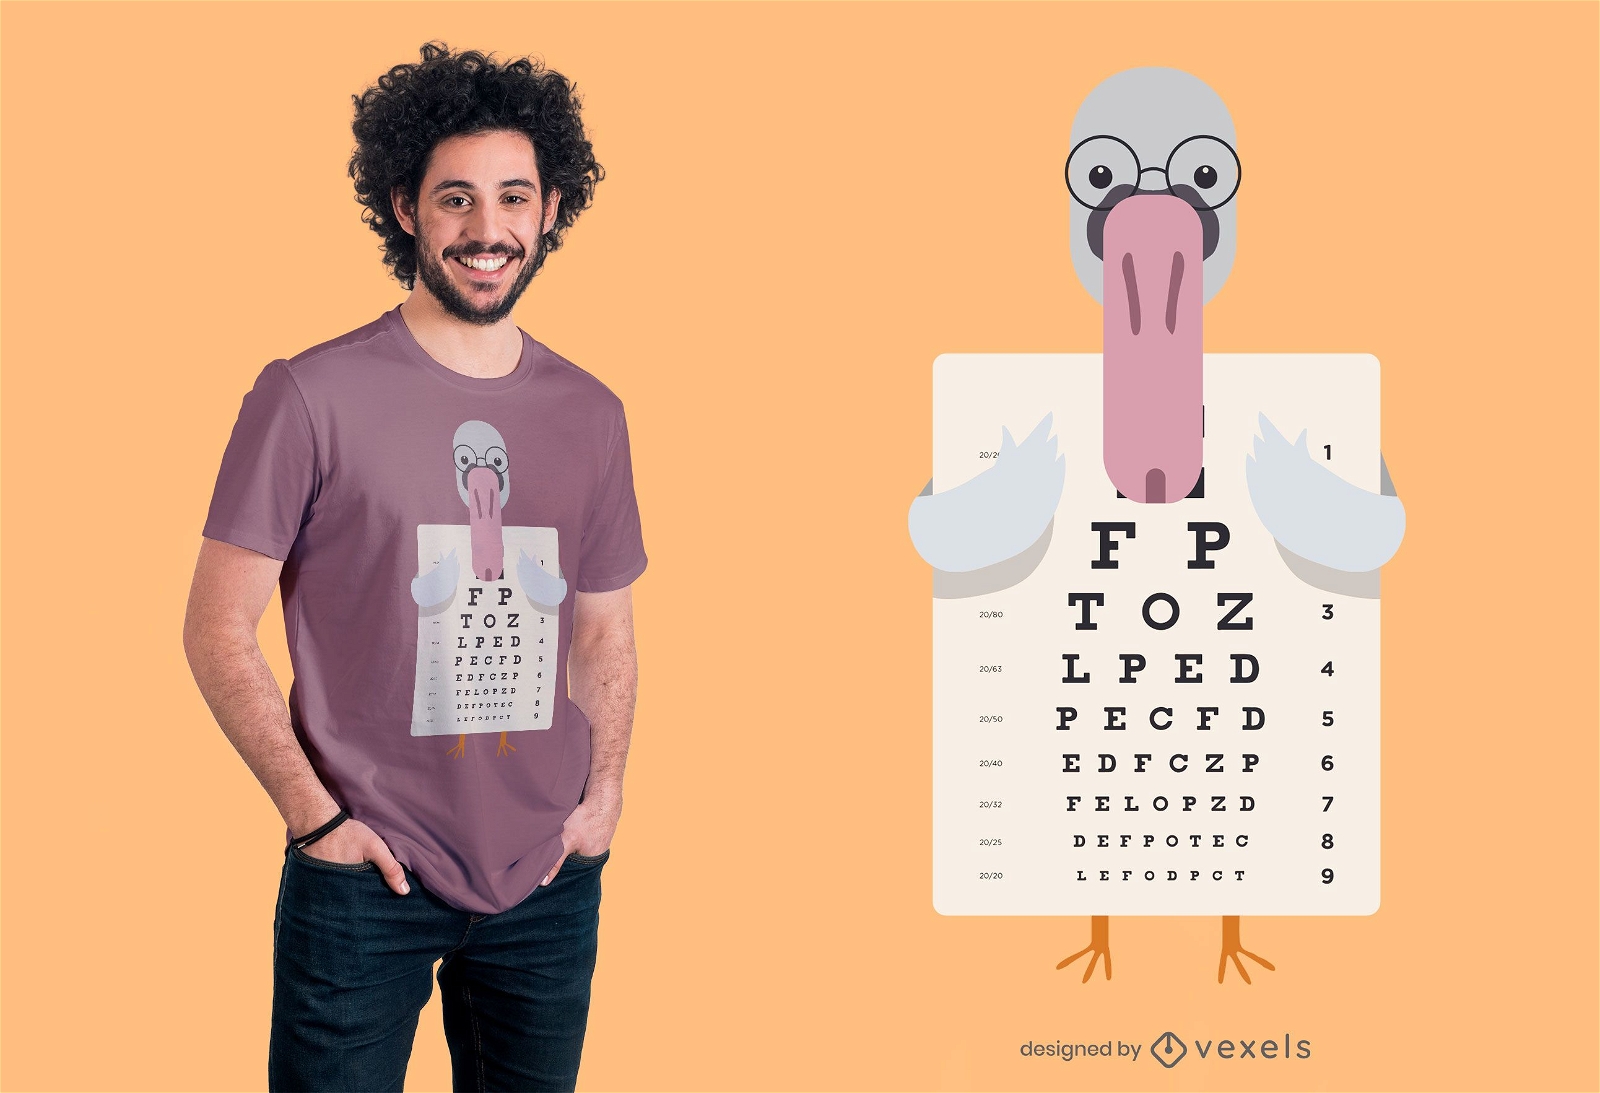
Design de camiseta com gráfico de olho de cisne
Escolha uma pasta
Todos os favoritos
Criar novo
Salvar
Design de camiseta com gráfico de olho de cisne
Pronto para imprimir
para Merch
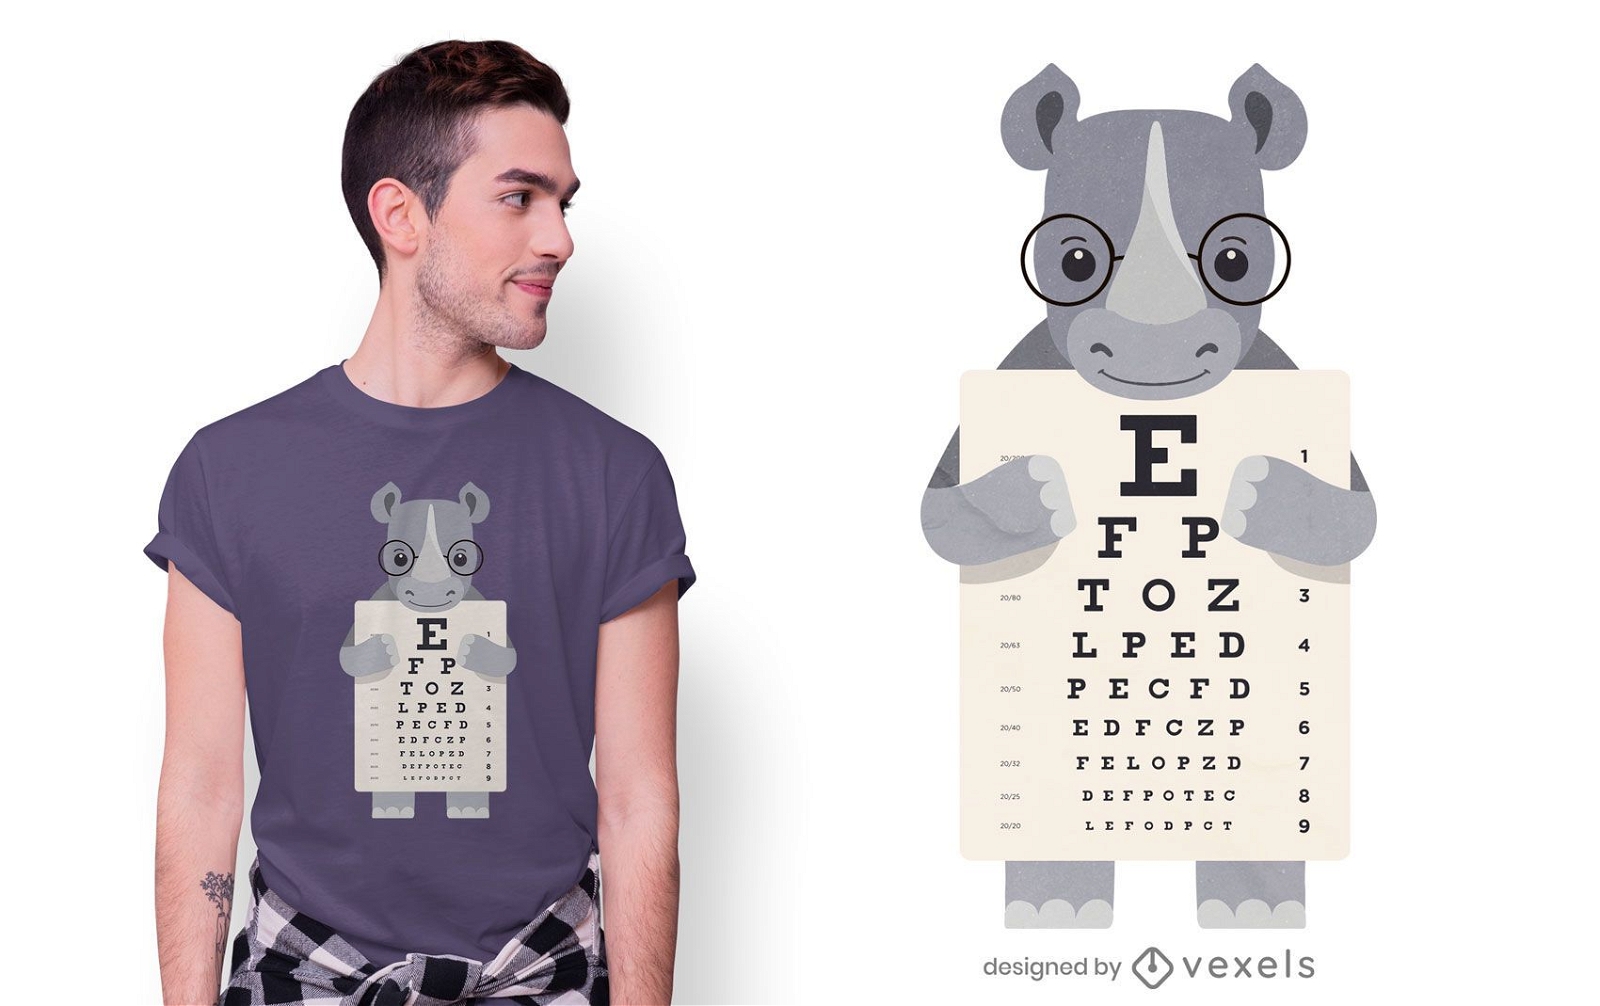
Design de camiseta com gráfico de olho Rhino
Escolha uma pasta
Todos os favoritos
Criar novo
Salvar
Design de camiseta com gráfico de olho Rhino
Pronto para imprimir
para Merch
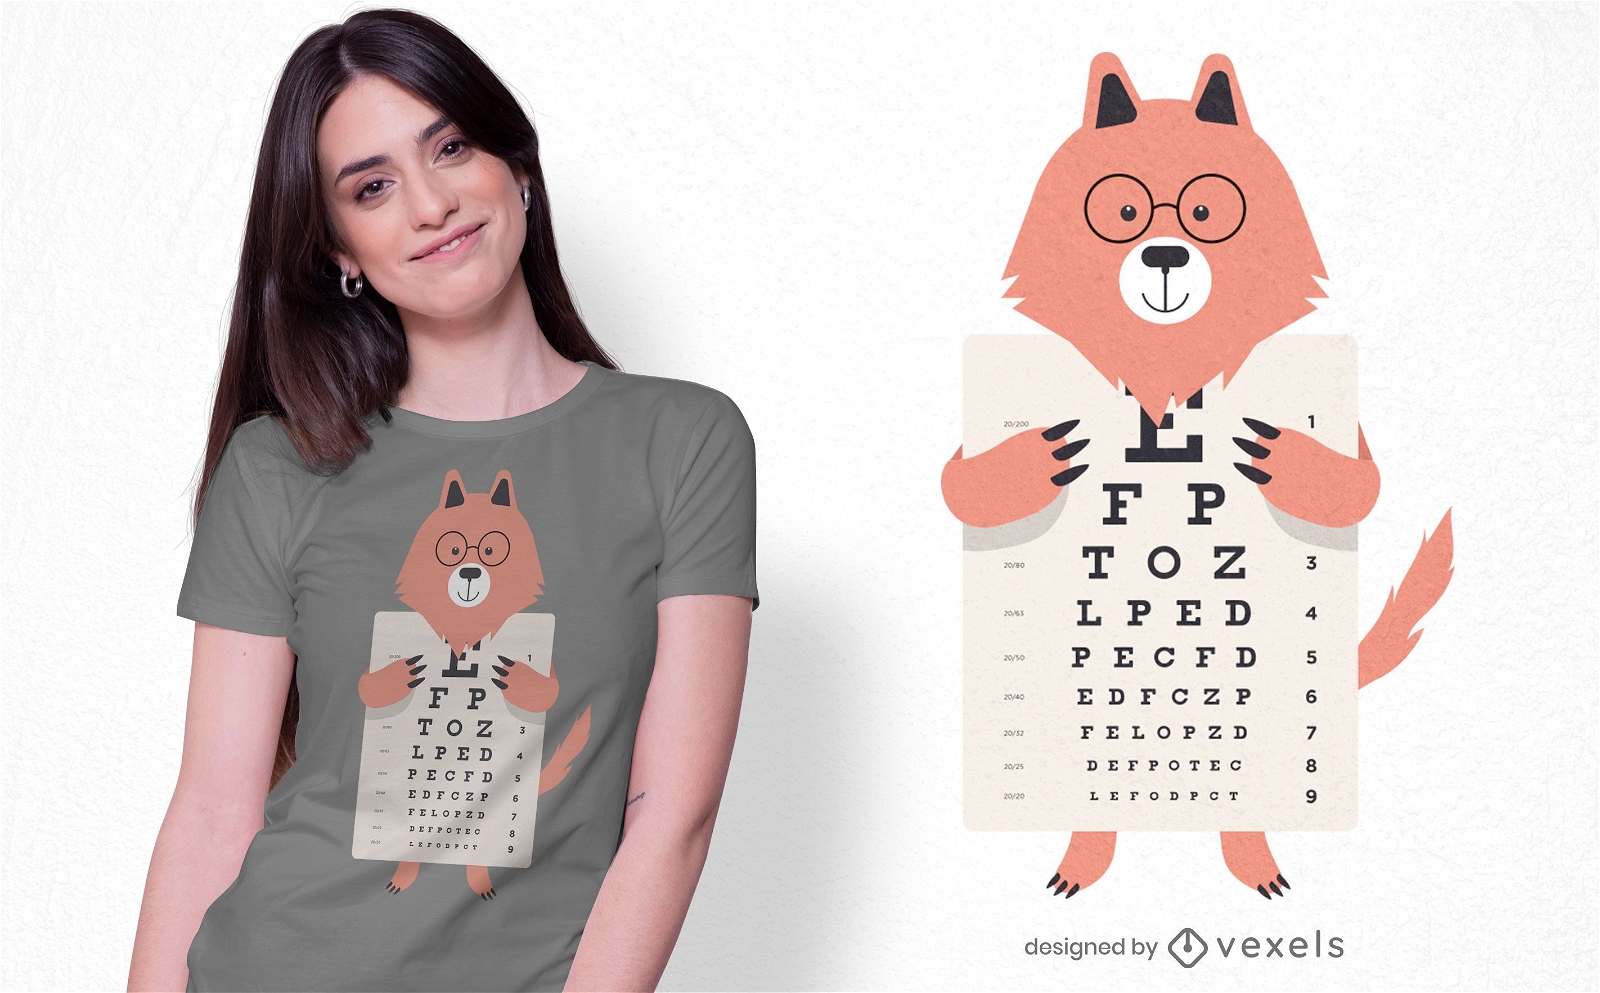
Design de camiseta Wolf Eye Chart
Escolha uma pasta
Todos os favoritos
Criar novo
Salvar
Design de camiseta Wolf Eye Chart
Pronto para imprimir
para Merch
Design de t-shirt Eagle Eye Chart
Escolha uma pasta
Todos os favoritos
Criar novo
Salvar
Design de t-shirt Eagle Eye Chart
Pronto para imprimir
para Merch
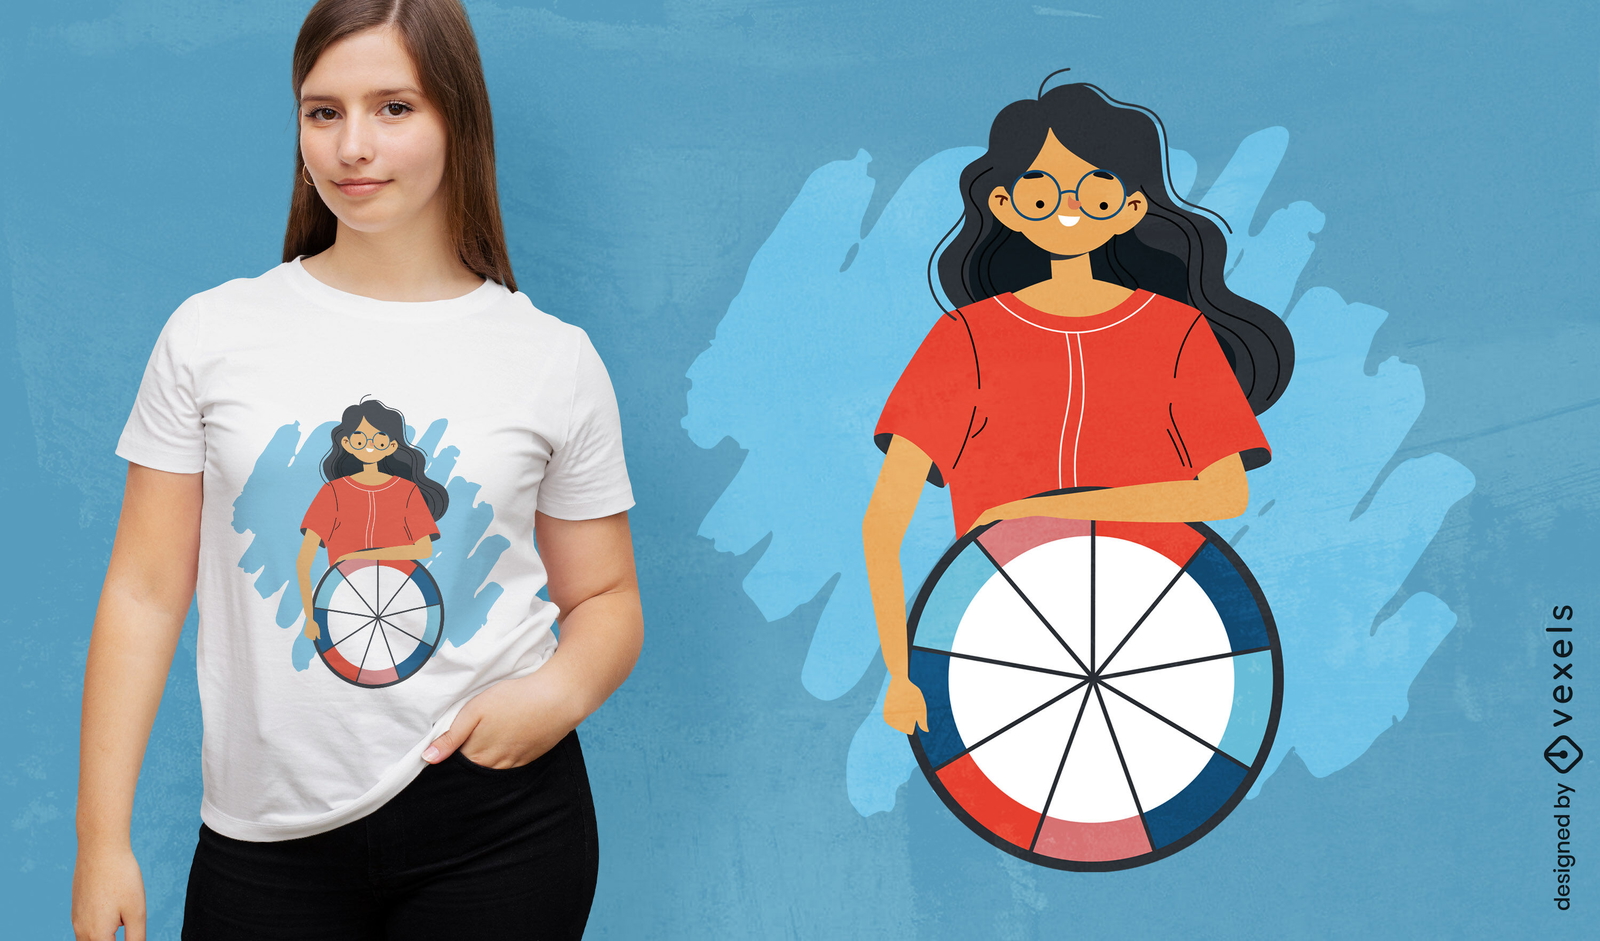
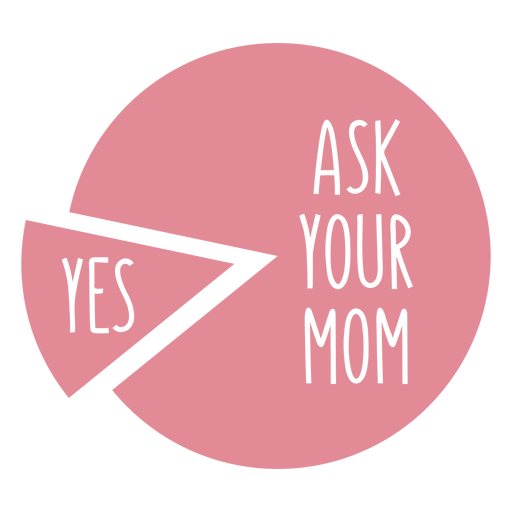
Mulher com design de camiseta de gráfico de pizza
Escolha uma pasta
Todos os favoritos
Criar novo
Salvar
Mulher com design de camiseta de gráfico de pizza
Premium
Tabela de teste de olho Desenho PNG
Escolha uma pasta
Todos os favoritos
Criar novo
Salvar
Tabela de teste de olho Desenho PNG
Pronto para imprimir
para Merch
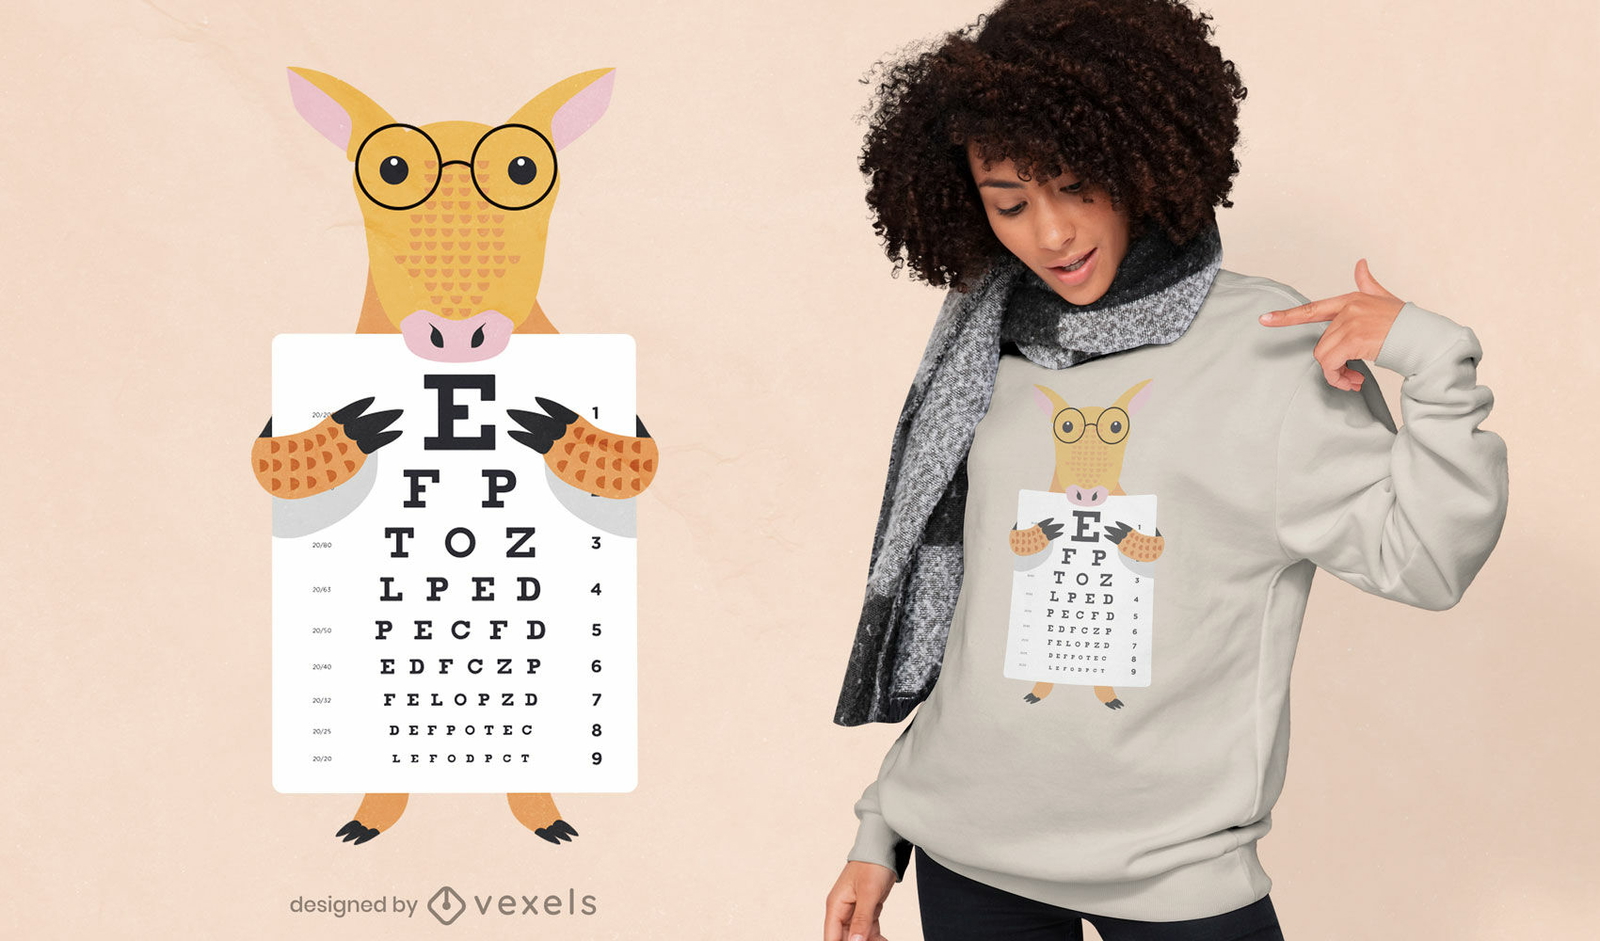
Tatu segurando um desenho de t-shirt com gráfico de olho
Escolha uma pasta
Todos os favoritos
Criar novo
Salvar
Tatu segurando um desenho de t-shirt com gráfico de olho
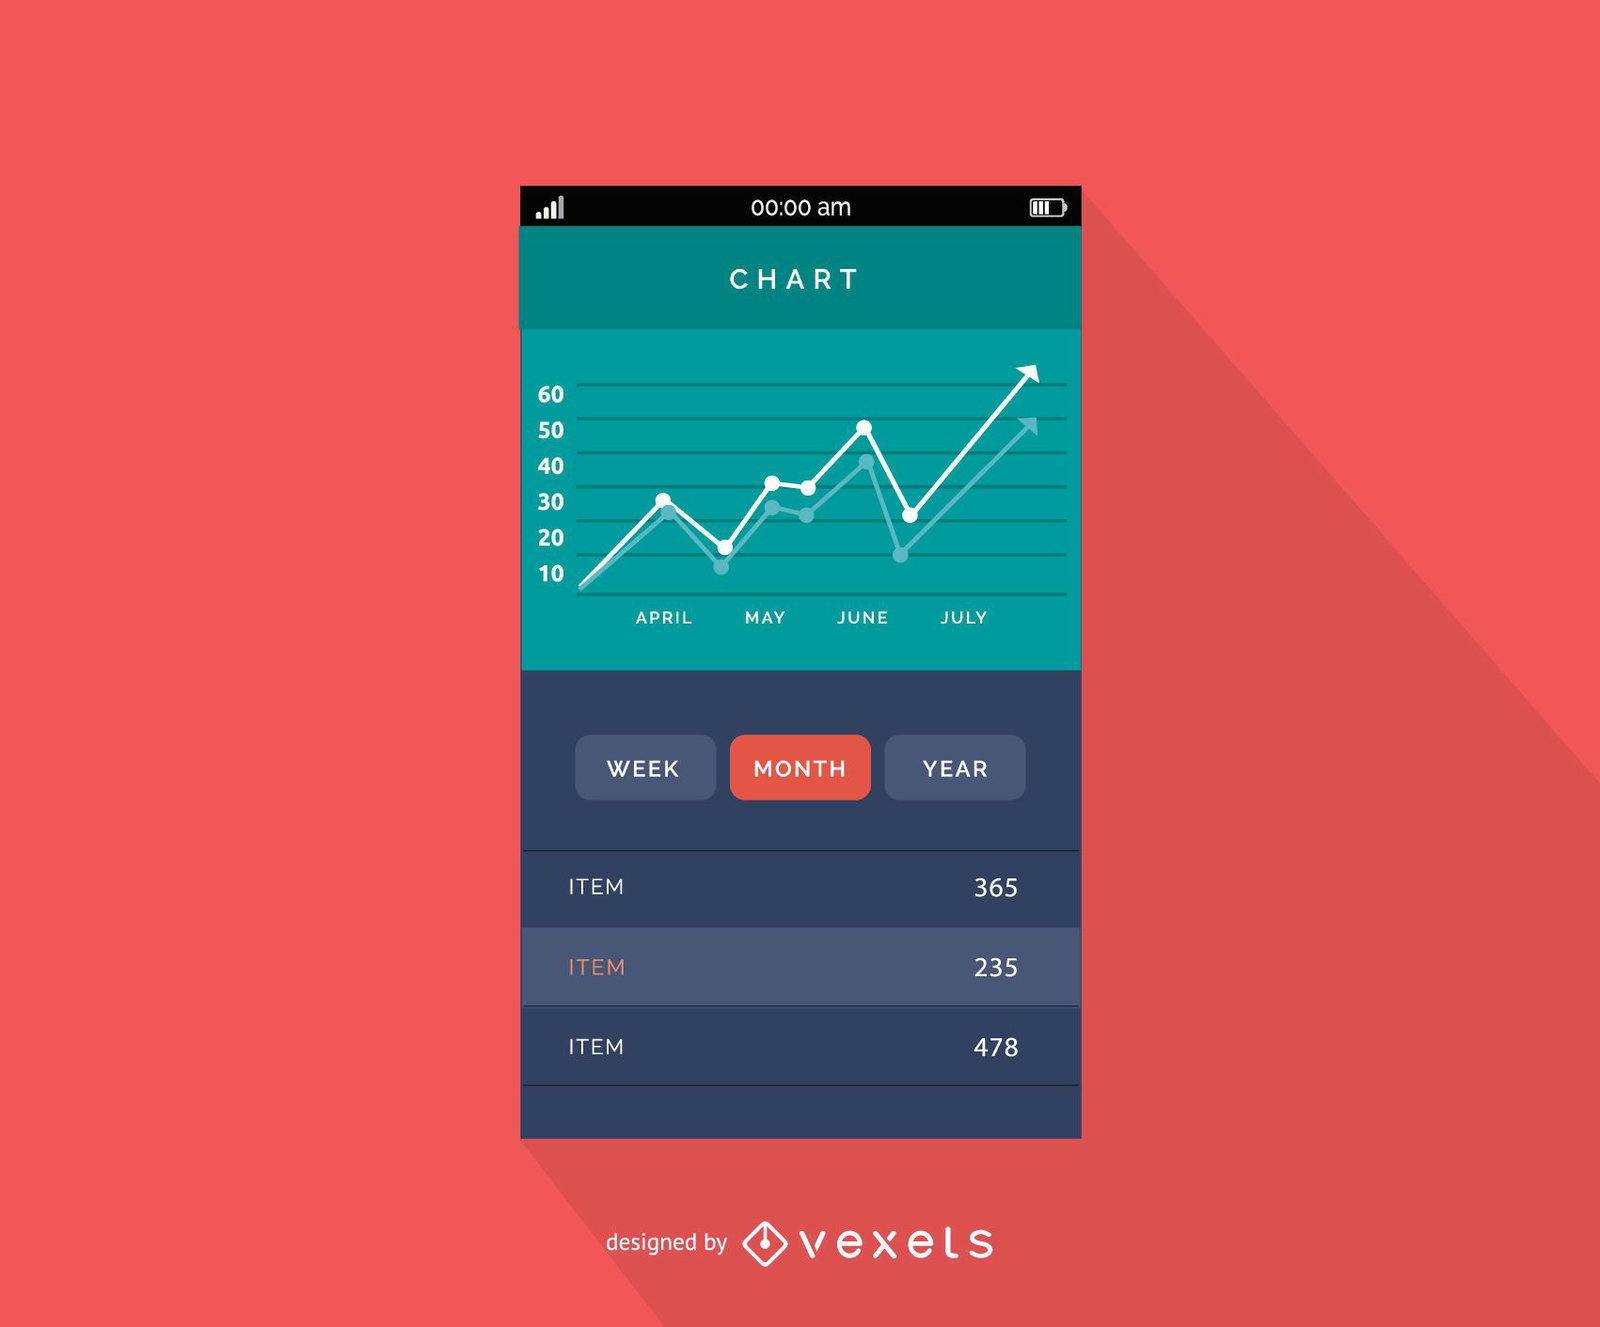
Design de interface gráfica para celular
Escolha uma pasta
Todos os favoritos
Criar novo
Salvar
Design de interface gráfica para celular
Premium
Documento gráfico Desenho PNG
Escolha uma pasta
Todos os favoritos
Criar novo
Salvar
Documento gráfico Desenho PNG
Premium
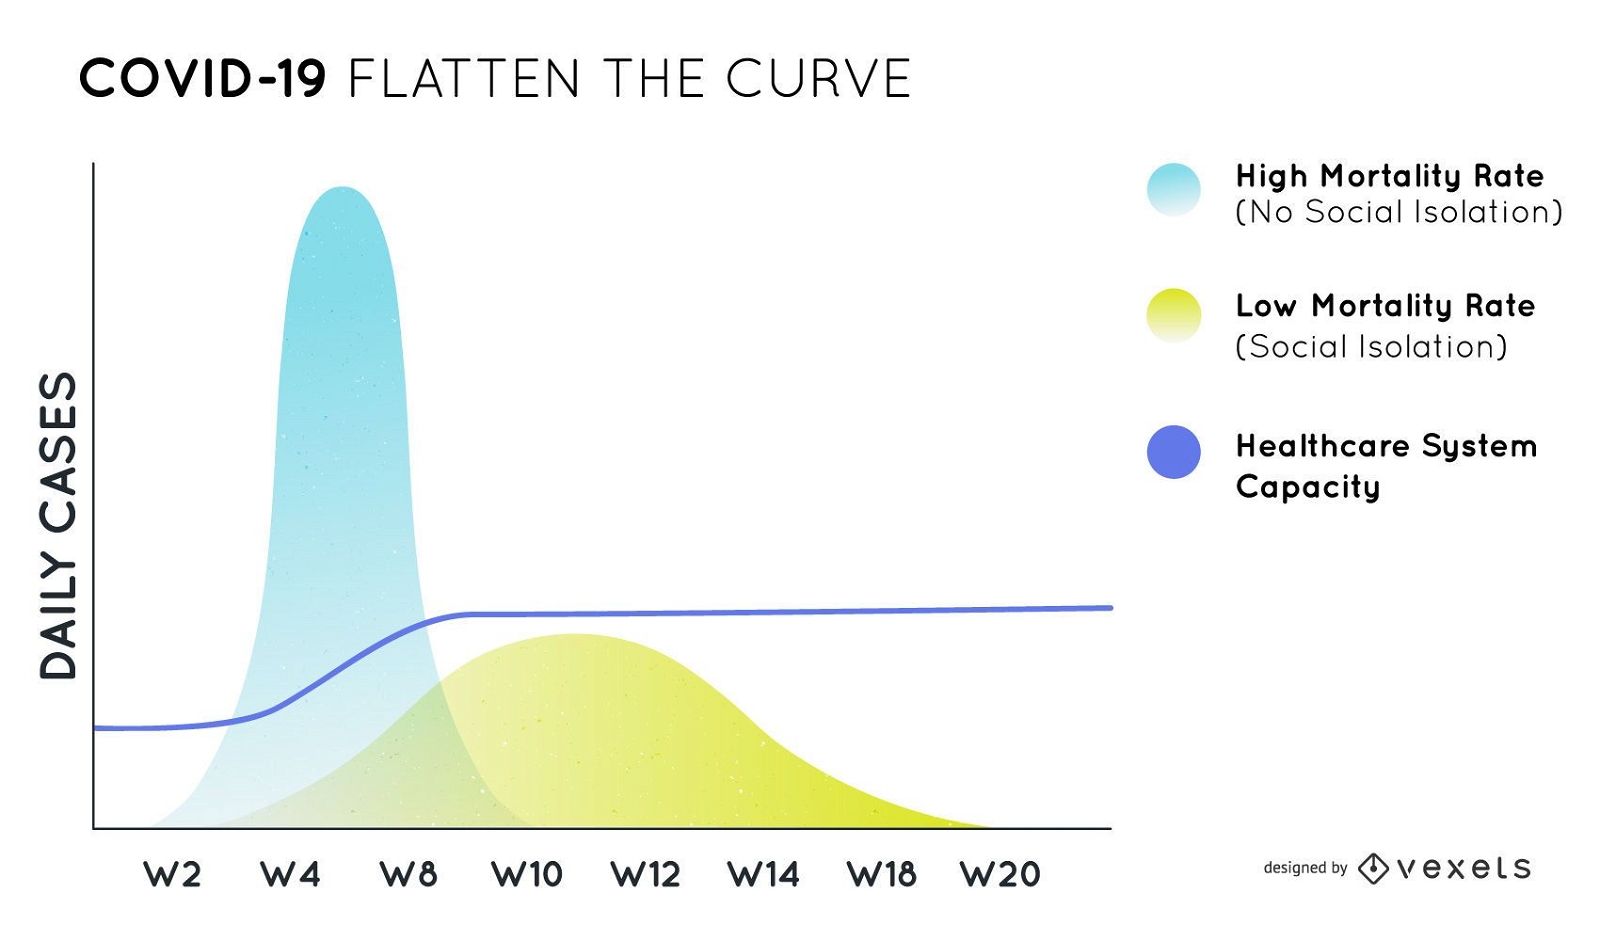
Covid-19 achatar o design do gráfico de curva
Escolha uma pasta
Todos os favoritos
Criar novo
Salvar
Covid-19 achatar o design do gráfico de curva
texto editável
Pronto para imprimir
para Merch
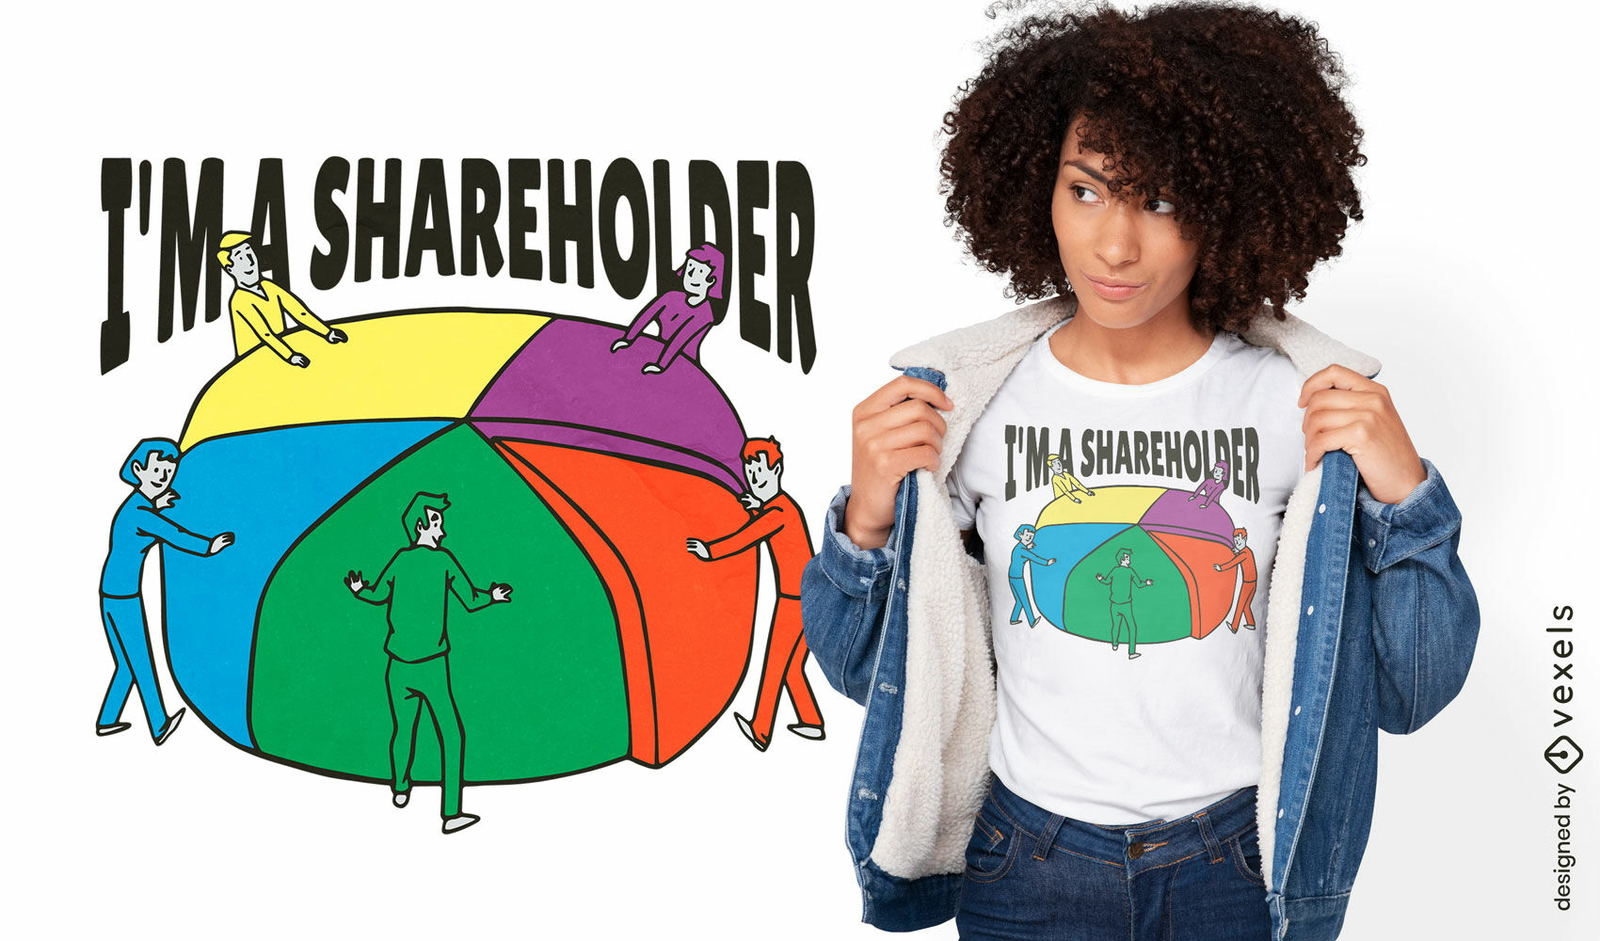
Design de t-shirt de negócios de gráfico de pizza colorido
Escolha uma pasta
Todos os favoritos
Criar novo
Salvar
Design de t-shirt de negócios de gráfico de pizza colorido
Pronto para imprimir
para Merch
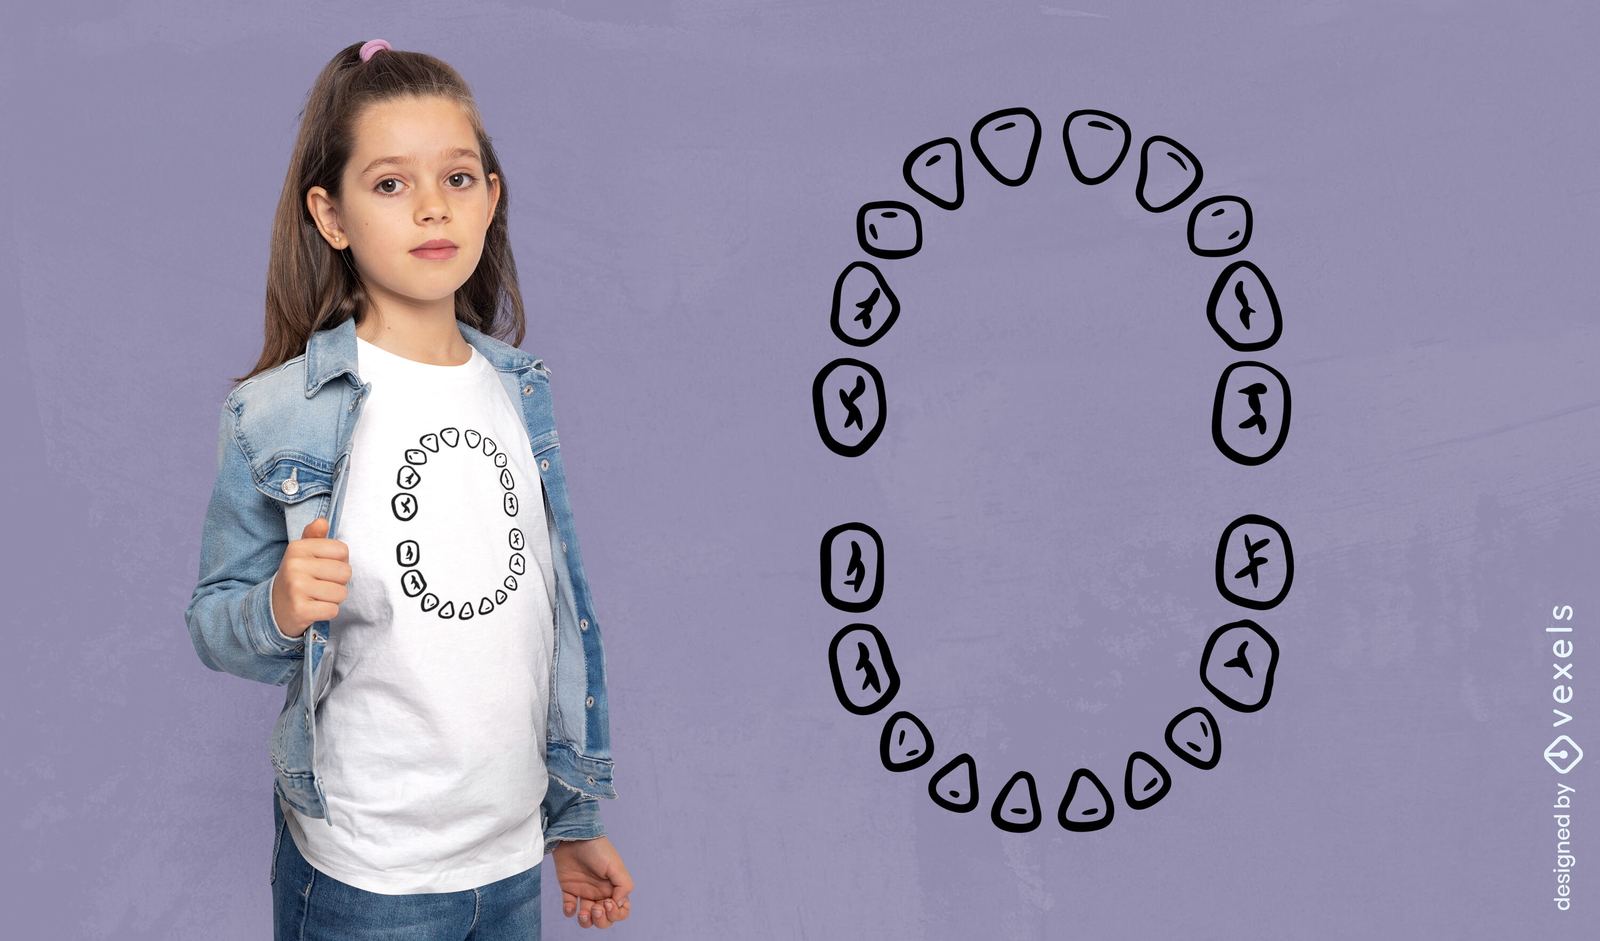
Design de camiseta com gráfico de dentes de bebê
Escolha uma pasta
Todos os favoritos
Criar novo
Salvar
Design de camiseta com gráfico de dentes de bebê
Premium
Crescente gráfico de linha multicolor Desenho PNG
Escolha uma pasta
Todos os favoritos
Criar novo
Salvar
Crescente gráfico de linha multicolor Desenho PNG
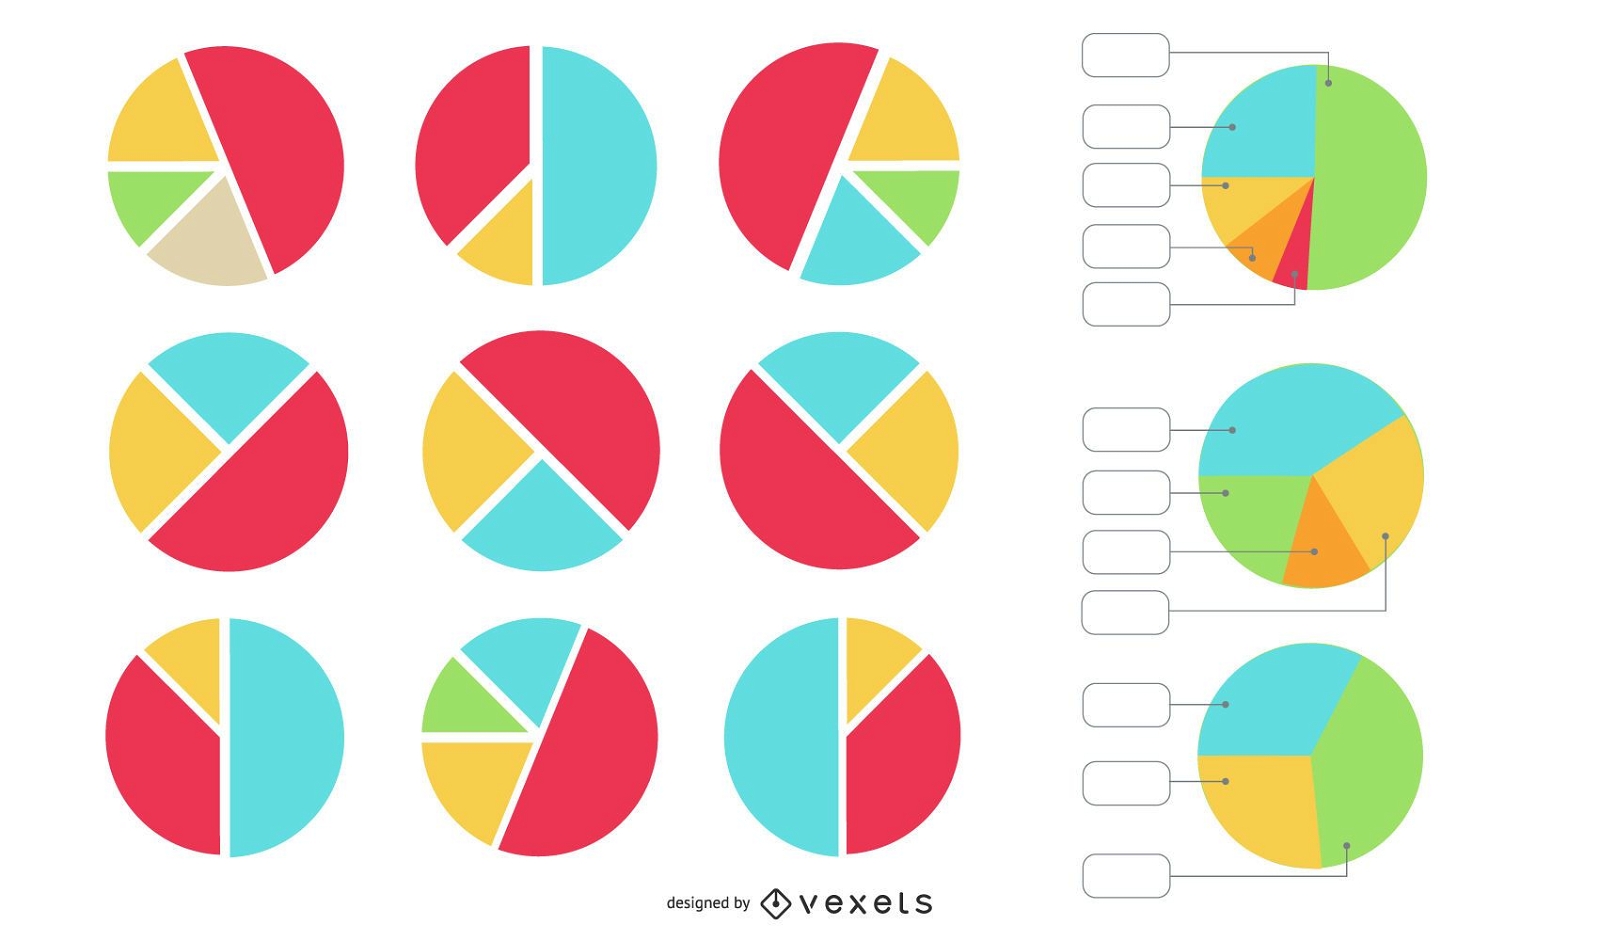
Conjunto de vetores de gráfico de pizza
Escolha uma pasta
Todos os favoritos
Criar novo
Salvar
Conjunto de vetores de gráfico de pizza
Conjunto de gráfico candlestick de finanças
Escolha uma pasta
Todos os favoritos
Criar novo
Salvar
Conjunto de gráfico candlestick de finanças
Premium
Documento de gráfico plano Desenho PNG
Escolha uma pasta
Todos os favoritos
Criar novo
Salvar
Documento de gráfico plano Desenho PNG
Premium
Gráfico de linhas coloridas em crescimento Desenho PNG
Escolha uma pasta
Todos os favoritos
Criar novo
Salvar
Gráfico de linhas coloridas em crescimento Desenho PNG
Gráfico de gráfico de linha crescente Desenho PNG
Escolha uma pasta
Todos os favoritos
Criar novo
Salvar
Gráfico de gráfico de linha crescente Desenho PNG
Premium
Ilustração do gráfico de marketing Desenho PNG
Escolha uma pasta
Todos os favoritos
Criar novo
Salvar
Ilustração do gráfico de marketing Desenho PNG
Premium
Gráfico de setas Desenho PNG
Escolha uma pasta
Todos os favoritos
Criar novo
Salvar
Gráfico de setas Desenho PNG
Premium
Gráfico infográfico de 50 por cento do doodle Desenho PNG
Escolha uma pasta
Todos os favoritos
Criar novo
Salvar
Gráfico infográfico de 50 por cento do doodle Desenho PNG
Premium
Gráfico de coluna Desenho PNG
Escolha uma pasta
Todos os favoritos
Criar novo
Salvar
Gráfico de coluna Desenho PNG
Premium
Gráfico de formas abstratas de fundo Desenho PNG
Escolha uma pasta
Todos os favoritos
Criar novo
Salvar
Gráfico de formas abstratas de fundo Desenho PNG
Premium
Gráfico infográfico de 75 por cento do doodle Desenho PNG
Escolha uma pasta
Todos os favoritos
Criar novo
Salvar
Gráfico infográfico de 75 por cento do doodle Desenho PNG
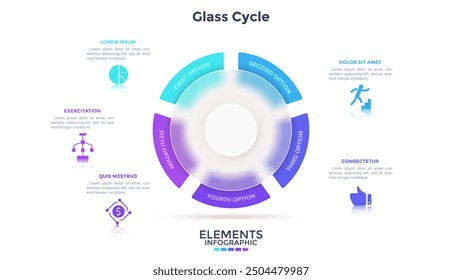
Infográfico de negócios de gráfico circular criativo
Escolha uma pasta
Todos os favoritos
Criar novo
Salvar
Infográfico de negócios de gráfico circular criativo
Premium
Gráfico de colunas com setas Desenho PNG
Escolha uma pasta
Todos os favoritos
Criar novo
Salvar
Gráfico de colunas com setas Desenho PNG
Gráfico de pólo colorido 3D Desenho PNG
Escolha uma pasta
Todos os favoritos
Criar novo
Salvar
Gráfico de pólo colorido 3D Desenho PNG
Premium
Gráfico de doodle de 25 por cento Desenho PNG
Escolha uma pasta
Todos os favoritos
Criar novo
Salvar
Gráfico de doodle de 25 por cento Desenho PNG
Premium
Gráfico de pizza de duas seções Desenho PNG
Escolha uma pasta
Todos os favoritos
Criar novo
Salvar
Gráfico de pizza de duas seções Desenho PNG
Premium
Documento gráfico minimalista Desenho PNG
Escolha uma pasta
Todos os favoritos
Criar novo
Salvar
Documento gráfico minimalista Desenho PNG
Premium
Doodle 3D do gráfico de colunas Desenho PNG
Escolha uma pasta
Todos os favoritos
Criar novo
Salvar
Doodle 3D do gráfico de colunas Desenho PNG
Premium
Gráfico de barras Desenho PNG
Escolha uma pasta
Todos os favoritos
Criar novo
Salvar
Gráfico de barras Desenho PNG
Pacote de gráficos gráficos de informações de estilo clássico
Escolha uma pasta
Todos os favoritos
Criar novo
Salvar
Pacote de gráficos gráficos de informações de estilo clássico
Doodle desenhado à mão em gráfico de pizza Desenho PNG
Escolha uma pasta
Todos os favoritos
Criar novo
Salvar
Doodle desenhado à mão em gráfico de pizza Desenho PNG
Premium
Gráfico de colunas de cilindro Desenho PNG
Escolha uma pasta
Todos os favoritos
Criar novo
Salvar
Gráfico de colunas de cilindro Desenho PNG
Premium
Empresário mostrando gráfico Desenho PNG
Escolha uma pasta
Todos os favoritos
Criar novo
Salvar
Empresário mostrando gráfico Desenho PNG
Gráfico de pizza colorido de quatro partes Desenho PNG
Escolha uma pasta
Todos os favoritos
Criar novo
Salvar
Gráfico de pizza colorido de quatro partes Desenho PNG
Premium
Área de desenho de gráfico Desenho PNG
Escolha uma pasta
Todos os favoritos
Criar novo
Salvar
Área de desenho de gráfico Desenho PNG
Infográfico de gráfico de barras colorido 2d Desenho PNG
Escolha uma pasta
Todos os favoritos
Criar novo
Salvar
Infográfico de gráfico de barras colorido 2d Desenho PNG
Premium
Gráfico de coleta de cubos Desenho PNG
Escolha uma pasta
Todos os favoritos
Criar novo
Salvar
Gráfico de coleta de cubos Desenho PNG
Barra do elemento desenhado à mão do gráfico de barras Desenho PNG
Escolha uma pasta
Todos os favoritos
Criar novo
Salvar
Barra do elemento desenhado à mão do gráfico de barras Desenho PNG
Gráfico de linhas desenhado à mão Desenho PNG
Escolha uma pasta
Todos os favoritos
Criar novo
Salvar
Gráfico de linhas desenhado à mão Desenho PNG
Premium
Doodle de gráfico de pizza de porcentagem Desenho PNG
Escolha uma pasta
Todos os favoritos
Criar novo
Salvar
Doodle de gráfico de pizza de porcentagem Desenho PNG
Premium
Gráfico de pizza liso colorido Desenho PNG
Escolha uma pasta
Todos os favoritos
Criar novo
Salvar
Gráfico de pizza liso colorido Desenho PNG
Premium
Gráfico de pizza com setas Desenho PNG
Escolha uma pasta
Todos os favoritos
Criar novo
Salvar
Gráfico de pizza com setas Desenho PNG
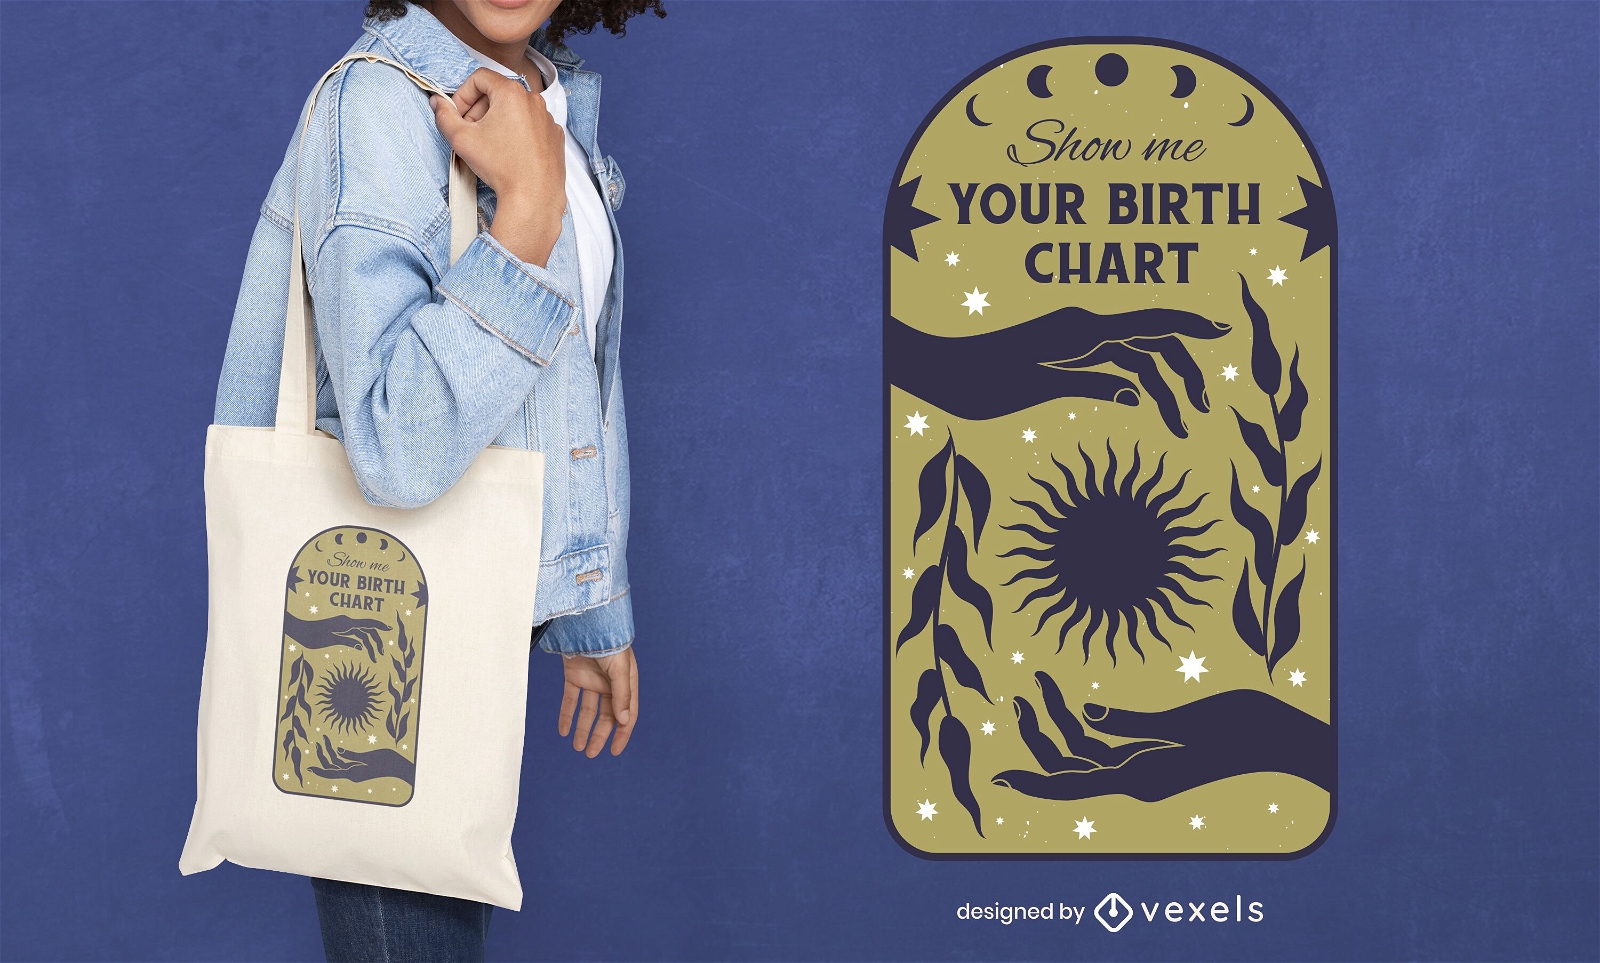
Pronto para imprimir
para Merch
Desenho de bolsa com citação de gráfico de nascimento e zodíaco
Escolha uma pasta
Todos os favoritos
Criar novo
Salvar
Desenho de bolsa com citação de gráfico de nascimento e zodíaco
Premium
Seta do gráfico de pizza Desenho PNG
Escolha uma pasta
Todos os favoritos
Criar novo
Salvar
Seta do gráfico de pizza Desenho PNG
Premium
Gráfico de pizza desenhado à mão Desenho PNG
Escolha uma pasta
Todos os favoritos
Criar novo
Salvar
Gráfico de pizza desenhado à mão Desenho PNG
dia das mães na moda - 6 Desenho PNG
Escolha uma pasta
Todos os favoritos
Criar novo
Salvar
dia das mães na moda - 6 Desenho PNG
Impulsione seu negócio
Com a plataforma gráfica líder de mercado.
Ver planos
Próxima
do 11
prev page
next page