Biblioteca de design
Novos designs Merch
Camisetas
Vectores
Designs de Merch de Tendência
PNGs & SVGs
Mockups
Modelos de T-Shirt PSD
Explorar Desenhos
Designs KDP
Pôsteres
Canecas
Capas para celular
Sacos de compras
Almofadas
Ferramentas de desenho
Merch Designer
Novo!
Mockup Generator
Gerador de Design de AI
Vetorizador
Quote Generator
T-Shirt Maker (Antigo)
Ajuda
Merch Digest
Blog
Centro de Ajuda
Saiba mais sobre o Merch
Feedback
Soluções Corporativas
Empresa
Acesso à API
Estúdio de Design
Design em Lote
Preços
Carregando...
Inscrever-se
Conecte-se
All
chart
Biblioteca de design
Novos designs Merch
Camisetas
Vectores
Designs de Merch de Tendência
PNGs & SVGs
Mockups
Modelos de T-Shirt PSD
Explorar Desenhos
Designs KDP
Pôsteres
Canecas
Capas para celular
Sacos de compras
Almofadas
Ferramentas de desenho
Merch Designer
Novo!
Mockup Generator
Gerador de Design de AI
Vetorizador
Quote Generator
T-Shirt Maker (Antigo)
Ajuda
Merch Digest
Blog
Centro de Ajuda
Saiba mais sobre o Merch
Feedback
Soluções Corporativas
Empresa
Acesso à API
Estúdio de Design
Design em Lote
PLANOS
All
chart
515 Gráficos e Designs de chart para Camisetas e Merch print on demand
Baixar designs de camisetas e para merch, como capas de livro, capas de celular, tote bags e mais de chart
Relacionado:
chartoon
,
grafico
,
graficos
Ordenar por
Mais relevante
Resultados patrocinados da
Ganhe 15% de desconto com o código: VEXELS15
veja mais detalhes
Premium
Gráfico de coluna de duas seções Desenho PNG
Escolha uma pasta
Todos os favoritos
Criar novo
Salvar
Gráfico de coluna de duas seções Desenho PNG
Premium
Gráfico de barras coloridas 6 Desenho PNG
Escolha uma pasta
Todos os favoritos
Criar novo
Salvar
Gráfico de barras coloridas 6 Desenho PNG
Premium
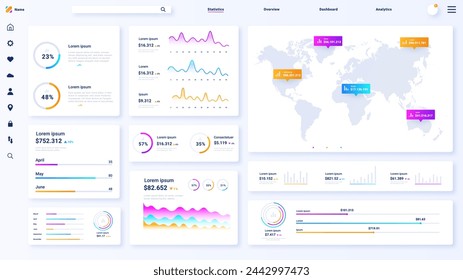
Ícone de gráfico de gráfico de negócios Desenho PNG
Escolha uma pasta
Todos os favoritos
Criar novo
Salvar
Ícone de gráfico de gráfico de negócios Desenho PNG
Premium
Gráfico de setas coloridas Desenho PNG
Escolha uma pasta
Todos os favoritos
Criar novo
Salvar
Gráfico de setas coloridas Desenho PNG
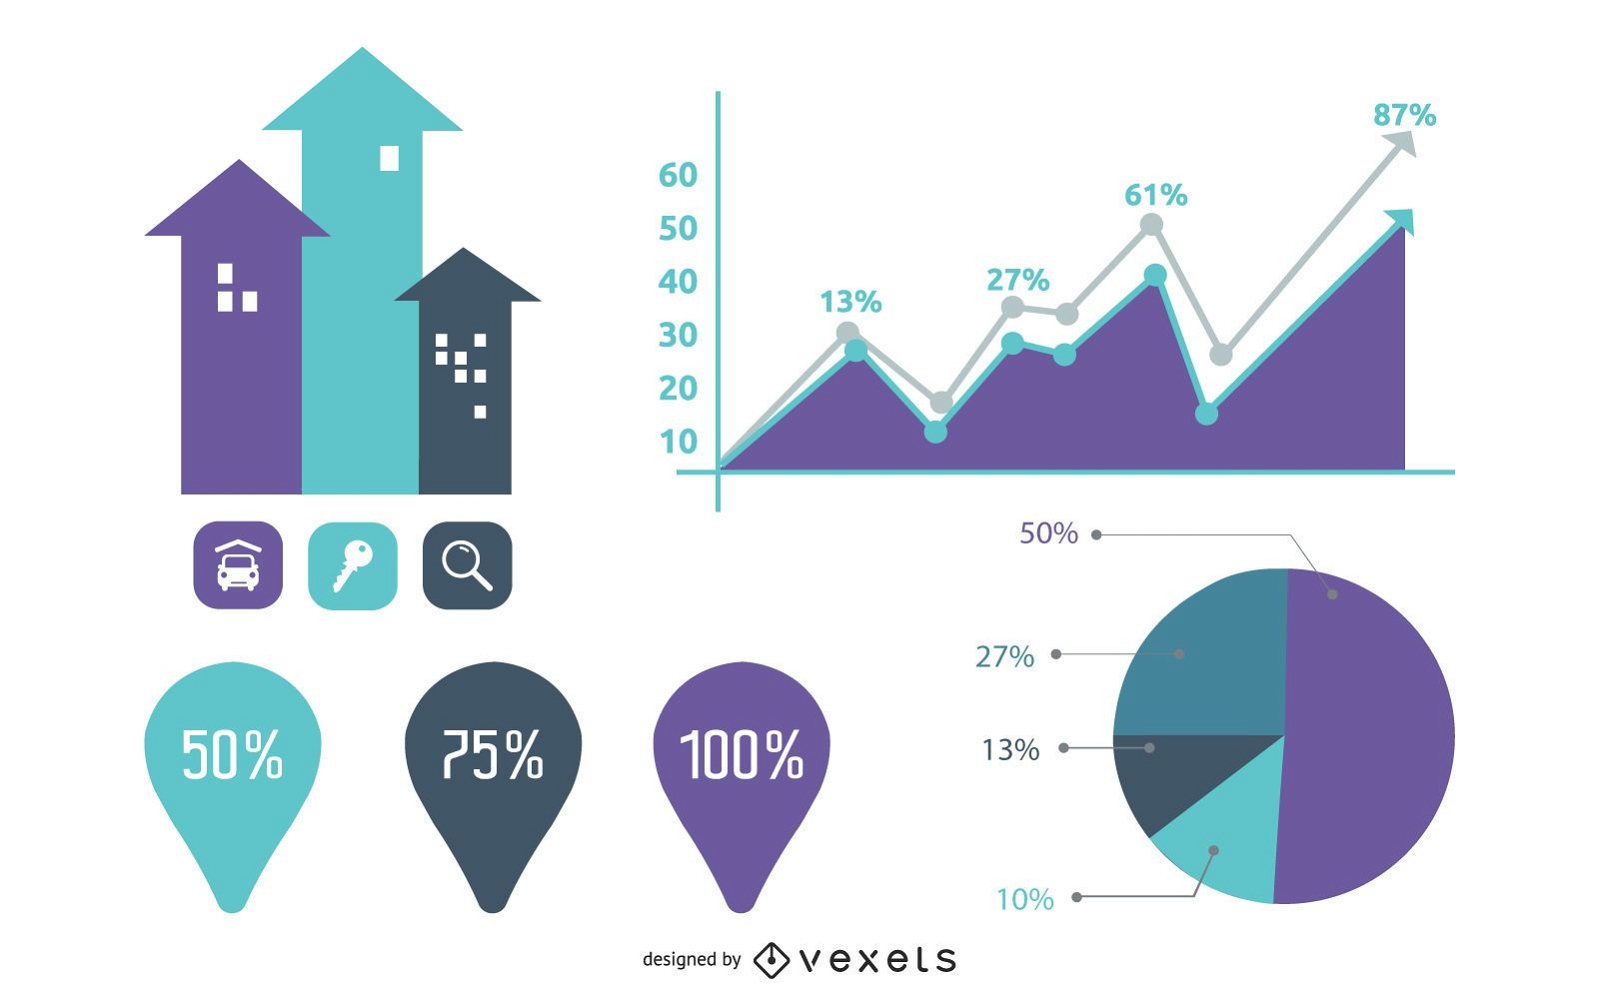
Infográfico de gráfico de imóveis Desenho PNG
Escolha uma pasta
Todos os favoritos
Criar novo
Salvar
Infográfico de gráfico de imóveis Desenho PNG
Premium
Filtro de gráfico circular Desenho PNG
Escolha uma pasta
Todos os favoritos
Criar novo
Salvar
Filtro de gráfico circular Desenho PNG
Premium
Gráfico de pizza azul 1 Desenho PNG
Escolha uma pasta
Todos os favoritos
Criar novo
Salvar
Gráfico de pizza azul 1 Desenho PNG
Gráfico de pizza de natal em 4 partes Desenho PNG
Escolha uma pasta
Todos os favoritos
Criar novo
Salvar
Gráfico de pizza de natal em 4 partes Desenho PNG
Premium
Gráfico de barras de porcentagem de gênero Desenho PNG
Escolha uma pasta
Todos os favoritos
Criar novo
Salvar
Gráfico de barras de porcentagem de gênero Desenho PNG
Premium
Gráfico de círculos vermelhos e azuis Desenho PNG
Escolha uma pasta
Todos os favoritos
Criar novo
Salvar
Gráfico de círculos vermelhos e azuis Desenho PNG
Premium
Gráfico de pizza do Doodle Desenho PNG
Escolha uma pasta
Todos os favoritos
Criar novo
Salvar
Gráfico de pizza do Doodle Desenho PNG
Gráfico redondo infograph.svg Desenho PNG
Escolha uma pasta
Todos os favoritos
Criar novo
Salvar
Gráfico redondo infograph.svg Desenho PNG
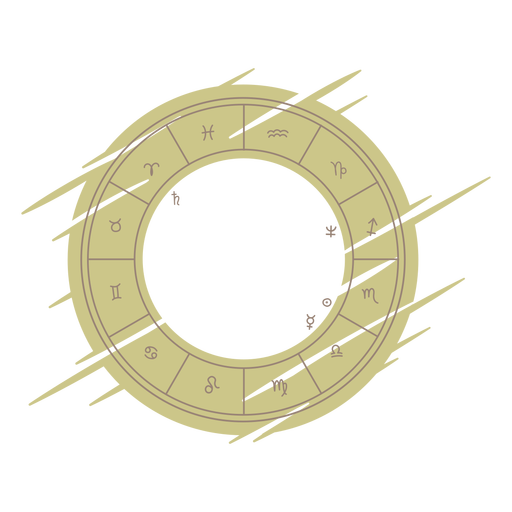
Traço de cor do gráfico de roda de astrologia Desenho PNG
Escolha uma pasta
Todos os favoritos
Criar novo
Salvar
Traço de cor do gráfico de roda de astrologia Desenho PNG
Infográfico de gráfico de barras 4 Desenho PNG
Escolha uma pasta
Todos os favoritos
Criar novo
Salvar
Infográfico de gráfico de barras 4 Desenho PNG
Premium
Gráfico de pizza laranja Desenho PNG
Escolha uma pasta
Todos os favoritos
Criar novo
Salvar
Gráfico de pizza laranja Desenho PNG
Doodle de gráfico de pizza Desenho PNG
Escolha uma pasta
Todos os favoritos
Criar novo
Salvar
Doodle de gráfico de pizza Desenho PNG
Gráfico informativo vintage
Escolha uma pasta
Todos os favoritos
Criar novo
Salvar
Gráfico informativo vintage
Premium
Gráfico de pizza de 3 partes Desenho PNG
Escolha uma pasta
Todos os favoritos
Criar novo
Salvar
Gráfico de pizza de 3 partes Desenho PNG
Premium
Gráfico de pizza roxo Desenho PNG
Escolha uma pasta
Todos os favoritos
Criar novo
Salvar
Gráfico de pizza roxo Desenho PNG
Premium
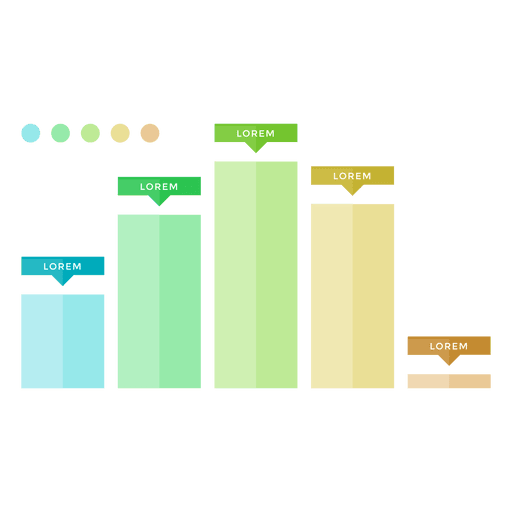
Gráfico de barras decrescente multicolorido plano Desenho PNG
Escolha uma pasta
Todos os favoritos
Criar novo
Salvar
Gráfico de barras decrescente multicolorido plano Desenho PNG
Ícone plano do gráfico de dinheiro Desenho PNG
Escolha uma pasta
Todos os favoritos
Criar novo
Salvar
Ícone plano do gráfico de dinheiro Desenho PNG
Premium
Doodle de gráfico de pizza de proporção Desenho PNG
Escolha uma pasta
Todos os favoritos
Criar novo
Salvar
Doodle de gráfico de pizza de proporção Desenho PNG
Premium
Doodle 3d das colunas do gráfico Desenho PNG
Escolha uma pasta
Todos os favoritos
Criar novo
Salvar
Doodle 3d das colunas do gráfico Desenho PNG
Ícone de traço do gráfico de dinheiro Desenho PNG
Escolha uma pasta
Todos os favoritos
Criar novo
Salvar
Ícone de traço do gráfico de dinheiro Desenho PNG
Premium
Ícone de traço do quadro de gráfico gráfico Desenho PNG
Escolha uma pasta
Todos os favoritos
Criar novo
Salvar
Ícone de traço do quadro de gráfico gráfico Desenho PNG
Premium
Gráfico de losango verde vermelho Desenho PNG
Escolha uma pasta
Todos os favoritos
Criar novo
Salvar
Gráfico de losango verde vermelho Desenho PNG
Premium
Gráfico de círculos laranja azul Desenho PNG
Escolha uma pasta
Todos os favoritos
Criar novo
Salvar
Gráfico de círculos laranja azul Desenho PNG
Elemento desenhado à mão do gráfico de pizza Desenho PNG
Escolha uma pasta
Todos os favoritos
Criar novo
Salvar
Elemento desenhado à mão do gráfico de pizza Desenho PNG
Premium
Gráfico de pizza azul Desenho PNG
Escolha uma pasta
Todos os favoritos
Criar novo
Salvar
Gráfico de pizza azul Desenho PNG
Elemento desenhado à mão do gráfico de barras Desenho PNG
Escolha uma pasta
Todos os favoritos
Criar novo
Salvar
Elemento desenhado à mão do gráfico de barras Desenho PNG
Premium
Traço colorido do gráfico de impressões do site Desenho PNG
Escolha uma pasta
Todos os favoritos
Criar novo
Salvar
Traço colorido do gráfico de impressões do site Desenho PNG
Gráfico de pizza plano Desenho PNG
Escolha uma pasta
Todos os favoritos
Criar novo
Salvar
Gráfico de pizza plano Desenho PNG
Gráfico de pizza laranja cinza azul Desenho PNG
Escolha uma pasta
Todos os favoritos
Criar novo
Salvar
Gráfico de pizza laranja cinza azul Desenho PNG
Premium
Ícone de gráfico de pizza dividido Desenho PNG
Escolha uma pasta
Todos os favoritos
Criar novo
Salvar
Ícone de gráfico de pizza dividido Desenho PNG
Elemento desenhado à mão de gráfico de múltiplas linhas Desenho PNG
Escolha uma pasta
Todos os favoritos
Criar novo
Salvar
Elemento desenhado à mão de gráfico de múltiplas linhas Desenho PNG
Traço gráfico de pizza Desenho PNG
Escolha uma pasta
Todos os favoritos
Criar novo
Salvar
Traço gráfico de pizza Desenho PNG
Premium
Gráfico de barras multicoloridas com borda arredondada Desenho PNG
Escolha uma pasta
Todos os favoritos
Criar novo
Salvar
Gráfico de barras multicoloridas com borda arredondada Desenho PNG
Premium
Gráfico de pizza de três partes Desenho PNG
Escolha uma pasta
Todos os favoritos
Criar novo
Salvar
Gráfico de pizza de três partes Desenho PNG
Gráfico de pizza de natal bauble Desenho PNG
Escolha uma pasta
Todos os favoritos
Criar novo
Salvar
Gráfico de pizza de natal bauble Desenho PNG
Gráfico no ícone do smartphone Desenho PNG
Escolha uma pasta
Todos os favoritos
Criar novo
Salvar
Gráfico no ícone do smartphone Desenho PNG
Premium
Gráfico de barras 3 de duas partes Desenho PNG
Escolha uma pasta
Todos os favoritos
Criar novo
Salvar
Gráfico de barras 3 de duas partes Desenho PNG
Premium
Forma de gráfico Desenho PNG
Escolha uma pasta
Todos os favoritos
Criar novo
Salvar
Forma de gráfico Desenho PNG
Gráfico no ícone do monitor Desenho PNG
Escolha uma pasta
Todos os favoritos
Criar novo
Salvar
Gráfico no ícone do monitor Desenho PNG
Premium
Porcentagem do gráfico de pizza Desenho PNG
Escolha uma pasta
Todos os favoritos
Criar novo
Salvar
Porcentagem do gráfico de pizza Desenho PNG
Premium
Ícone do gráfico de pizza Desenho PNG
Escolha uma pasta
Todos os favoritos
Criar novo
Salvar
Ícone do gráfico de pizza Desenho PNG
Premium
Ícone de gráfico de pizza plana Desenho PNG
Escolha uma pasta
Todos os favoritos
Criar novo
Salvar
Ícone de gráfico de pizza plana Desenho PNG
Linha de gráfico de pizza roxa icon.svg Desenho PNG
Escolha uma pasta
Todos os favoritos
Criar novo
Salvar
Linha de gráfico de pizza roxa icon.svg Desenho PNG
Premium
Gráfico de círculos laranja verde Desenho PNG
Escolha uma pasta
Todos os favoritos
Criar novo
Salvar
Gráfico de círculos laranja verde Desenho PNG
Premium
Formato do gráfico de pizza do quarto Desenho PNG
Escolha uma pasta
Todos os favoritos
Criar novo
Salvar
Formato do gráfico de pizza do quarto Desenho PNG
Premium
Gráfico de pizza dourado Desenho PNG
Escolha uma pasta
Todos os favoritos
Criar novo
Salvar
Gráfico de pizza dourado Desenho PNG
Impulsione seu negócio
Com a plataforma gráfica líder de mercado.
Ver planos
Próxima
do 11
prev page
next page