Biblioteca de design
Novos designs Merch
Camisetas
Vectores
Designs de Merch de Tendência
PNGs & SVGs
Mockups
Modelos de T-Shirt PSD
Explorar Desenhos
Designs KDP
Pôsteres
Canecas
Capas para celular
Sacos de compras
Almofadas
Ferramentas de desenho
Merch Designer
Novo!
Mockup Generator
Gerador de Design de AI
Vetorizador
Quote Generator
T-Shirt Maker (Antigo)
Ajuda
Merch Digest
Blog
Centro de Ajuda
Saiba mais sobre o Merch
Feedback
Soluções Corporativas
Empresa
Acesso à API
Estúdio de Design
Design em Lote
Preços
Carregando...
Inscrever-se
Conecte-se
All
chart
Biblioteca de design
Novos designs Merch
Camisetas
Vectores
Designs de Merch de Tendência
PNGs & SVGs
Mockups
Modelos de T-Shirt PSD
Explorar Desenhos
Designs KDP
Pôsteres
Canecas
Capas para celular
Sacos de compras
Almofadas
Ferramentas de desenho
Merch Designer
Novo!
Mockup Generator
Gerador de Design de AI
Vetorizador
Quote Generator
T-Shirt Maker (Antigo)
Ajuda
Merch Digest
Blog
Centro de Ajuda
Saiba mais sobre o Merch
Feedback
Soluções Corporativas
Empresa
Acesso à API
Estúdio de Design
Design em Lote
PLANOS
All
chart
515 Gráficos e Designs de chart para Camisetas e Merch print on demand
Baixar designs de camisetas e para merch, como capas de livro, capas de celular, tote bags e mais de chart
Relacionado:
chartoon
,
grafico
,
graficos
Ordenar por
Mais relevante
Resultados patrocinados da
Ganhe 15% de desconto com o código: VEXELS15
veja mais detalhes
Diminuindo a seta de direção da seta do gráfico Desenho PNG
Escolha uma pasta
Todos os favoritos
Criar novo
Salvar
Diminuindo a seta de direção da seta do gráfico Desenho PNG
Premium
Infográfico de adesivo elíptico gráfico Desenho PNG
Escolha uma pasta
Todos os favoritos
Criar novo
Salvar
Infográfico de adesivo elíptico gráfico Desenho PNG
Premium
Gráfico de setas de barras crescentes Desenho PNG
Escolha uma pasta
Todos os favoritos
Criar novo
Salvar
Gráfico de setas de barras crescentes Desenho PNG
Premium
Gráfico laranja verde azul Desenho PNG
Escolha uma pasta
Todos os favoritos
Criar novo
Salvar
Gráfico laranja verde azul Desenho PNG
Conjunto de elementos de infográfico plano mínimo
Escolha uma pasta
Todos os favoritos
Criar novo
Salvar
Conjunto de elementos de infográfico plano mínimo
Não há mais falhas financeiras
Escolha uma pasta
Todos os favoritos
Criar novo
Salvar
Não há mais falhas financeiras
Premium
Conjunto de números do alfabeto de zumbis para Halloween
Escolha uma pasta
Todos os favoritos
Criar novo
Salvar
Conjunto de números do alfabeto de zumbis para Halloween
Pacote de elementos de infográfico colorido em estilo simples
Escolha uma pasta
Todos os favoritos
Criar novo
Salvar
Pacote de elementos de infográfico colorido em estilo simples
Premium
O design do cartão de tarô hierofante Desenho PNG
Escolha uma pasta
Todos os favoritos
Criar novo
Salvar
O design do cartão de tarô hierofante Desenho PNG
Premium
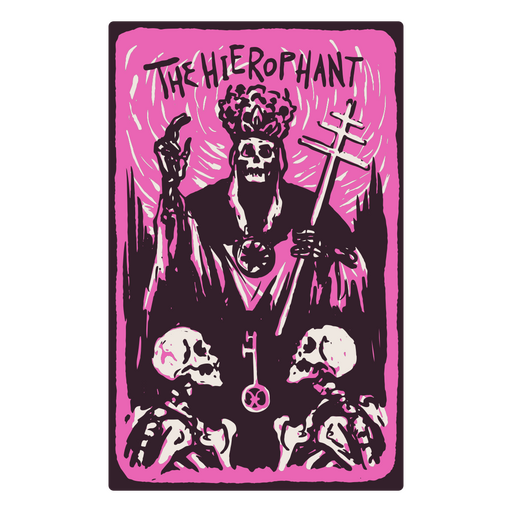
A carta do Hierofante em um tarô com tema de esqueleto Desenho PNG
Escolha uma pasta
Todos os favoritos
Criar novo
Salvar
A carta do Hierofante em um tarô com tema de esqueleto Desenho PNG
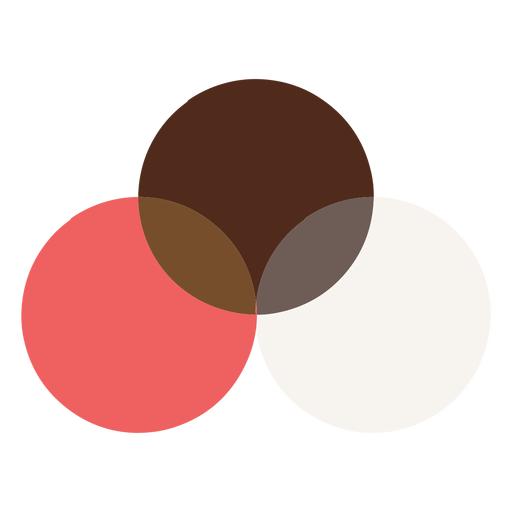
Elemento desenhado à mão do diagrama de Venn Desenho PNG
Escolha uma pasta
Todos os favoritos
Criar novo
Salvar
Elemento desenhado à mão do diagrama de Venn Desenho PNG
Premium
Piechart brilhante com caixas Desenho PNG
Escolha uma pasta
Todos os favoritos
Criar novo
Salvar
Piechart brilhante com caixas Desenho PNG
Premium
Piechart colorido meio cinzento Desenho PNG
Escolha uma pasta
Todos os favoritos
Criar novo
Salvar
Piechart colorido meio cinzento Desenho PNG
Ícone desenhado à mão da pirâmide Desenho PNG
Escolha uma pasta
Todos os favoritos
Criar novo
Salvar
Ícone desenhado à mão da pirâmide Desenho PNG
texto editável
Premium
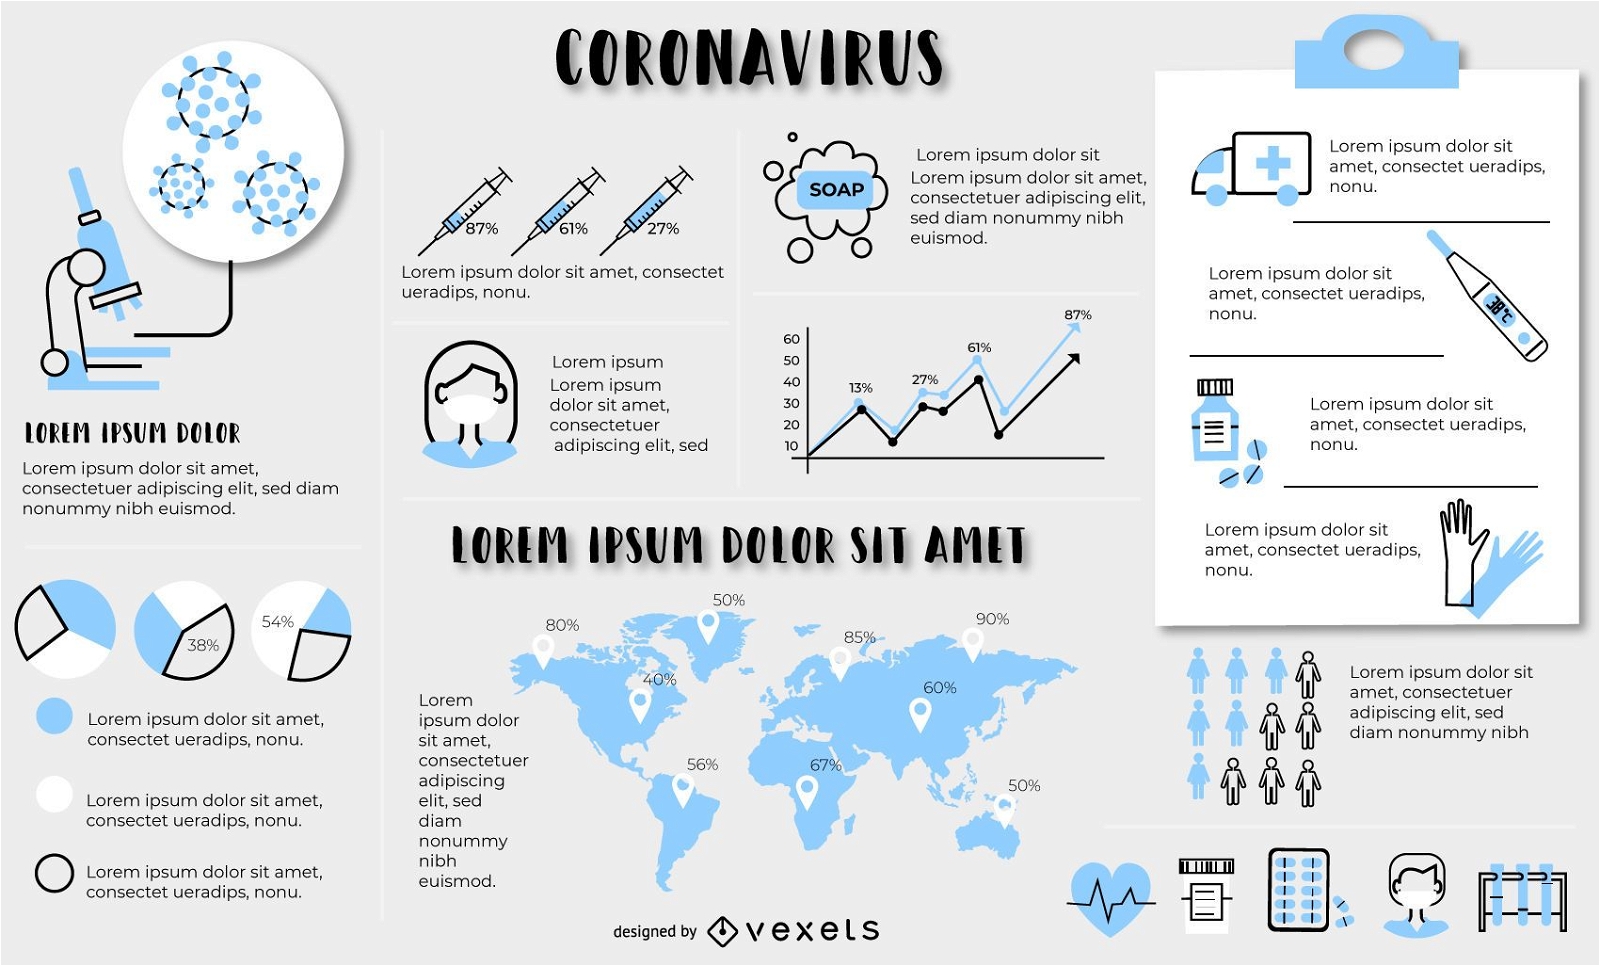
Modelo de elementos de infográfico de Coronavirus
Escolha uma pasta
Todos os favoritos
Criar novo
Salvar
Modelo de elementos de infográfico de Coronavirus
Premium
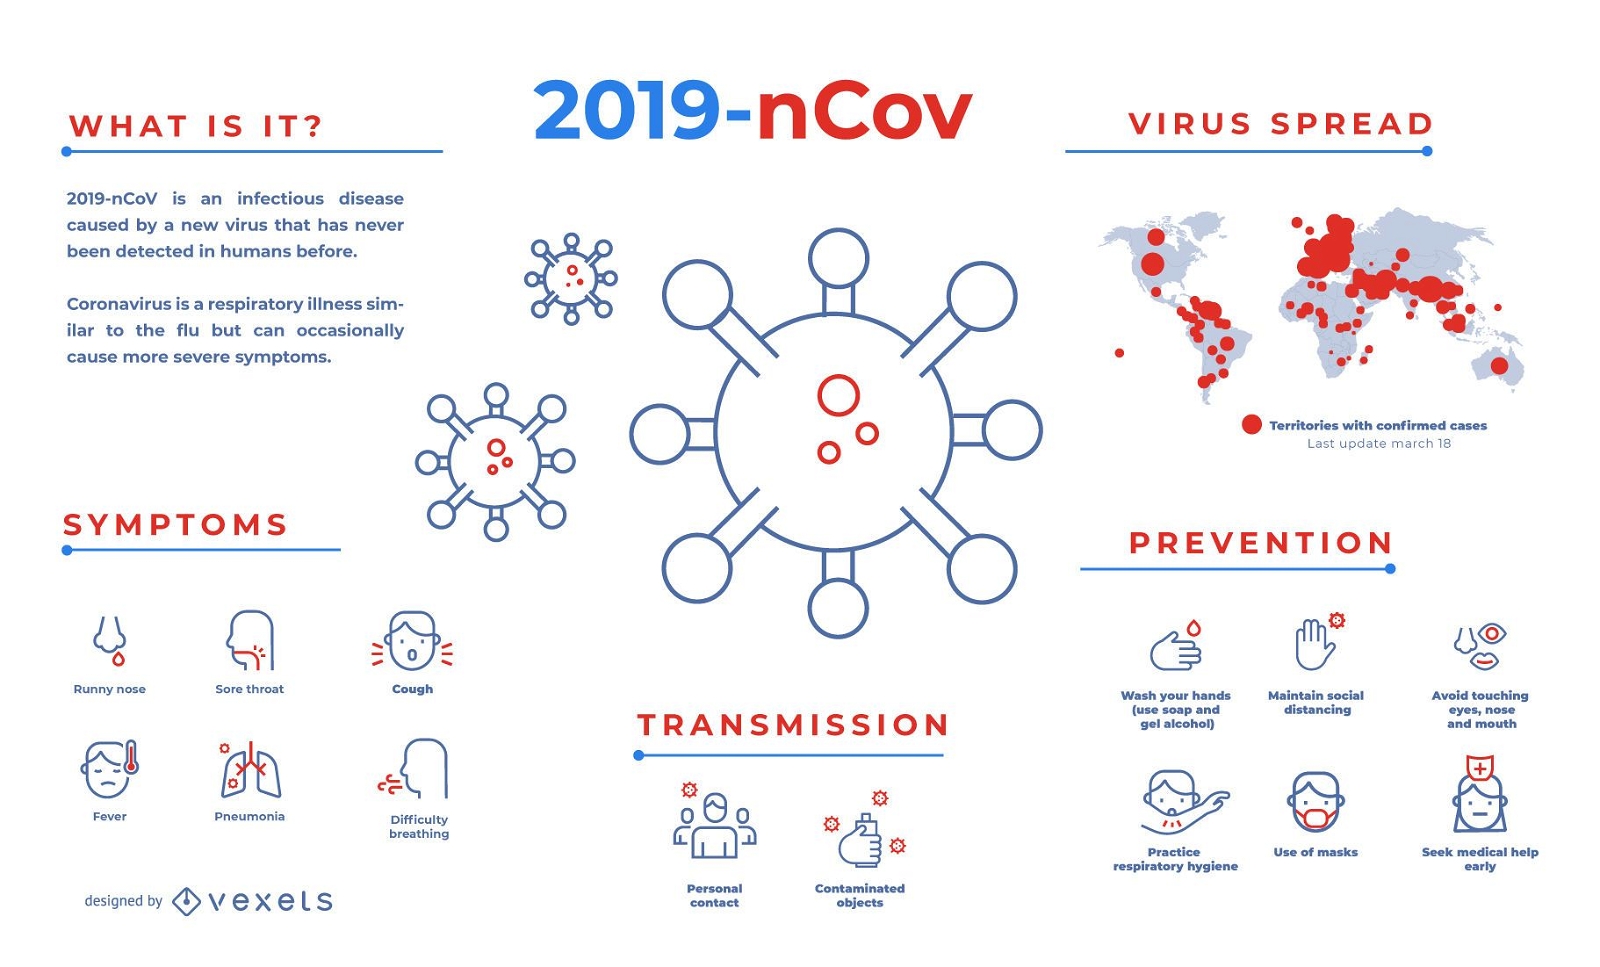
Modelo de infográfico Covid-19
Escolha uma pasta
Todos os favoritos
Criar novo
Salvar
Modelo de infográfico Covid-19
texto editável
Premium
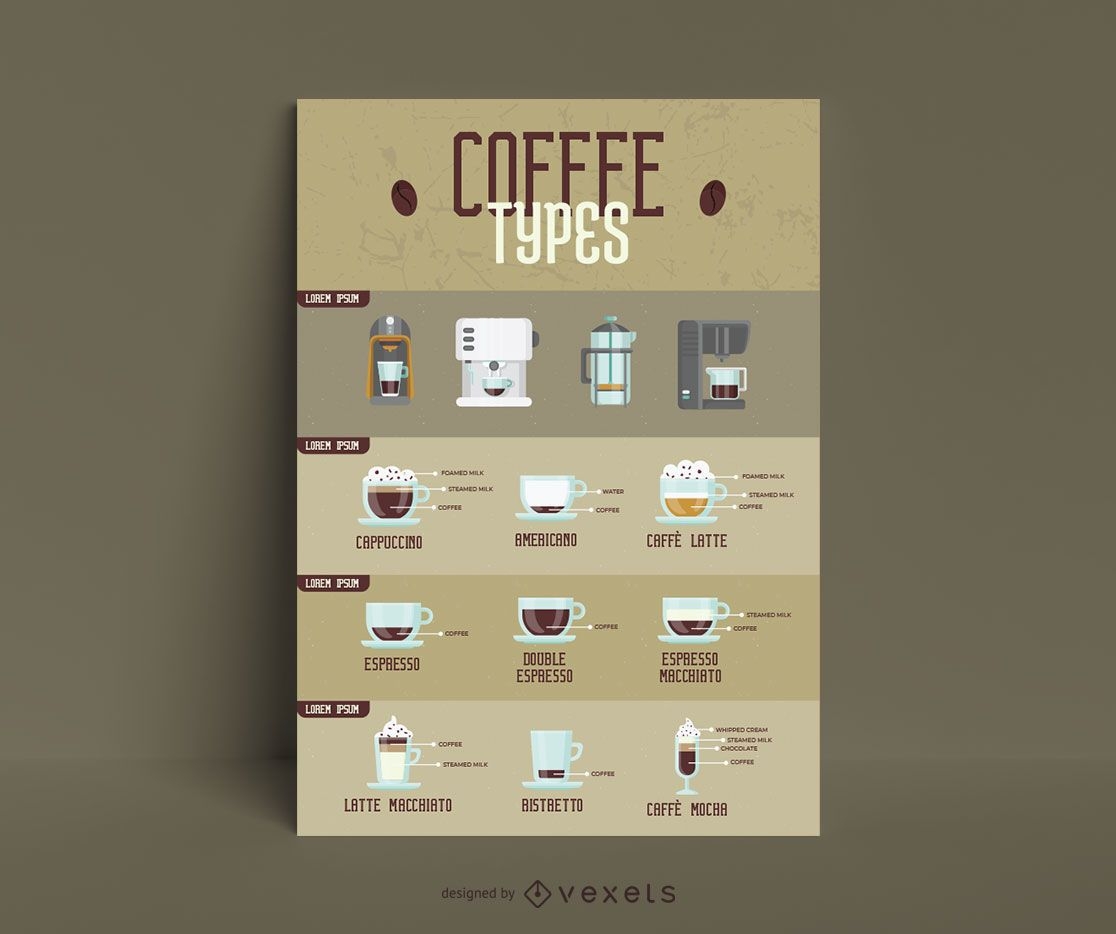
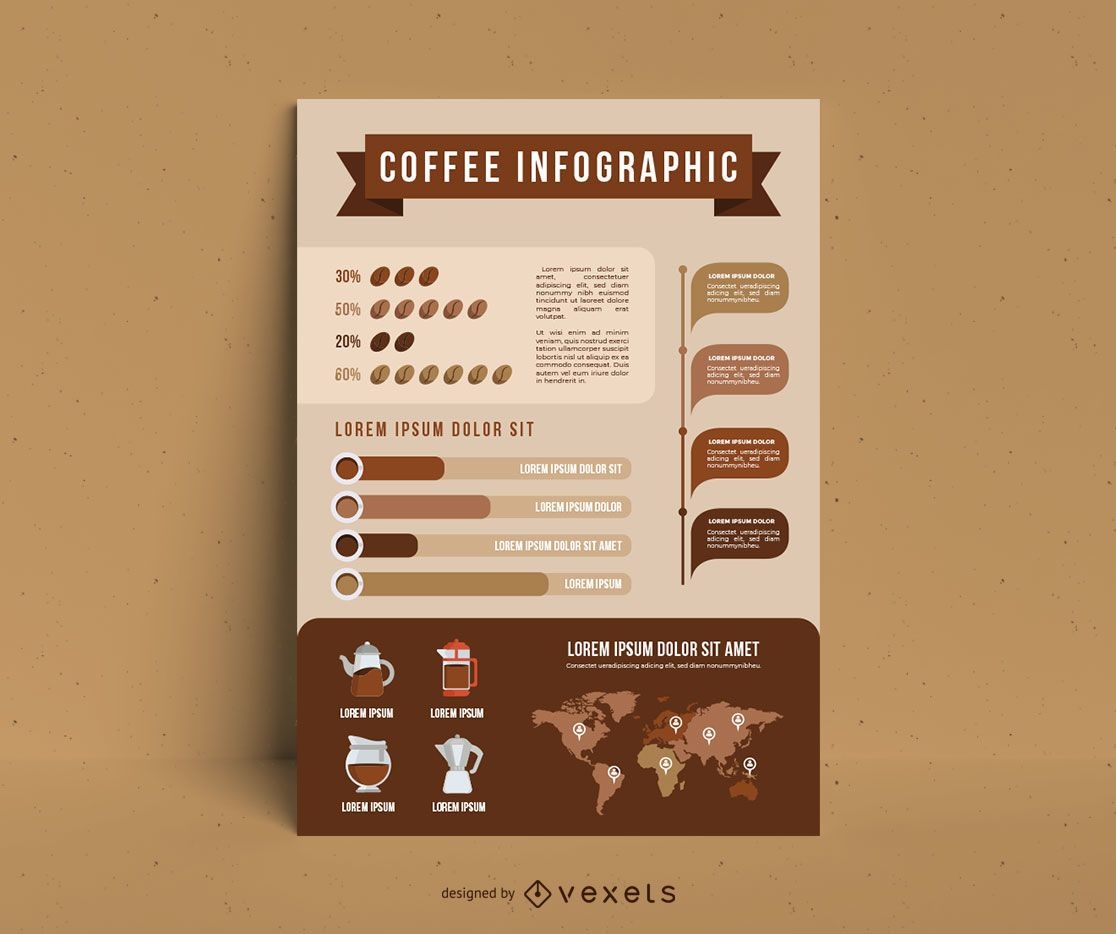
Modelo de infográfico de tipos de café
Escolha uma pasta
Todos os favoritos
Criar novo
Salvar
Modelo de infográfico de tipos de café
Empresário na frente do ícone de torta Desenho PNG
Escolha uma pasta
Todos os favoritos
Criar novo
Salvar
Empresário na frente do ícone de torta Desenho PNG
Ícone de gráfico de crescimento de empresário em pé Desenho PNG
Escolha uma pasta
Todos os favoritos
Criar novo
Salvar
Ícone de gráfico de crescimento de empresário em pé Desenho PNG
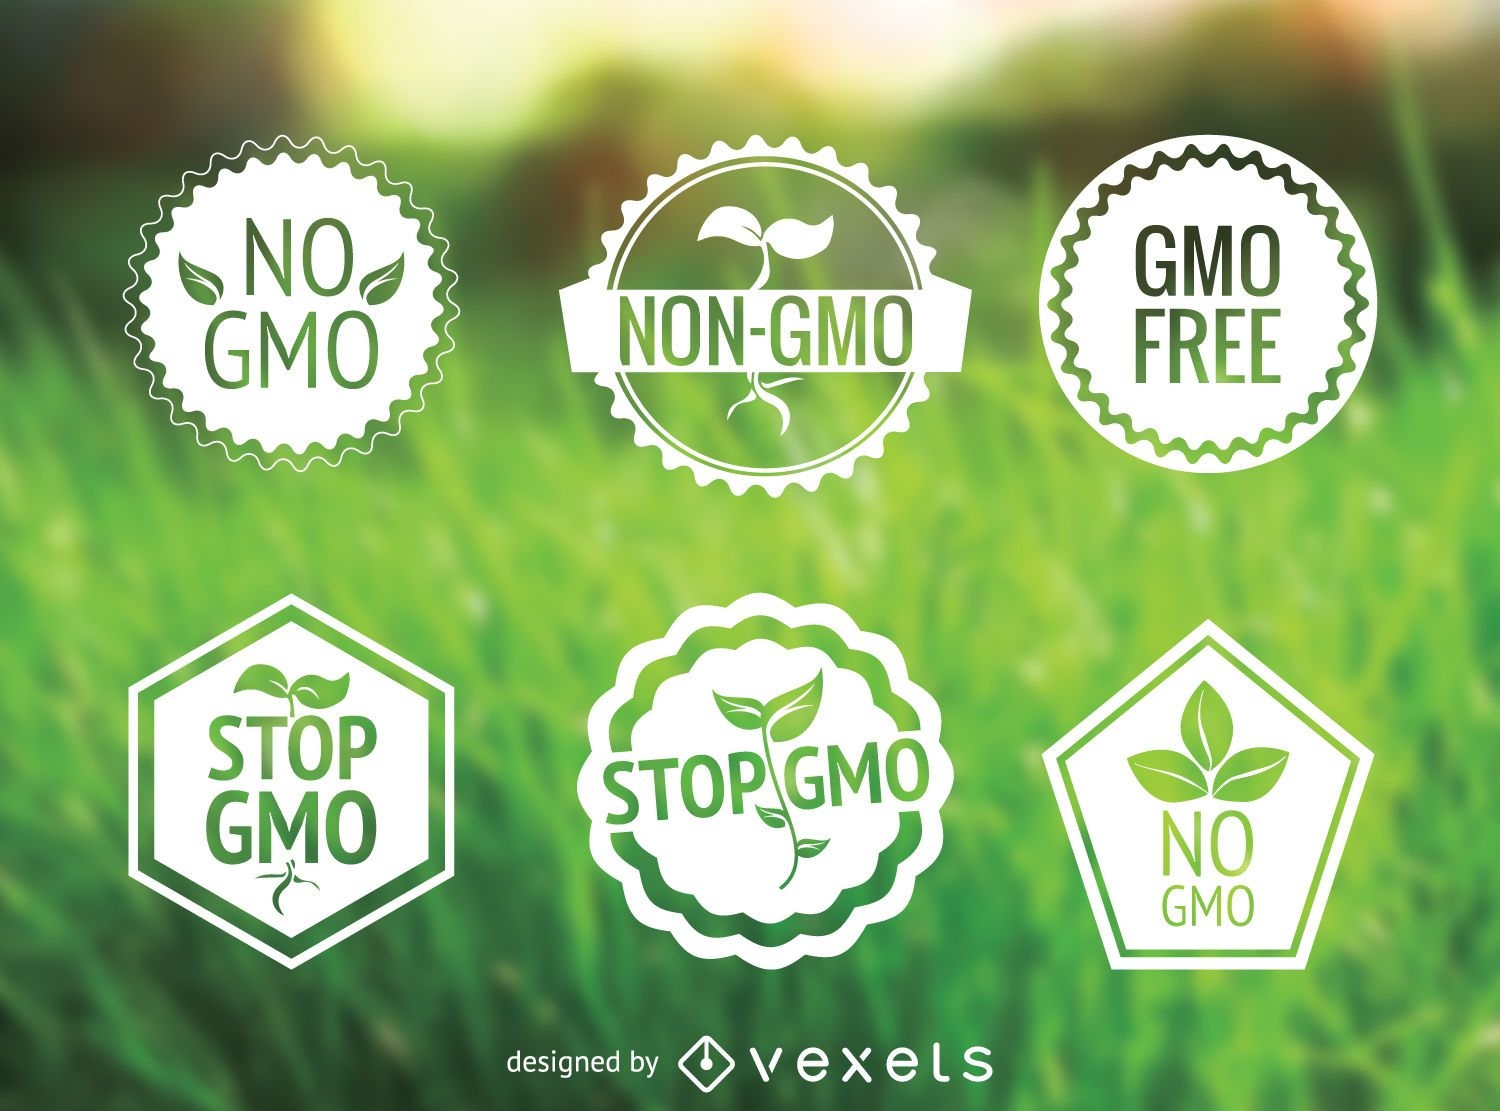
Nenhum rótulo OGM definido
Escolha uma pasta
Todos os favoritos
Criar novo
Salvar
Nenhum rótulo OGM definido
Premium
Ícone de círculo gráfico de tv Desenho PNG
Escolha uma pasta
Todos os favoritos
Criar novo
Salvar
Ícone de círculo gráfico de tv Desenho PNG
Fundo Colorido Brilhante
Escolha uma pasta
Todos os favoritos
Criar novo
Salvar
Fundo Colorido Brilhante
Premium
signo de áries no horóscopo Desenho PNG
Escolha uma pasta
Todos os favoritos
Criar novo
Salvar
signo de áries no horóscopo Desenho PNG
Premium
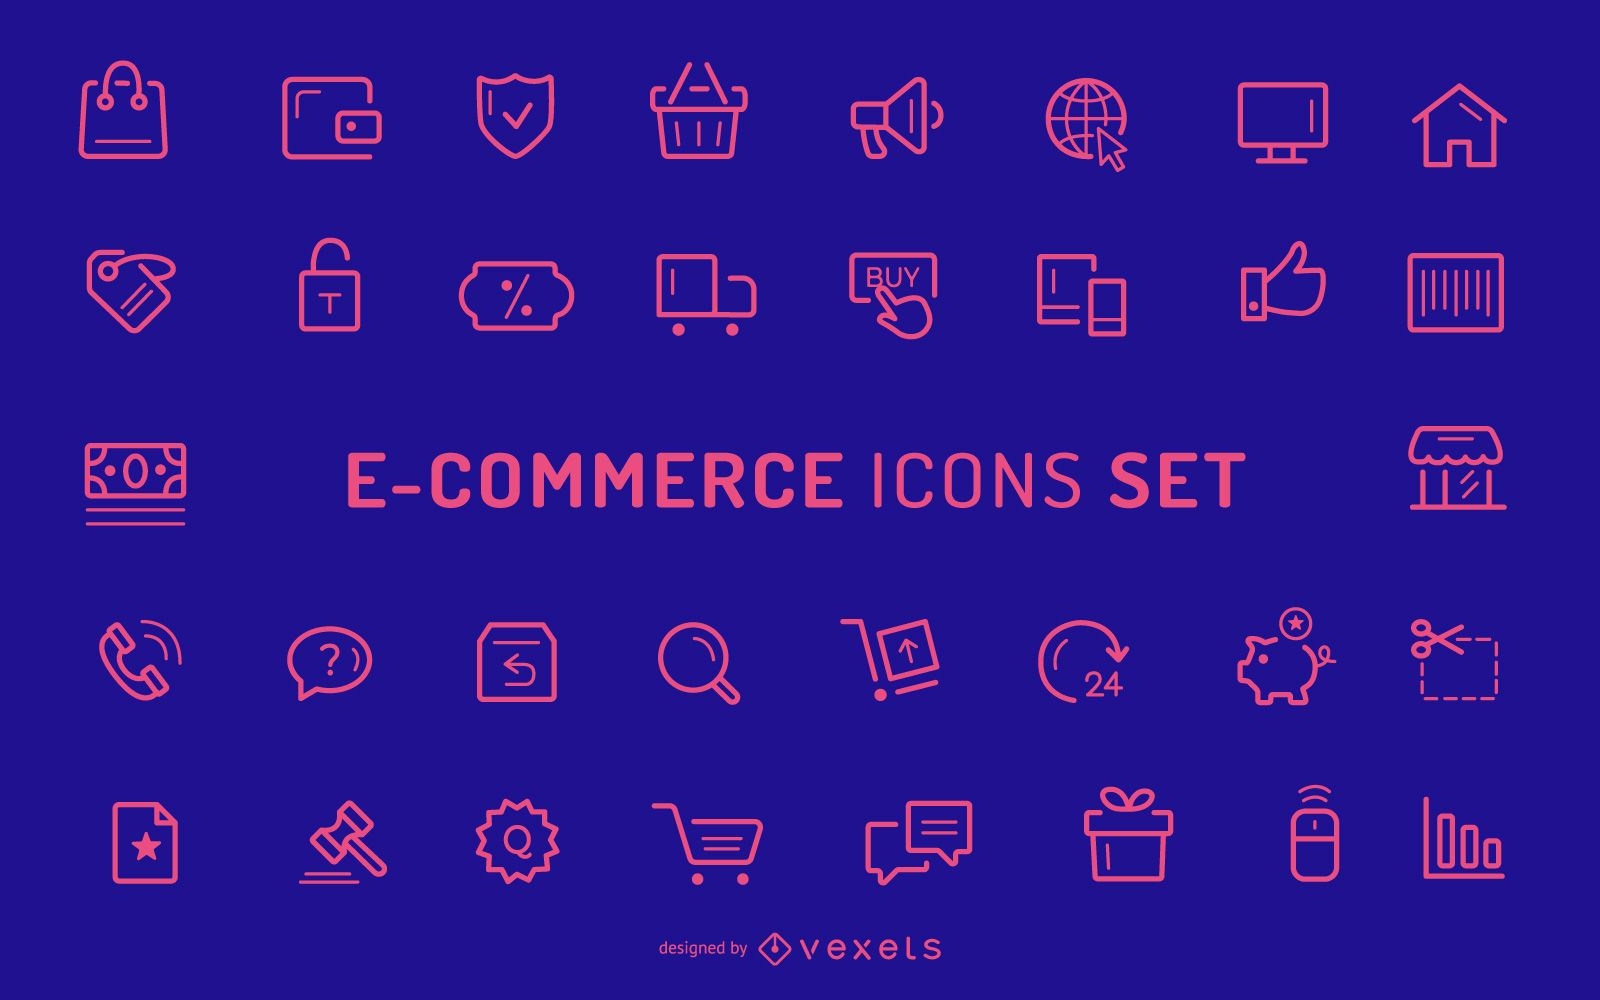
Coleção de ícones de traços de comércio eletrônico
Escolha uma pasta
Todos os favoritos
Criar novo
Salvar
Coleção de ícones de traços de comércio eletrônico
Premium
Conjunto de cartas de bruxa de Halloween
Escolha uma pasta
Todos os favoritos
Criar novo
Salvar
Conjunto de cartas de bruxa de Halloween
Premium
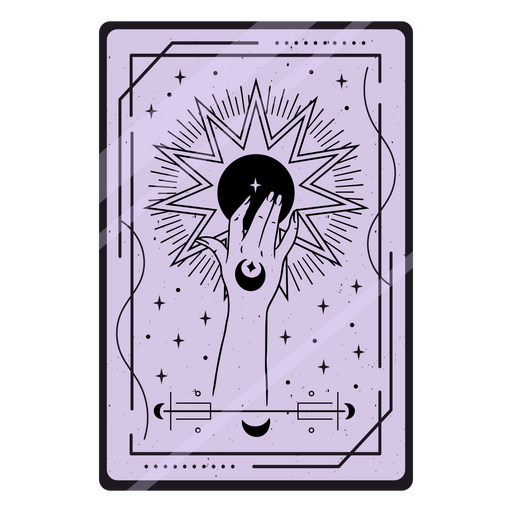
Carta de tarô com mãos cartomantes Desenho PNG
Escolha uma pasta
Todos os favoritos
Criar novo
Salvar
Carta de tarô com mãos cartomantes Desenho PNG
Premium
orientação do tarô Desenho PNG
Escolha uma pasta
Todos os favoritos
Criar novo
Salvar
orientação do tarô Desenho PNG
Premium
Gráfico de barras colorido de dois lados Desenho PNG
Escolha uma pasta
Todos os favoritos
Criar novo
Salvar
Gráfico de barras colorido de dois lados Desenho PNG
Conjunto de infográfico de modelo de estilo simples
Escolha uma pasta
Todos os favoritos
Criar novo
Salvar
Conjunto de infográfico de modelo de estilo simples
Premium
Cartão de adivinhação roxo Desenho PNG
Escolha uma pasta
Todos os favoritos
Criar novo
Salvar
Cartão de adivinhação roxo Desenho PNG
Modelo editável
Premium
Template abstrato infográfico
Escolha uma pasta
Todos os favoritos
Criar novo
Salvar
Template abstrato infográfico
Premium
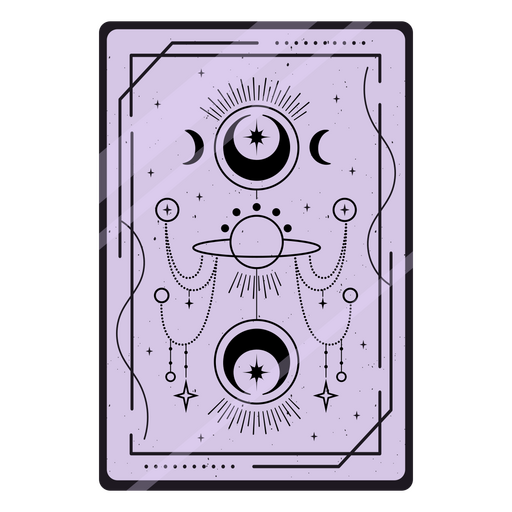
imagem do tarô da lua Desenho PNG
Escolha uma pasta
Todos os favoritos
Criar novo
Salvar
imagem do tarô da lua Desenho PNG
Premium
Projeto da feiticeira da lua Desenho PNG
Escolha uma pasta
Todos os favoritos
Criar novo
Salvar
Projeto da feiticeira da lua Desenho PNG
Premium
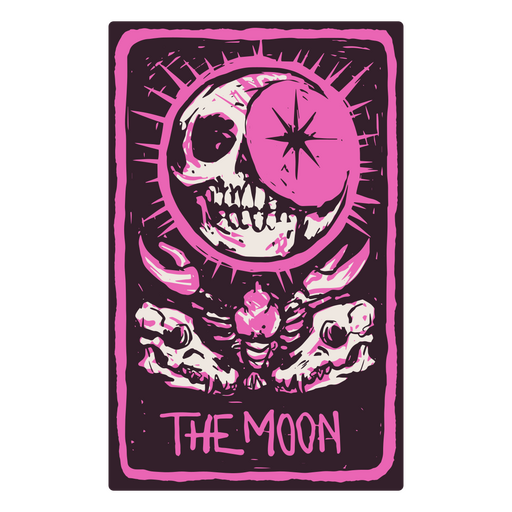
A carta da Lua em um tarô com tema de esqueleto Desenho PNG
Escolha uma pasta
Todos os favoritos
Criar novo
Salvar
A carta da Lua em um tarô com tema de esqueleto Desenho PNG
texto editável
Premium
Infográfico de café
Escolha uma pasta
Todos os favoritos
Criar novo
Salvar
Infográfico de café
Premium
Libra no horóscopo Desenho PNG
Escolha uma pasta
Todos os favoritos
Criar novo
Salvar
Libra no horóscopo Desenho PNG
Premium
Signo de Virgem no horóscopo Desenho PNG
Escolha uma pasta
Todos os favoritos
Criar novo
Salvar
Signo de Virgem no horóscopo Desenho PNG
Premium
Signo de câncer no horóscopo Desenho PNG
Escolha uma pasta
Todos os favoritos
Criar novo
Salvar
Signo de câncer no horóscopo Desenho PNG
Premium
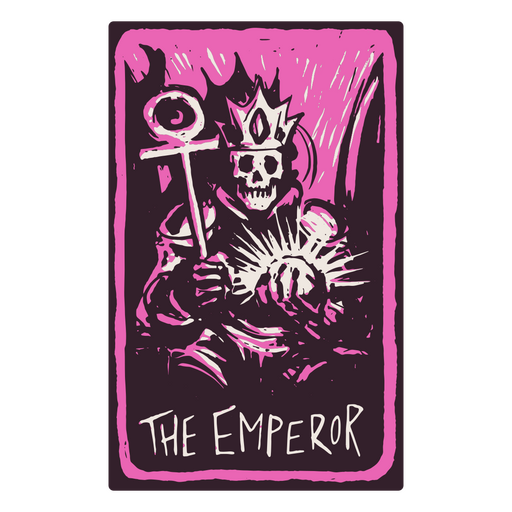
A carta do Imperador em um tarô com tema de esqueleto Desenho PNG
Escolha uma pasta
Todos os favoritos
Criar novo
Salvar
A carta do Imperador em um tarô com tema de esqueleto Desenho PNG
Traço de barras do gráfico crescente Desenho PNG
Escolha uma pasta
Todos os favoritos
Criar novo
Salvar
Traço de barras do gráfico crescente Desenho PNG
Premium
Ícone quadrado do gráfico de barras Desenho PNG
Escolha uma pasta
Todos os favoritos
Criar novo
Salvar
Ícone quadrado do gráfico de barras Desenho PNG
Premium
Adesivo de infográfico quadrado gráfico Desenho PNG
Escolha uma pasta
Todos os favoritos
Criar novo
Salvar
Adesivo de infográfico quadrado gráfico Desenho PNG
Premium
Gráfico de barras multicolorido com ícones Desenho PNG
Escolha uma pasta
Todos os favoritos
Criar novo
Salvar
Gráfico de barras multicolorido com ícones Desenho PNG
Design plano sinal de parada OGM
Escolha uma pasta
Todos os favoritos
Criar novo
Salvar
Design plano sinal de parada OGM
Ícones de vetor
Escolha uma pasta
Todos os favoritos
Criar novo
Salvar
Ícones de vetor
Premium
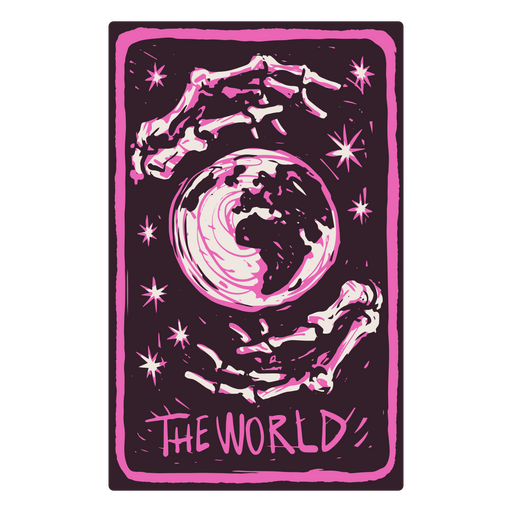
A carta do mundo em um tarô com tema de esqueleto Desenho PNG
Escolha uma pasta
Todos os favoritos
Criar novo
Salvar
A carta do mundo em um tarô com tema de esqueleto Desenho PNG
Doodle de apresentação de gráfico Desenho PNG
Escolha uma pasta
Todos os favoritos
Criar novo
Salvar
Doodle de apresentação de gráfico Desenho PNG
Gráfico de peças coloridas de 4 partes Desenho PNG
Escolha uma pasta
Todos os favoritos
Criar novo
Salvar
Gráfico de peças coloridas de 4 partes Desenho PNG
Ícone de gráfico de barras colorido Desenho PNG
Escolha uma pasta
Todos os favoritos
Criar novo
Salvar
Ícone de gráfico de barras colorido Desenho PNG
Premium
Touro no horóscopo Desenho PNG
Escolha uma pasta
Todos os favoritos
Criar novo
Salvar
Touro no horóscopo Desenho PNG
Impulsione seu negócio
Com a plataforma gráfica líder de mercado.
Ver planos
Próxima
do 11
prev page
next page