Biblioteca de design
Novos designs Merch
Camisetas
Vectores
Designs de Merch de Tendência
PNGs & SVGs
Mockups
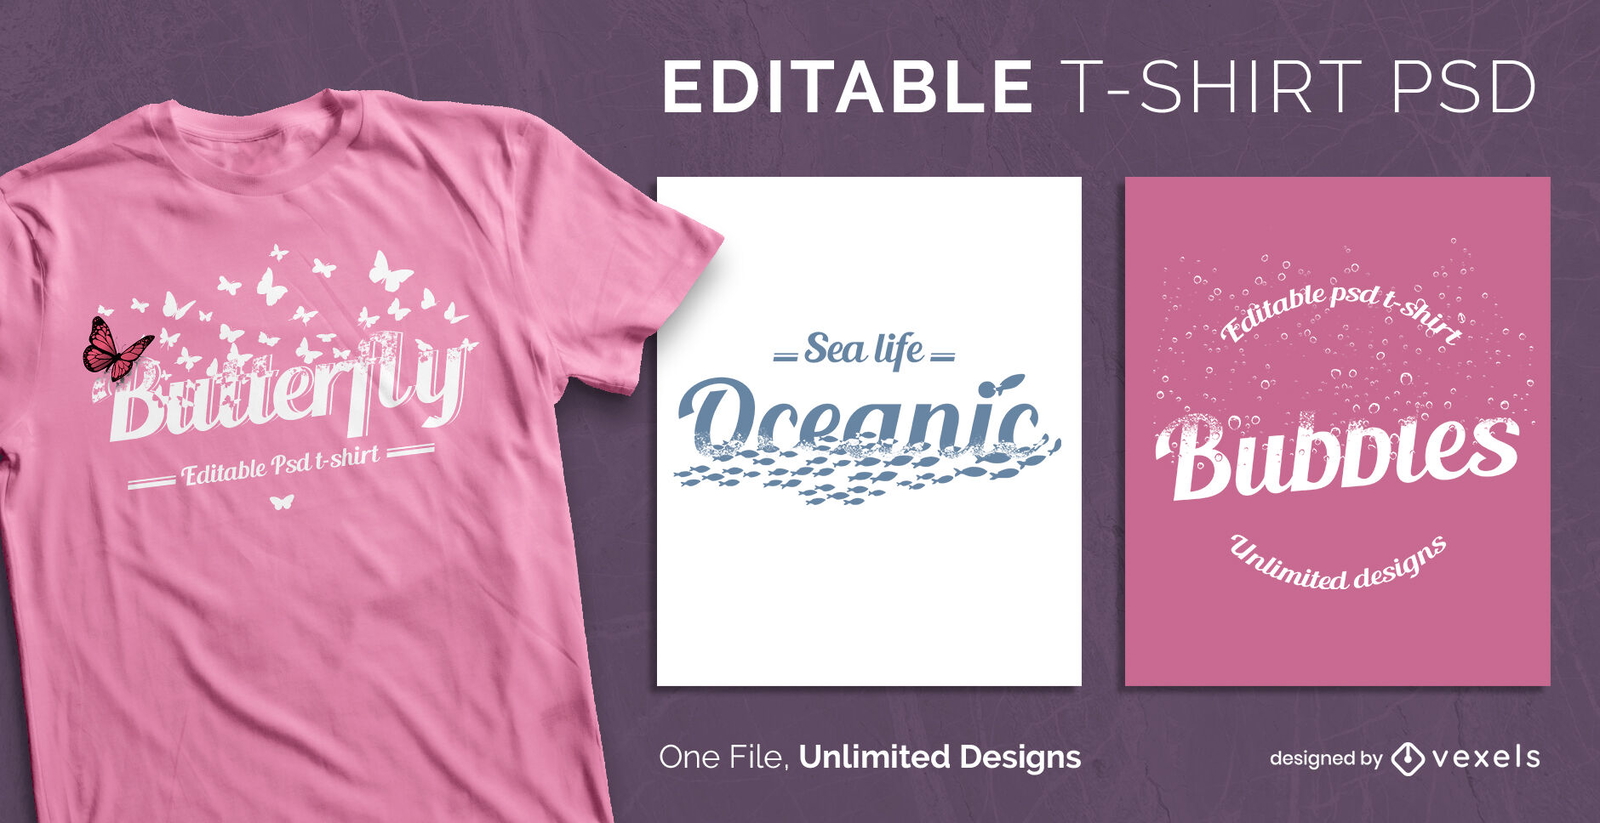
Modelos de T-Shirt PSD
Explorar Desenhos
Designs KDP
Pôsteres
Canecas
Capas para celular
Sacos de compras
Almofadas
Ferramentas de desenho
Merch Designer
Novo!
Mockup Generator
Gerador de Design de AI
Vetorizador
Quote Generator
T-Shirt Maker (Antigo)
Ajuda
Merch Digest
Blog
Centro de Ajuda
Saiba mais sobre o Merch
Feedback
Soluções Corporativas
Empresa
Acesso à API
Estúdio de Design
Design em Lote
Preços
Carregando...
Inscrever-se
Conecte-se
All
graficos
Biblioteca de design
Novos designs Merch
Camisetas
Vectores
Designs de Merch de Tendência
PNGs & SVGs
Mockups
Modelos de T-Shirt PSD
Explorar Desenhos
Designs KDP
Pôsteres
Canecas
Capas para celular
Sacos de compras
Almofadas
Ferramentas de desenho
Merch Designer
Novo!
Mockup Generator
Gerador de Design de AI
Vetorizador
Quote Generator
T-Shirt Maker (Antigo)
Ajuda
Merch Digest
Blog
Centro de Ajuda
Saiba mais sobre o Merch
Feedback
Soluções Corporativas
Empresa
Acesso à API
Estúdio de Design
Design em Lote
PLANOS
All
graficos
31768 Gráficos e Designs de graficos para Camisetas e Merch print on demand
Baixar designs de camisetas e para merch, como capas de livro, capas de celular, tote bags e mais de graficos
Relacionado:
graficos vetoriais
,
desenhos graficos de ações
,
graficos tridimensionais
Ordenar por
Mais relevante
Resultados patrocinados da
Ganhe 15% de desconto com o código: VEXELS15
veja mais detalhes
Gerado por IA, selecionado por nossos designers.
para Merch
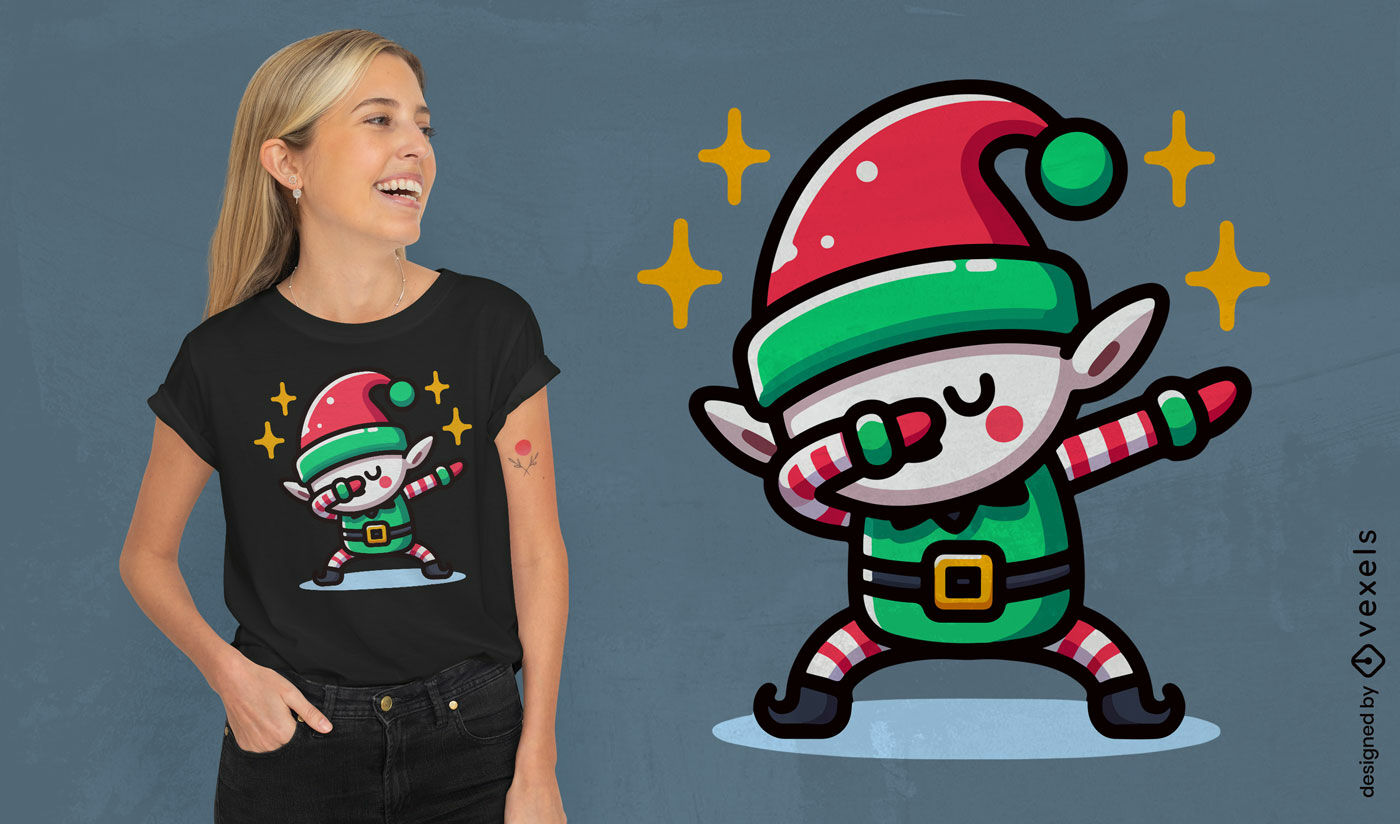
Design de camiseta com elfo de Natal
Escolha uma pasta
Todos os favoritos
Criar novo
Salvar
Design de camiseta com elfo de Natal
texto editável
Pronto para imprimir
para Merch
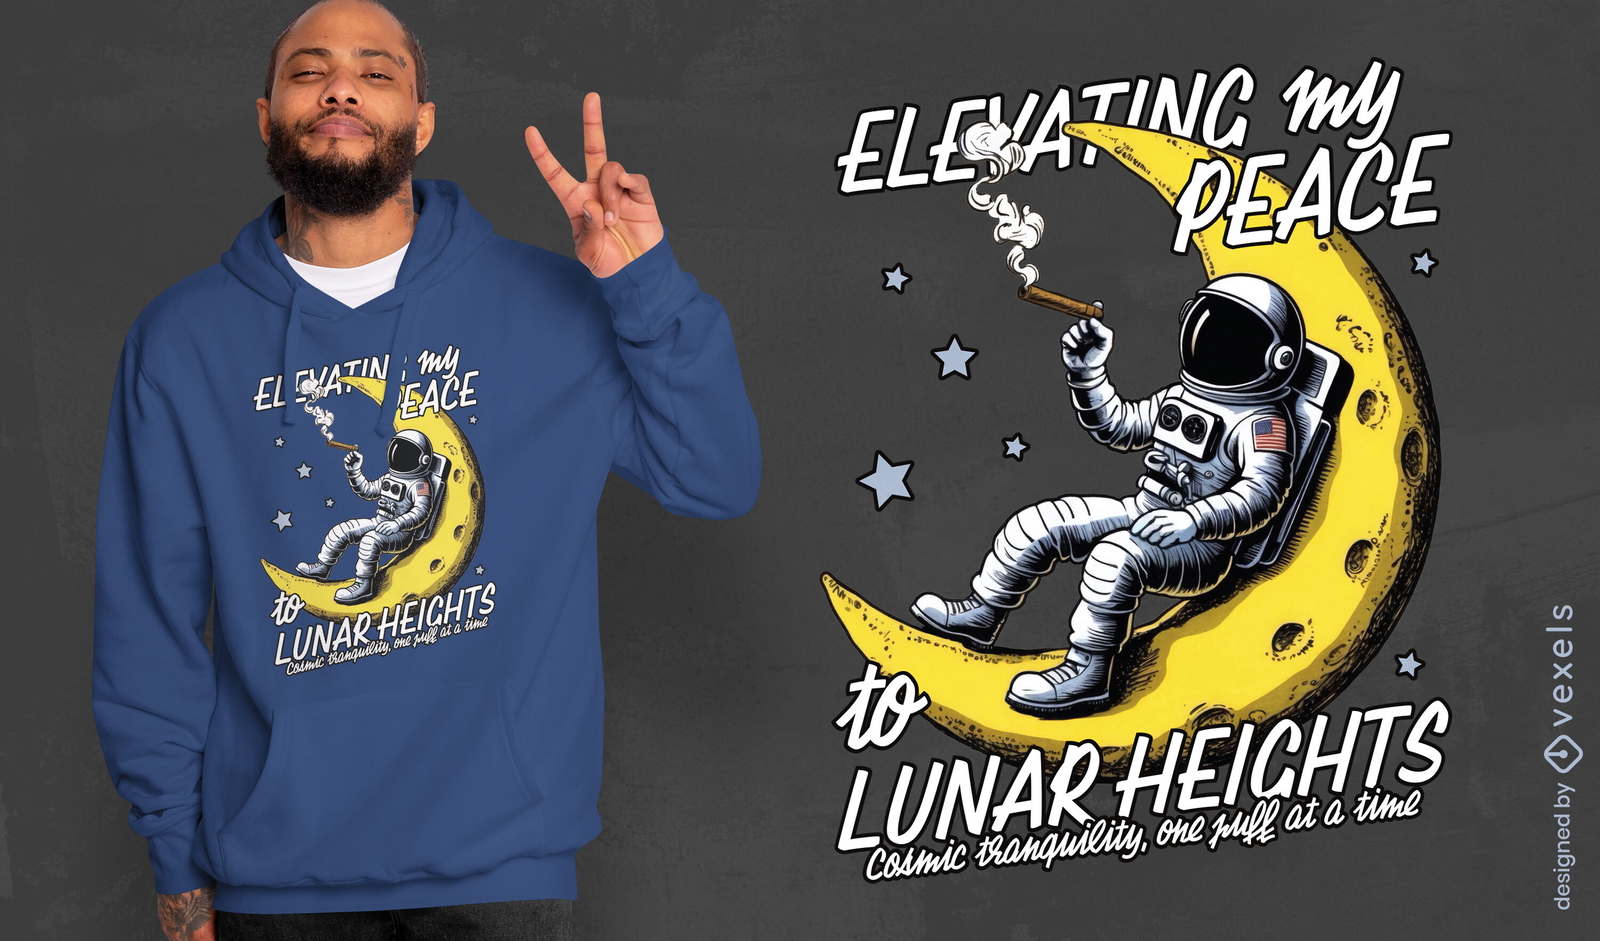
Design de camiseta elevando a paz às alturas lunares
Escolha uma pasta
Todos os favoritos
Criar novo
Salvar
Design de camiseta elevando a paz às alturas lunares
Pronto para imprimir
para Merch
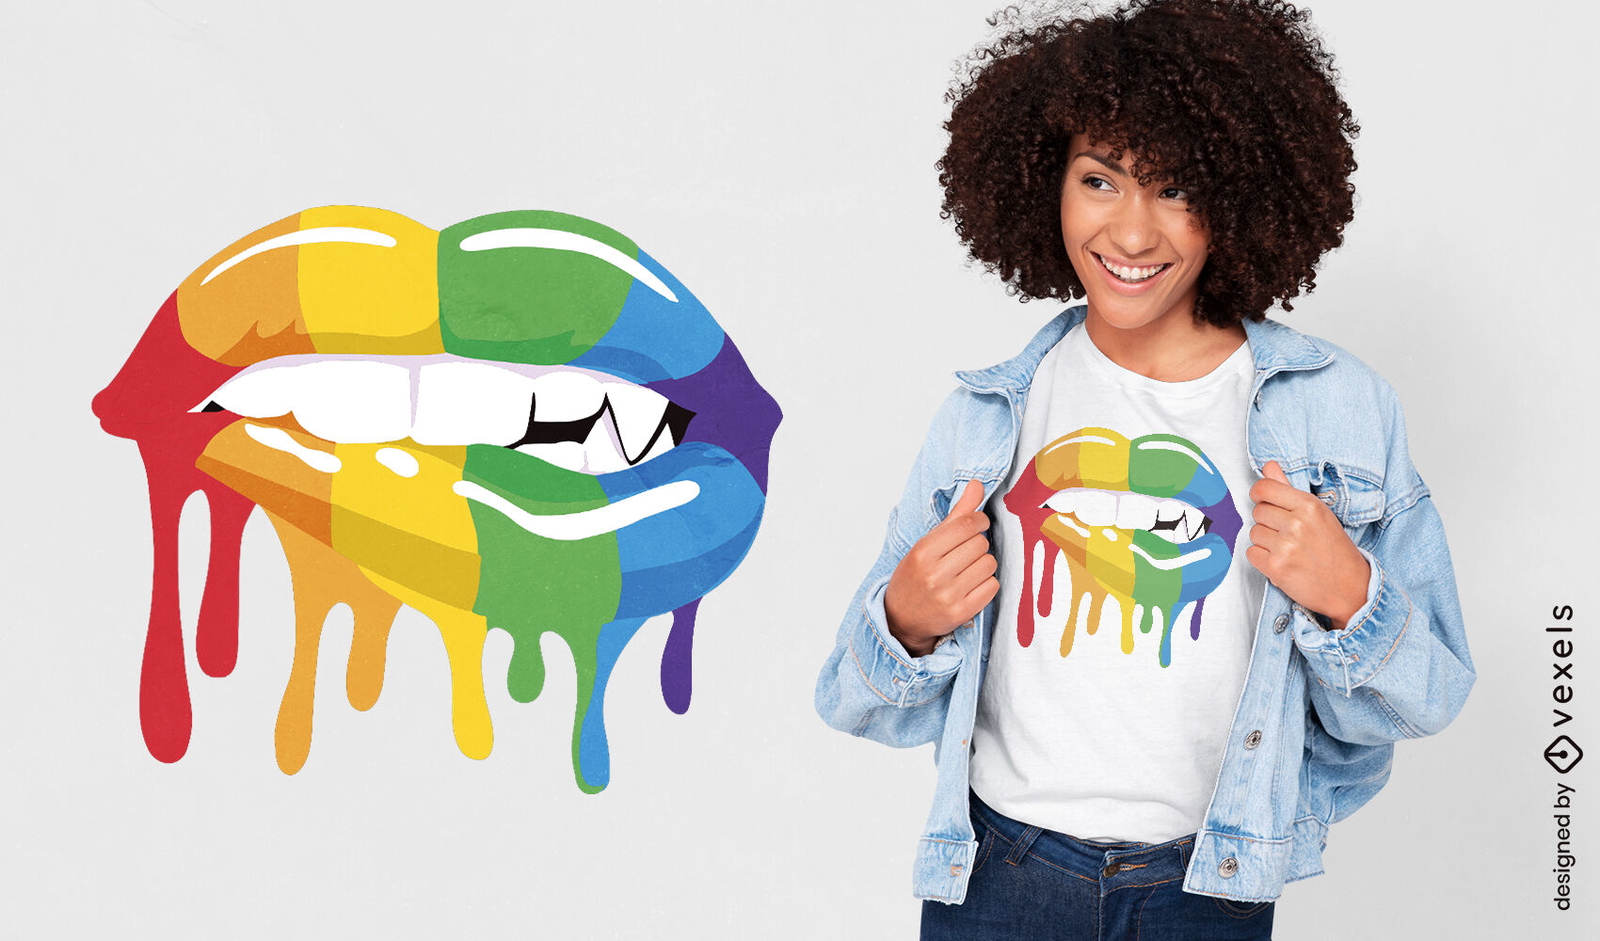
Design de camiseta de lábios de derretimento de vampiro do orgulho
Escolha uma pasta
Todos os favoritos
Criar novo
Salvar
Design de camiseta de lábios de derretimento de vampiro do orgulho
Editar online
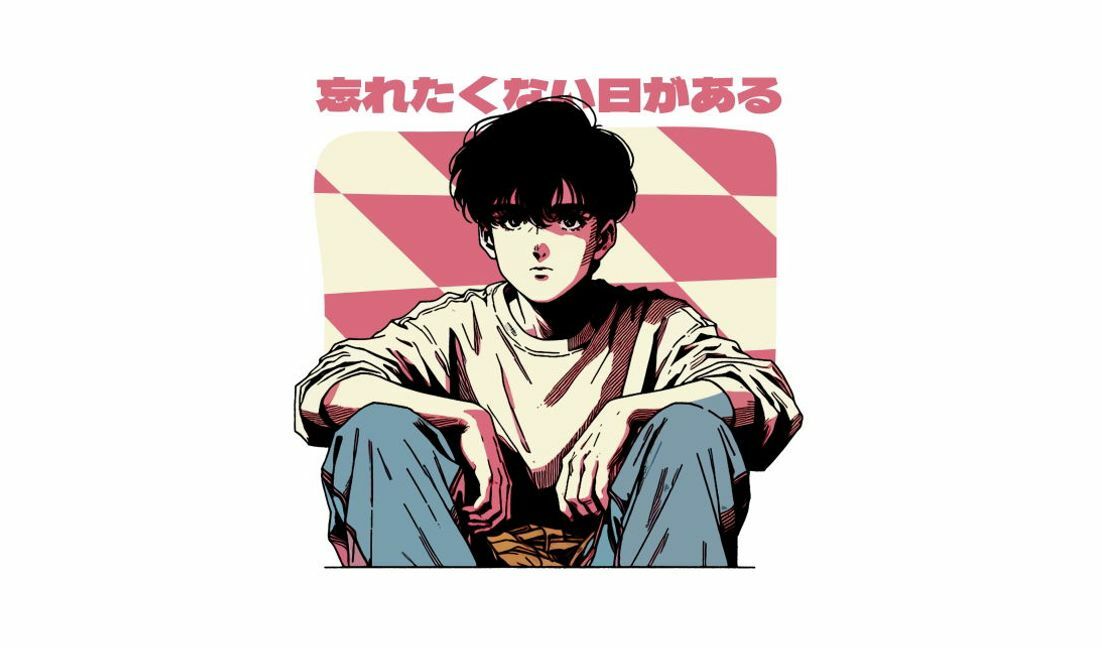
Modelo de design para camiseta Ilustração de personagem de anime emotiva com citação atenciosa
Escolha uma pasta
Todos os favoritos
Criar novo
Salvar
Modelo de design para camiseta Ilustração de personagem de anime emotiva com citação atenciosa
texto editável
Pronto para imprimir
para Merch
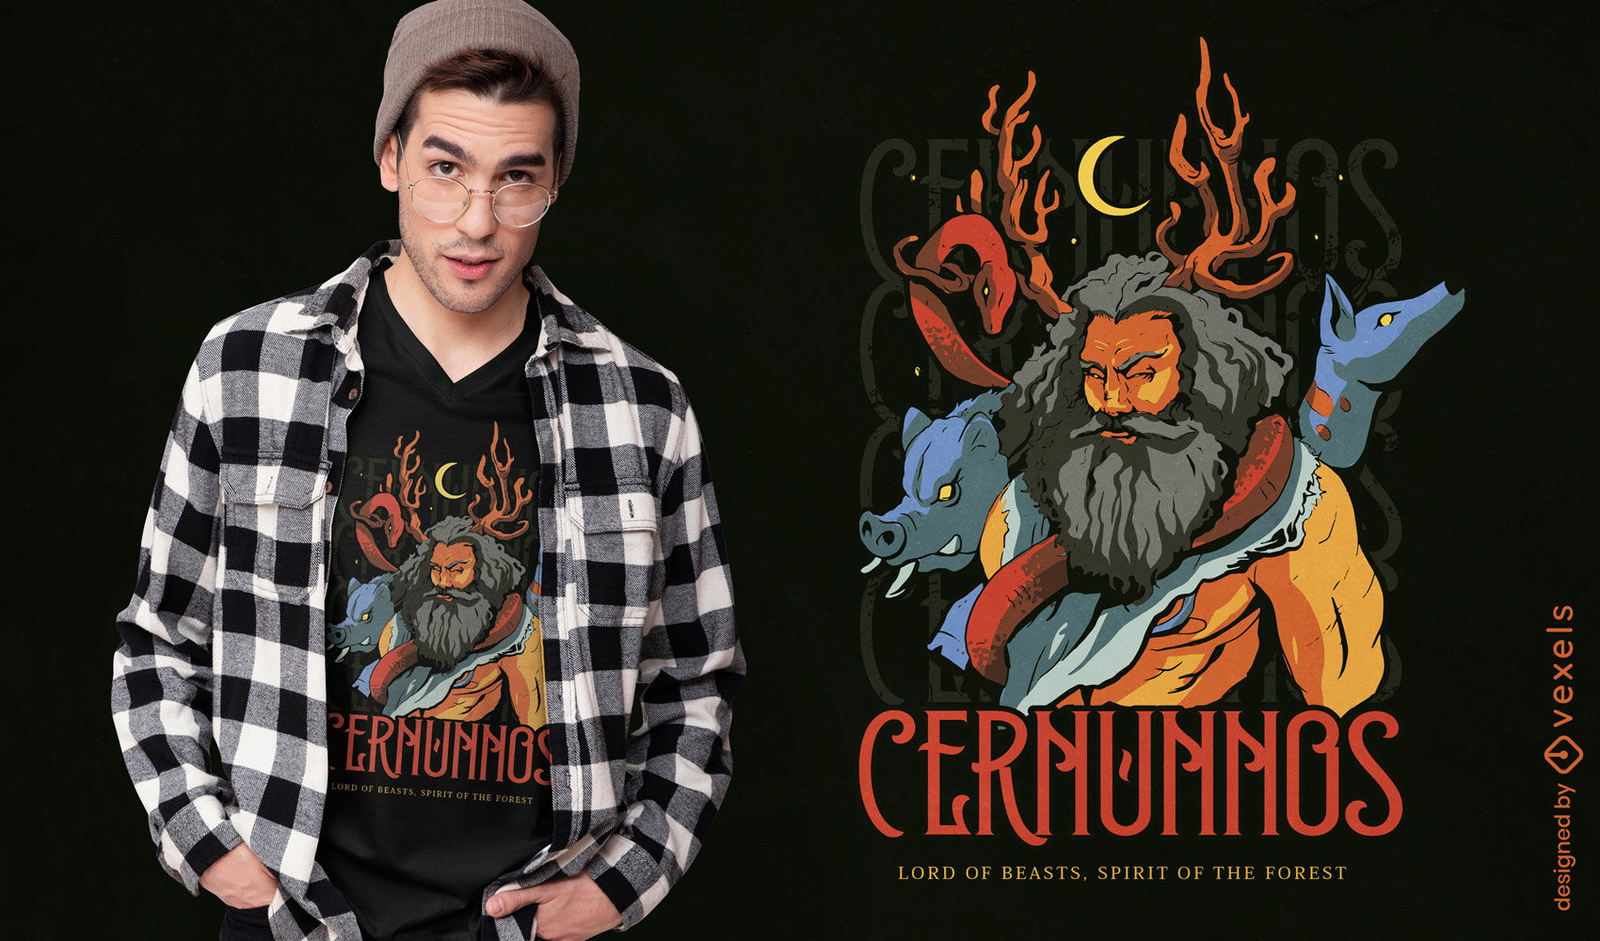
Design de camiseta da besta mitológica Cernunnos
Escolha uma pasta
Todos os favoritos
Criar novo
Salvar
Design de camiseta da besta mitológica Cernunnos
texto editável
Pronto para imprimir
para Merch
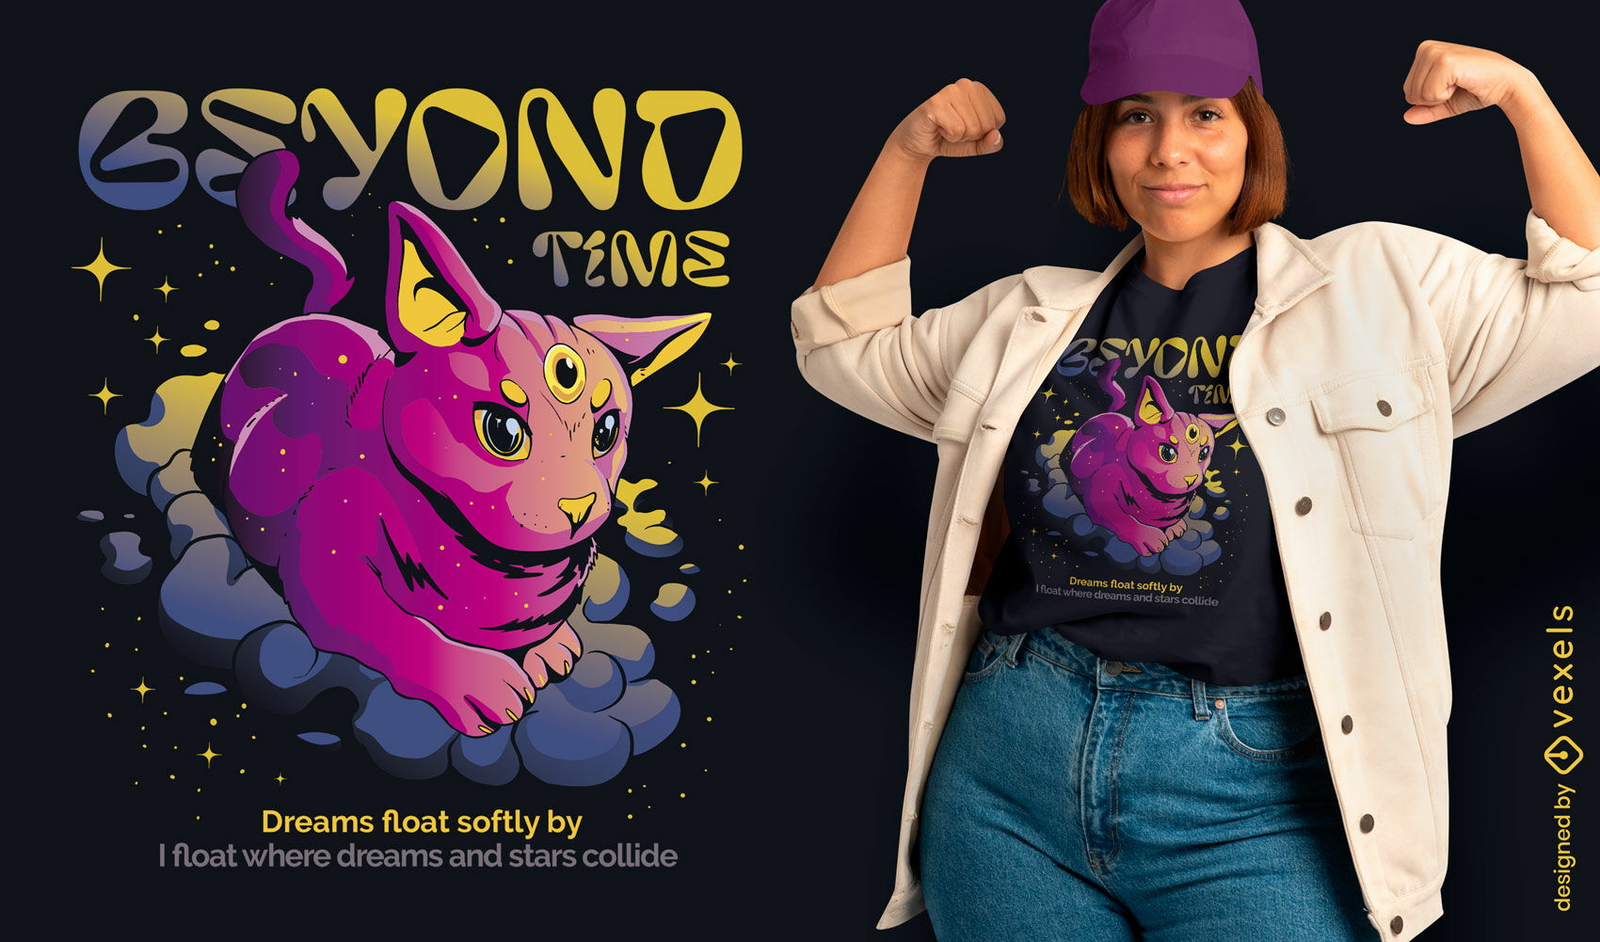
Design de camiseta com gato além do tempo
Escolha uma pasta
Todos os favoritos
Criar novo
Salvar
Design de camiseta com gato além do tempo
Gerado por IA, selecionado por nossos designers.
para Merch
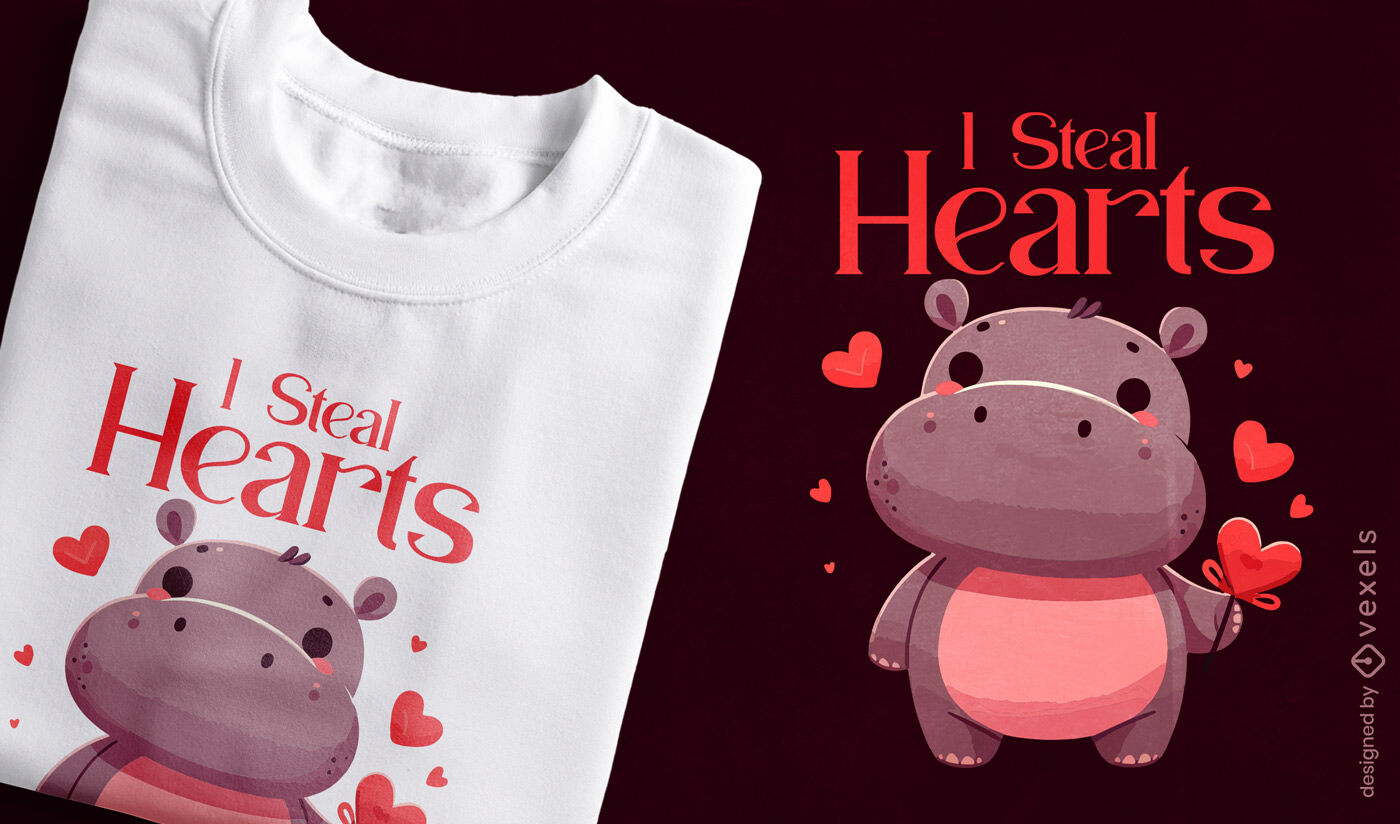
Design de camiseta de hipopótamo para dia dos namorados
Escolha uma pasta
Todos os favoritos
Criar novo
Salvar
Design de camiseta de hipopótamo para dia dos namorados
Gerado por IA, selecionado por nossos designers.
para Merch
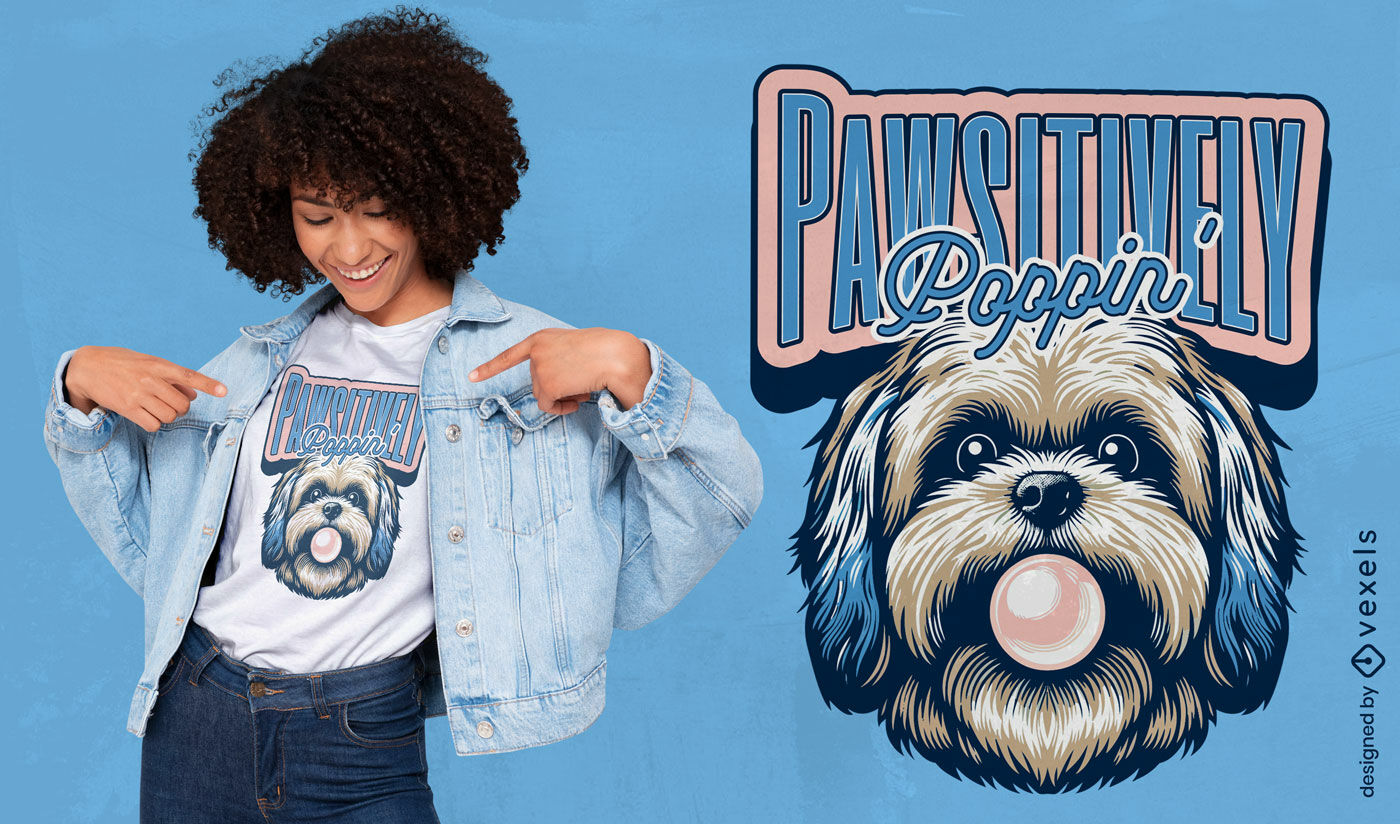
Design de camiseta com trocadilho de cachorro com chiclete
Escolha uma pasta
Todos os favoritos
Criar novo
Salvar
Design de camiseta com trocadilho de cachorro com chiclete
texto editável
Pronto para imprimir
para Merch
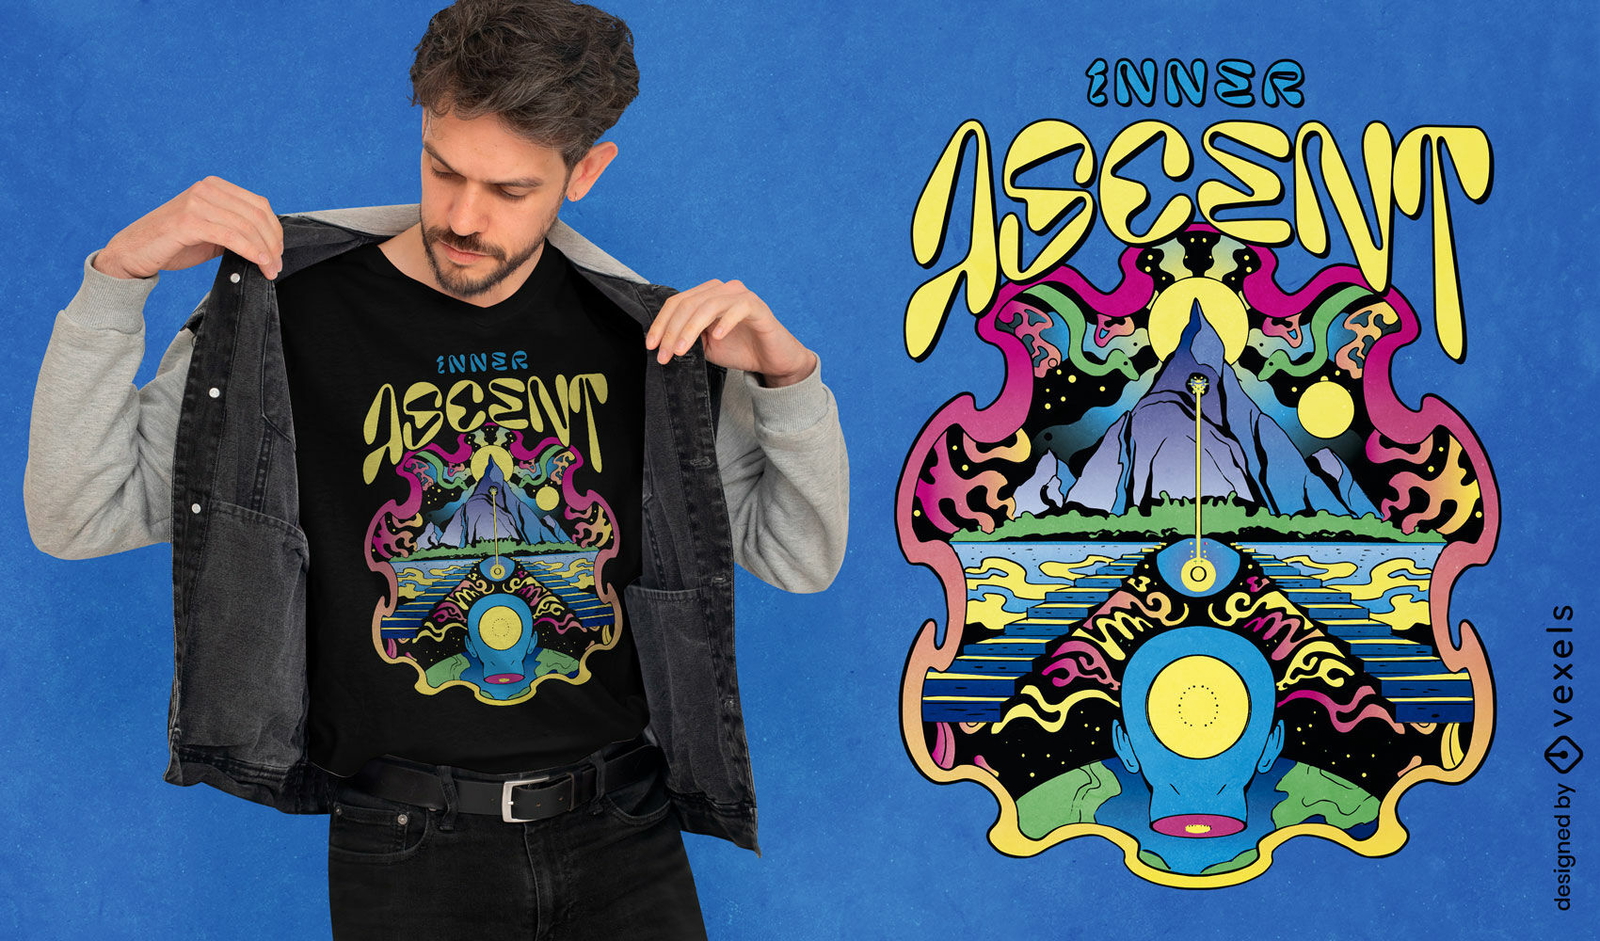
Design de camiseta psicodélica de ascensão interior
Escolha uma pasta
Todos os favoritos
Criar novo
Salvar
Design de camiseta psicodélica de ascensão interior
texto editável
Pronto para imprimir
para Merch
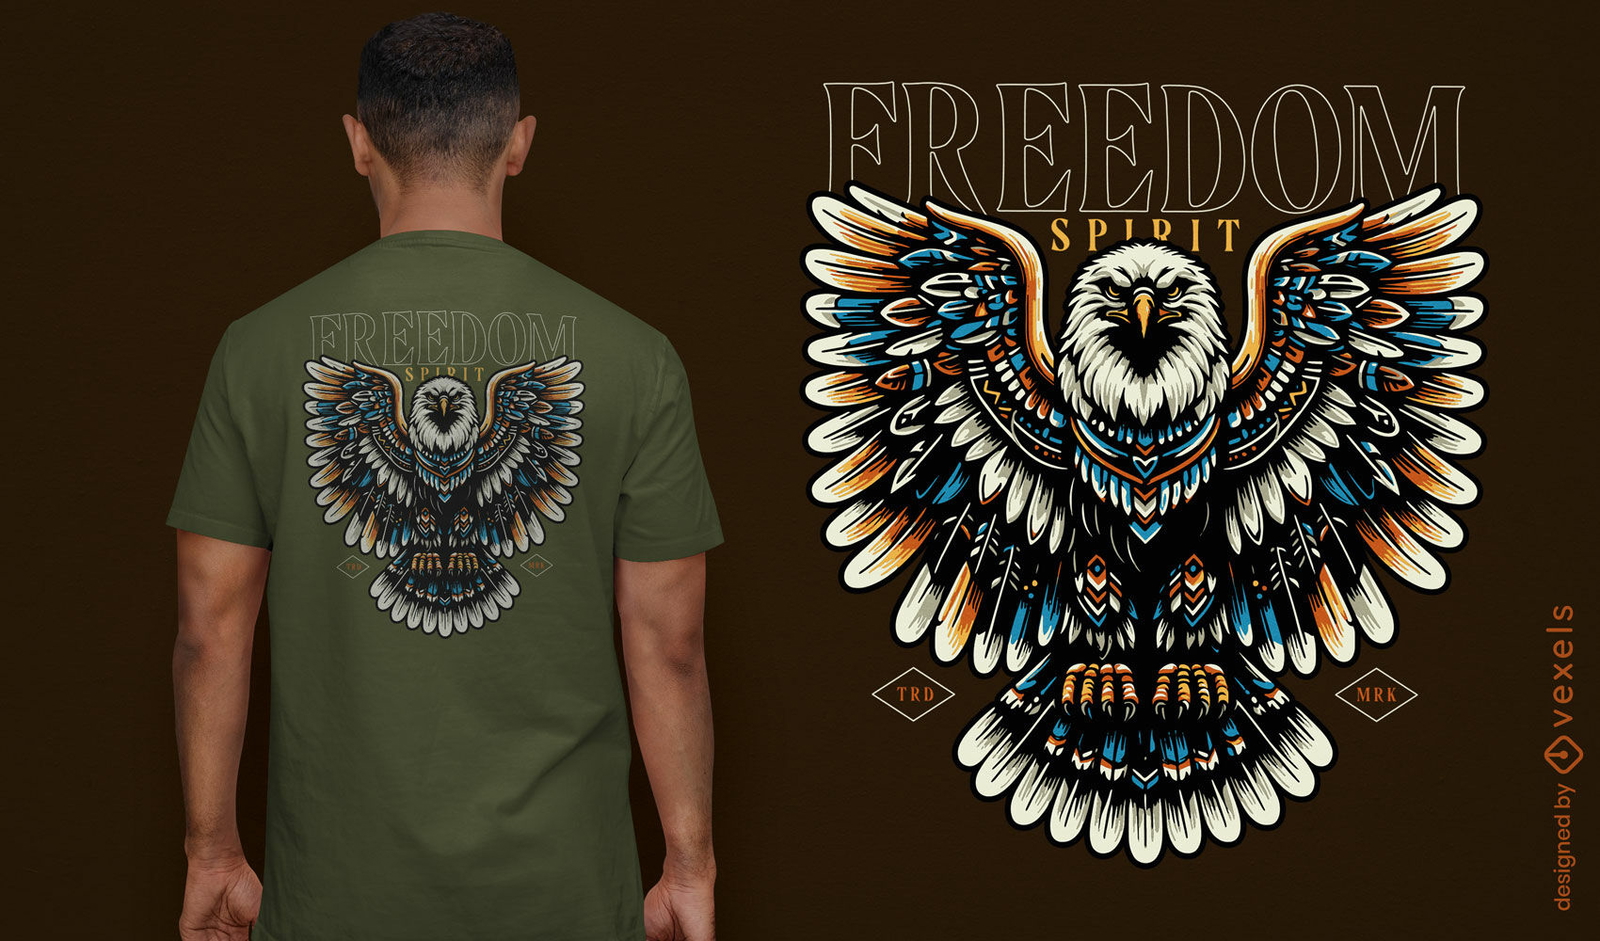
Design de camiseta com a liberdade da águia majestosa
Escolha uma pasta
Todos os favoritos
Criar novo
Salvar
Design de camiseta com a liberdade da águia majestosa
Pronto para imprimir
para Merch
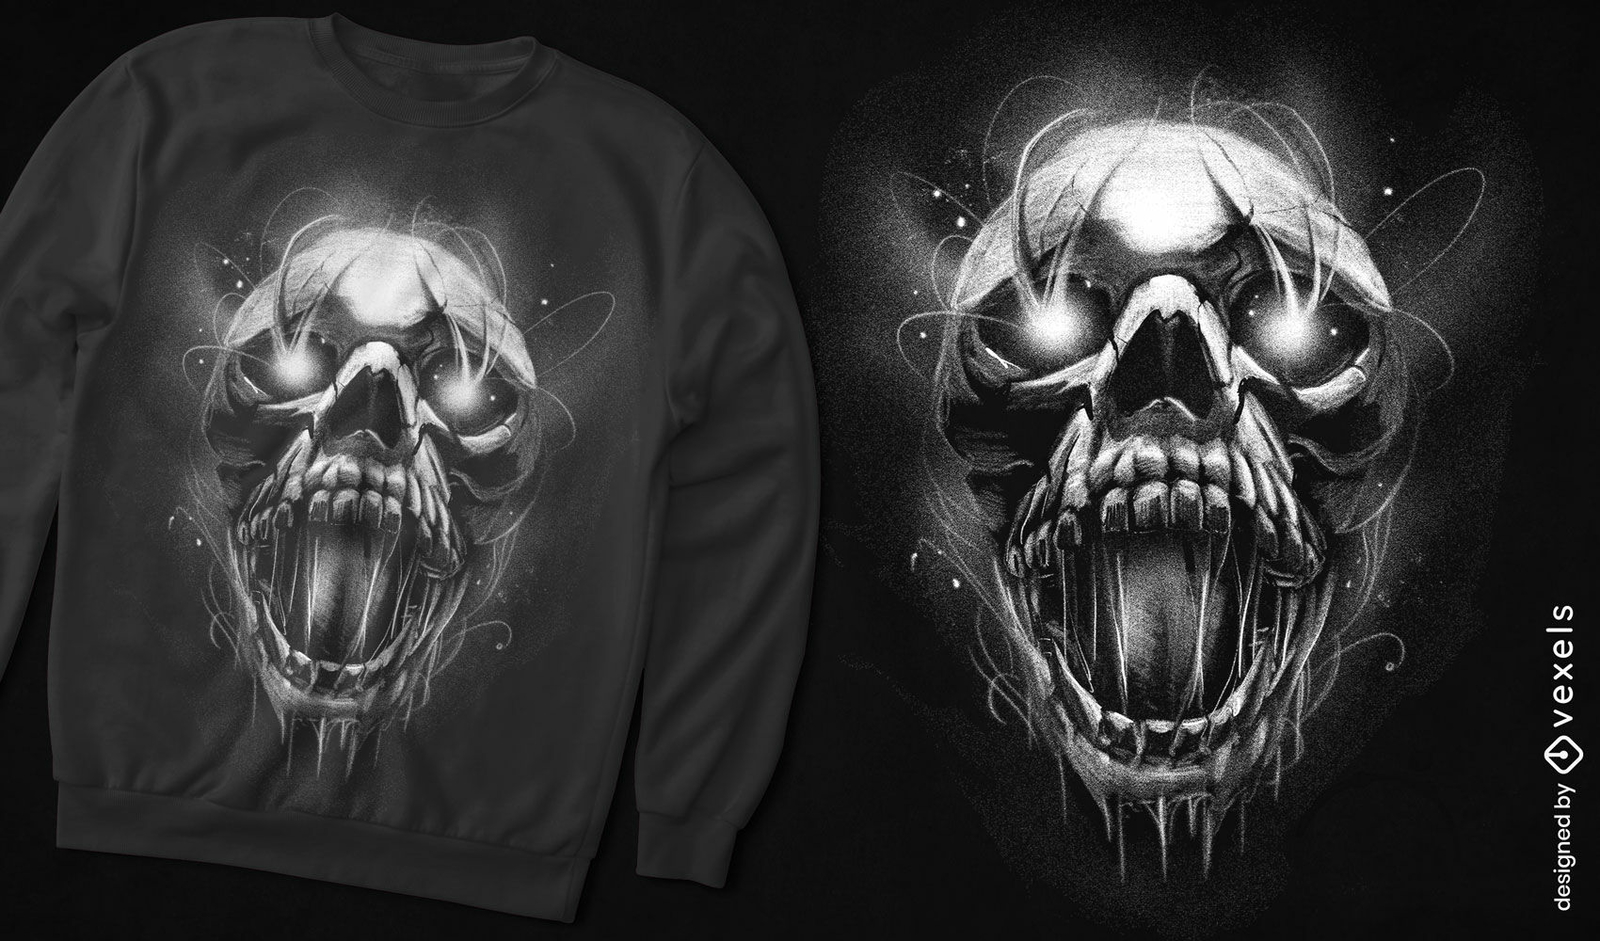
Design de camiseta com grito de horror de caveira
Escolha uma pasta
Todos os favoritos
Criar novo
Salvar
Design de camiseta com grito de horror de caveira
Pronto para imprimir
para Merch
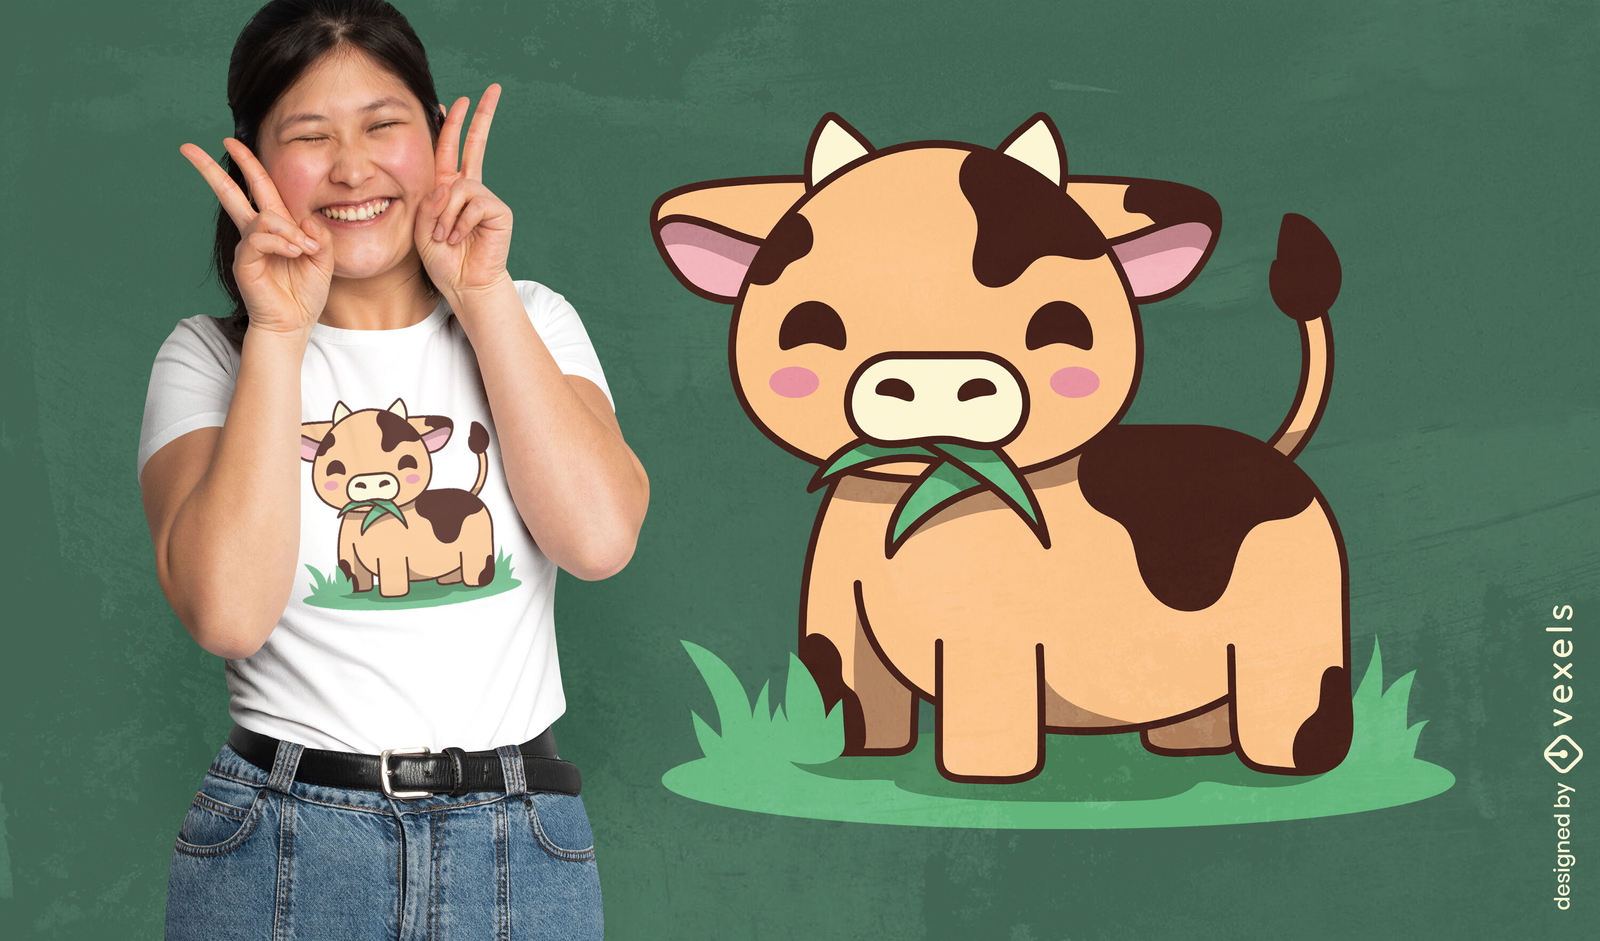
Design fofo de camiseta de vaca kawaii
Escolha uma pasta
Todos os favoritos
Criar novo
Salvar
Design fofo de camiseta de vaca kawaii
Conteúdo em alemão
Pronto para imprimir
para Merch
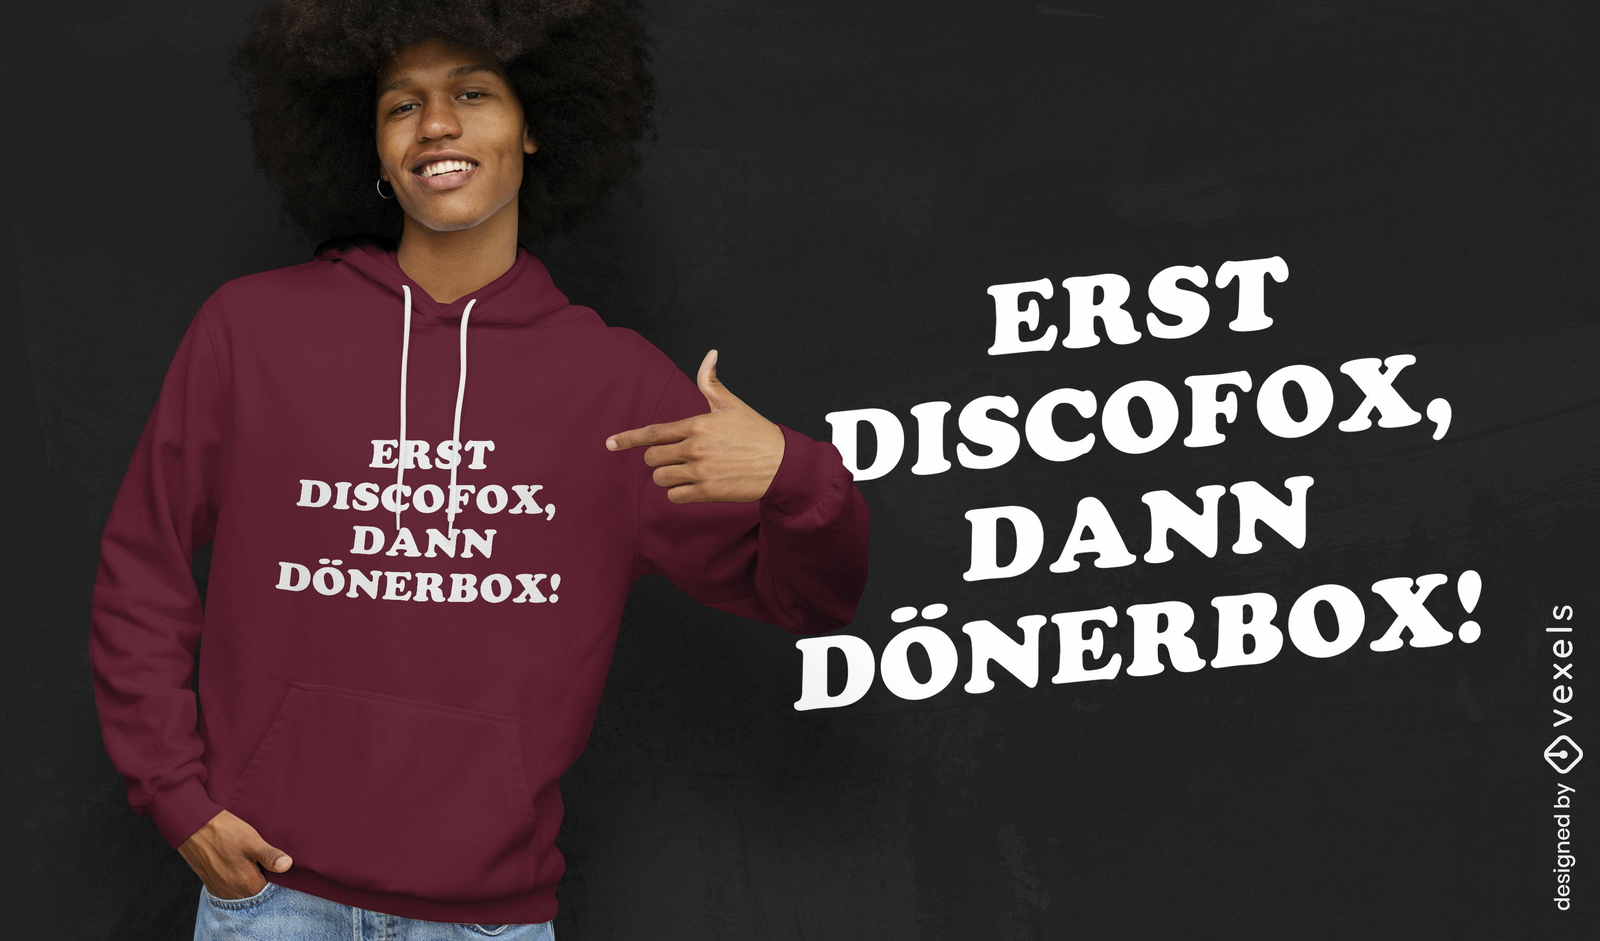
Design de camiseta com cita??o de discoteca
Escolha uma pasta
Todos os favoritos
Criar novo
Salvar
Design de camiseta com cita??o de discoteca
texto editável
Pronto para imprimir
para Merch
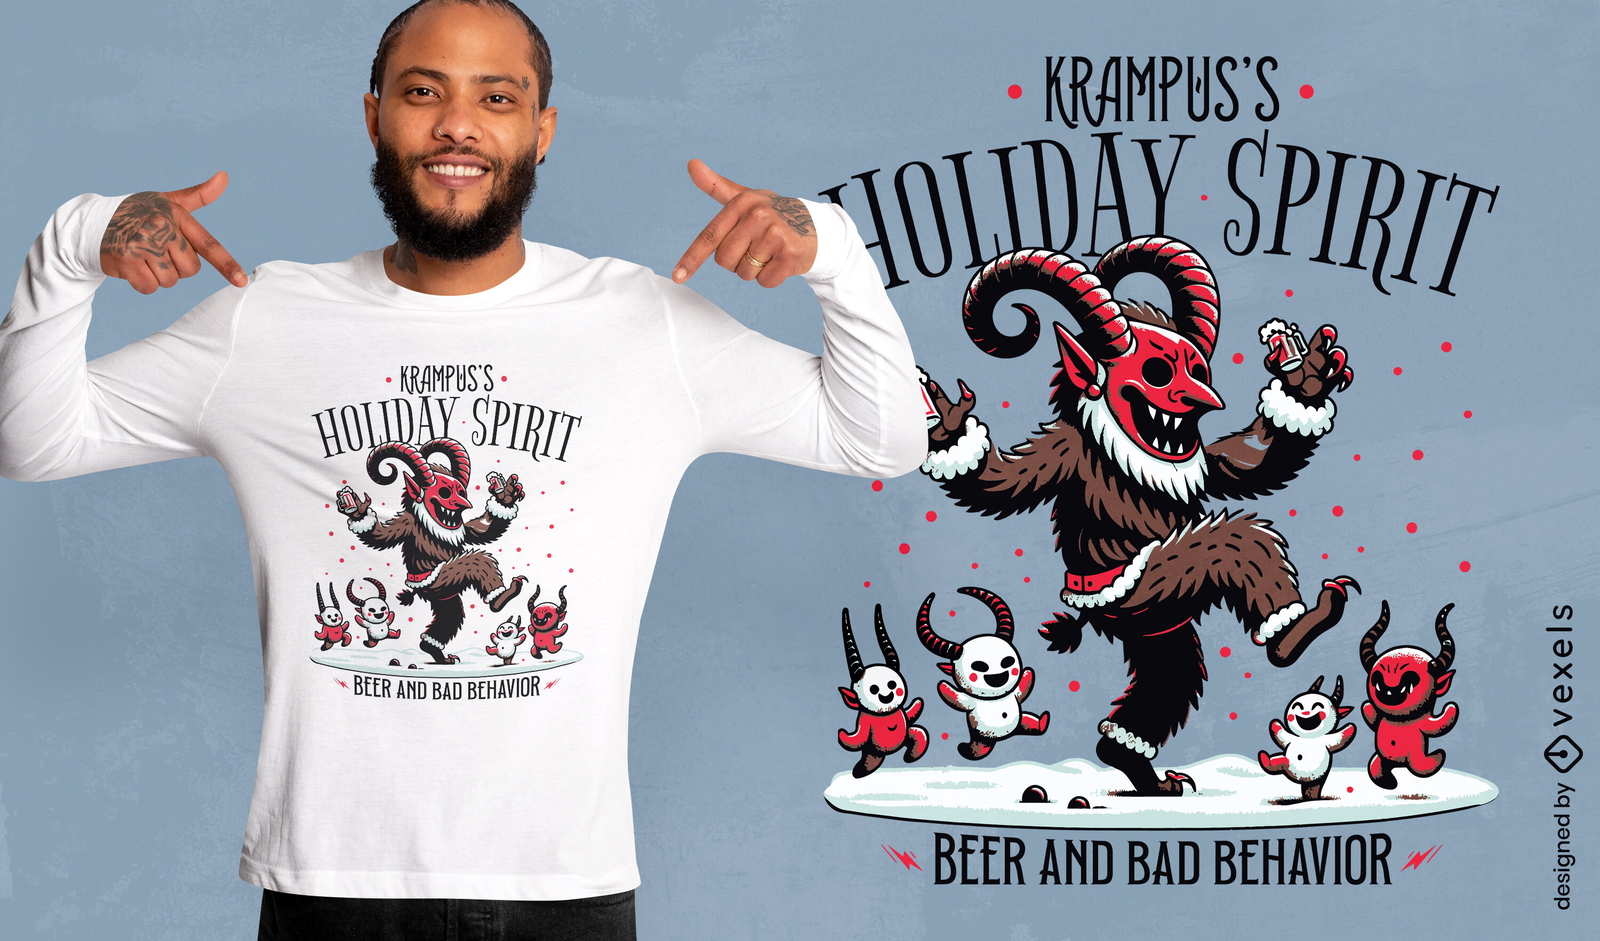
Design de camiseta com o espírito natalino de Krampus
Escolha uma pasta
Todos os favoritos
Criar novo
Salvar
Design de camiseta com o espírito natalino de Krampus
Pronto para imprimir
para Merch
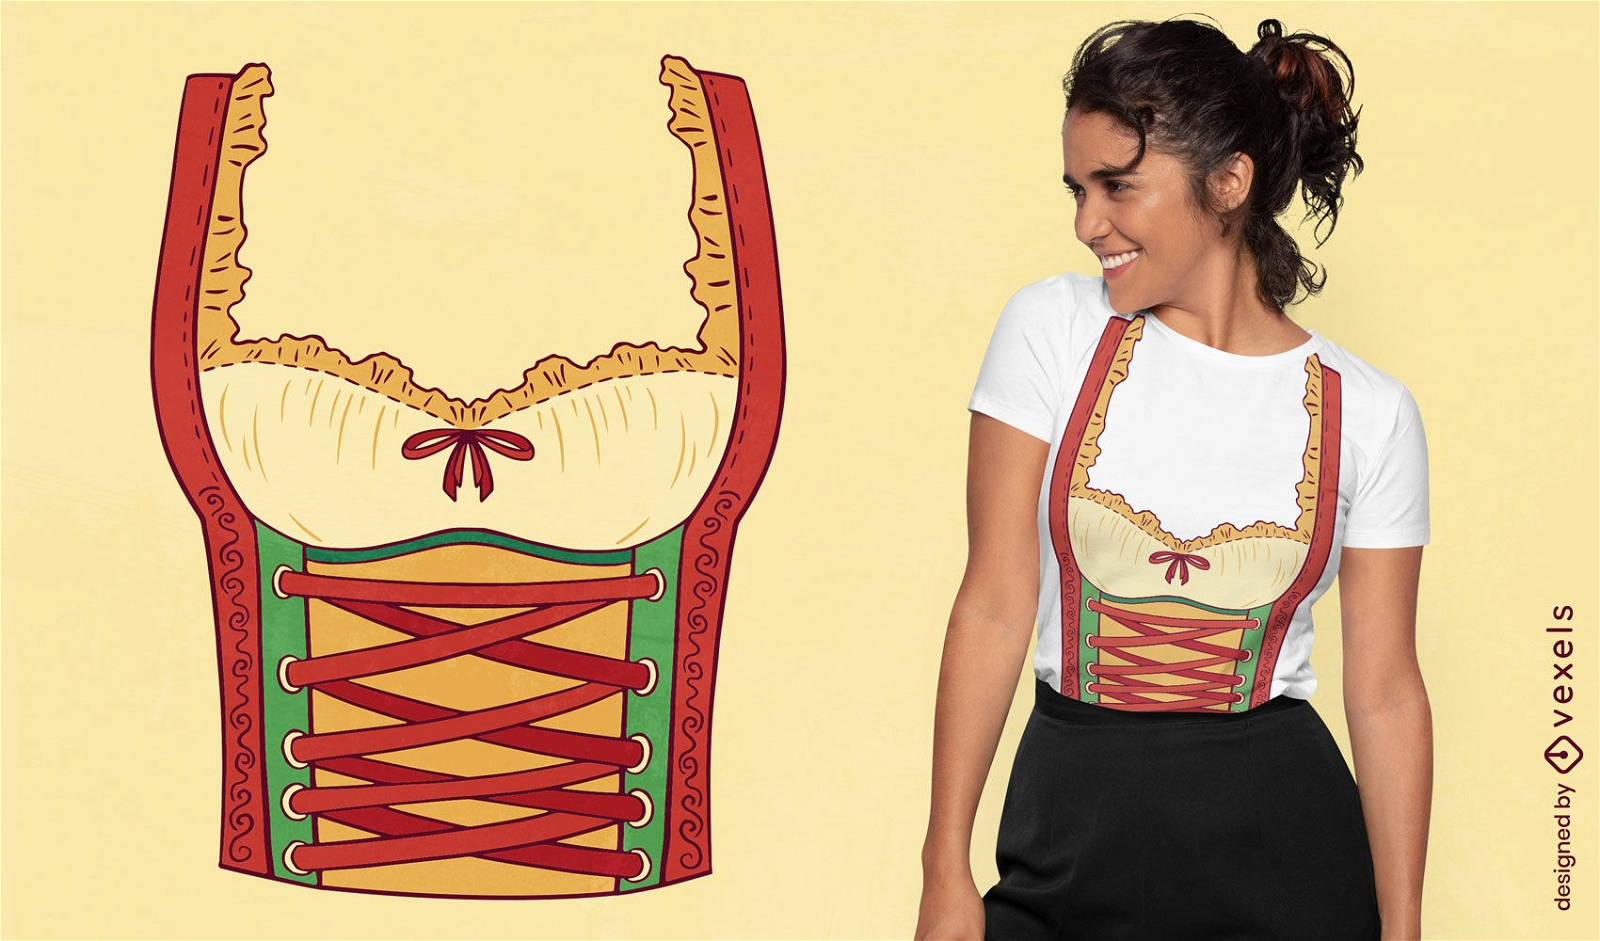
Design de camiseta de fantasia de mulher da Oktoberfest
Escolha uma pasta
Todos os favoritos
Criar novo
Salvar
Design de camiseta de fantasia de mulher da Oktoberfest
Gerado por IA, selecionado por nossos designers.
para Merch
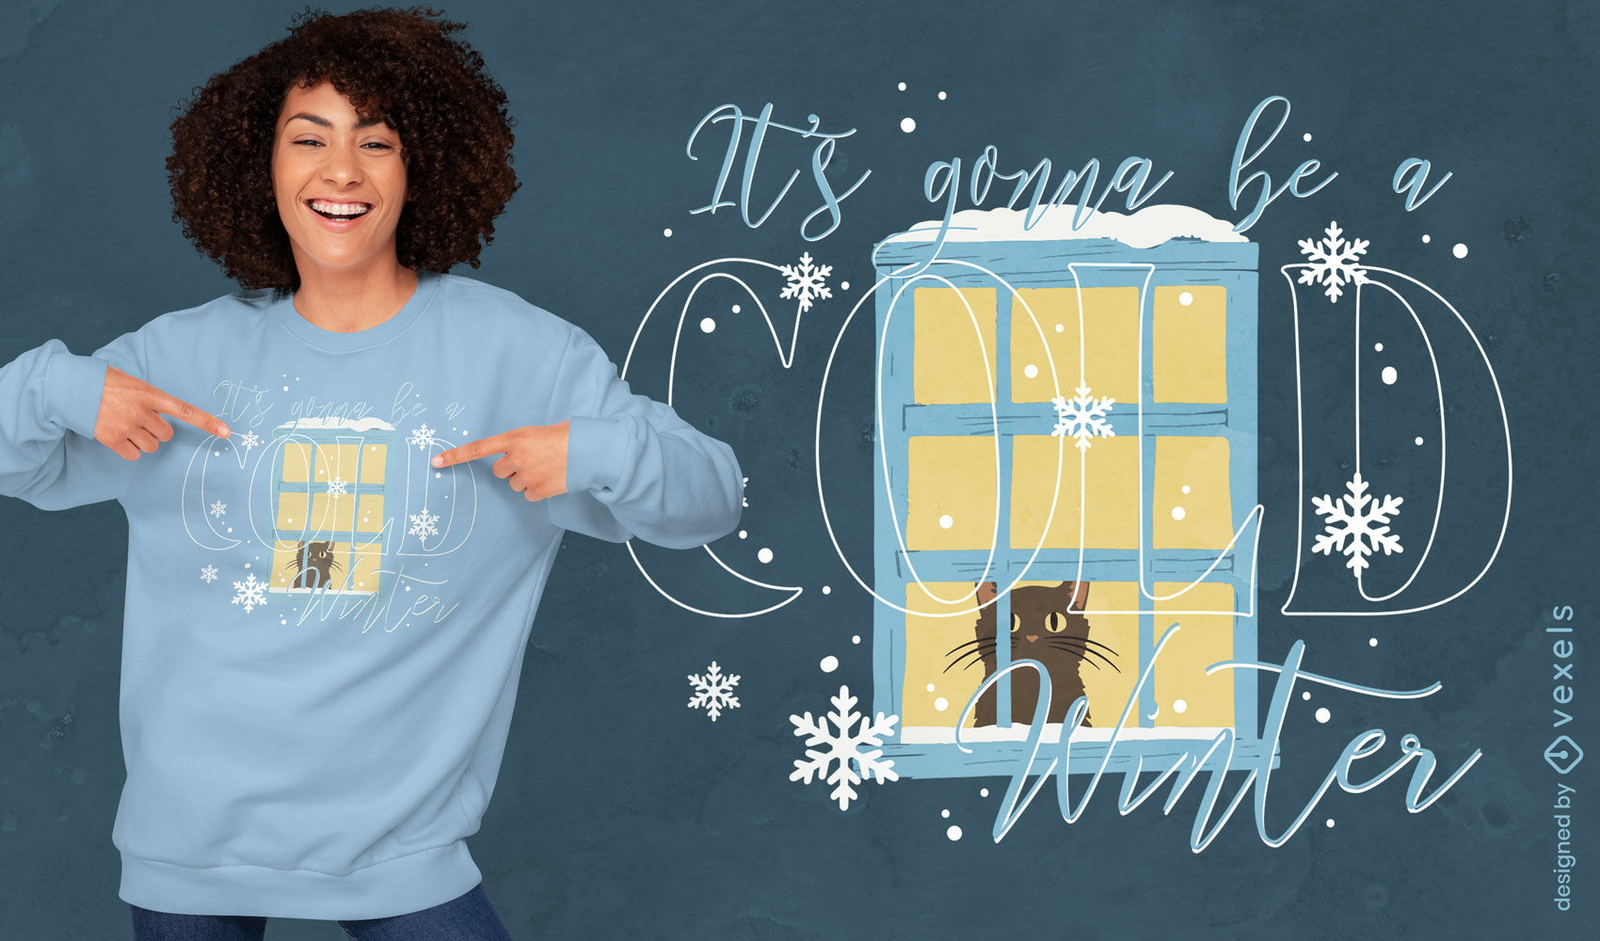
Design de camiseta de gato de janela de inverno
Escolha uma pasta
Todos os favoritos
Criar novo
Salvar
Design de camiseta de gato de janela de inverno
texto editável
Pronto para imprimir
para Merch
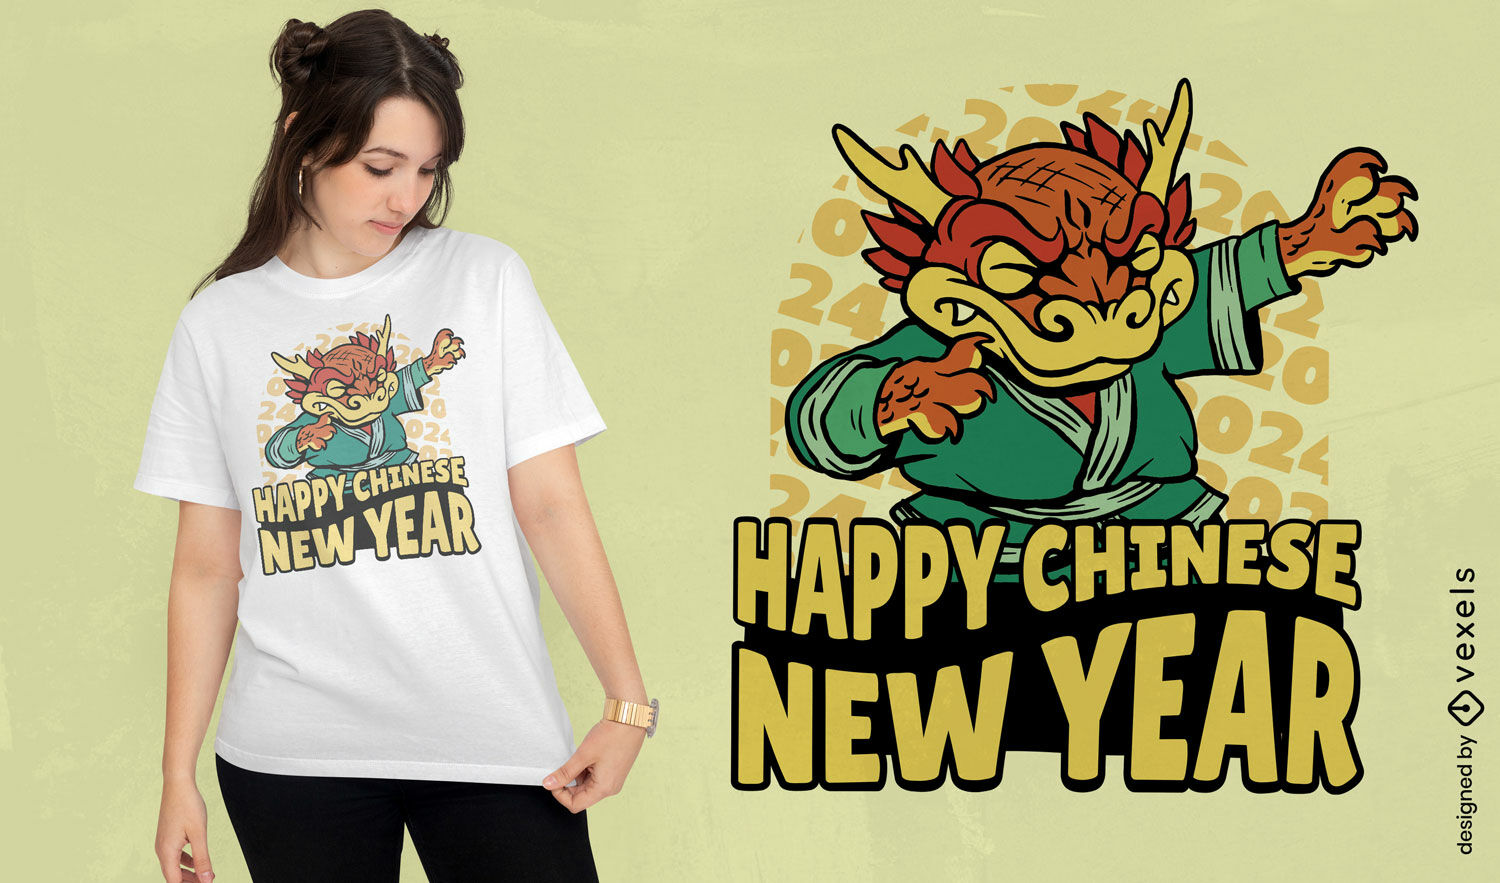
Design de camiseta com drag?o para o ano novo chin?s
Escolha uma pasta
Todos os favoritos
Criar novo
Salvar
Design de camiseta com drag?o para o ano novo chin?s
texto editável
para Merch
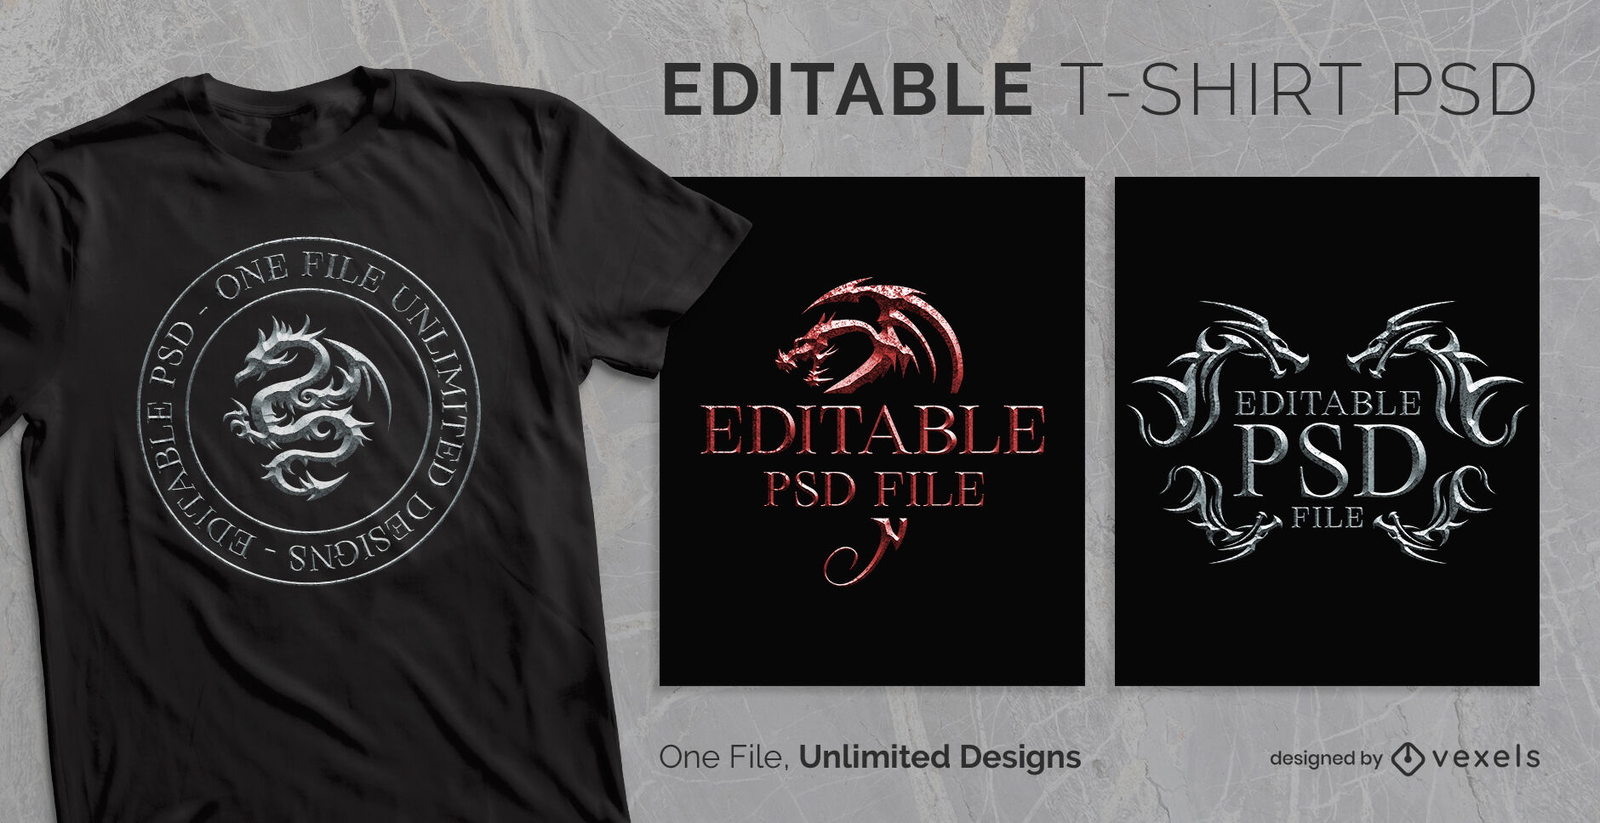
T-shirt metálica das criaturas do dragão 3D psd
Escolha uma pasta
Todos os favoritos
Criar novo
Salvar
T-shirt metálica das criaturas do dragão 3D psd
texto editável
Pronto para imprimir
para Merch
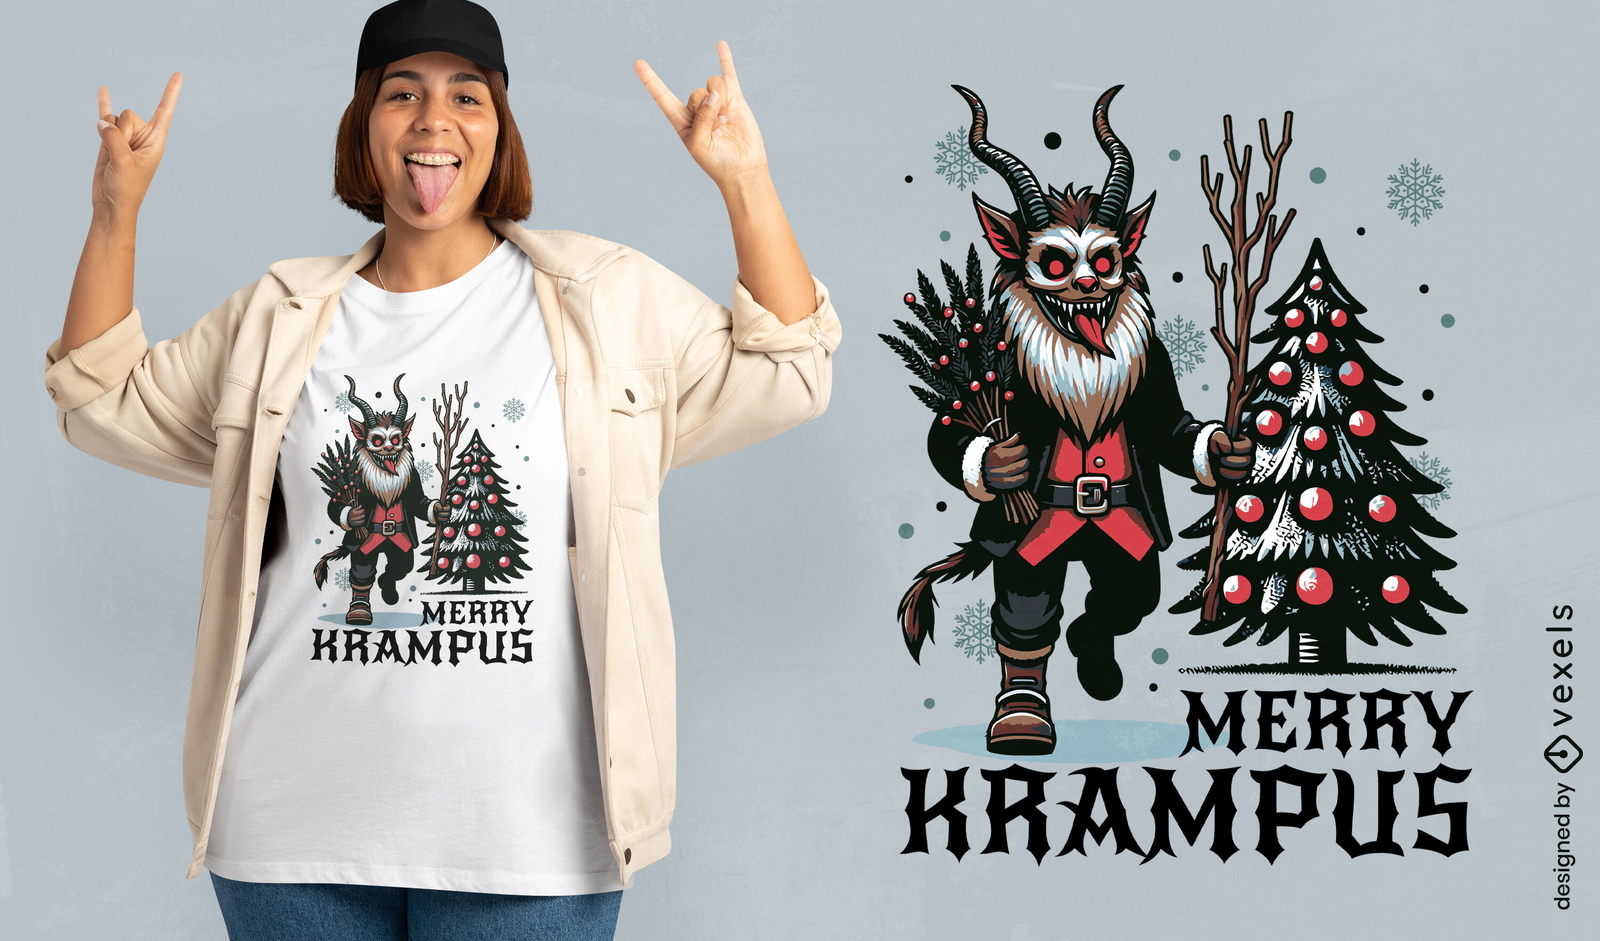
Design de camiseta de desenho animado Merry Krampus
Escolha uma pasta
Todos os favoritos
Criar novo
Salvar
Design de camiseta de desenho animado Merry Krampus
Pronto para imprimir
para Merch
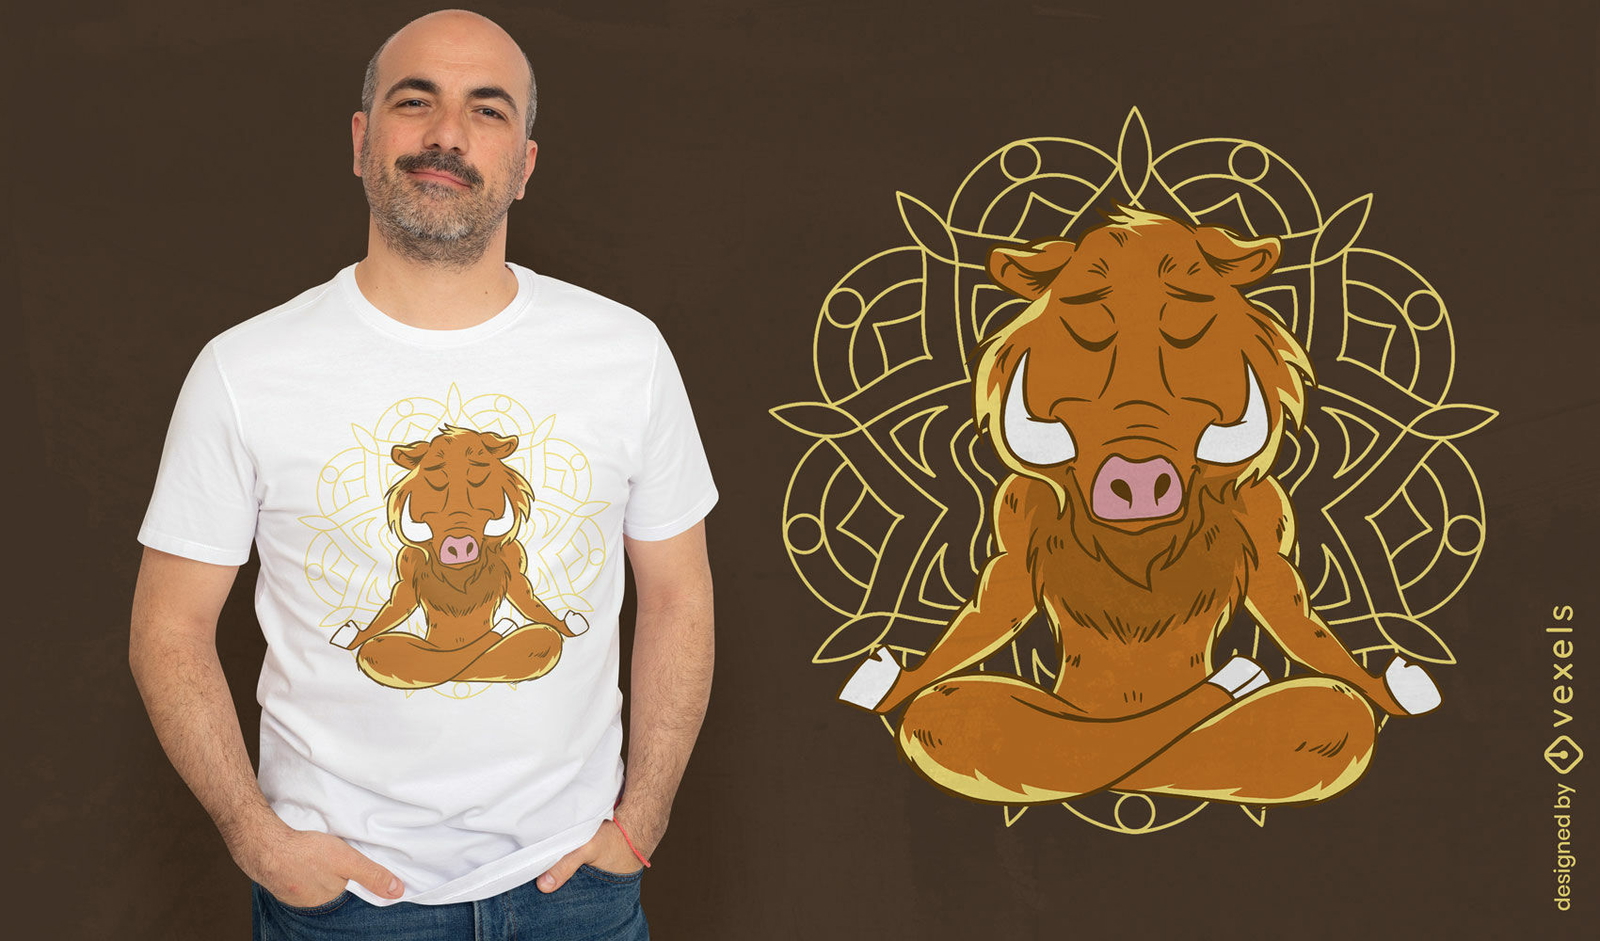
Design de camiseta de meditação animal javali
Escolha uma pasta
Todos os favoritos
Criar novo
Salvar
Design de camiseta de meditação animal javali
texto editável
Pronto para imprimir
para Merch
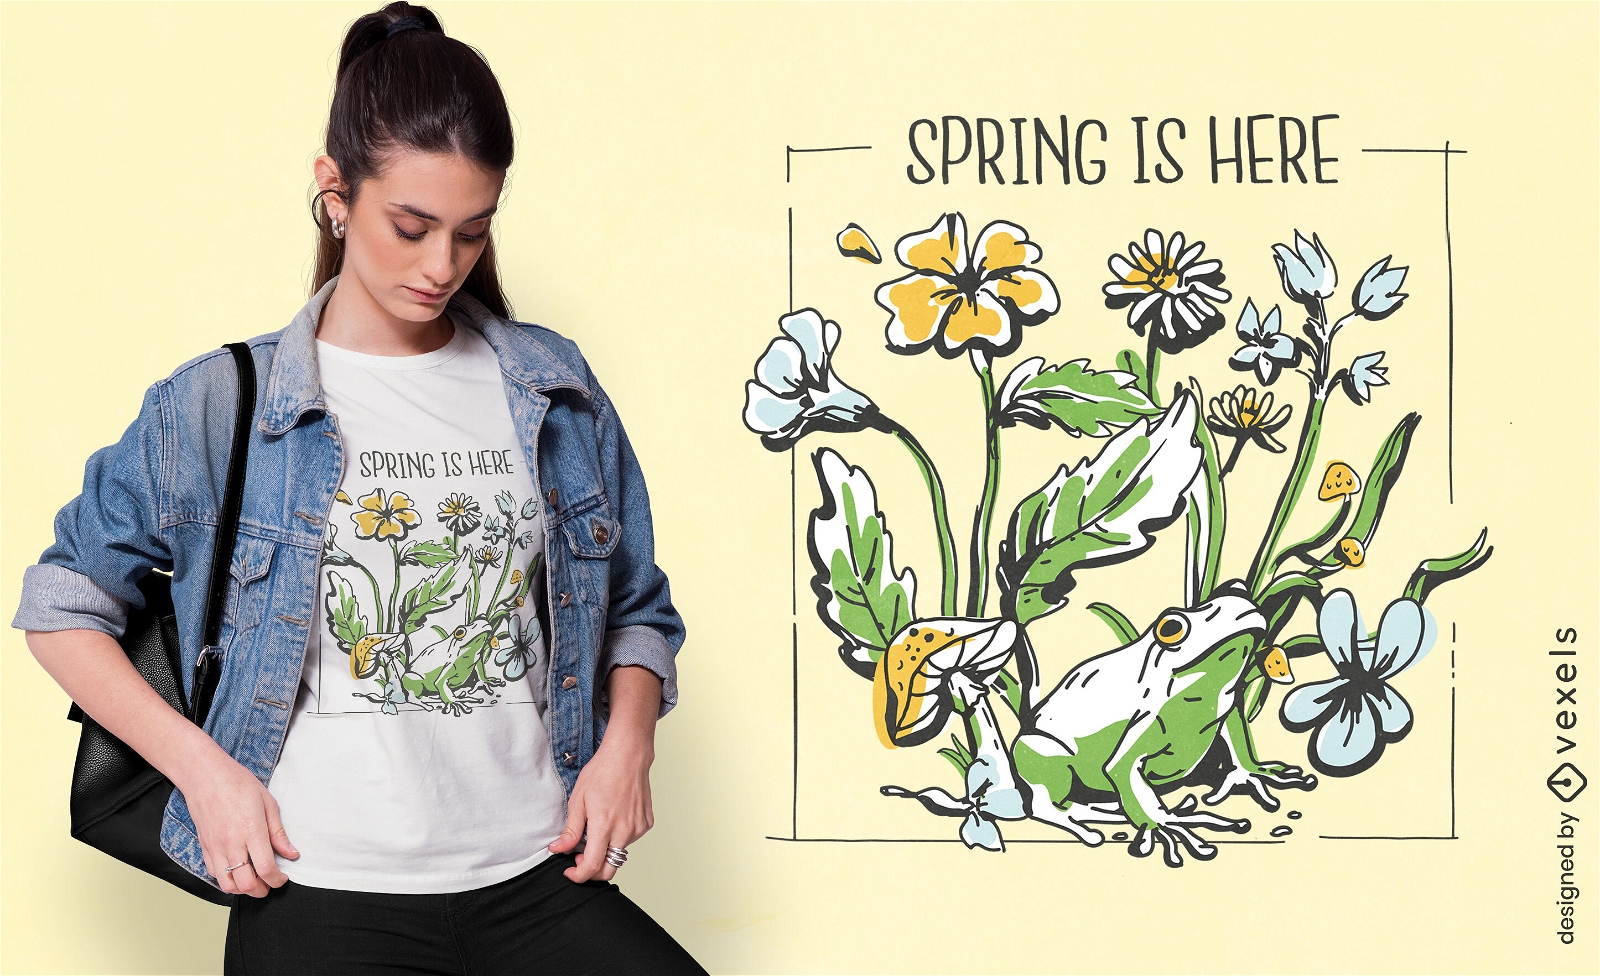
Design de camiseta de sapo de flores silvestres
Escolha uma pasta
Todos os favoritos
Criar novo
Salvar
Design de camiseta de sapo de flores silvestres
texto editável
Pronto para imprimir
para Merch
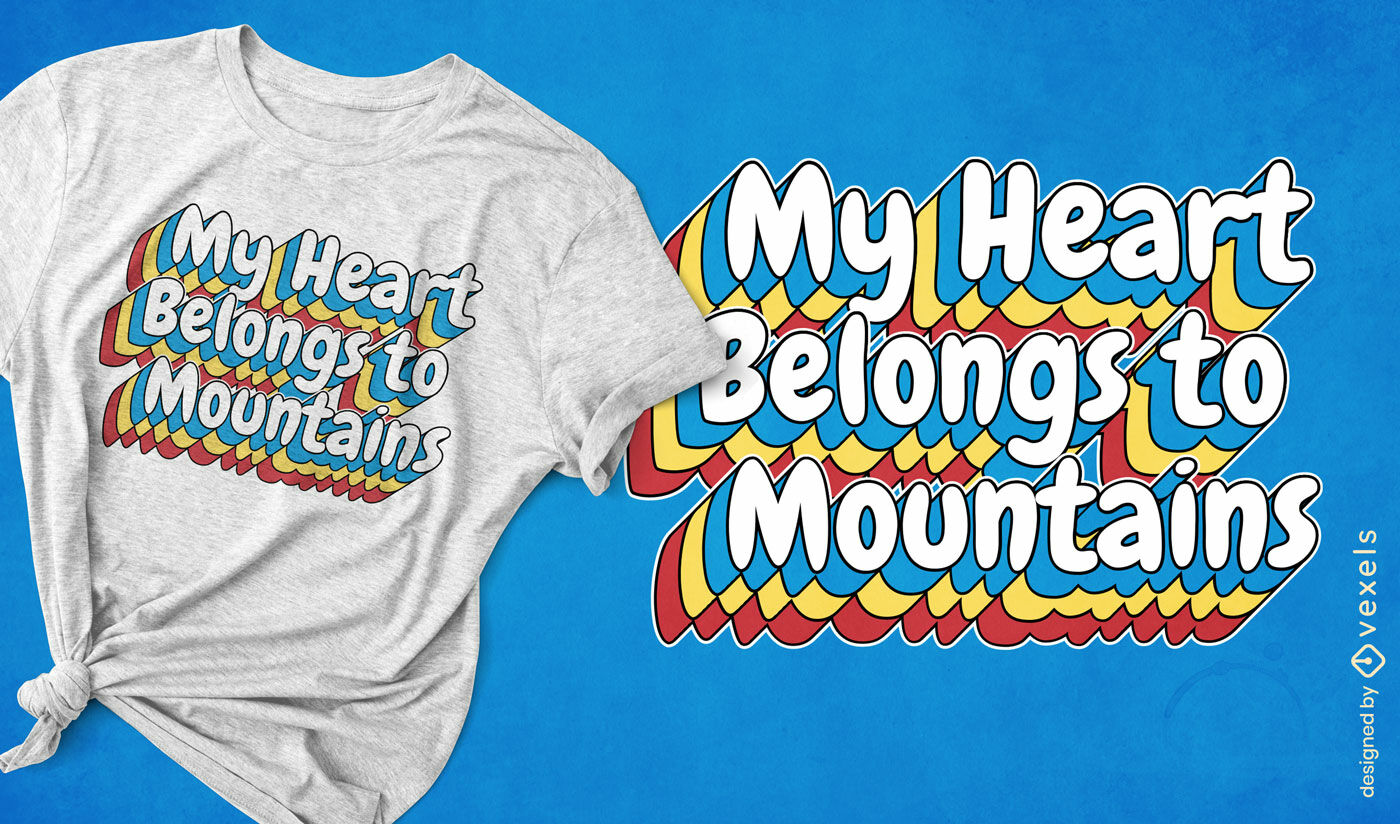
Design de camiseta com letras para amantes de montanhas
Escolha uma pasta
Todos os favoritos
Criar novo
Salvar
Design de camiseta com letras para amantes de montanhas
Pronto para imprimir
para Merch
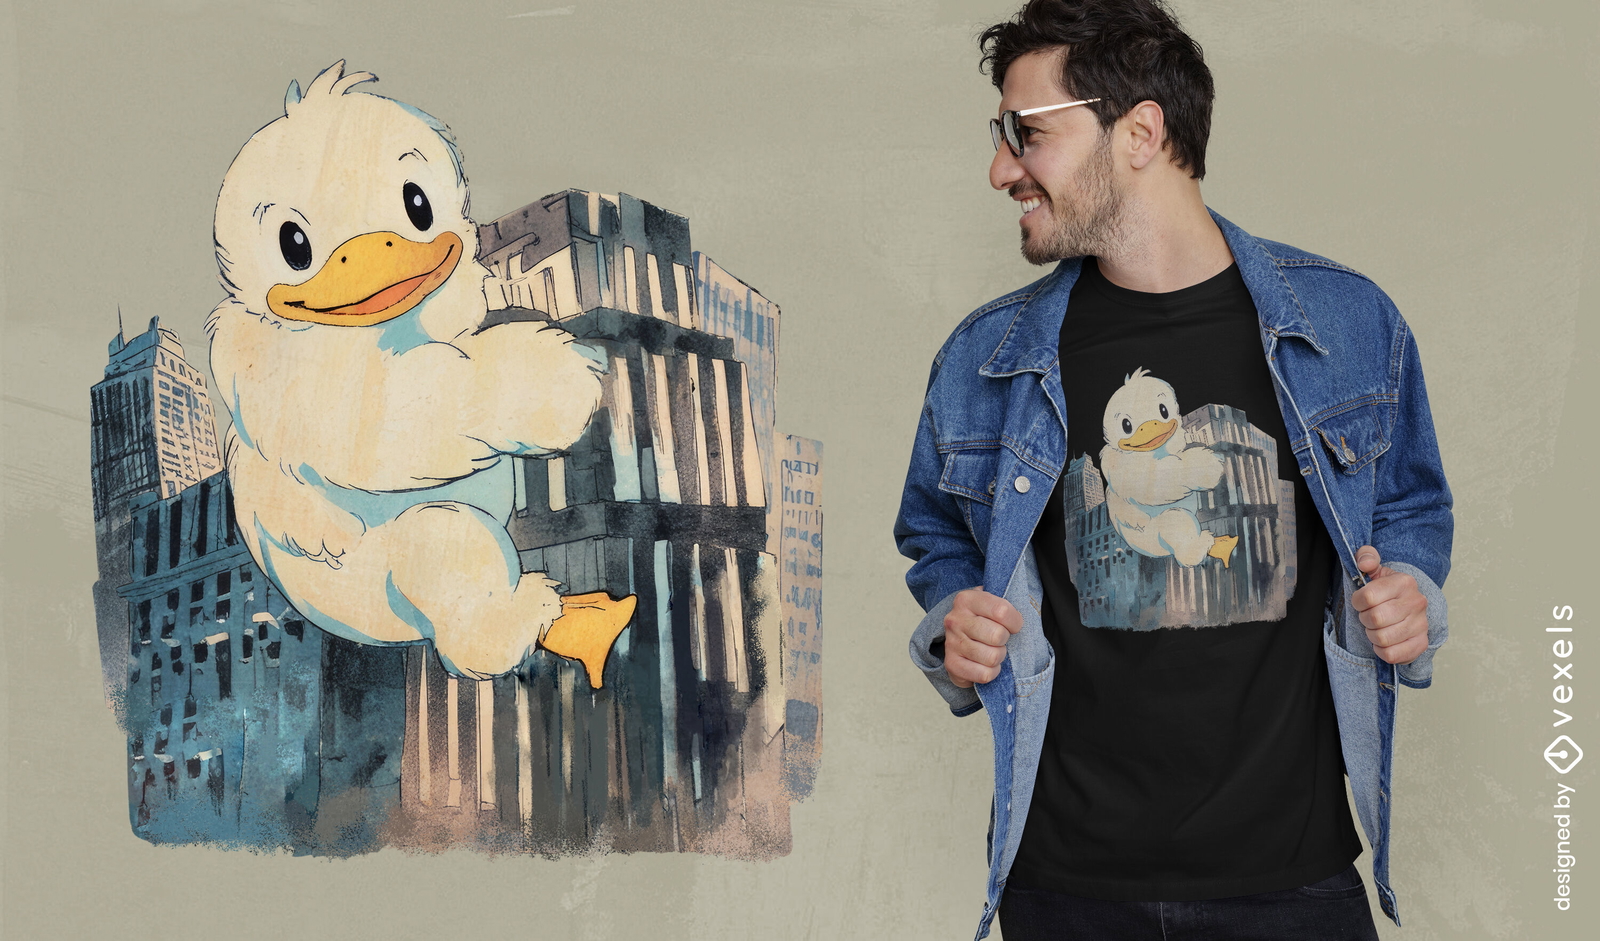
Design de camiseta com cidade de pato gigante
Escolha uma pasta
Todos os favoritos
Criar novo
Salvar
Design de camiseta com cidade de pato gigante
Pronto para imprimir
para Merch
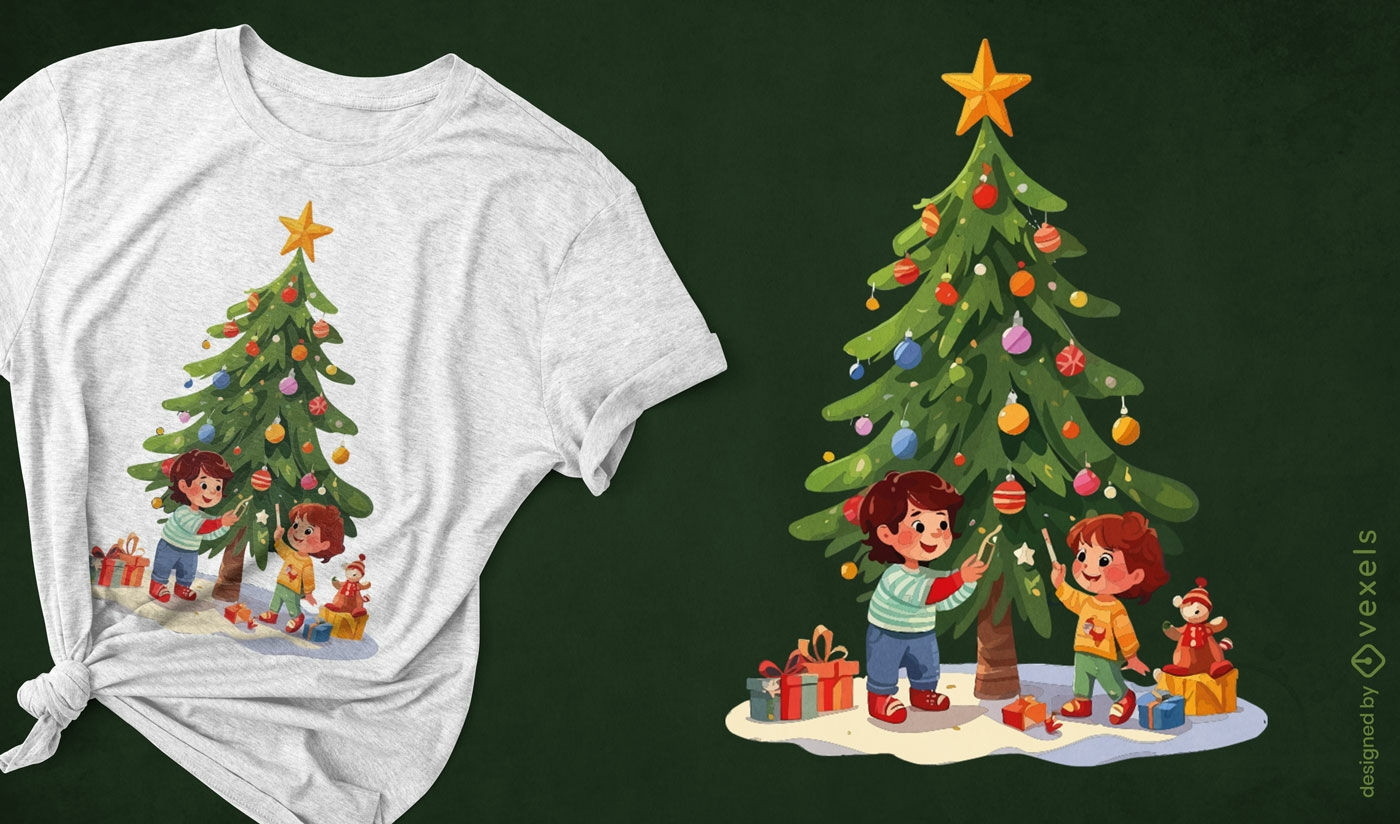
Design de camiseta infantil decorando ?rvore
Escolha uma pasta
Todos os favoritos
Criar novo
Salvar
Design de camiseta infantil decorando ?rvore
Gerado por IA, selecionado por nossos designers.
para Merch
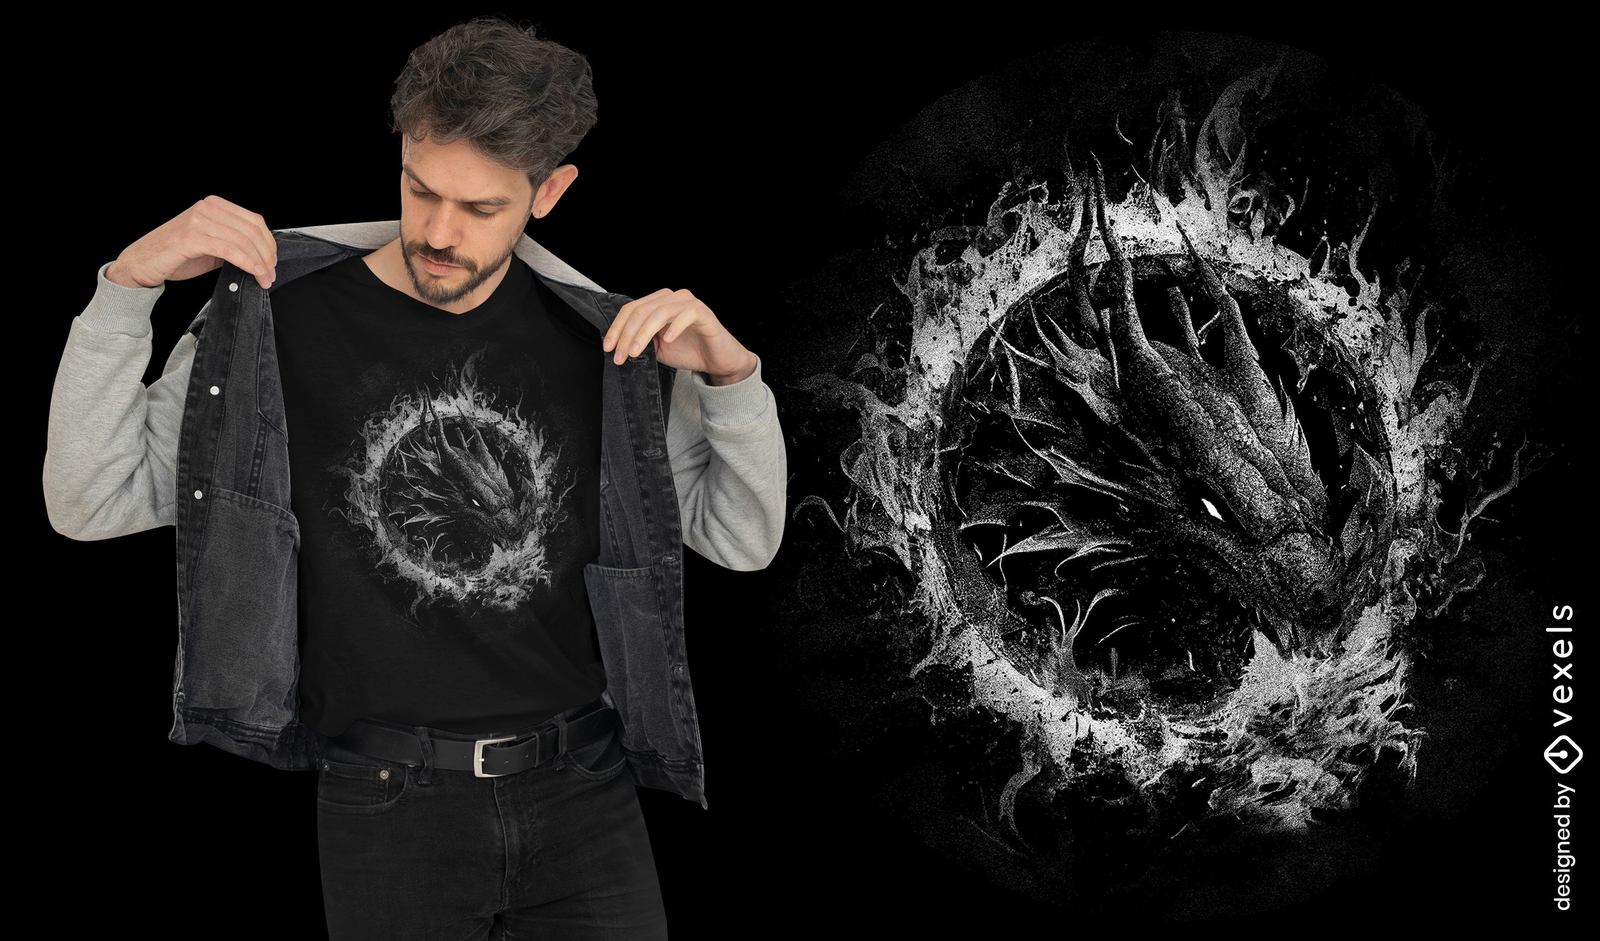
Design emergente de camiseta com dragão
Escolha uma pasta
Todos os favoritos
Criar novo
Salvar
Design emergente de camiseta com dragão
Pronto para imprimir
para Merch
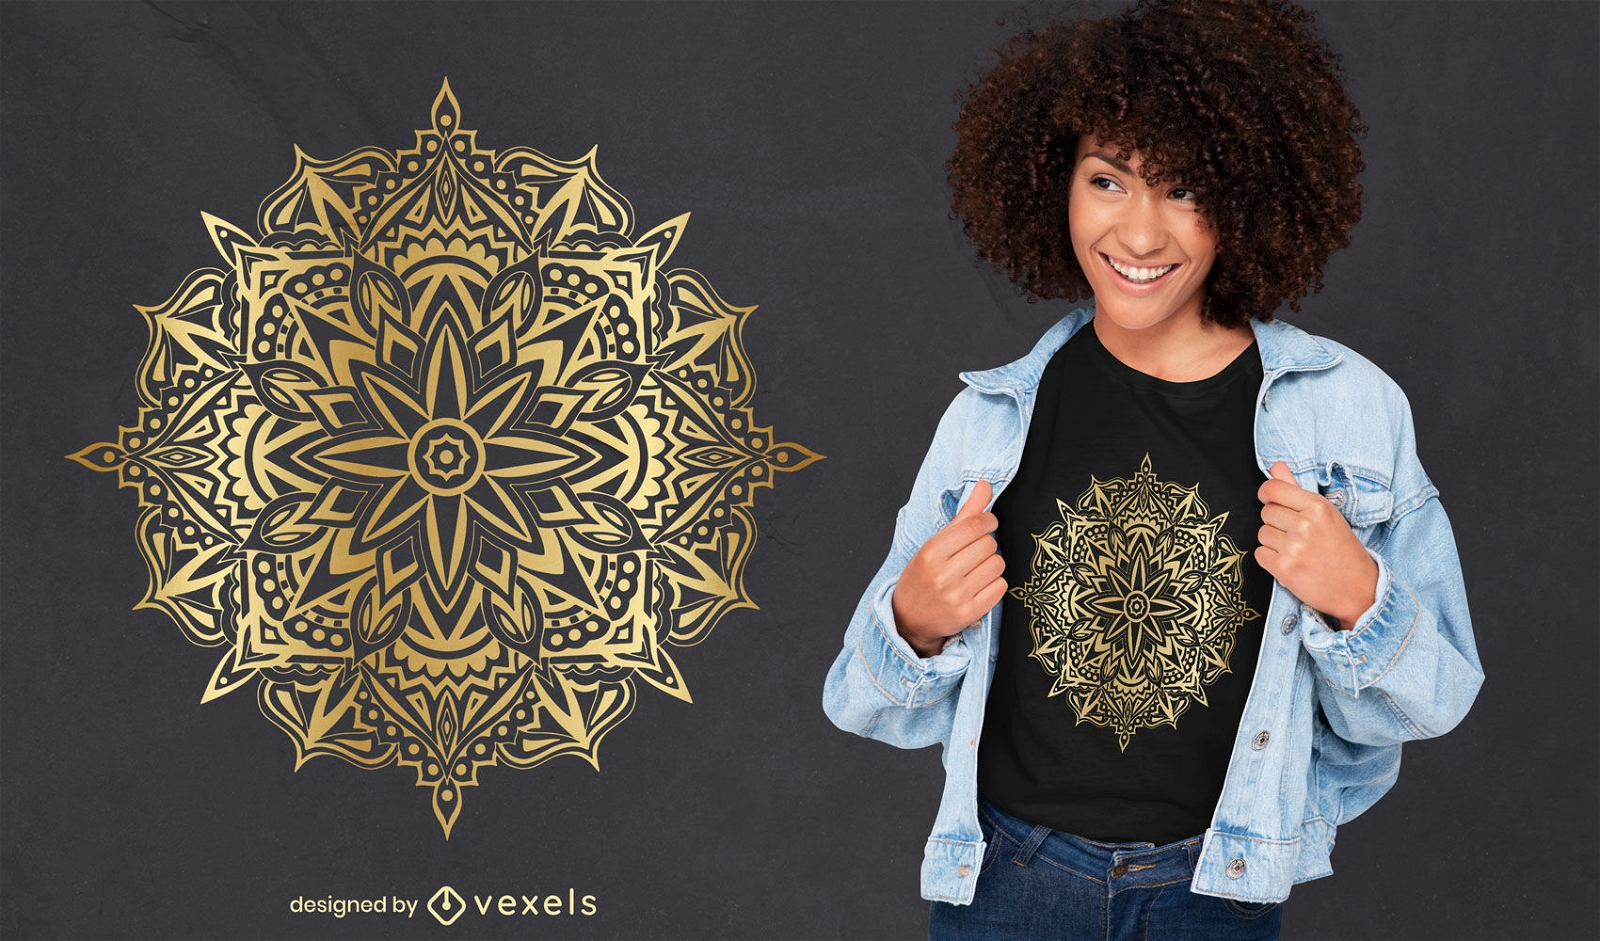
Lindo design de t-shirt com mandala dourada
Escolha uma pasta
Todos os favoritos
Criar novo
Salvar
Lindo design de t-shirt com mandala dourada
texto editável
para Merch
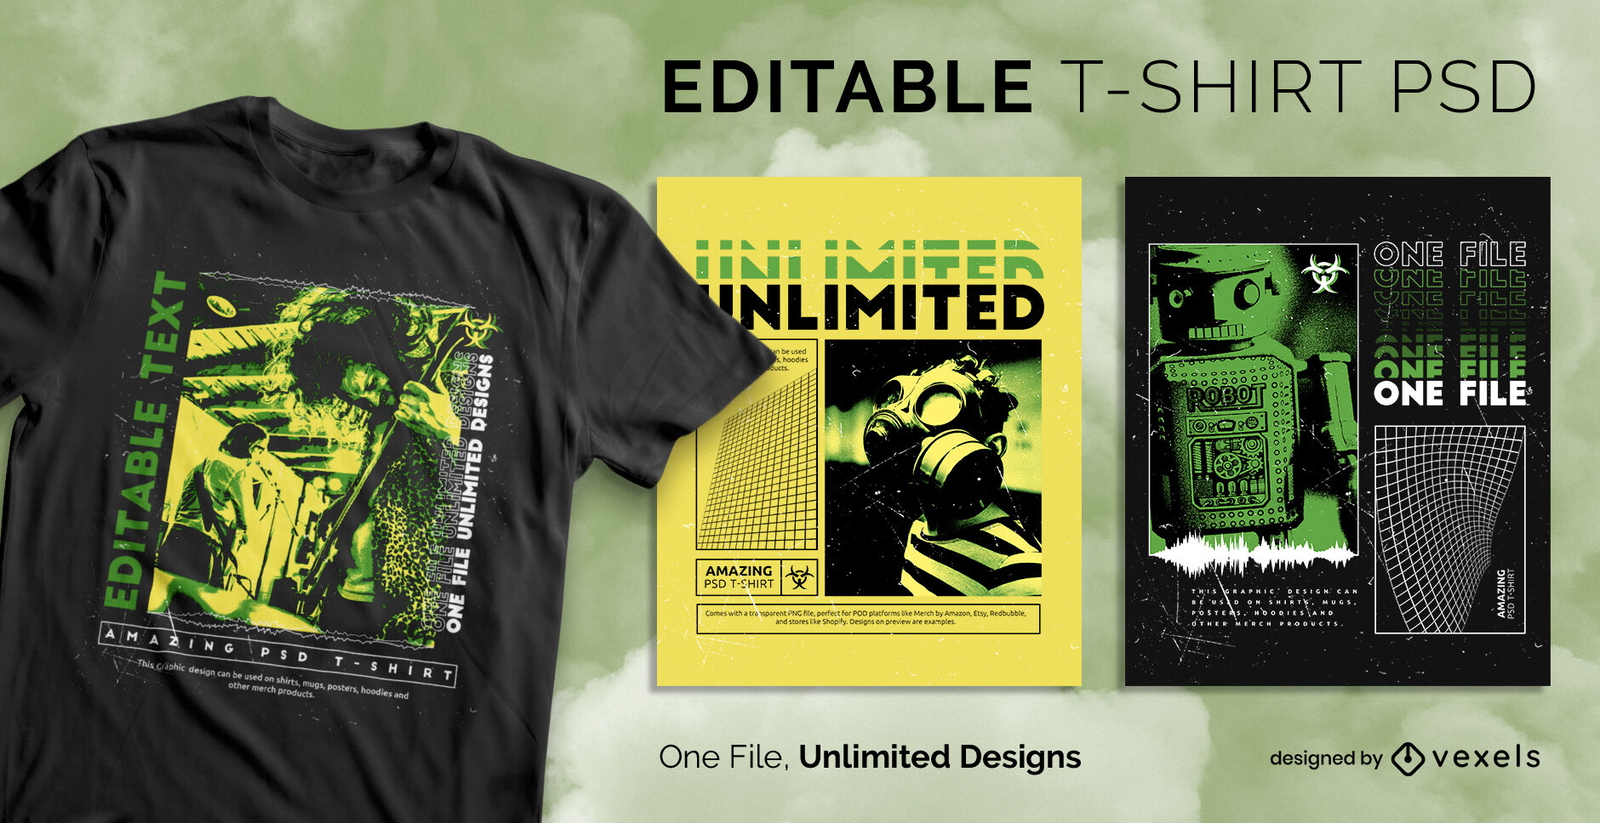
Modelo de camiseta psd escalável por ondas de vapor radioativas
Escolha uma pasta
Todos os favoritos
Criar novo
Salvar
Modelo de camiseta psd escalável por ondas de vapor radioativas
Pronto para imprimir
para Merch
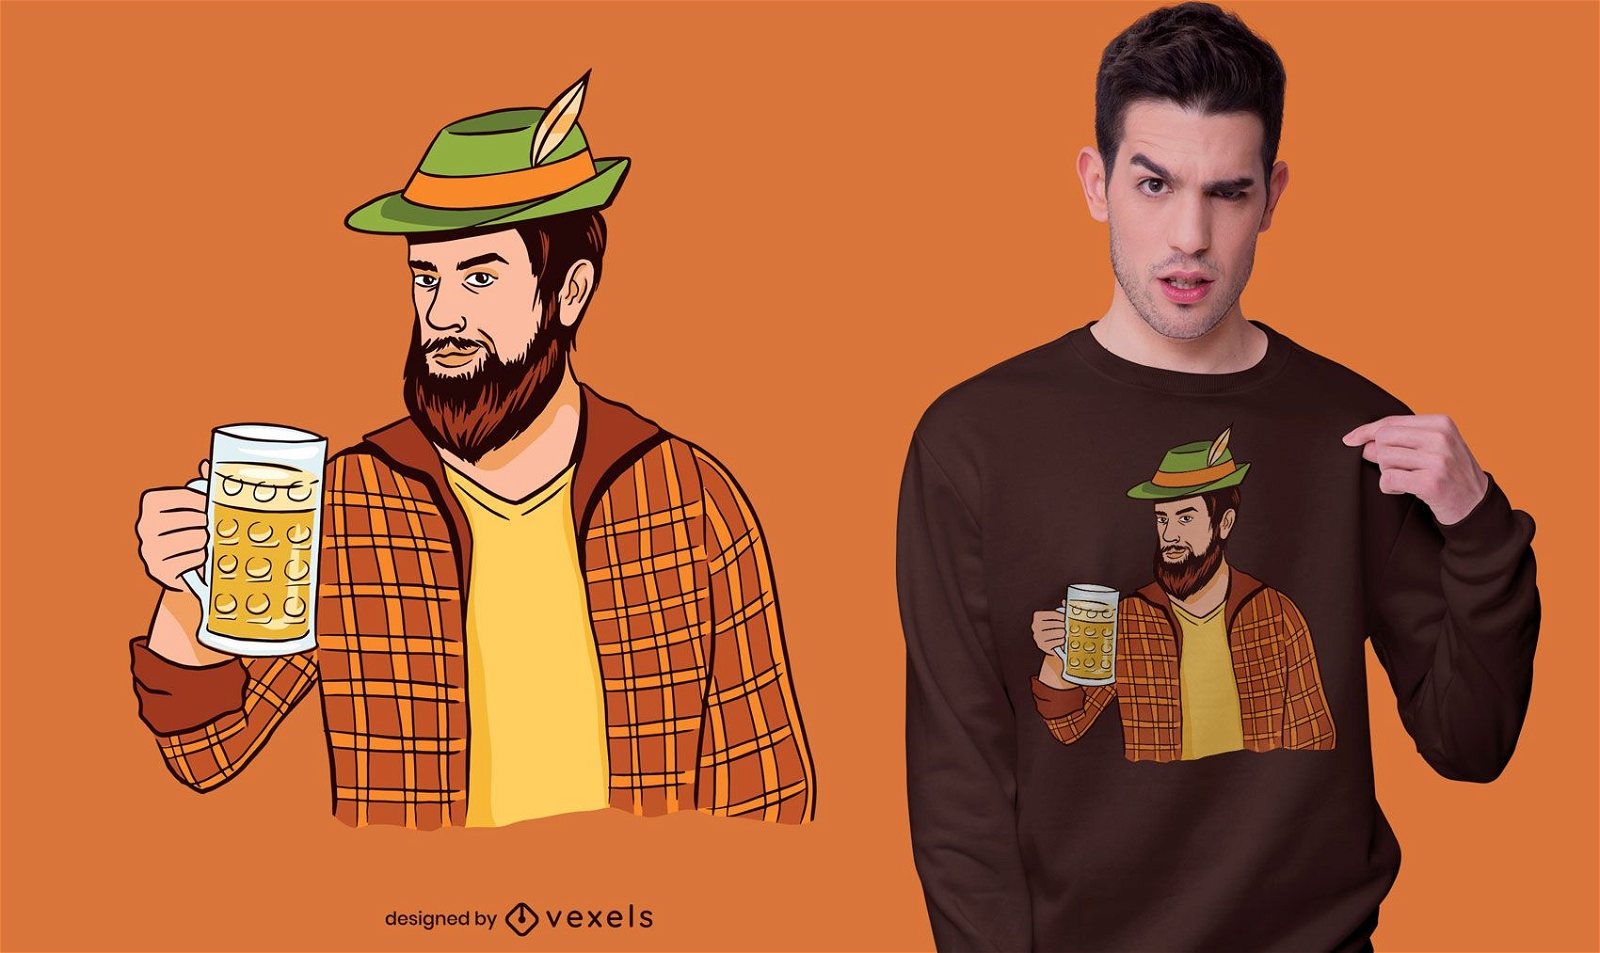
Homem hipster com design de camiseta de cerveja
Escolha uma pasta
Todos os favoritos
Criar novo
Salvar
Homem hipster com design de camiseta de cerveja
texto editável
Pronto para imprimir
para Merch
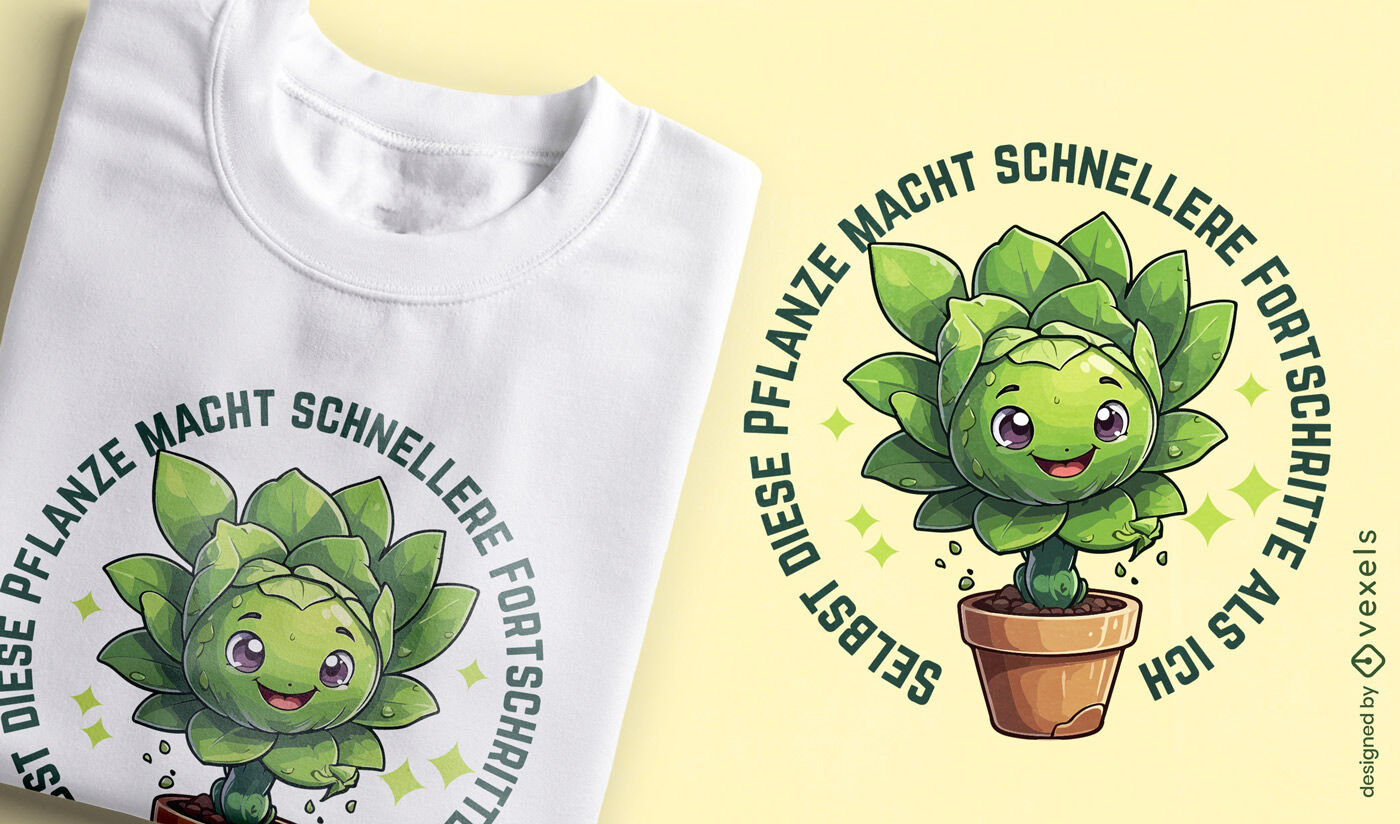
Design fofo de camiseta alemã suculenta
Escolha uma pasta
Todos os favoritos
Criar novo
Salvar
Design fofo de camiseta alemã suculenta
texto editável
Pronto para imprimir
para Merch
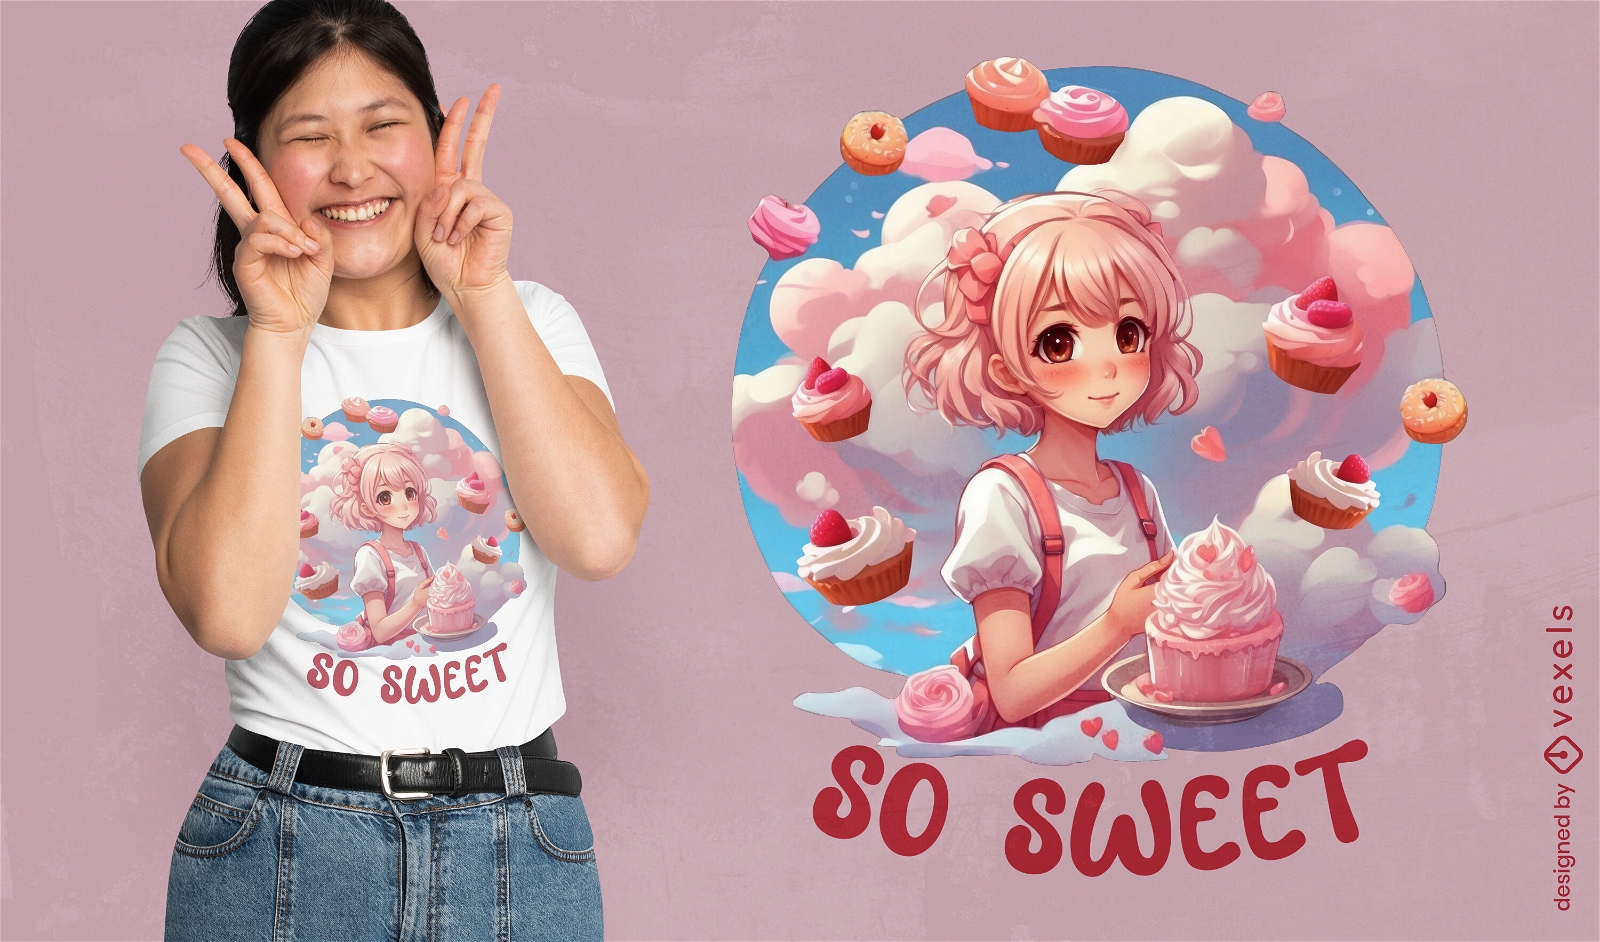
Design de camisetas com sobremesas de anime
Escolha uma pasta
Todos os favoritos
Criar novo
Salvar
Design de camisetas com sobremesas de anime
texto editável
Pronto para imprimir
para Merch
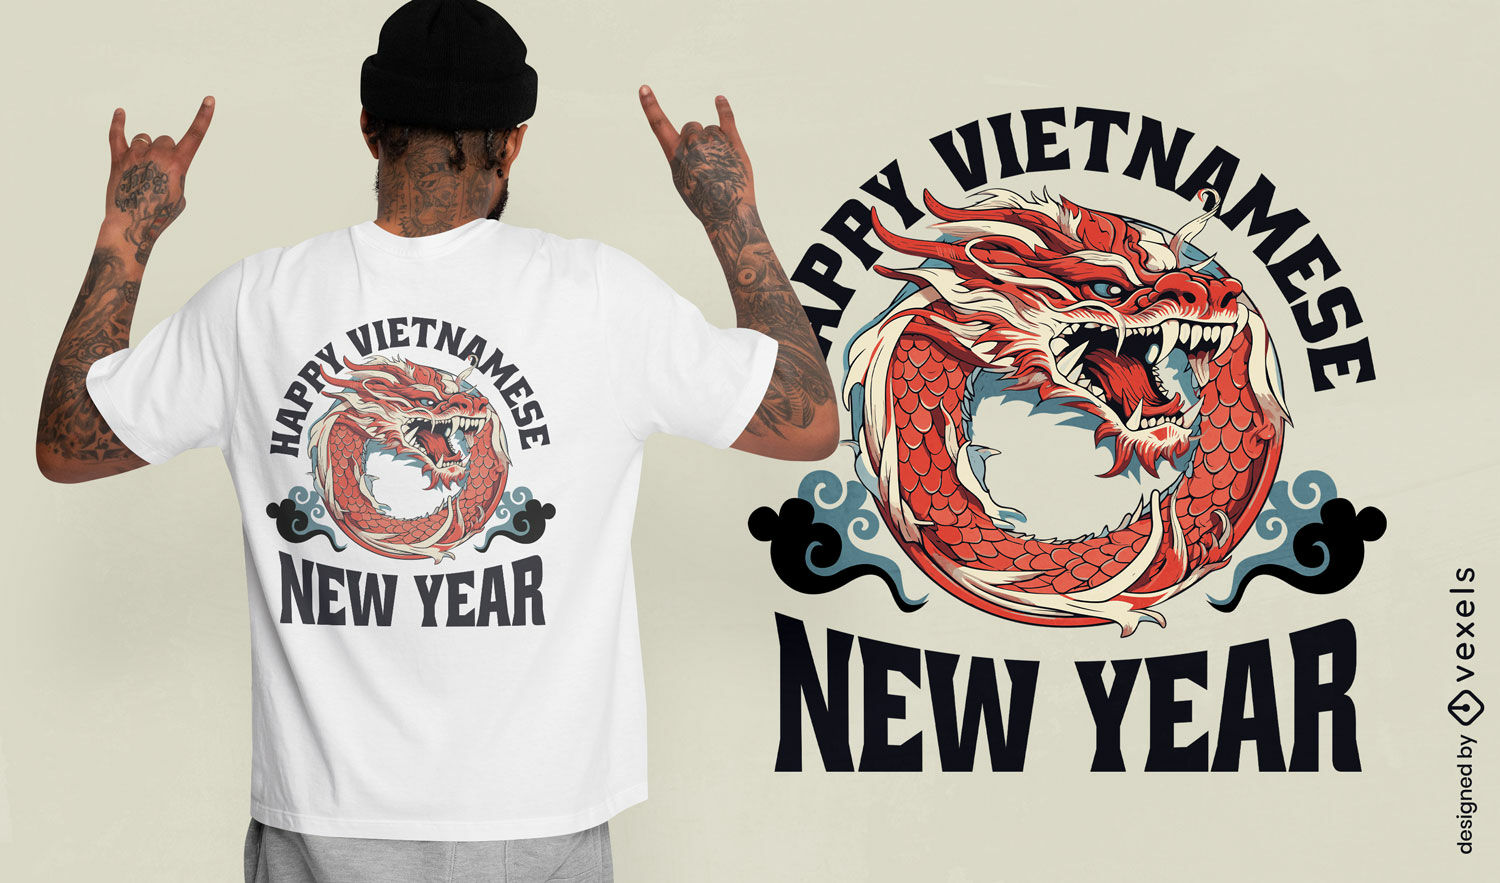
Feliz ano novo vietnamita com design de camiseta com drag?o
Escolha uma pasta
Todos os favoritos
Criar novo
Salvar
Feliz ano novo vietnamita com design de camiseta com drag?o
Pronto para imprimir
para Merch
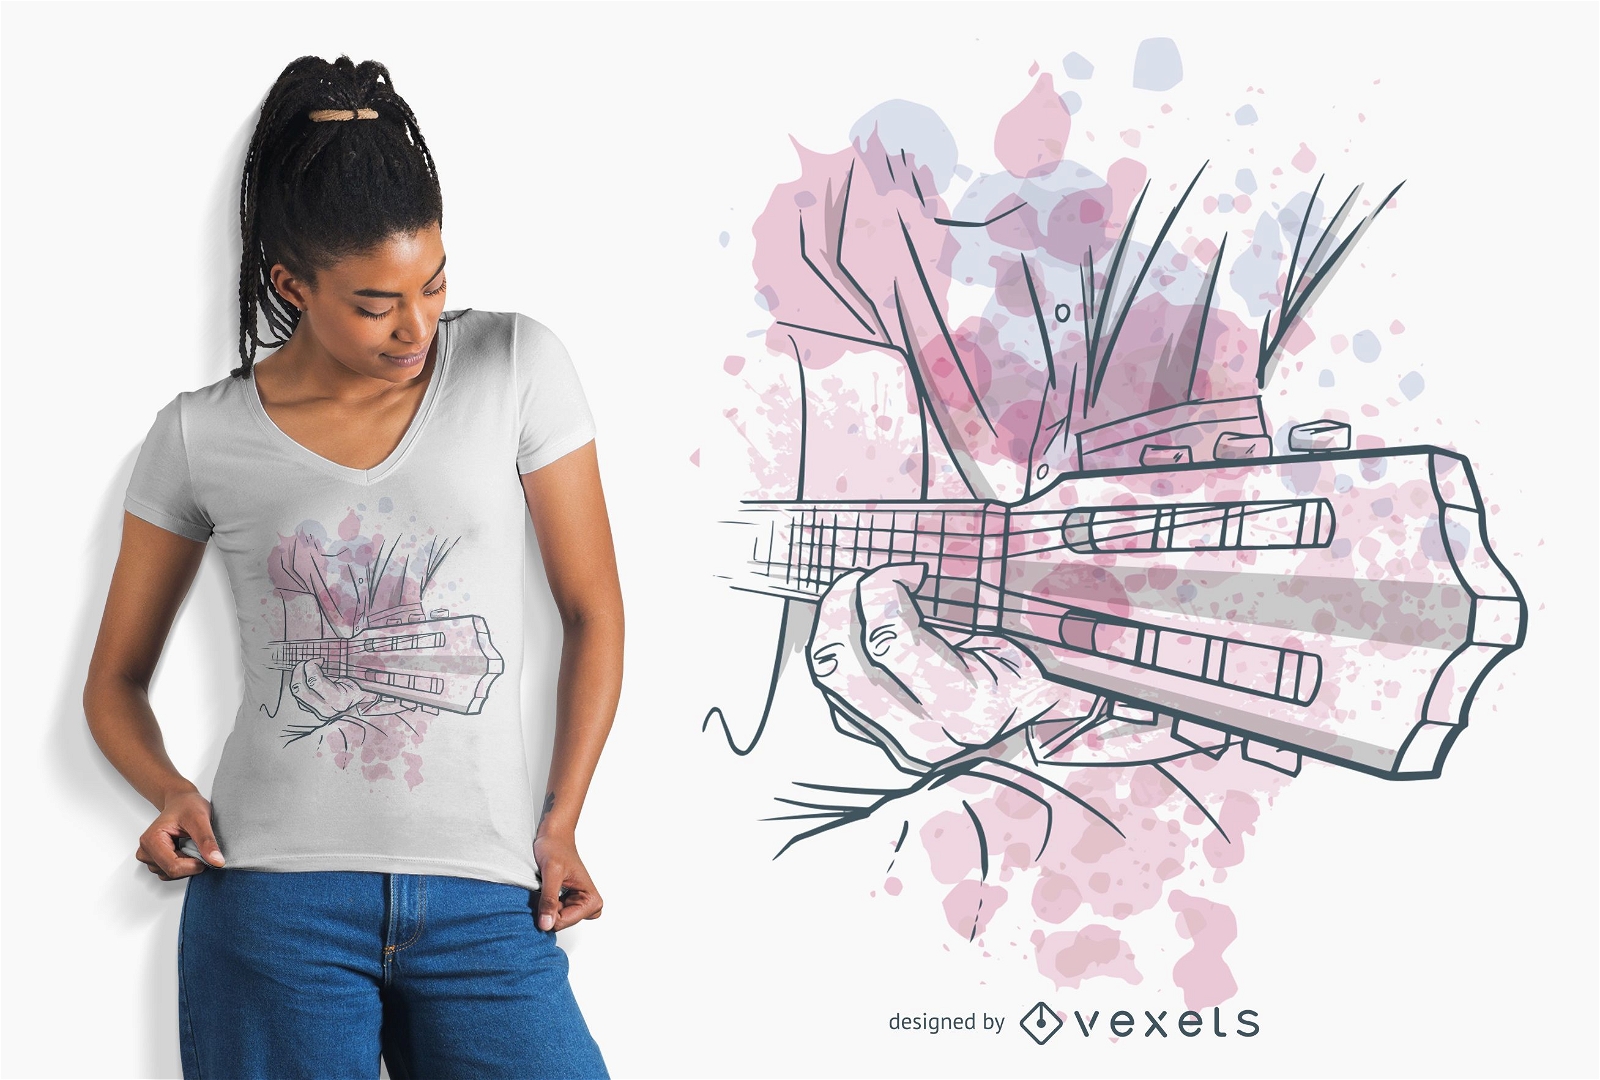
Guitarra Tocando Aquarela Design de Camiseta
Escolha uma pasta
Todos os favoritos
Criar novo
Salvar
Guitarra Tocando Aquarela Design de Camiseta
Gerado por IA, selecionado por nossos designers.
para Merch
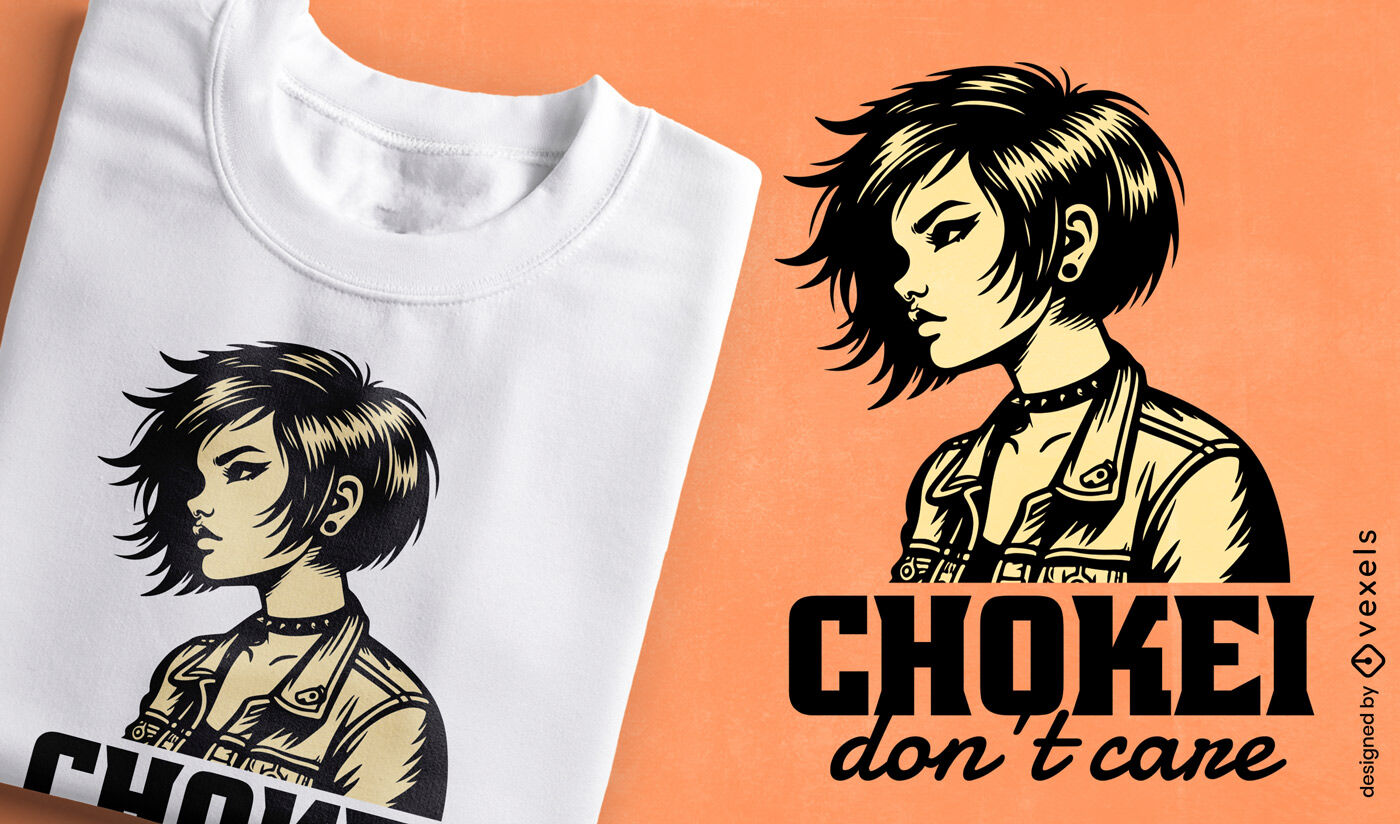
Design de camiseta com atitude de garota punk
Escolha uma pasta
Todos os favoritos
Criar novo
Salvar
Design de camiseta com atitude de garota punk
texto editável
Pronto para imprimir
para Merch
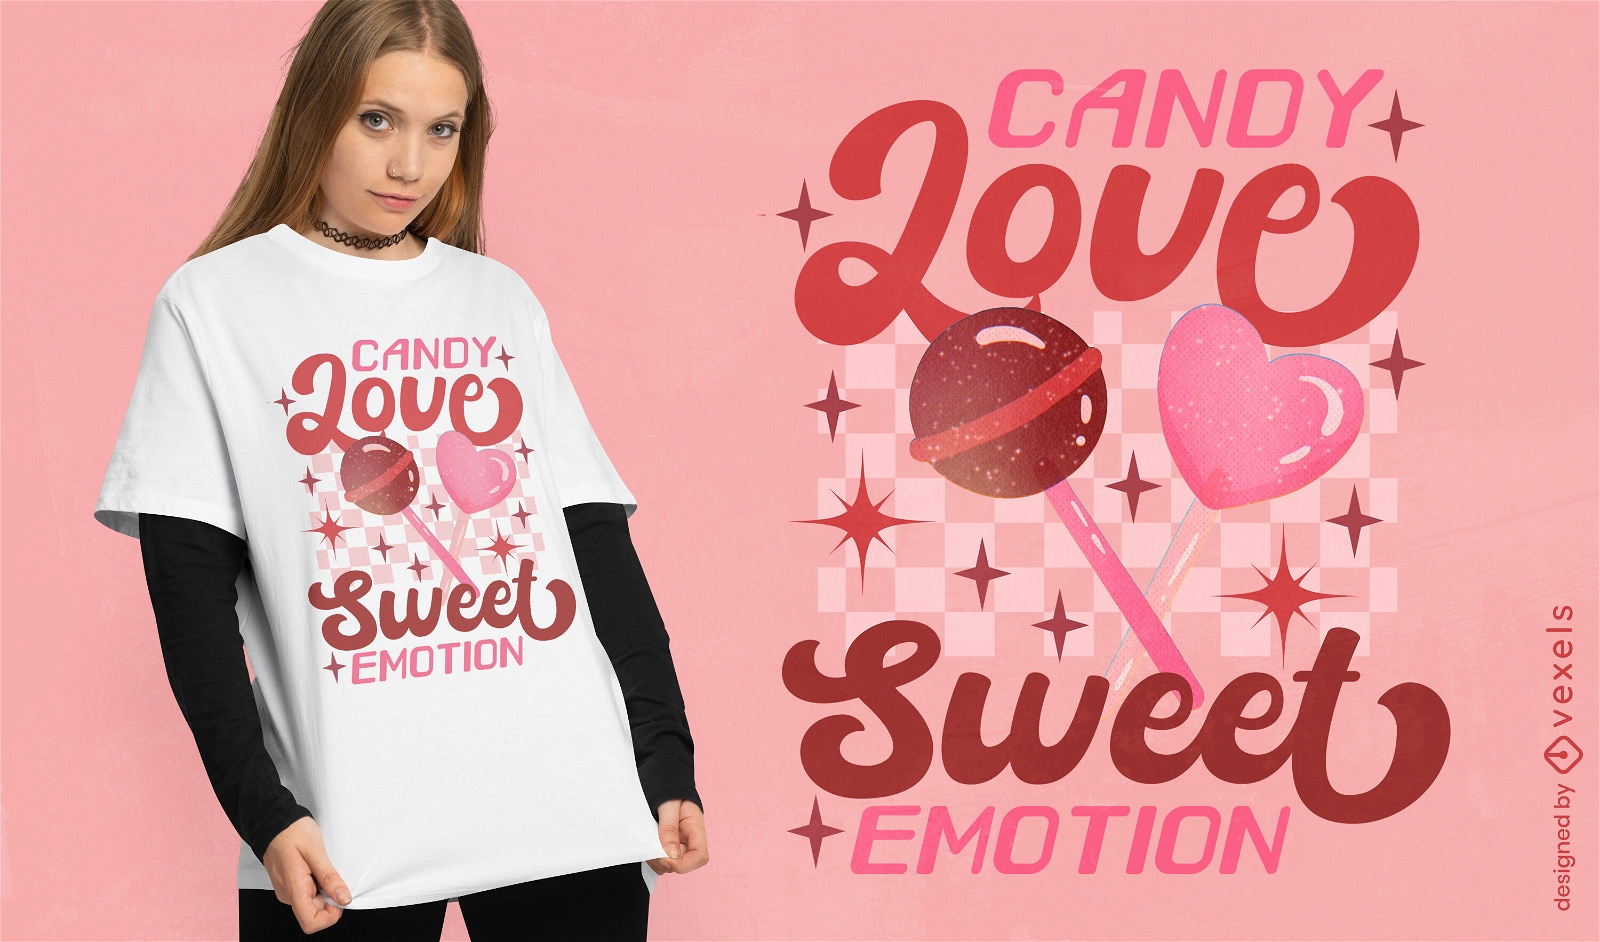
Design de camiseta com amor doce
Escolha uma pasta
Todos os favoritos
Criar novo
Salvar
Design de camiseta com amor doce
Pronto para imprimir
para Merch
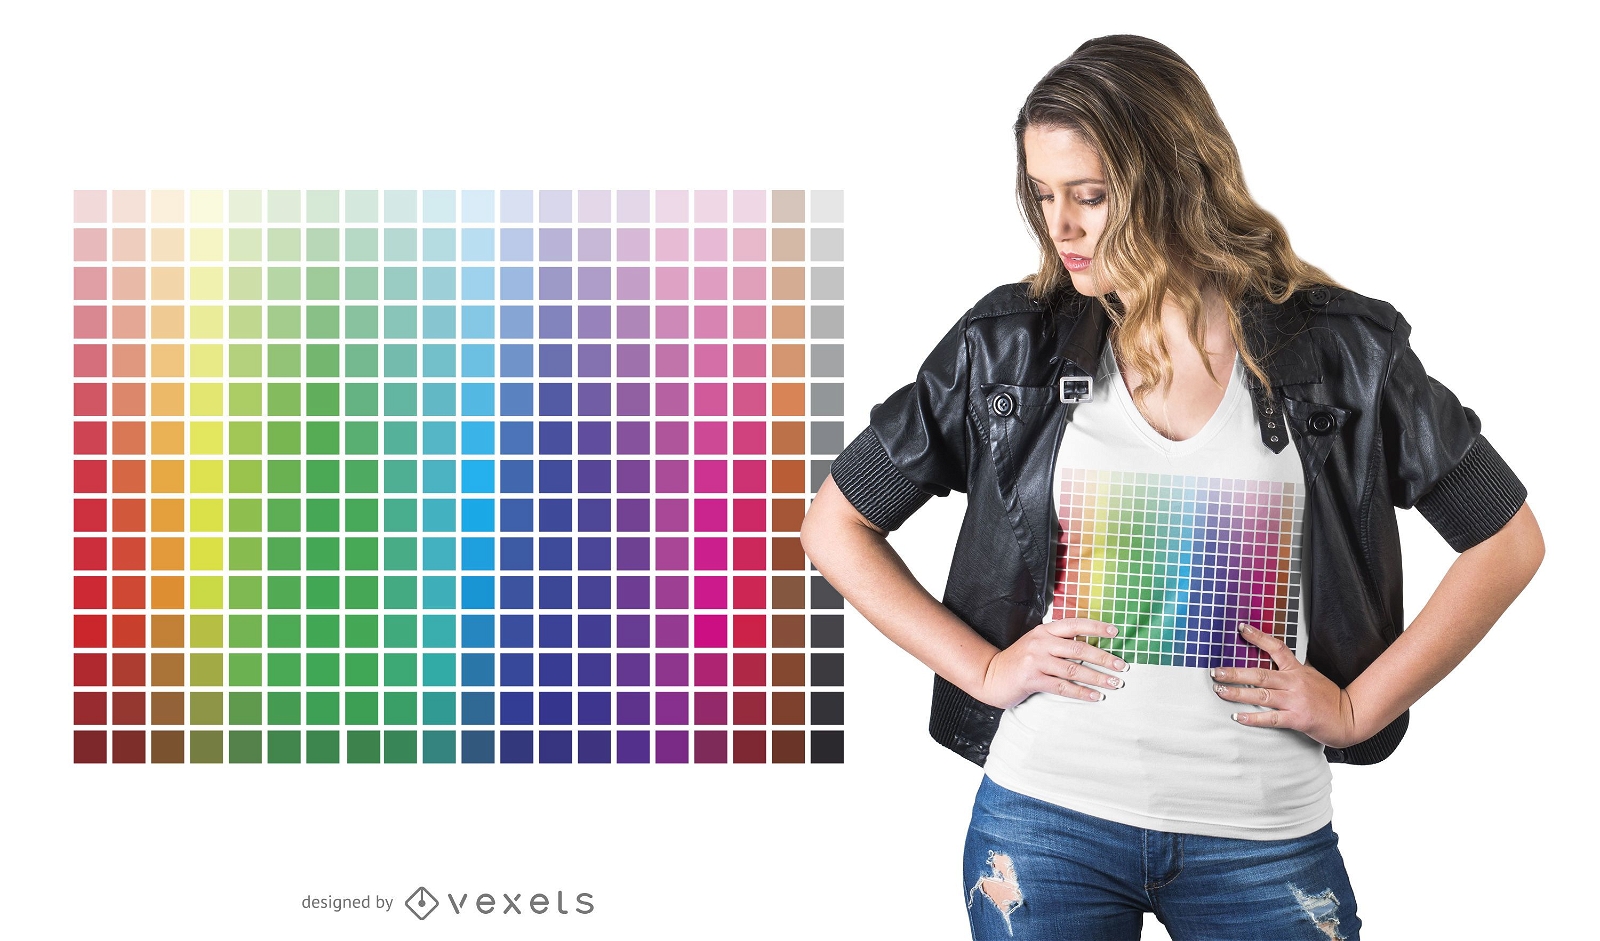
Design de camiseta colorida
Escolha uma pasta
Todos os favoritos
Criar novo
Salvar
Design de camiseta colorida
Pronto para imprimir
para Merch
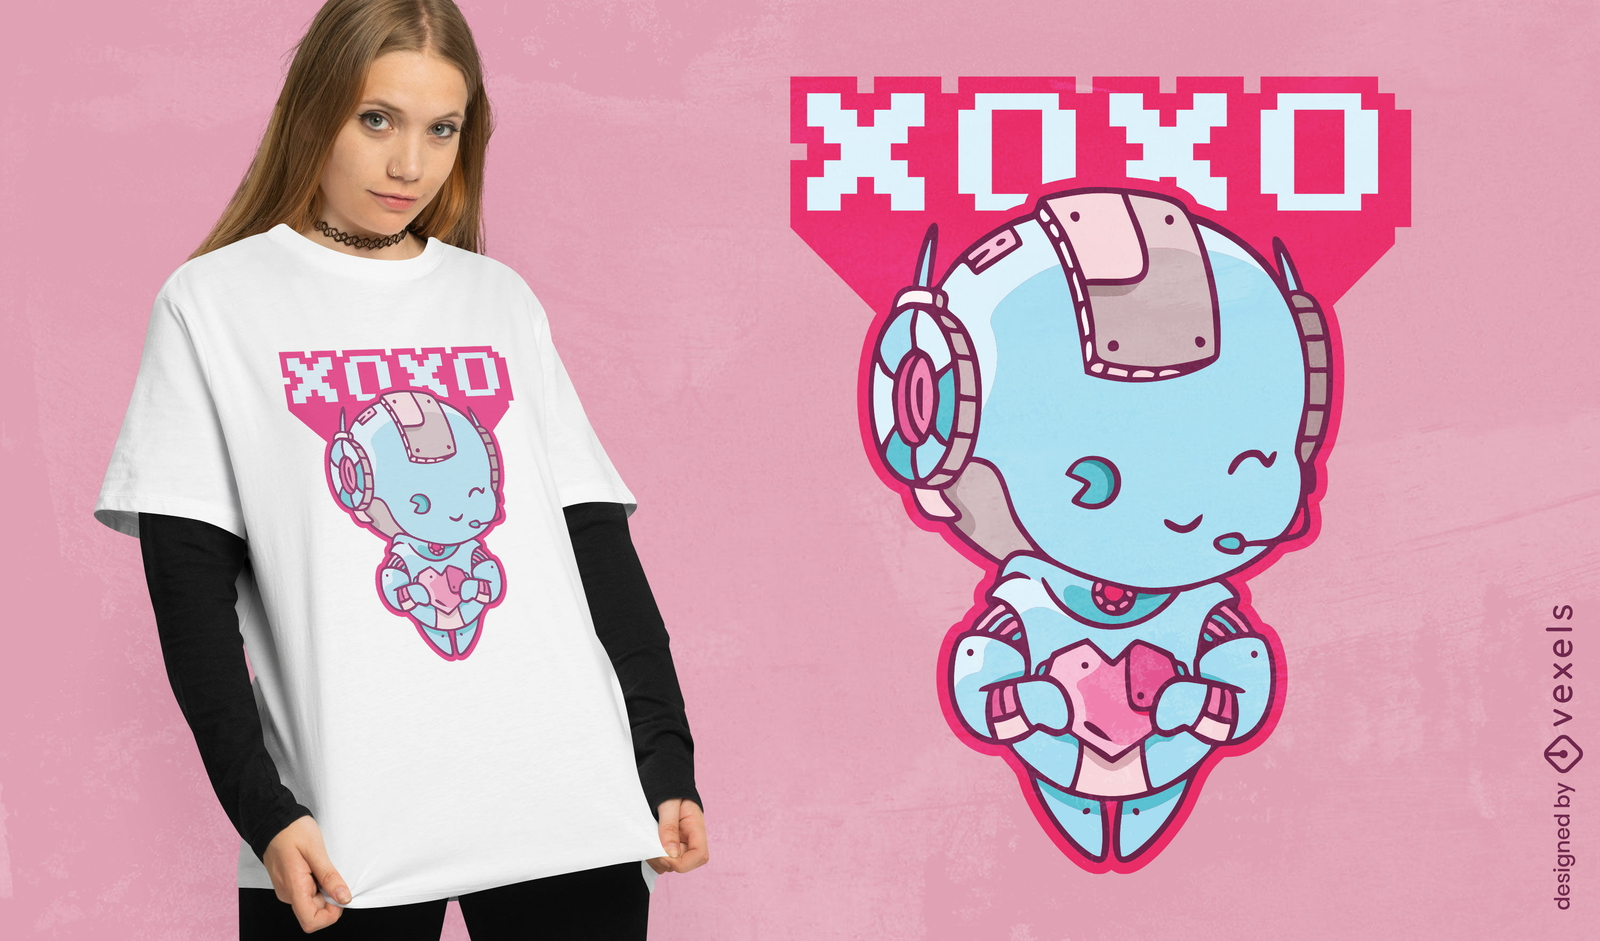
Design de camiseta Robot Love Xoxo
Escolha uma pasta
Todos os favoritos
Criar novo
Salvar
Design de camiseta Robot Love Xoxo
texto editável
Pronto para imprimir
para Merch
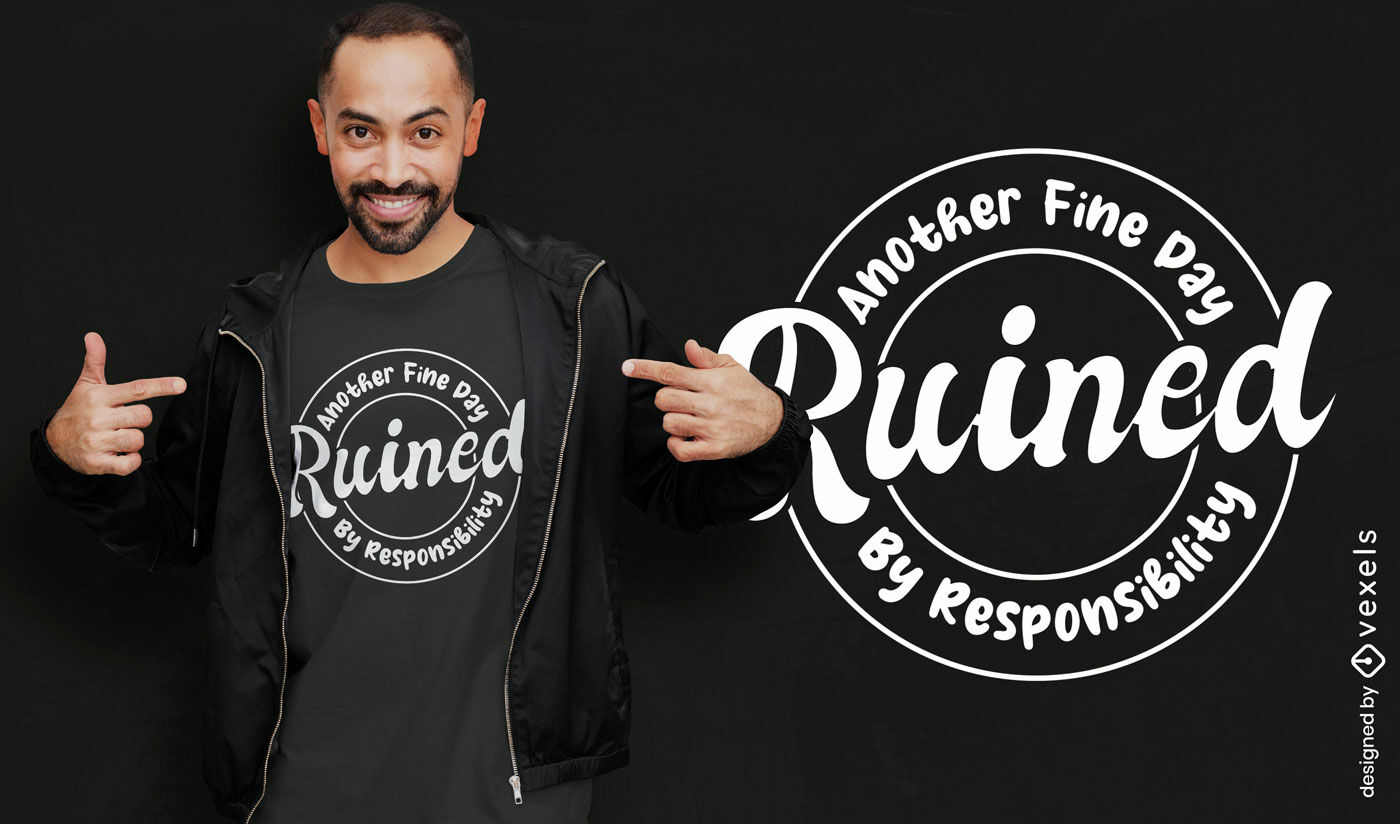
Design de camiseta com citação de responsabilidade arruinada
Escolha uma pasta
Todos os favoritos
Criar novo
Salvar
Design de camiseta com citação de responsabilidade arruinada
Gerado por IA, selecionado por nossos designers.
para Merch
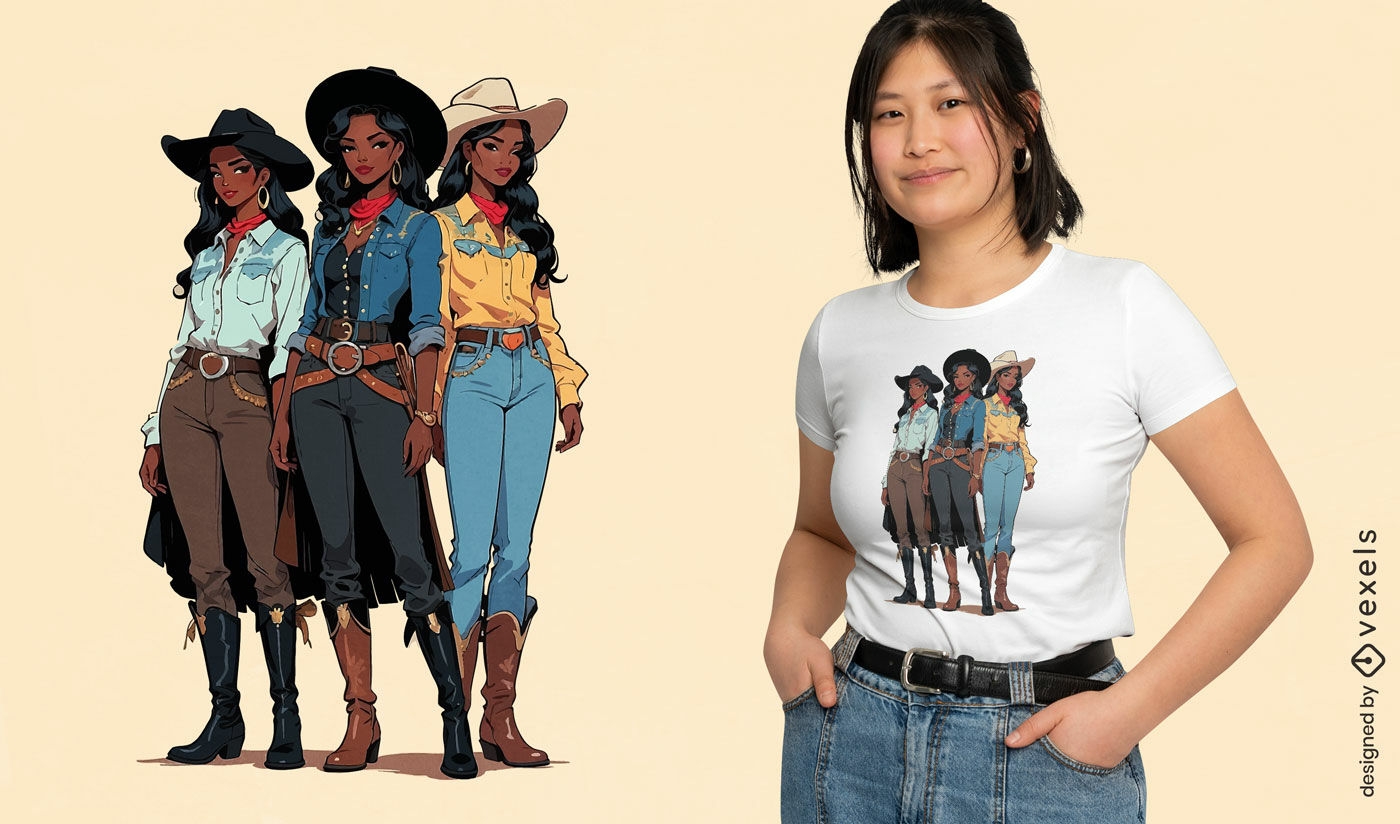
Design de camiseta do grupo de vaqueiras
Escolha uma pasta
Todos os favoritos
Criar novo
Salvar
Design de camiseta do grupo de vaqueiras
texto editável
Pronto para imprimir
para Merch
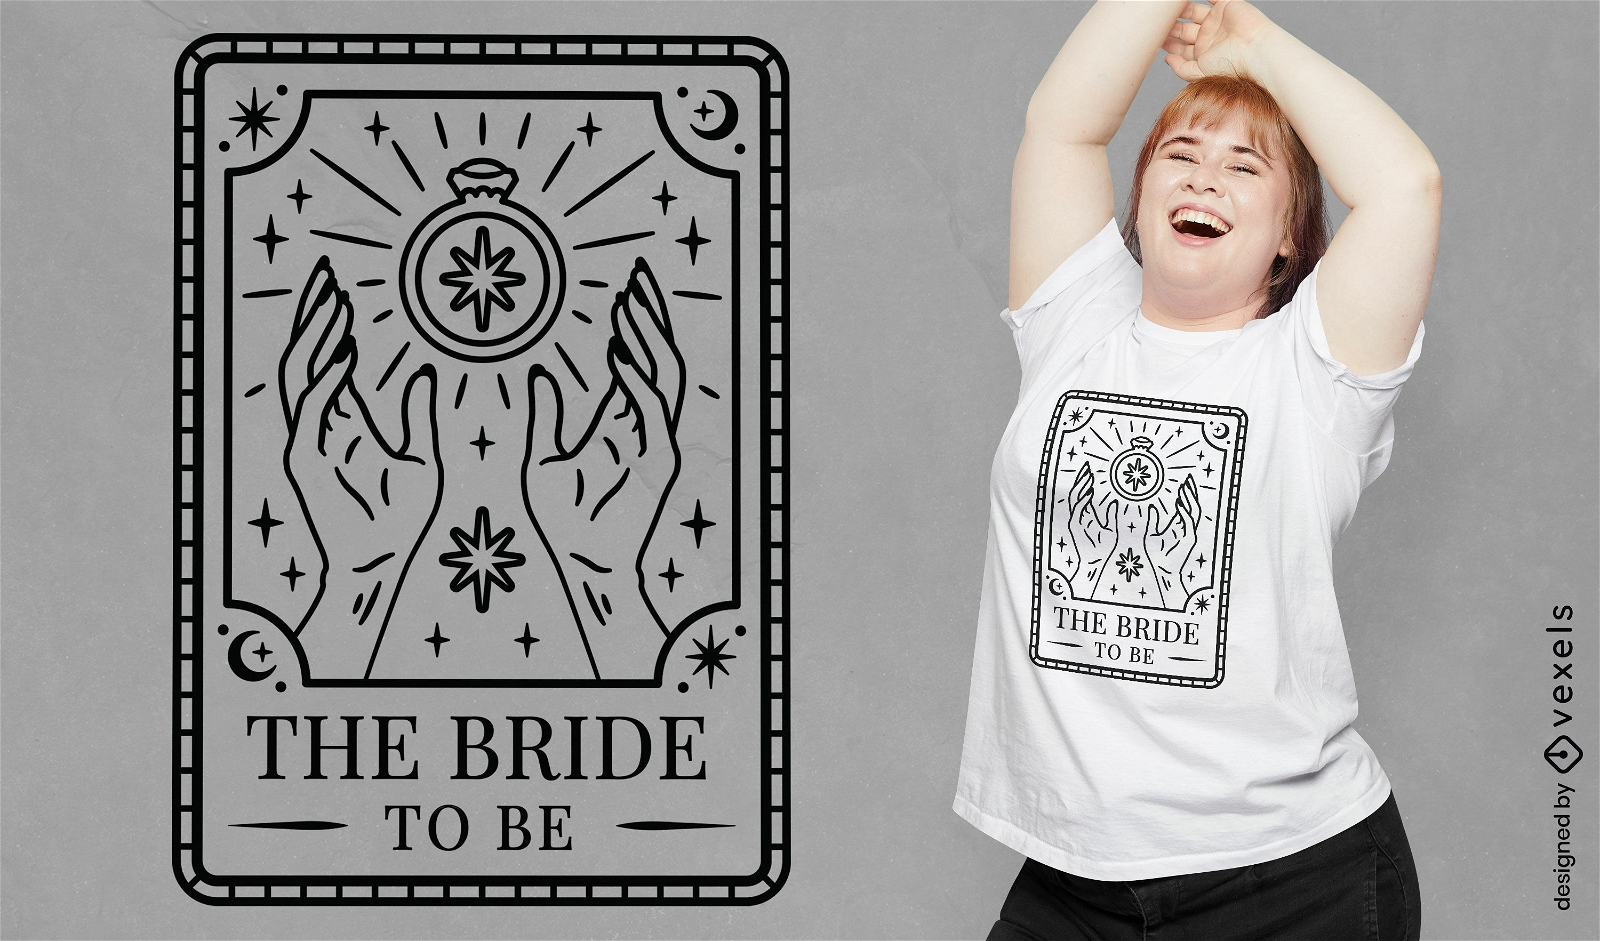
Antecipando o design da camiseta da noiva
Escolha uma pasta
Todos os favoritos
Criar novo
Salvar
Antecipando o design da camiseta da noiva
texto editável
Pronto para imprimir
para Merch
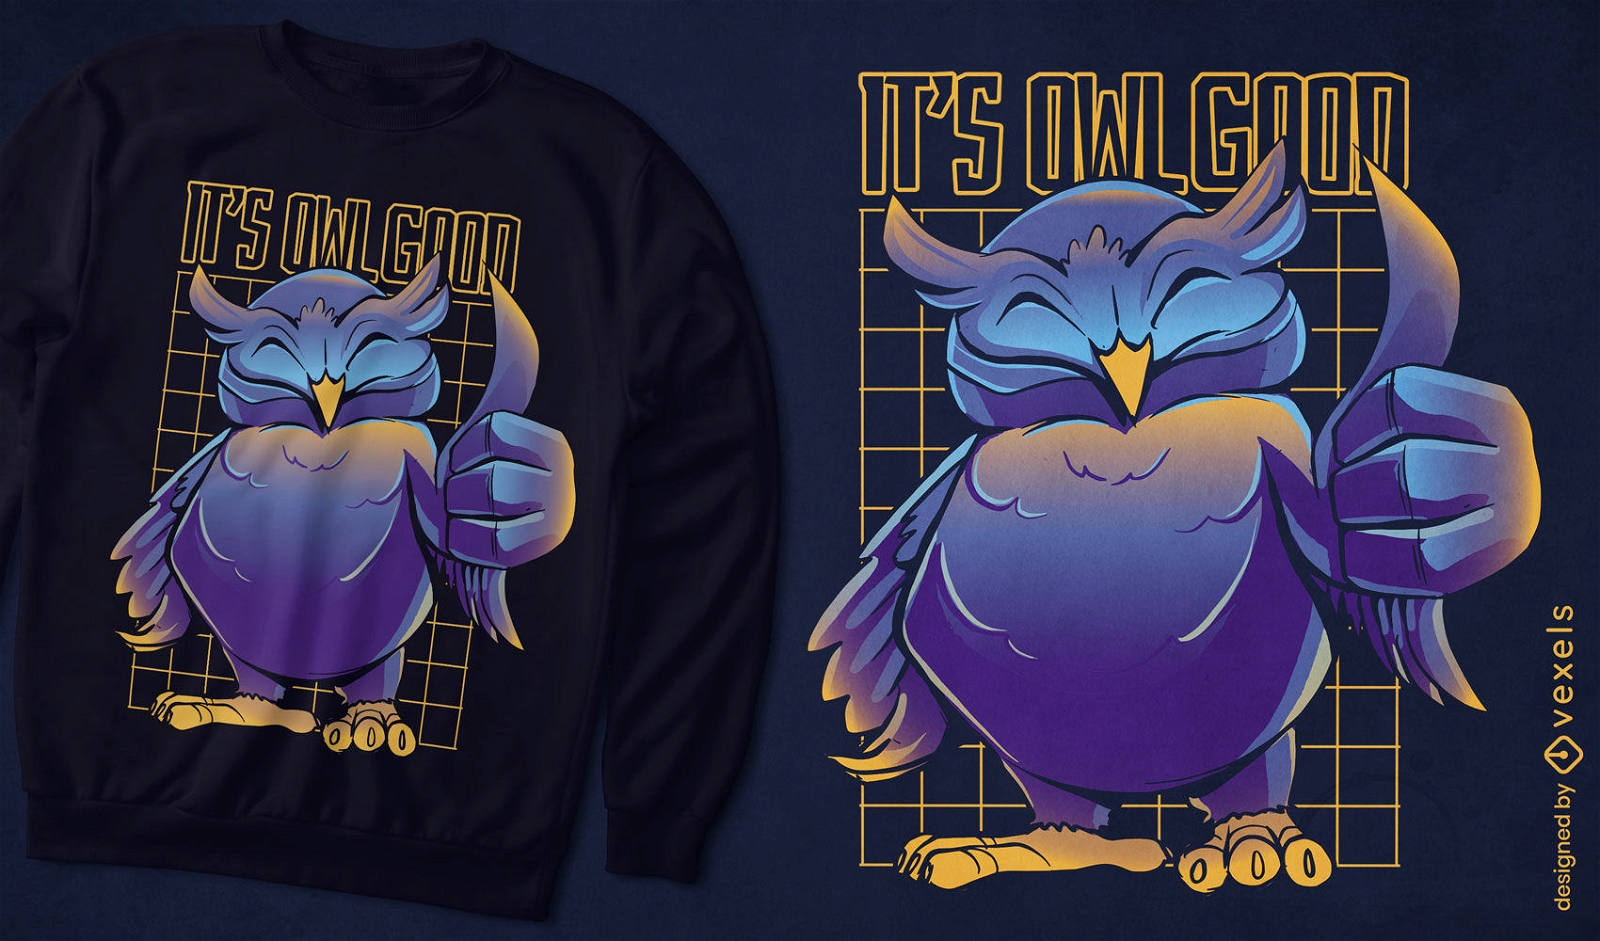
Bom design de camiseta de coruja
Escolha uma pasta
Todos os favoritos
Criar novo
Salvar
Bom design de camiseta de coruja
Camiseta PSD escalável
para Merch
Modelo de t-shirt escalável em forma de dissolução
Escolha uma pasta
Todos os favoritos
Criar novo
Salvar
Modelo de t-shirt escalável em forma de dissolução
Pronto para imprimir
para Merch
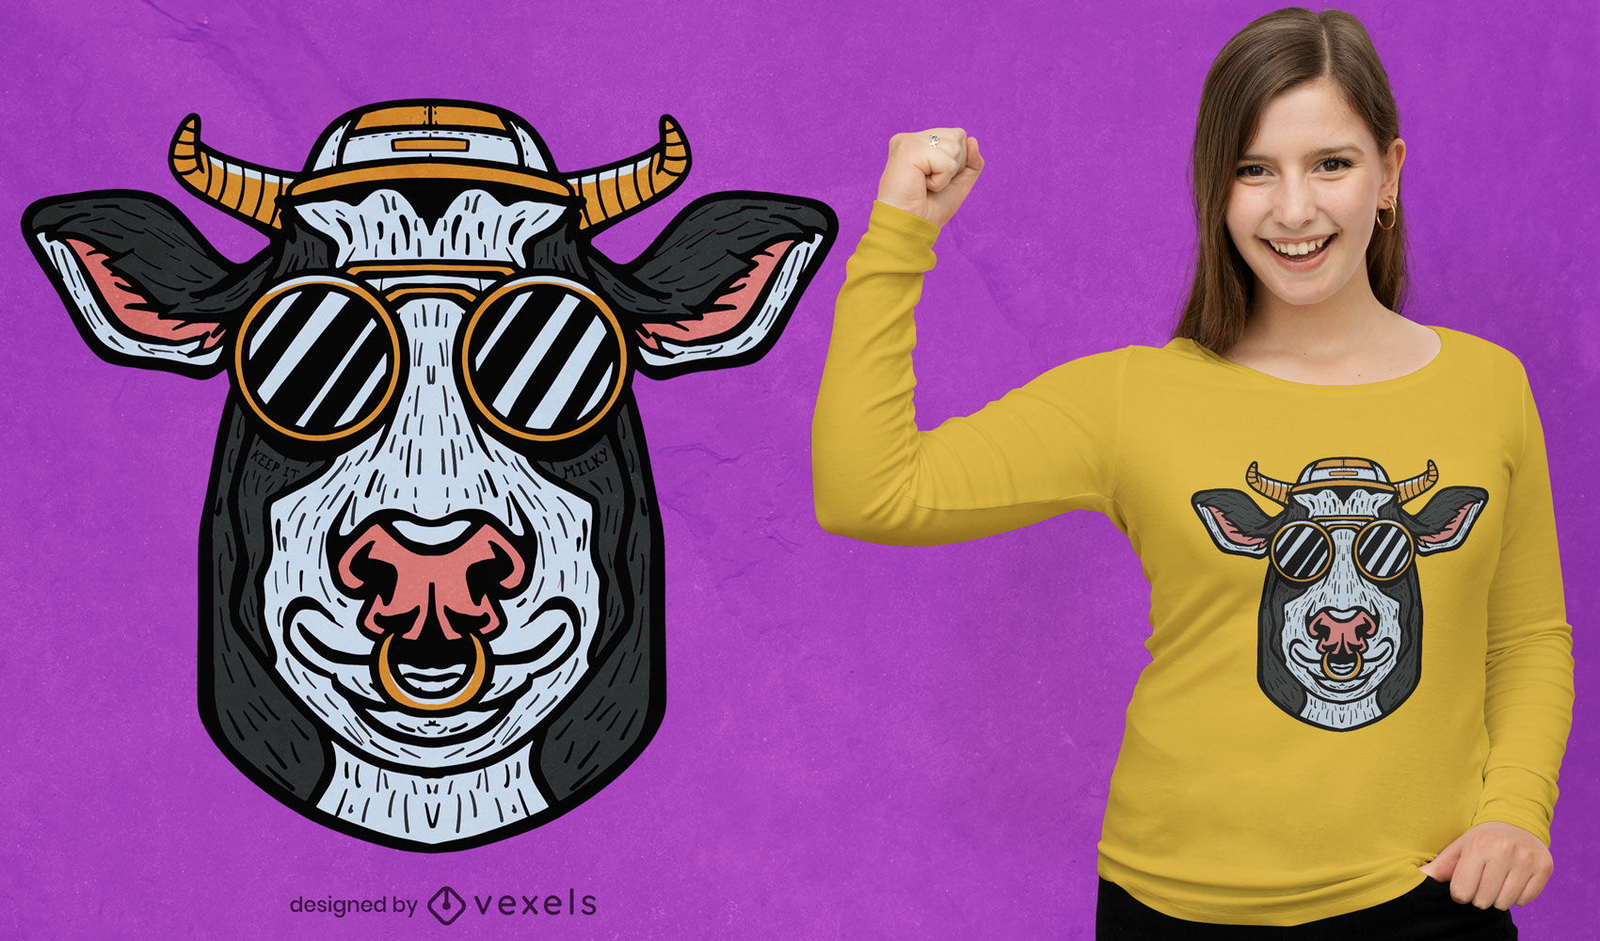
Animal vaca com design de t-shirt de óculos de sol
Escolha uma pasta
Todos os favoritos
Criar novo
Salvar
Animal vaca com design de t-shirt de óculos de sol
Pronto para imprimir
para Merch
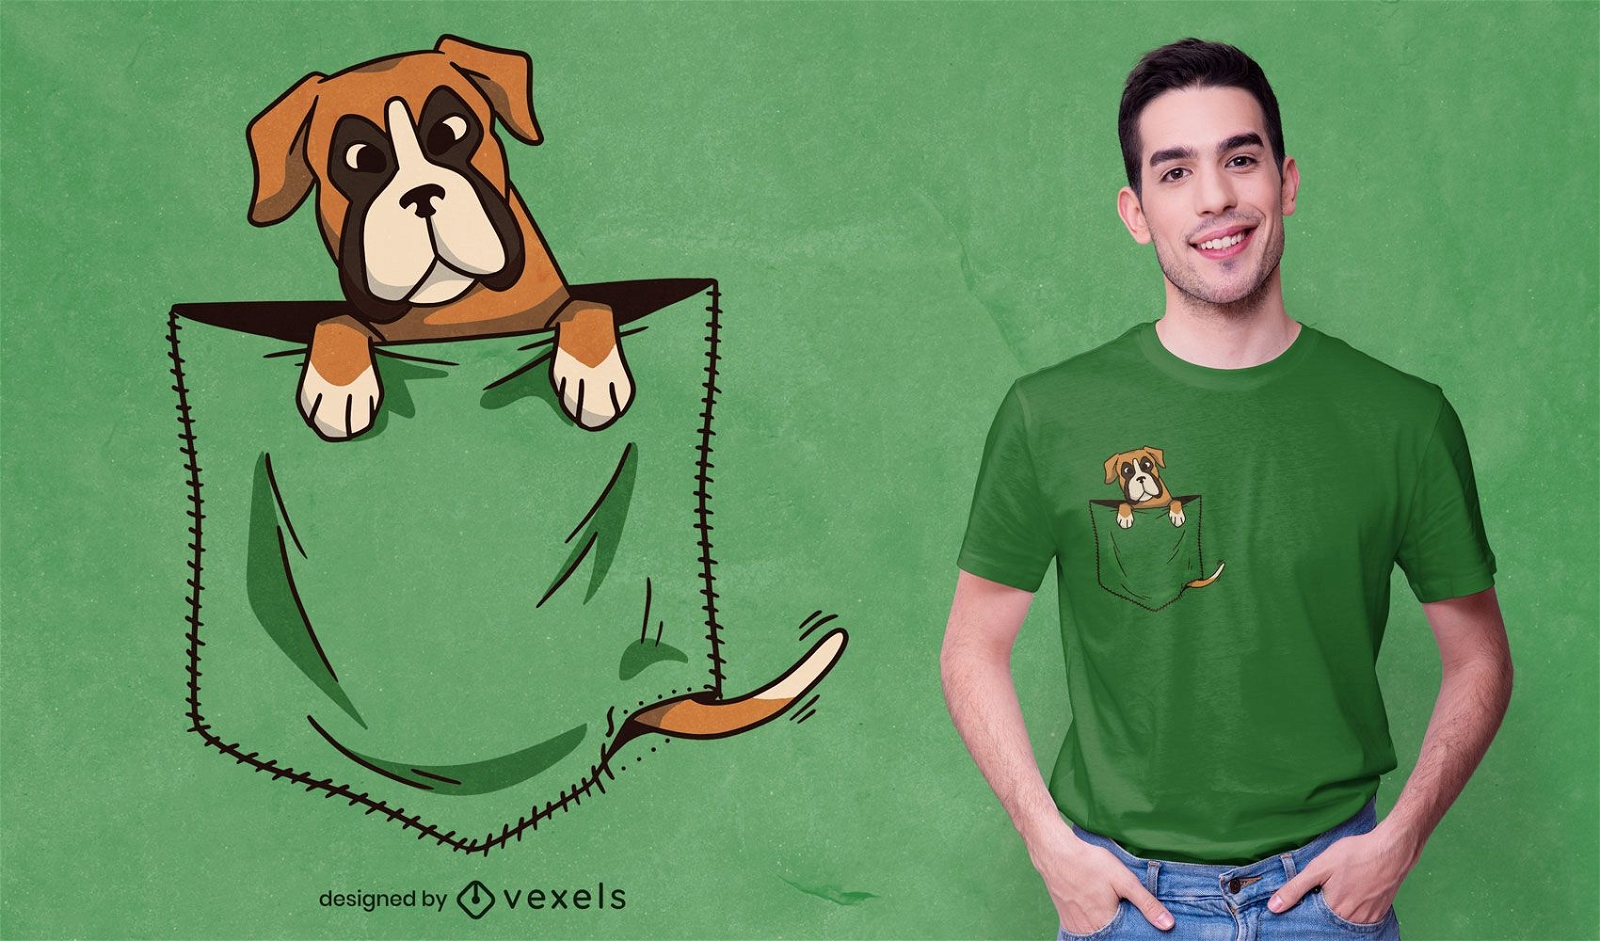
Design de camiseta com cachorro no bolso
Escolha uma pasta
Todos os favoritos
Criar novo
Salvar
Design de camiseta com cachorro no bolso
Pronto para imprimir
para Merch
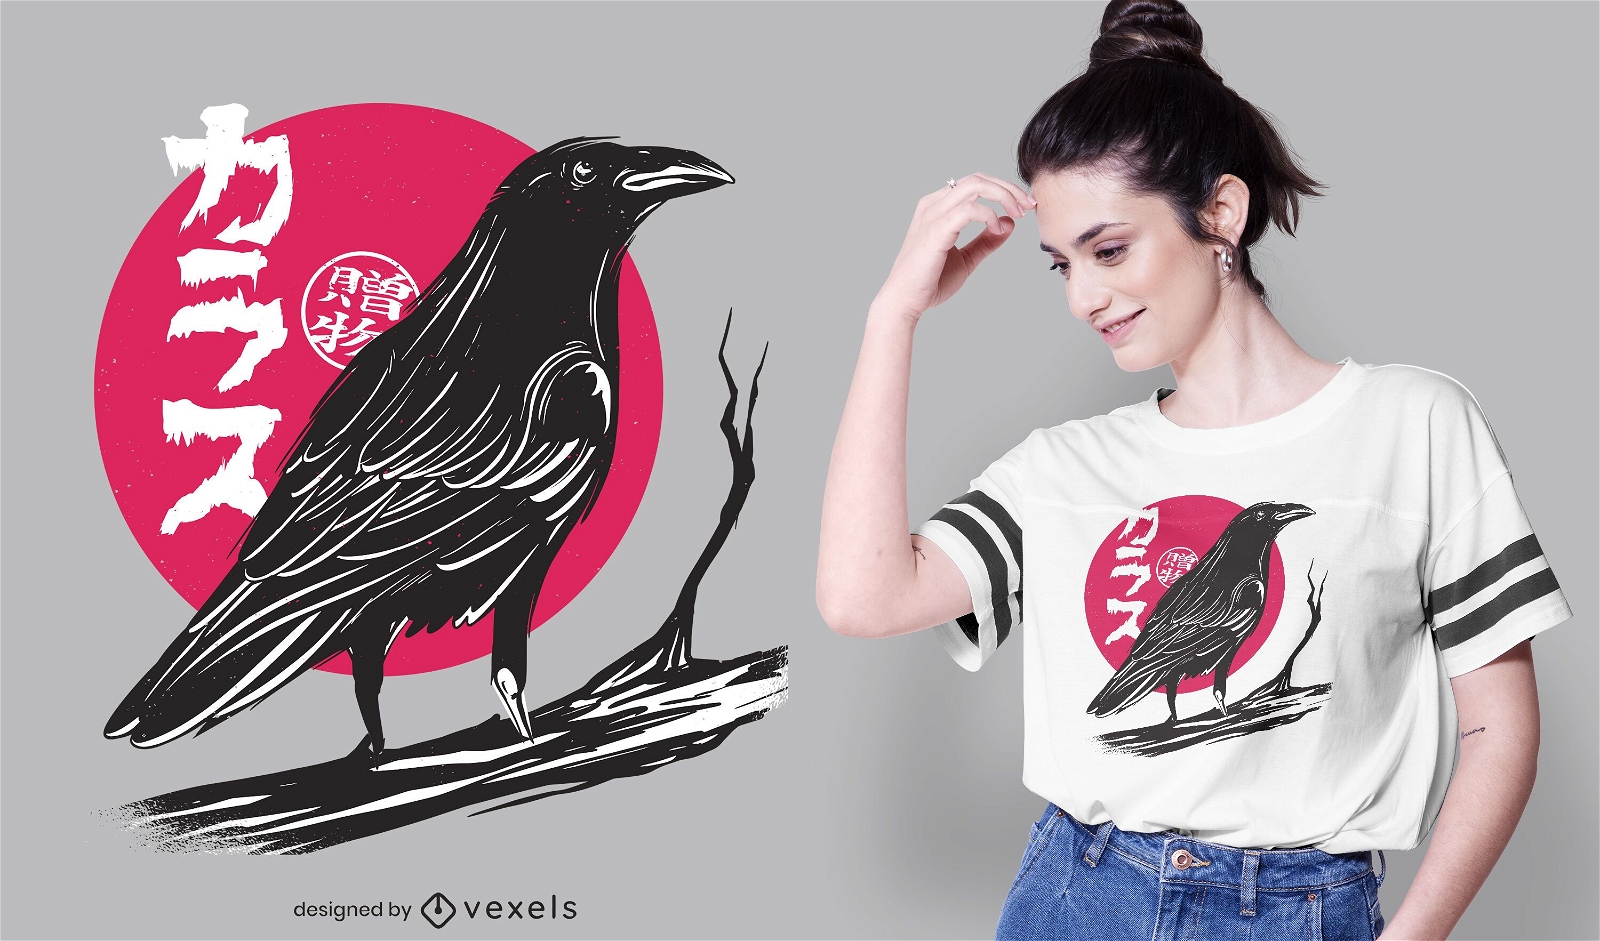
Design de camiseta de corvo lua vermelha
Escolha uma pasta
Todos os favoritos
Criar novo
Salvar
Design de camiseta de corvo lua vermelha
Editar online
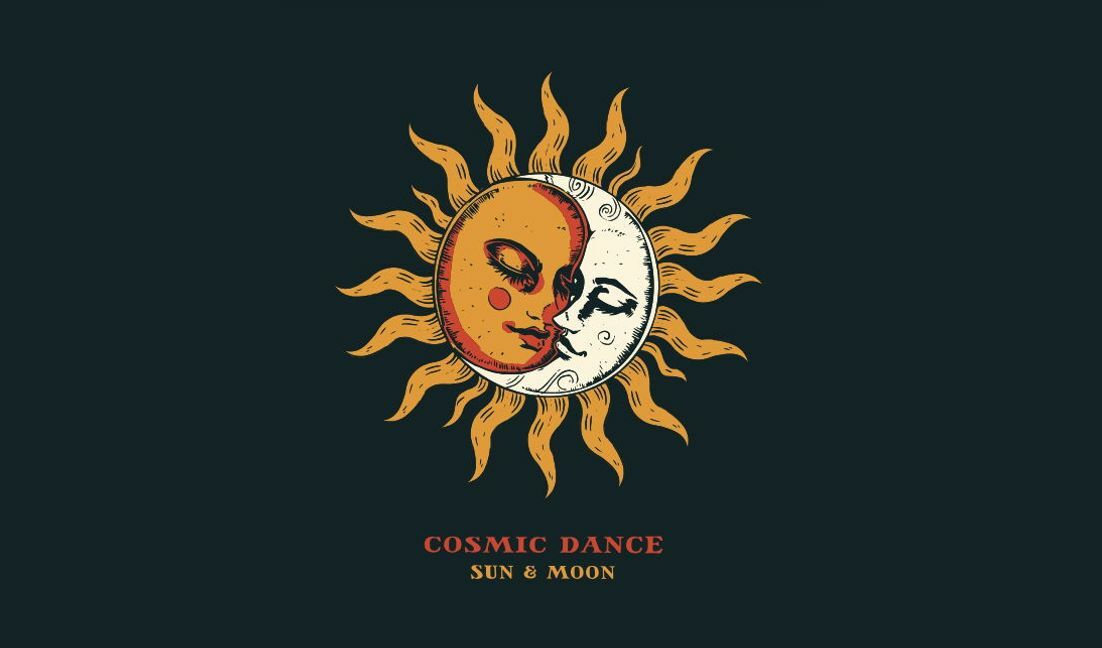
Modelo de design para camiseta Ilustração de sol e lua de dança cósmica
Escolha uma pasta
Todos os favoritos
Criar novo
Salvar
Modelo de design para camiseta Ilustração de sol e lua de dança cósmica
texto editável
Pronto para imprimir
para Merch
Design de camiseta com comida de cobra divertida
Escolha uma pasta
Todos os favoritos
Criar novo
Salvar
Design de camiseta com comida de cobra divertida
Gerado por IA, selecionado por nossos designers.
para Merch
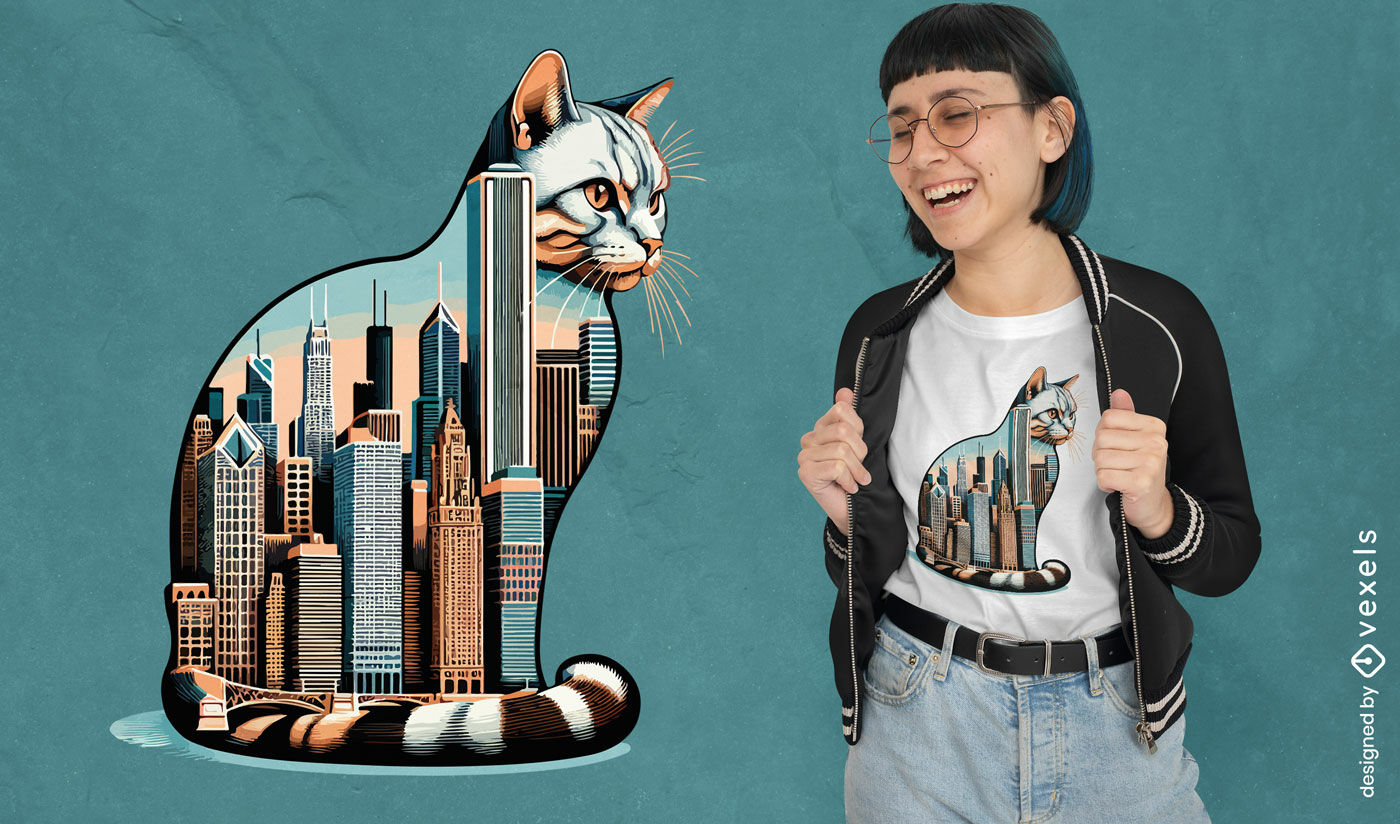
Design de camiseta com gato do horizonte de Chicago
Escolha uma pasta
Todos os favoritos
Criar novo
Salvar
Design de camiseta com gato do horizonte de Chicago
Gerado por IA, selecionado por nossos designers.
para Merch
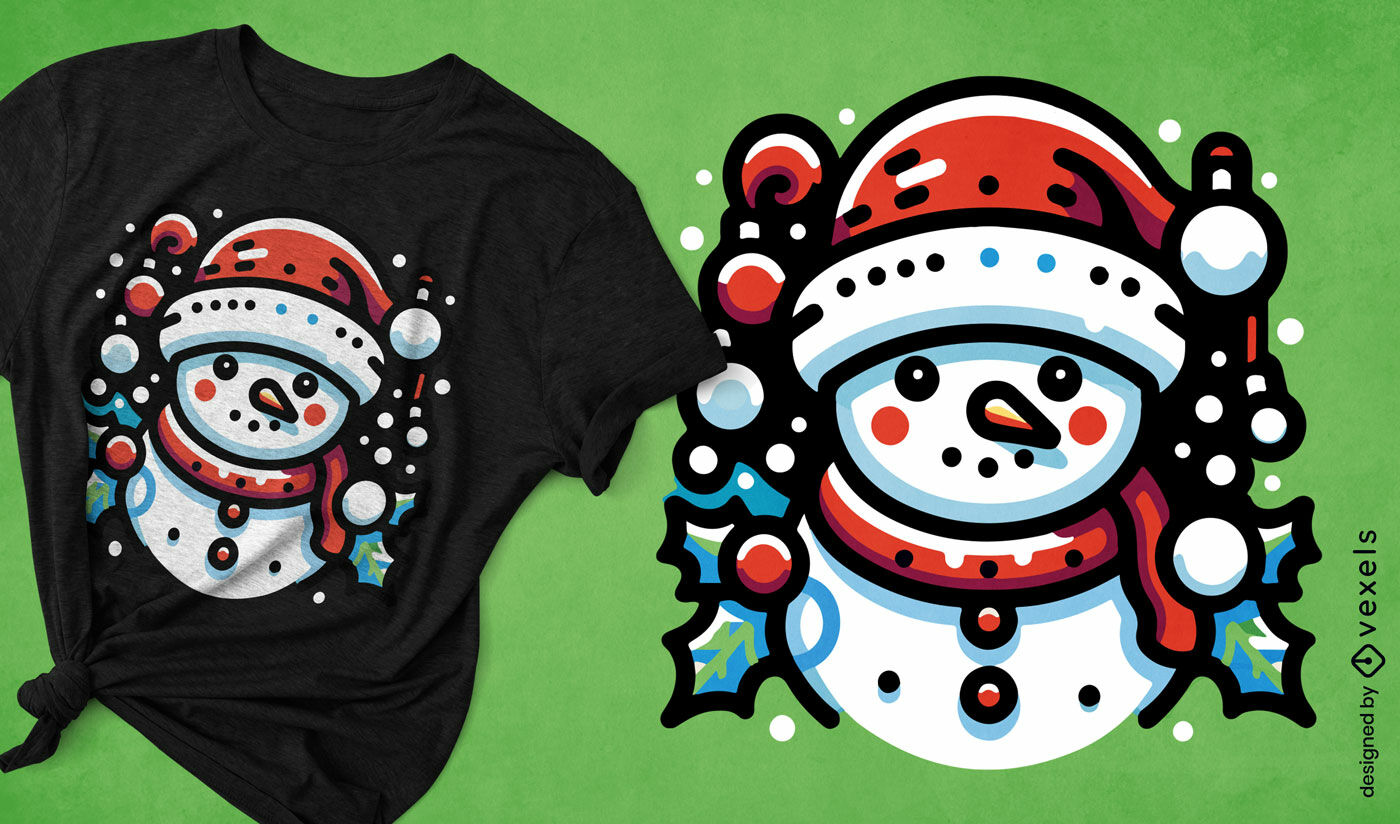
Design de camiseta de Natal com boneco de neve de inverno
Escolha uma pasta
Todos os favoritos
Criar novo
Salvar
Design de camiseta de Natal com boneco de neve de inverno
texto editável
Pronto para imprimir
para Merch
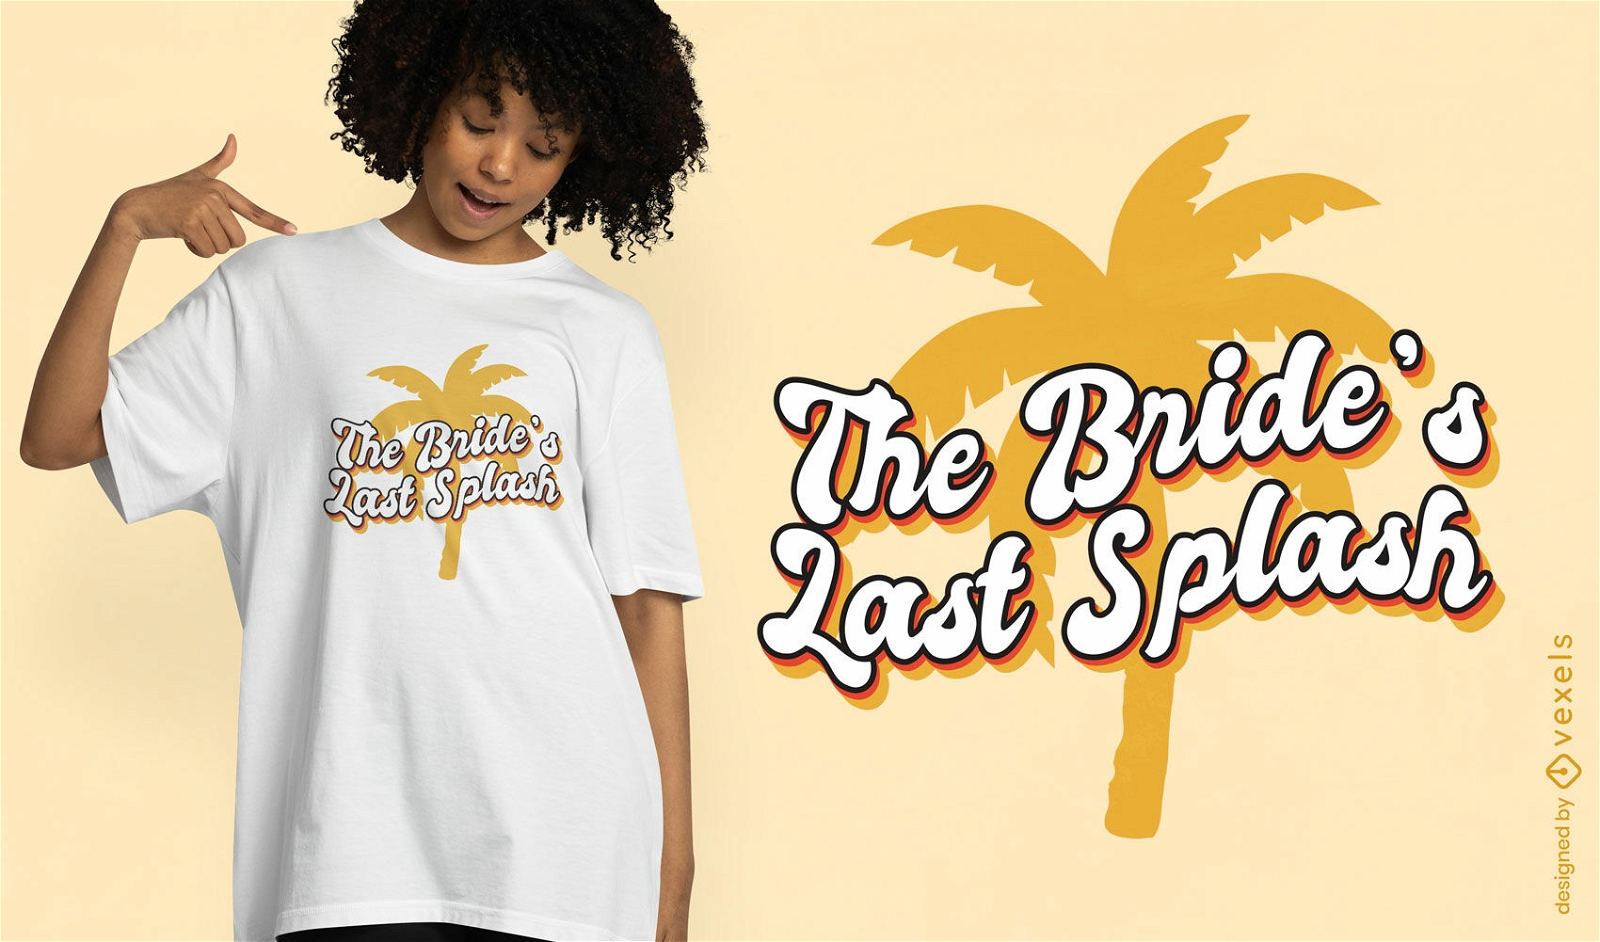
Design de camiseta tropical para despedida de solteira
Escolha uma pasta
Todos os favoritos
Criar novo
Salvar
Design de camiseta tropical para despedida de solteira
Pronto para imprimir
para Merch
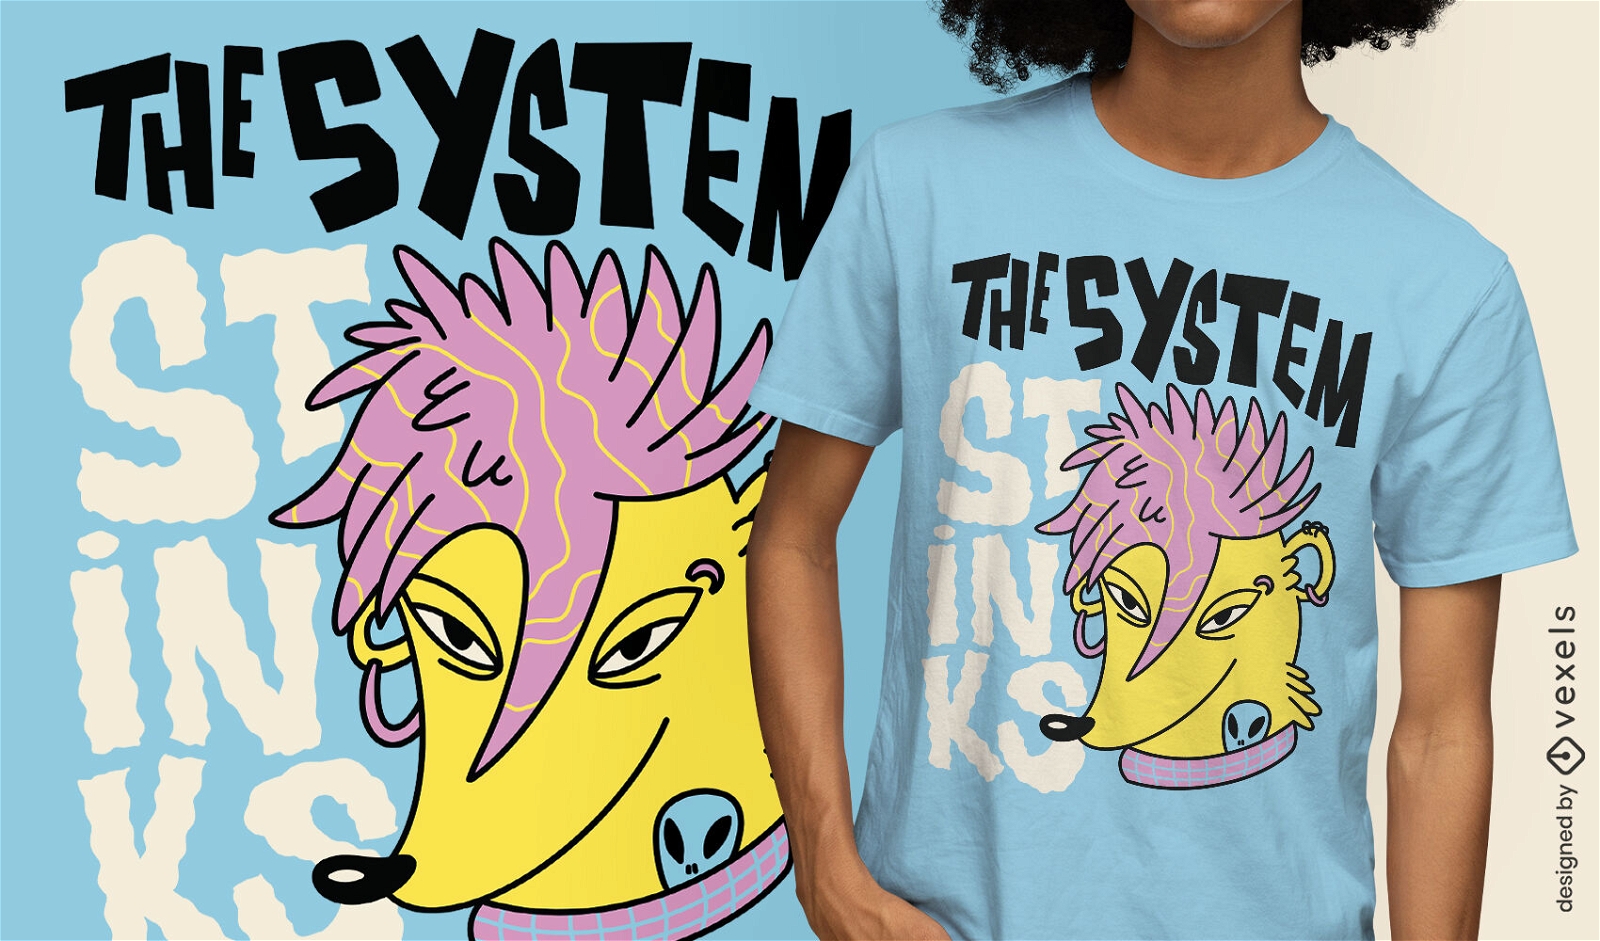
Design de camiseta de animal selvagem punk skunk
Escolha uma pasta
Todos os favoritos
Criar novo
Salvar
Design de camiseta de animal selvagem punk skunk
Impulsione seu negócio
Com a plataforma gráfica líder de mercado.
Ver planos
Próxima
do 636
prev page
next page