Biblioteca de design
Novos designs Merch
Camisetas
Vectores
Designs de Merch de Tendência
PNGs & SVGs
Mockups
Modelos de T-Shirt PSD
Explorar Desenhos
Designs KDP
Pôsteres
Canecas
Capas para celular
Sacos de compras
Almofadas
Ferramentas de desenho
Merch Designer
Novo!
Mockup Generator
Gerador de Design de AI
Vetorizador
Quote Generator
T-Shirt Maker (Antigo)
Ajuda
Merch Digest
Blog
Centro de Ajuda
Saiba mais sobre o Merch
Feedback
Soluções Corporativas
Empresa
Acesso à API
Estúdio de Design
Design em Lote
Preços
Carregando...
Inscrever-se
Conecte-se
All
graficos
Biblioteca de design
Novos designs Merch
Camisetas
Vectores
Designs de Merch de Tendência
PNGs & SVGs
Mockups
Modelos de T-Shirt PSD
Explorar Desenhos
Designs KDP
Pôsteres
Canecas
Capas para celular
Sacos de compras
Almofadas
Ferramentas de desenho
Merch Designer
Novo!
Mockup Generator
Gerador de Design de AI
Vetorizador
Quote Generator
T-Shirt Maker (Antigo)
Ajuda
Merch Digest
Blog
Centro de Ajuda
Saiba mais sobre o Merch
Feedback
Soluções Corporativas
Empresa
Acesso à API
Estúdio de Design
Design em Lote
PLANOS
All
graficos
31792 Gráficos e Designs de graficos para Camisetas e Merch print on demand
Baixar designs de camisetas e para merch, como capas de livro, capas de celular, tote bags e mais de graficos
Relacionado:
graficos vetoriais
,
desenhos graficos de ações
,
graficos tridimensionais
Ordenar por
Mais relevante
Resultados patrocinados da
Ganhe 15% de desconto com o código: VEXELS15
veja mais detalhes
texto editável
Pronto para imprimir
para Merch
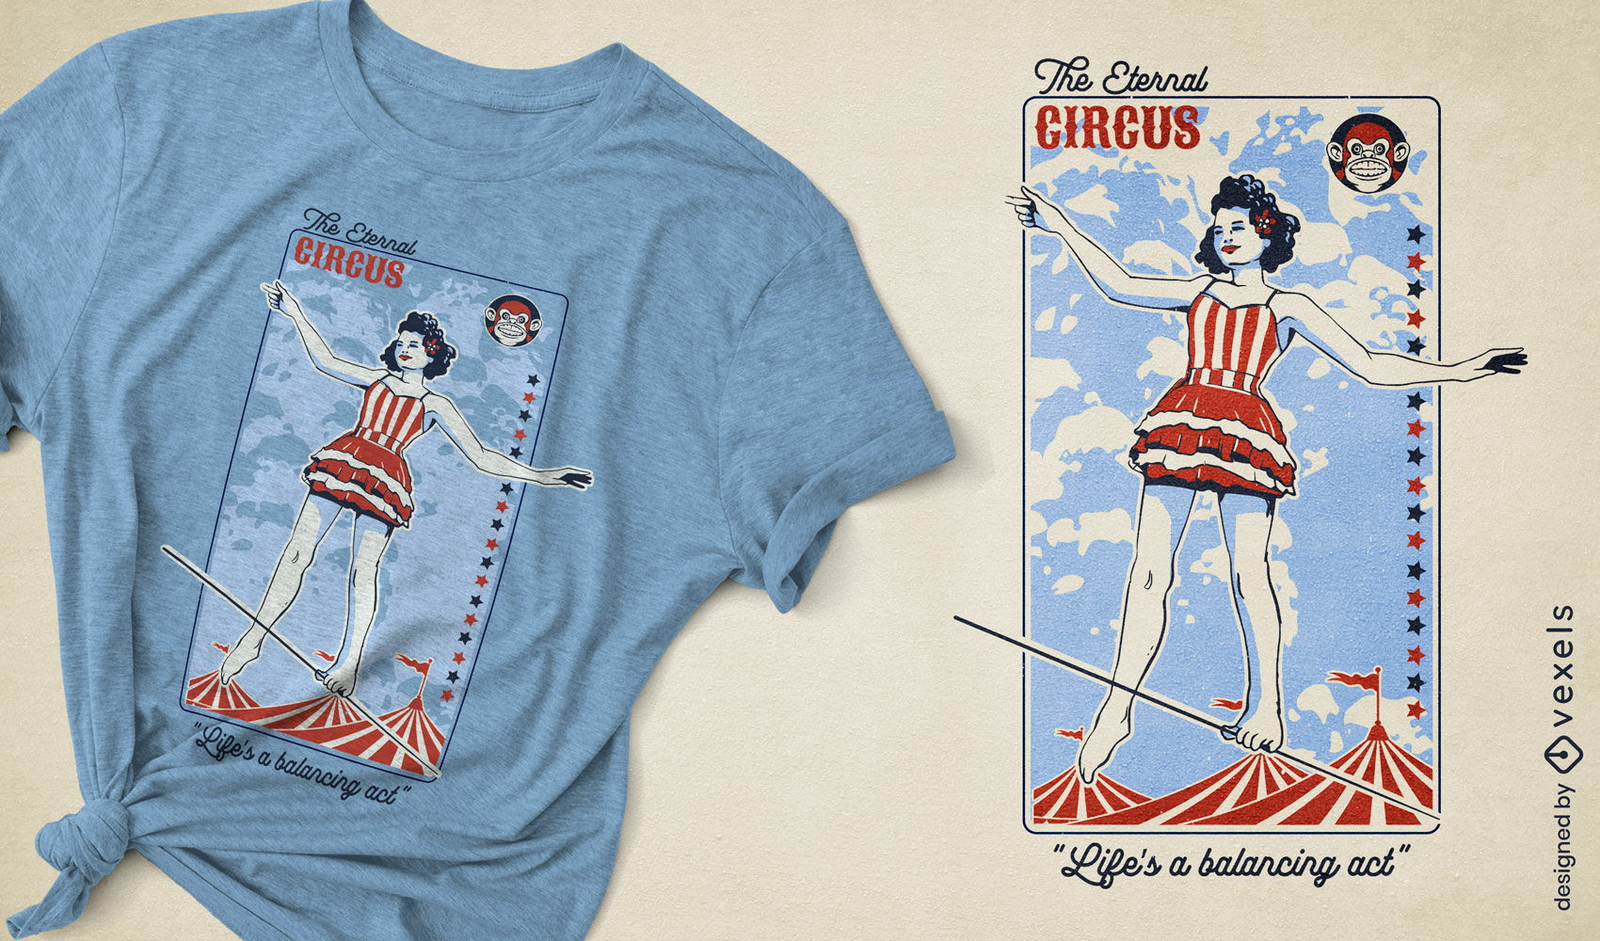
Design de camiseta vintage com figura de circo em equilíbrio
Escolha uma pasta
Todos os favoritos
Criar novo
Salvar
Design de camiseta vintage com figura de circo em equilíbrio
texto editável
Pronto para imprimir
para Merch
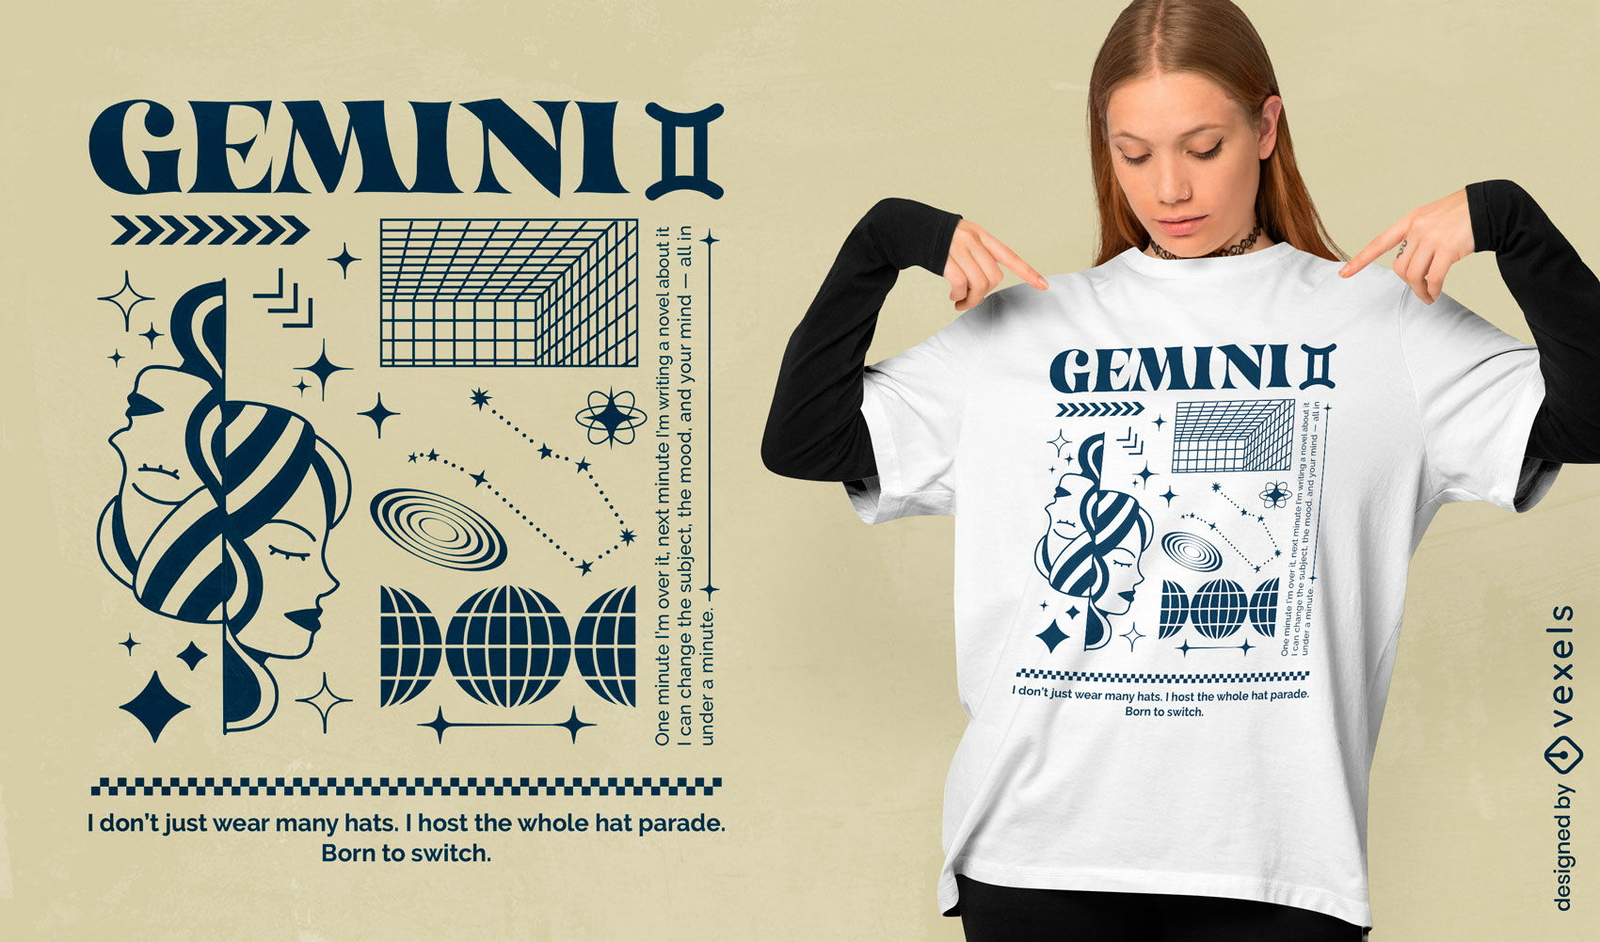
Design de camiseta streetwear com astrologia de Gêmeos
Escolha uma pasta
Todos os favoritos
Criar novo
Salvar
Design de camiseta streetwear com astrologia de Gêmeos
Editar online
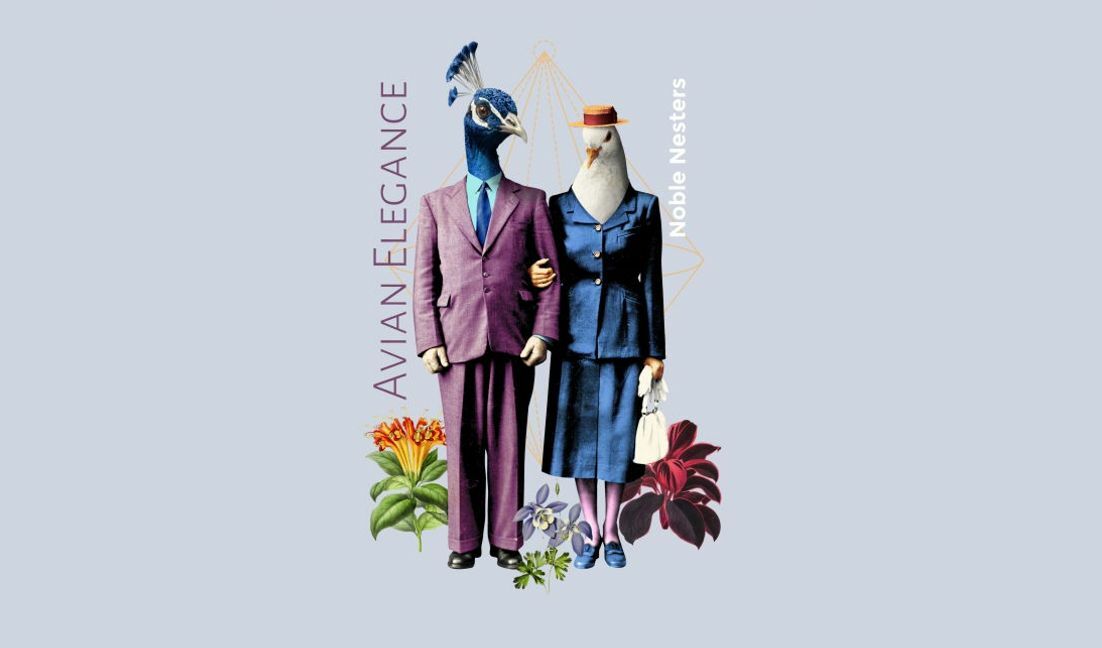
Modelo de design para camiseta Ilustração de casal de pássaros caprichosos
Escolha uma pasta
Todos os favoritos
Criar novo
Salvar
Modelo de design para camiseta Ilustração de casal de pássaros caprichosos
Editar online
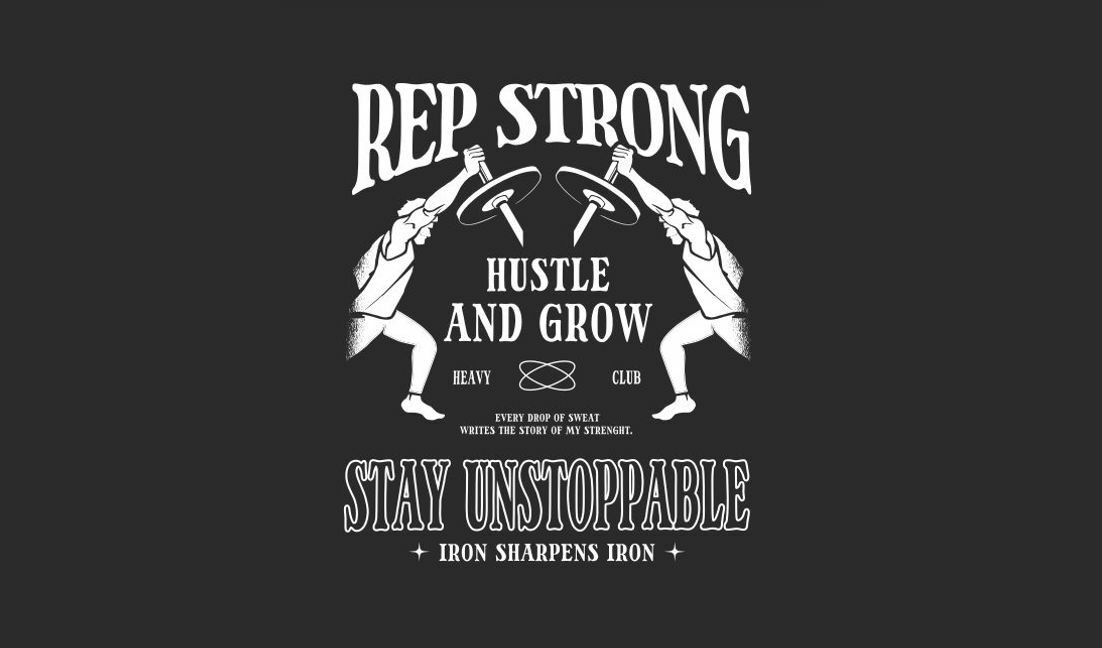
Modelo de design para camiseta Design de citação motivacional sobre condicionamento físico
Escolha uma pasta
Todos os favoritos
Criar novo
Salvar
Modelo de design para camiseta Design de citação motivacional sobre condicionamento físico
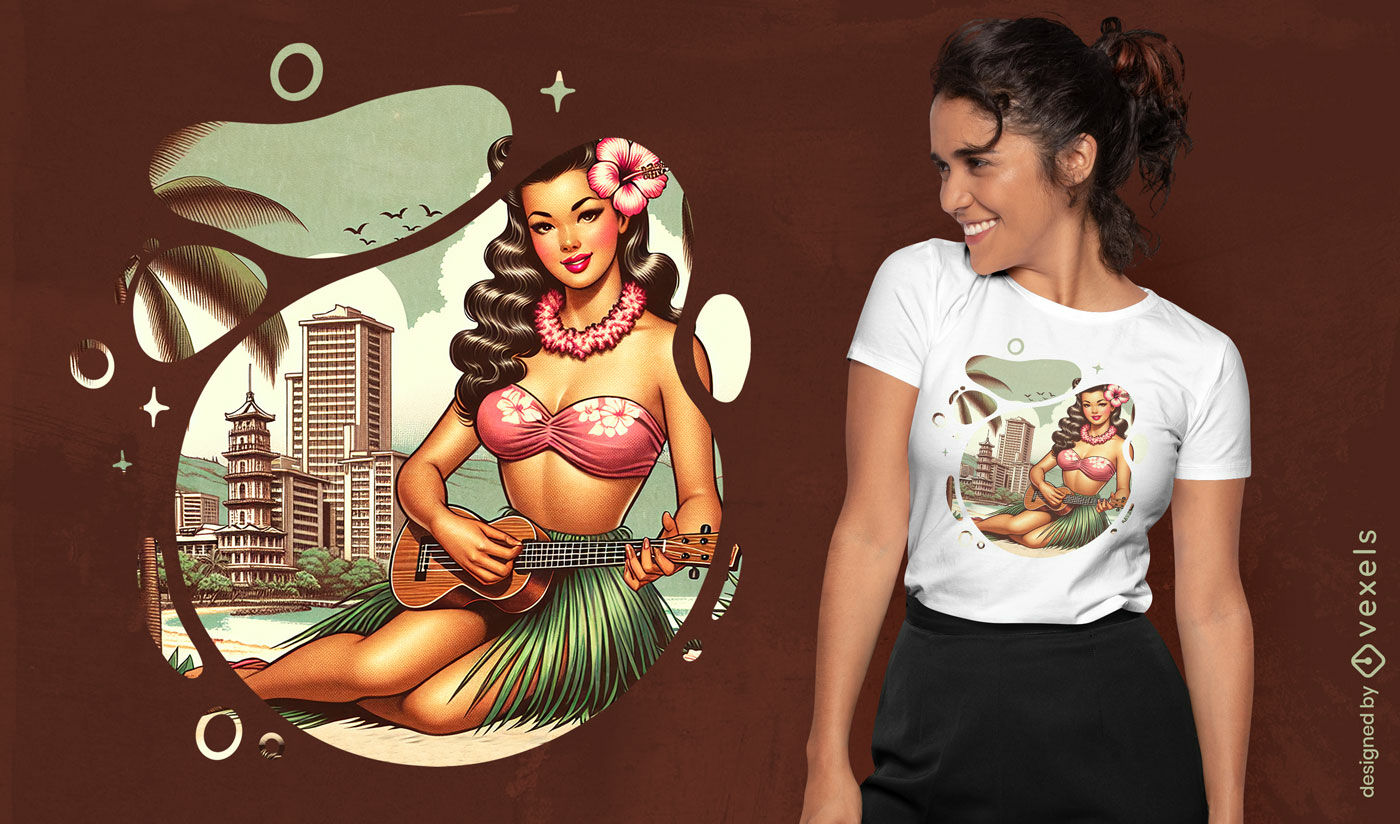
Gerado por IA, selecionado por nossos designers.
para Merch
Design de camiseta feminina havaiana pin-up
Escolha uma pasta
Todos os favoritos
Criar novo
Salvar
Design de camiseta feminina havaiana pin-up
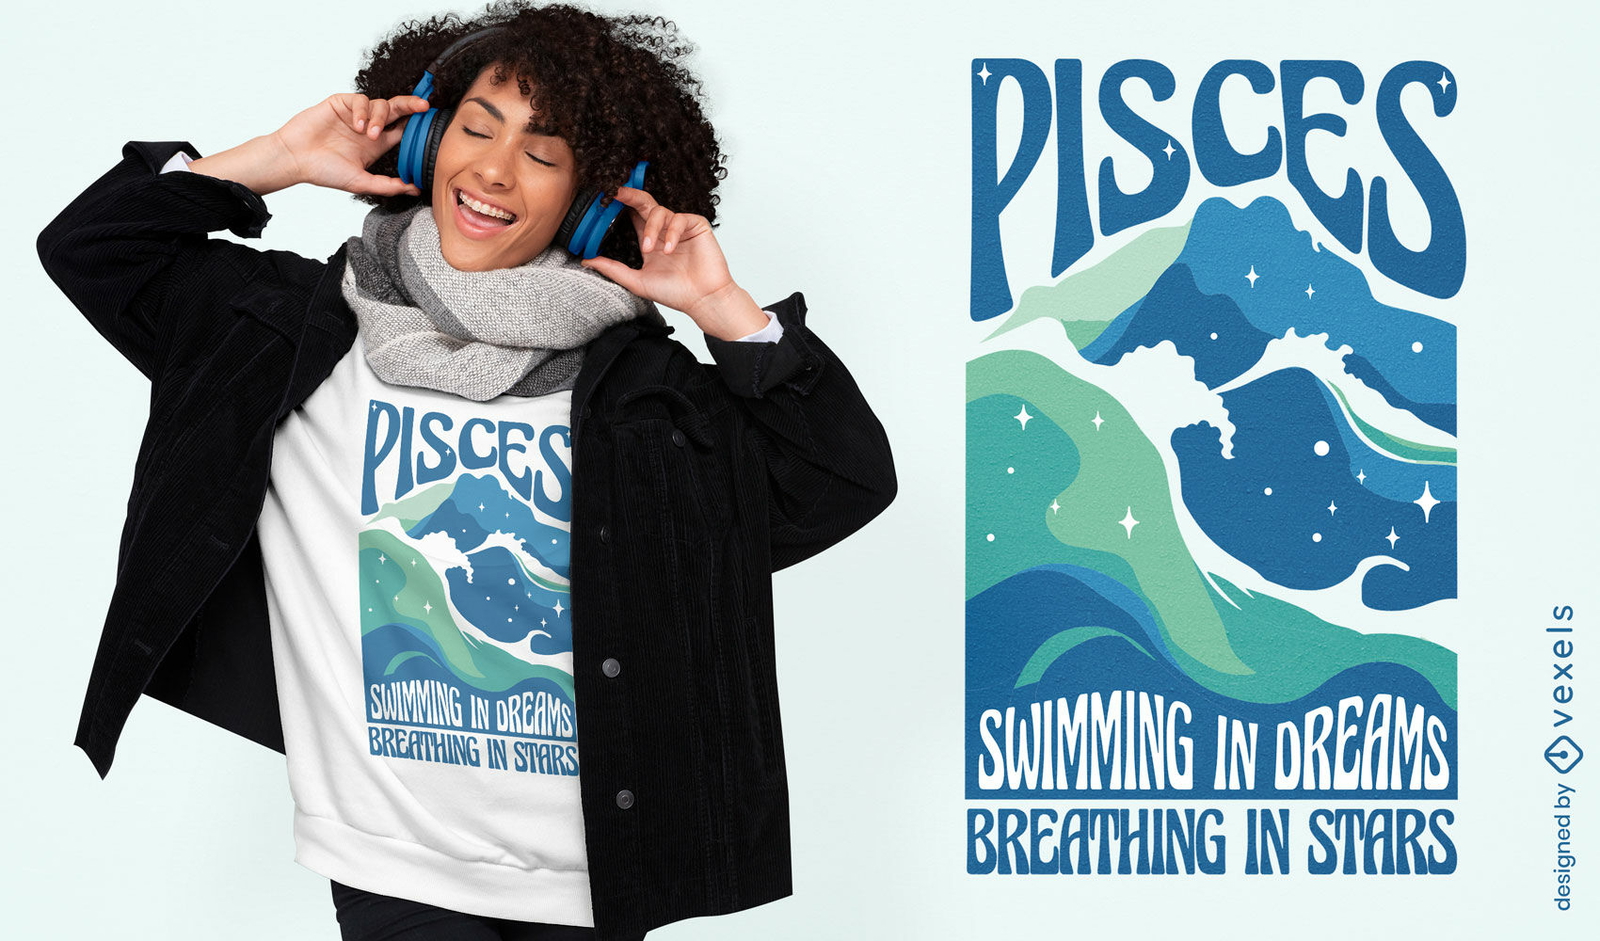
texto editável
Pronto para imprimir
para Merch
Design de camiseta com ondas do oceano de Peixes
Escolha uma pasta
Todos os favoritos
Criar novo
Salvar
Design de camiseta com ondas do oceano de Peixes
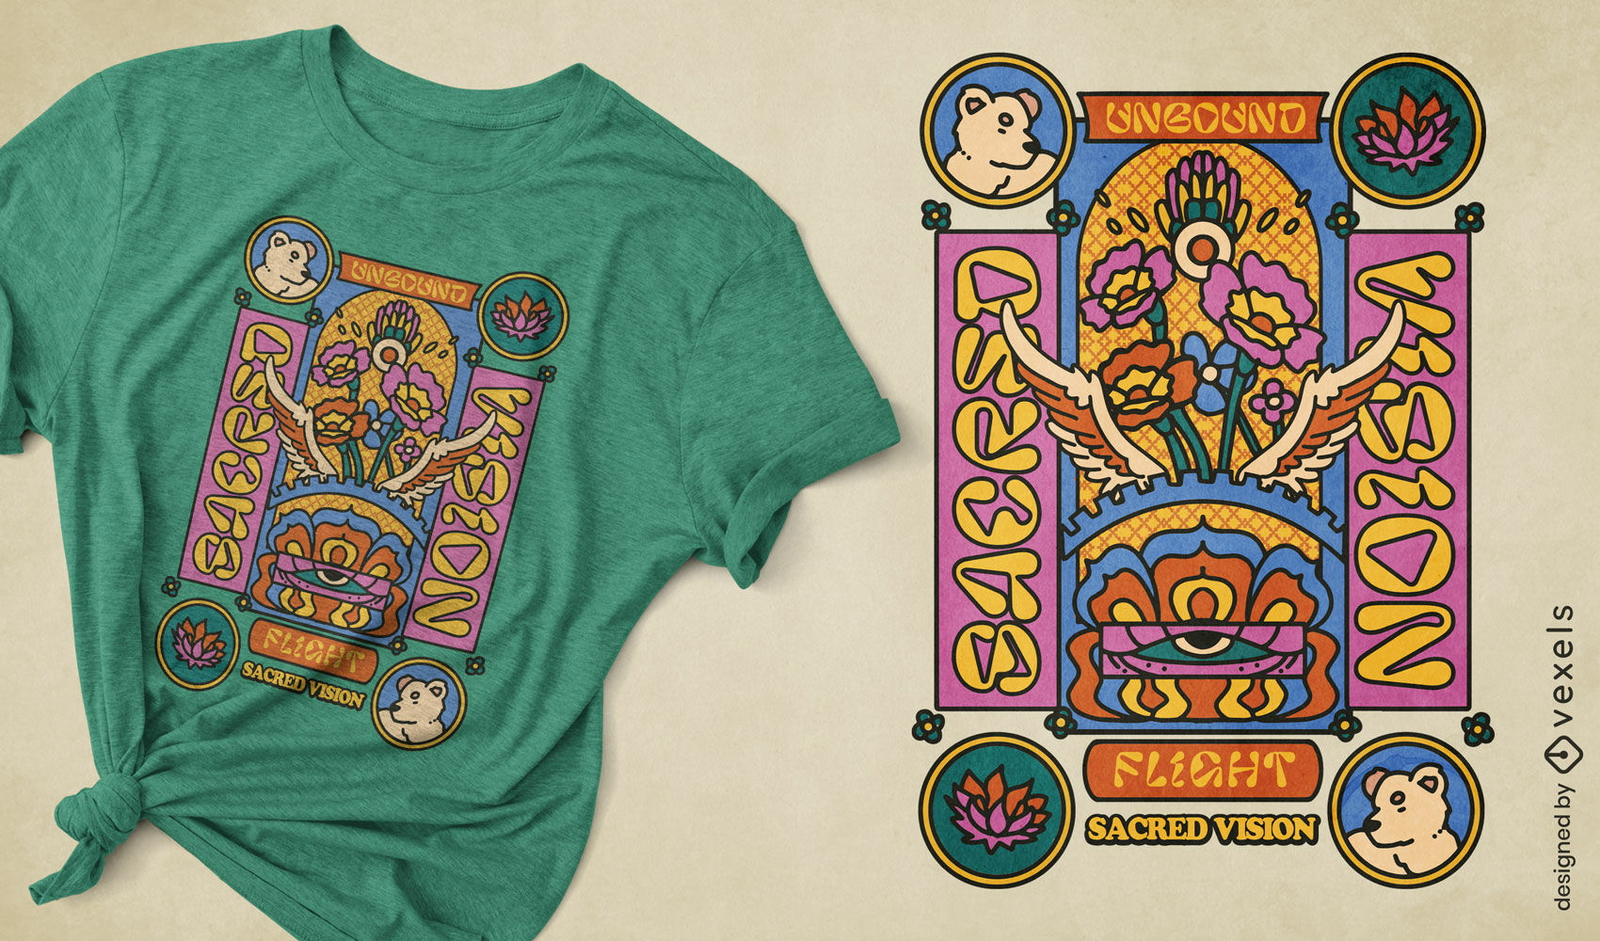
texto editável
Pronto para imprimir
para Merch
Design de camiseta com visão sagrada
Escolha uma pasta
Todos os favoritos
Criar novo
Salvar
Design de camiseta com visão sagrada
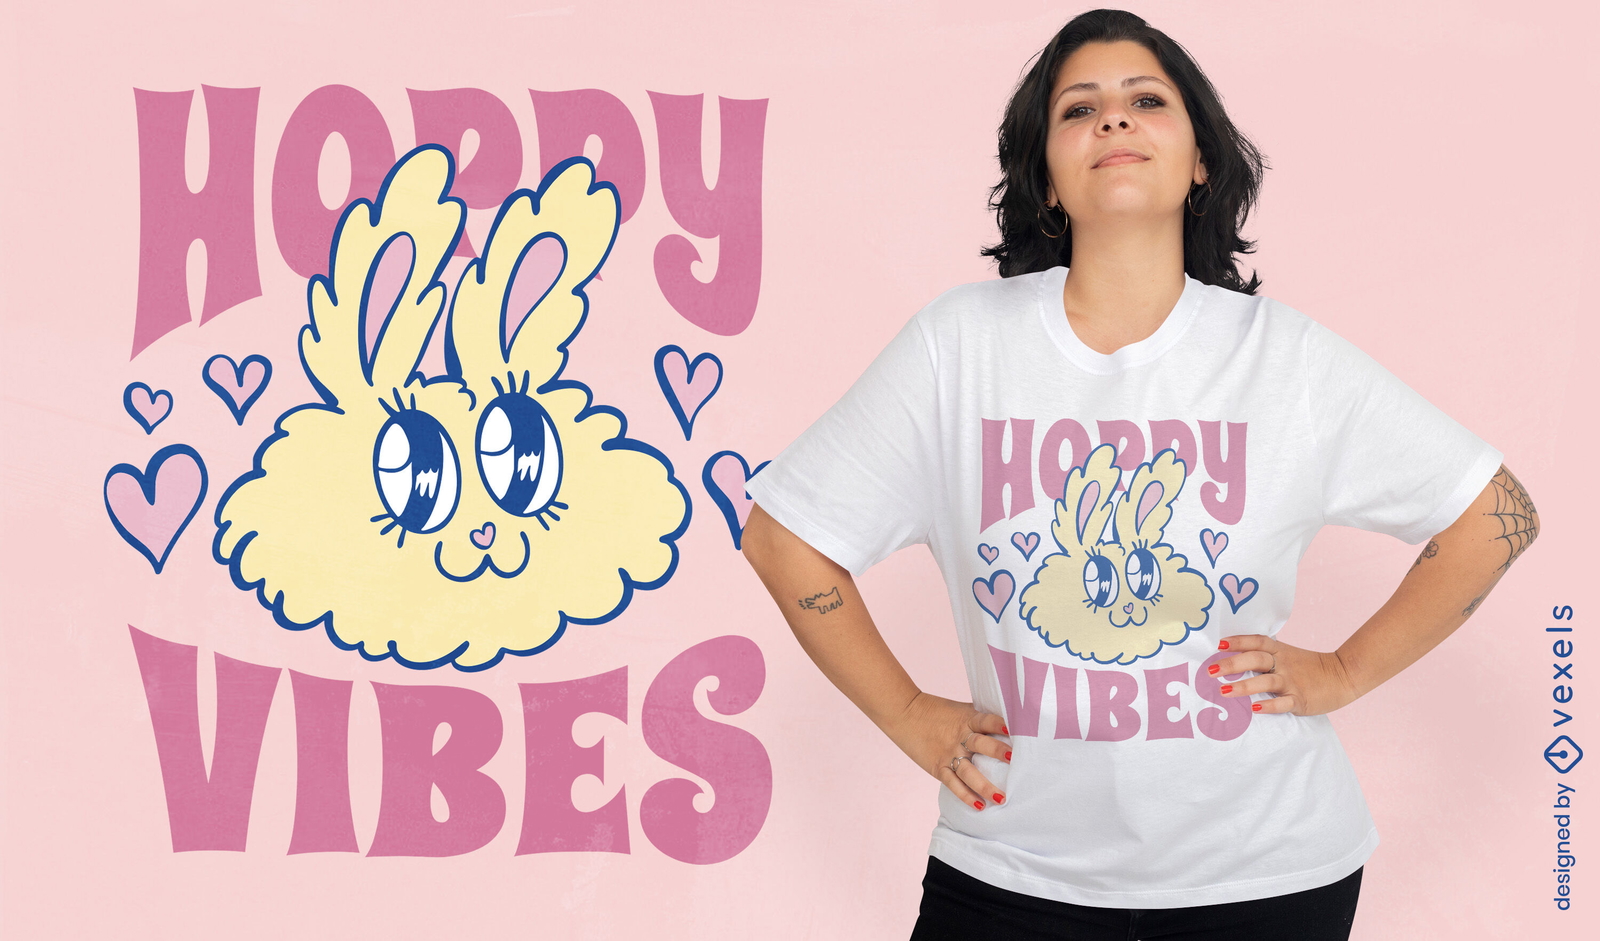
texto editável
Pronto para imprimir
para Merch
Design de camiseta com vibrações de Páscoa
Escolha uma pasta
Todos os favoritos
Criar novo
Salvar
Design de camiseta com vibrações de Páscoa
Gerado por IA, selecionado por nossos designers.
para Merch
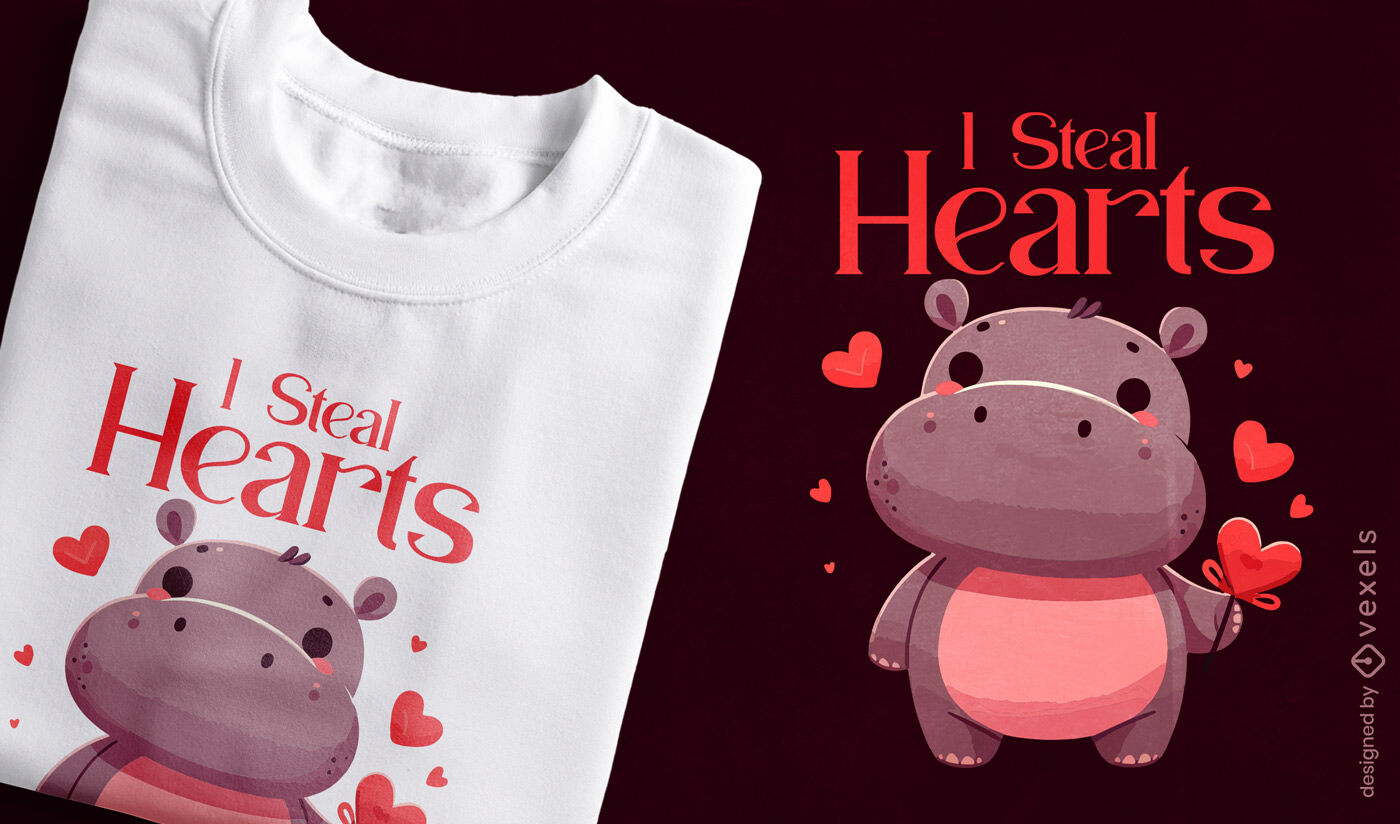
Design de camiseta de hipopótamo para dia dos namorados
Escolha uma pasta
Todos os favoritos
Criar novo
Salvar
Design de camiseta de hipopótamo para dia dos namorados
texto editável
Pronto para imprimir
para Merch
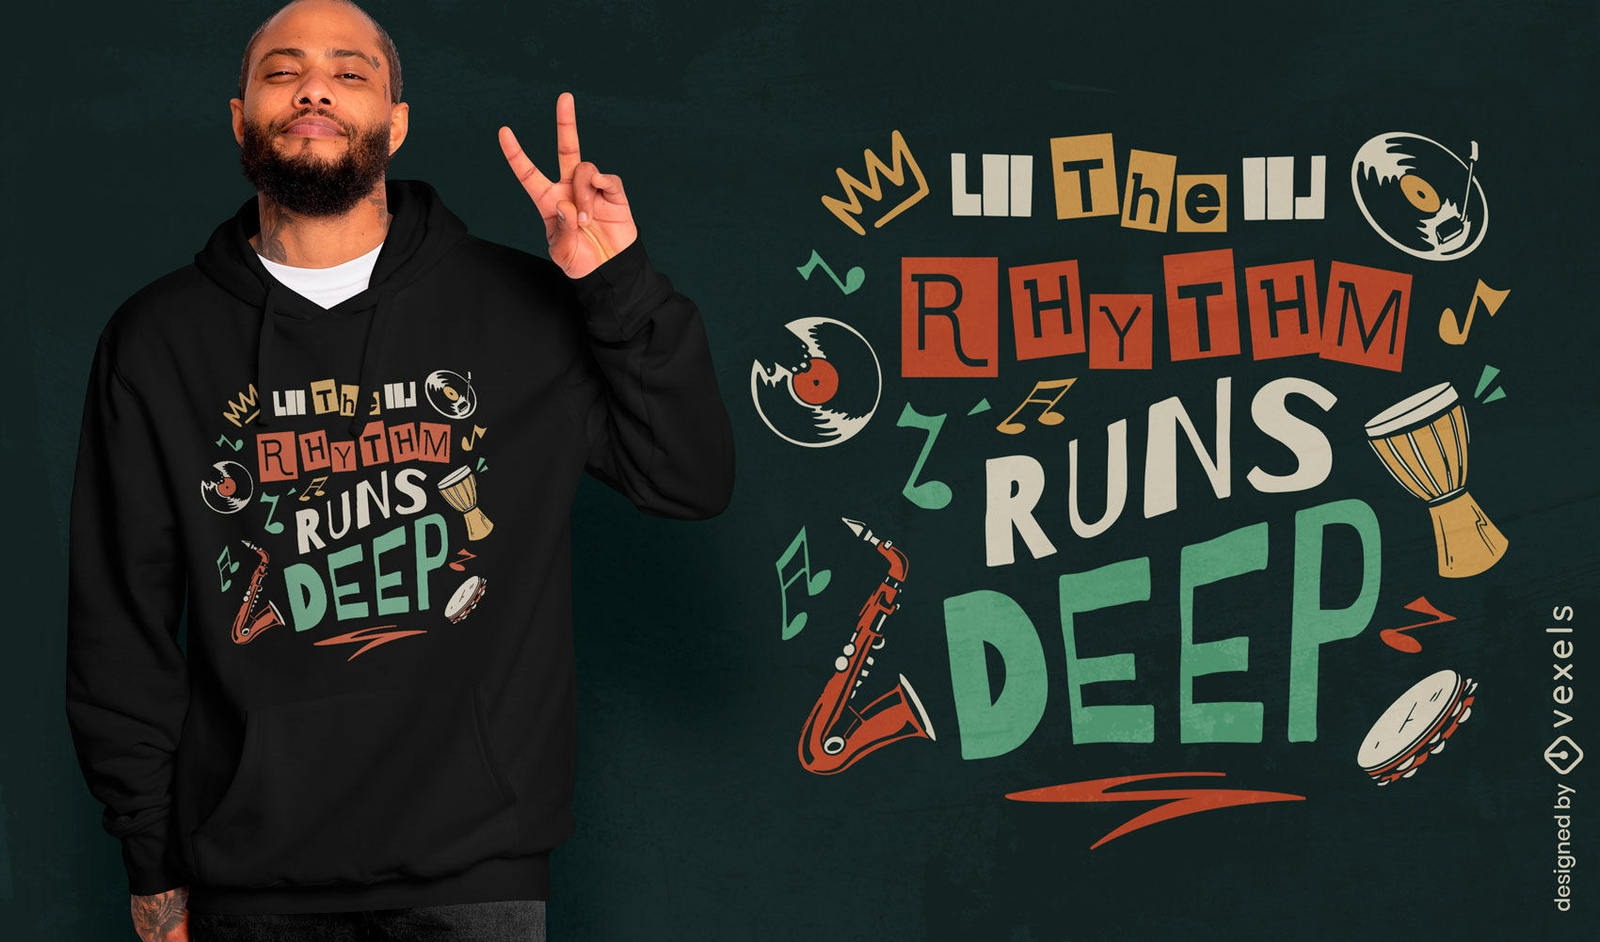
Design de camiseta com ritmo musical profundo
Escolha uma pasta
Todos os favoritos
Criar novo
Salvar
Design de camiseta com ritmo musical profundo
Gerado por IA, selecionado por nossos designers.
para Merch
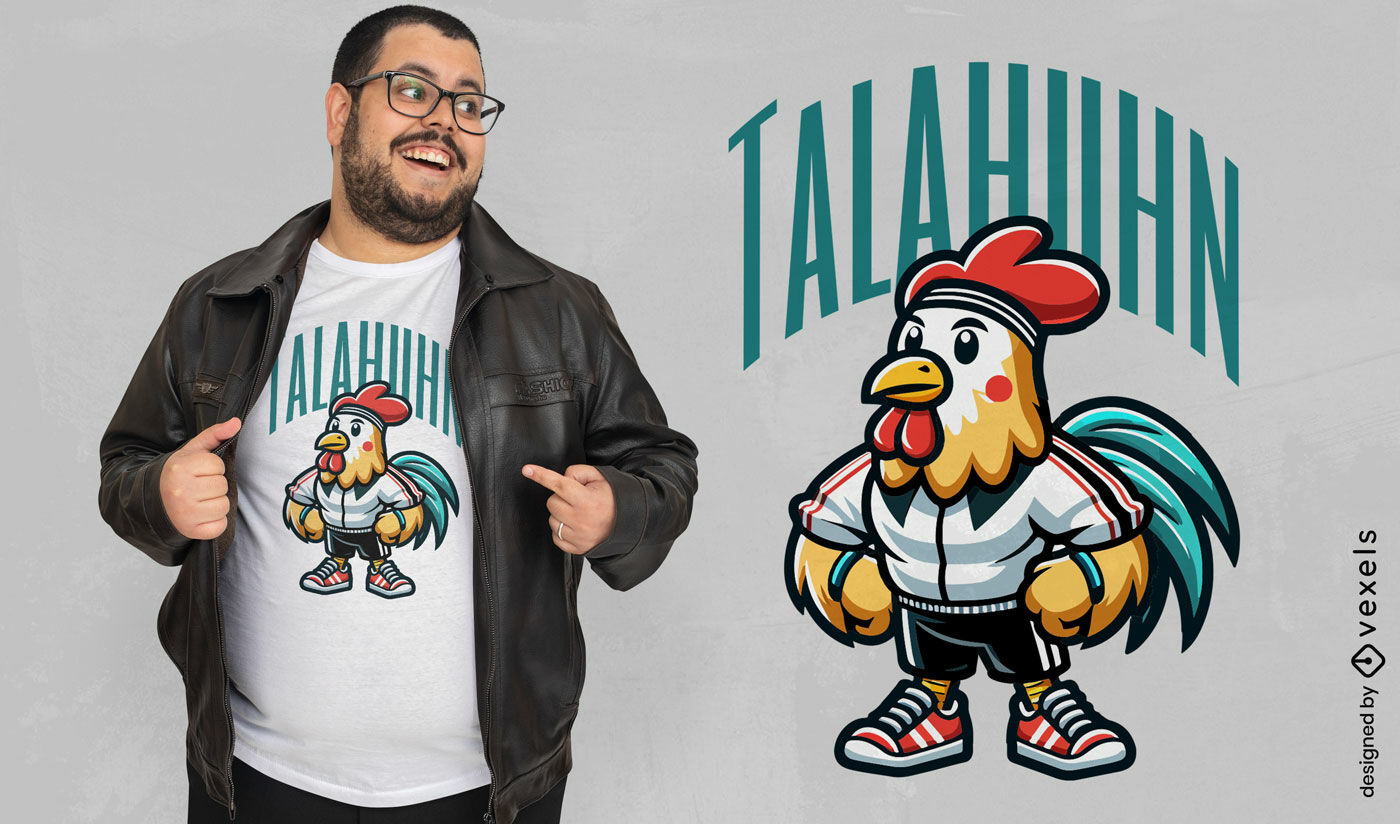
Design de camiseta com mascote do galo urbano
Escolha uma pasta
Todos os favoritos
Criar novo
Salvar
Design de camiseta com mascote do galo urbano
Gerado por IA, selecionado por nossos designers.
para Merch
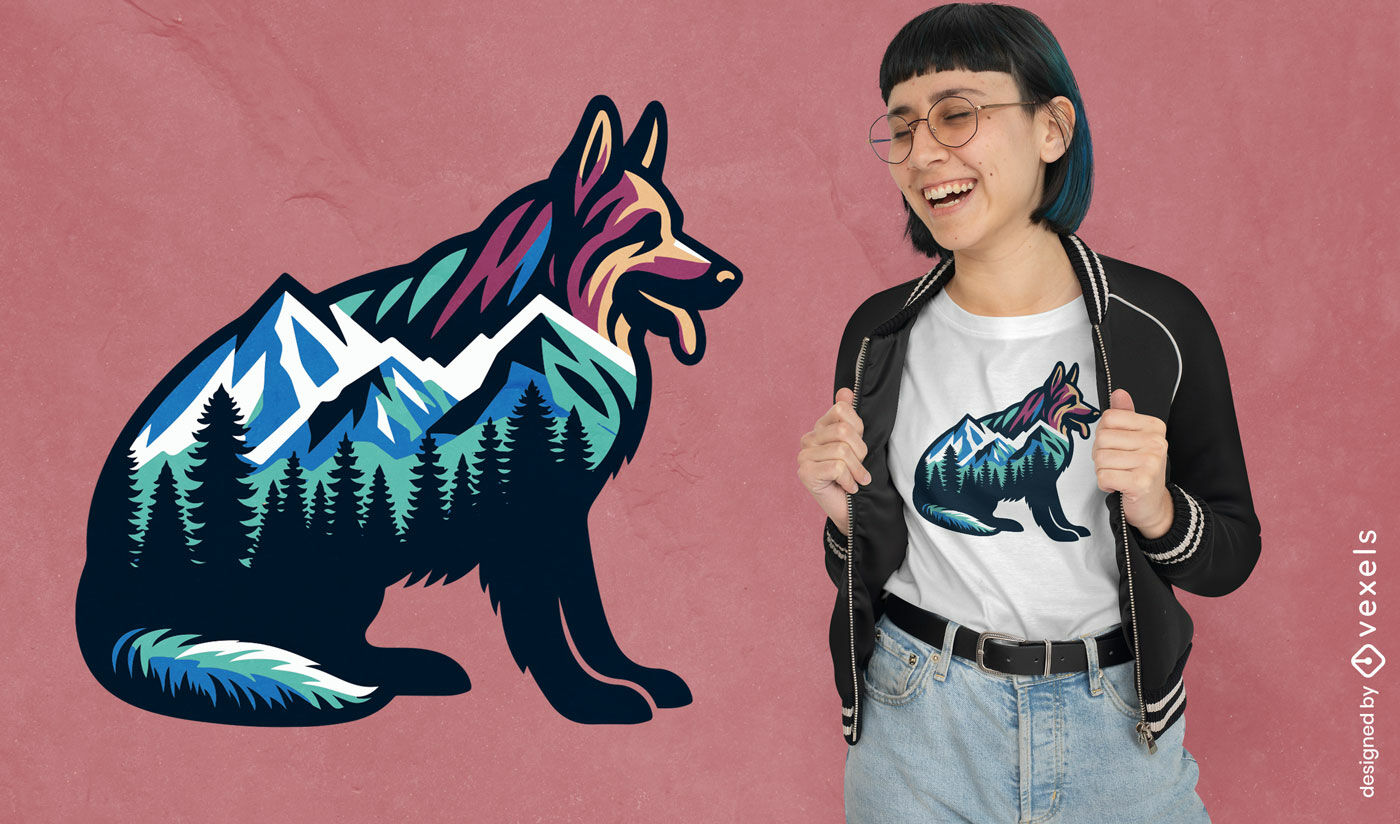
Design de camiseta com paisagem de cão da montanha
Escolha uma pasta
Todos os favoritos
Criar novo
Salvar
Design de camiseta com paisagem de cão da montanha
Gerado por IA, selecionado por nossos designers.
para Merch
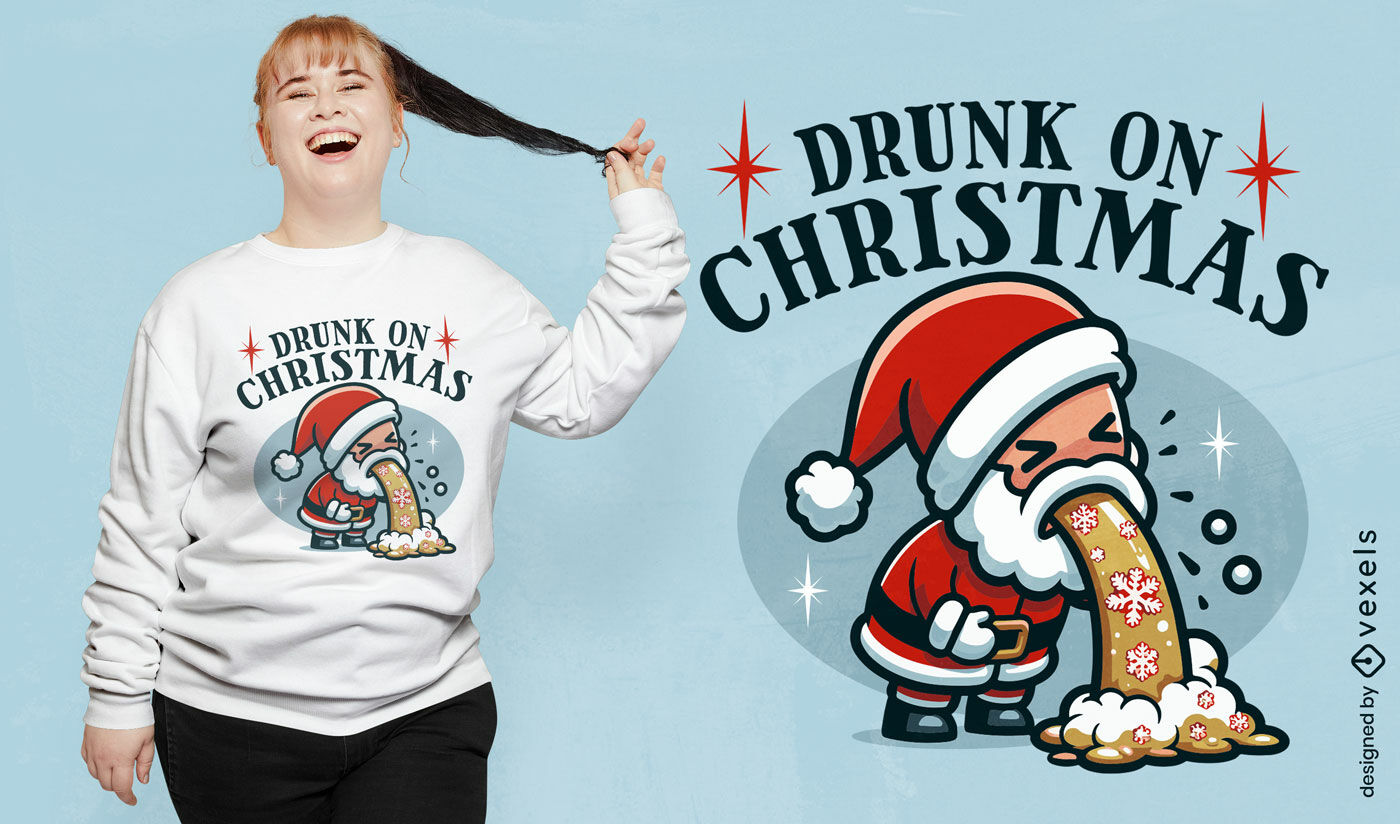
Design engraçado de camiseta do Papai Noel bêbado
Escolha uma pasta
Todos os favoritos
Criar novo
Salvar
Design engraçado de camiseta do Papai Noel bêbado
Editar online
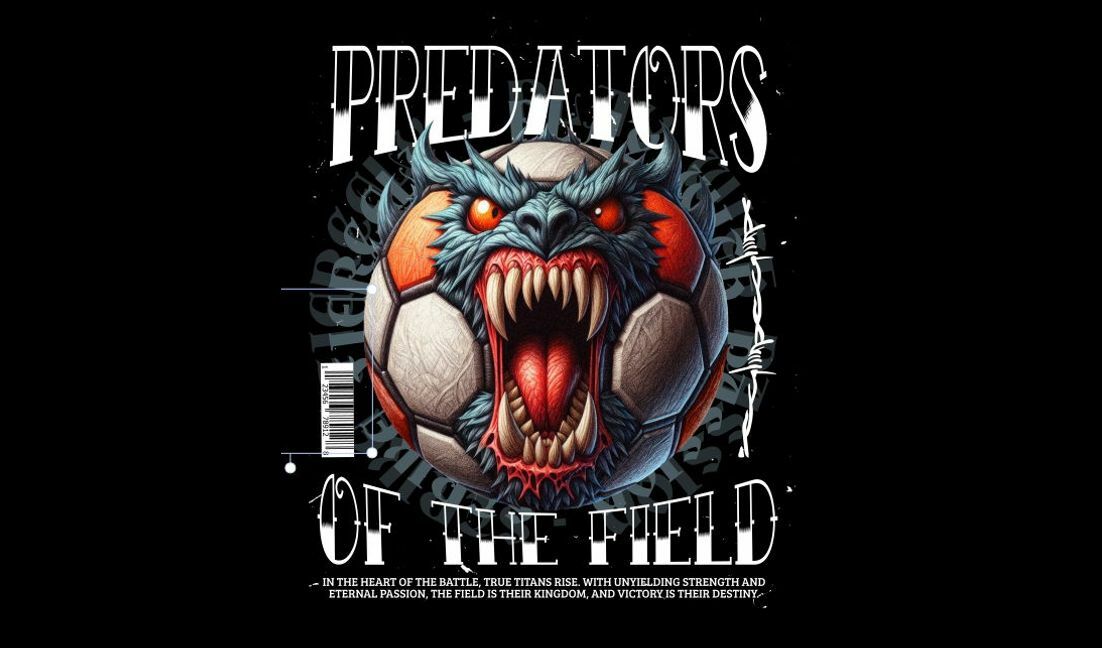
Modelo de design para camiseta Design gráfico de futebol de predador feroz
Escolha uma pasta
Todos os favoritos
Criar novo
Salvar
Modelo de design para camiseta Design gráfico de futebol de predador feroz
Pronto para imprimir
para Merch
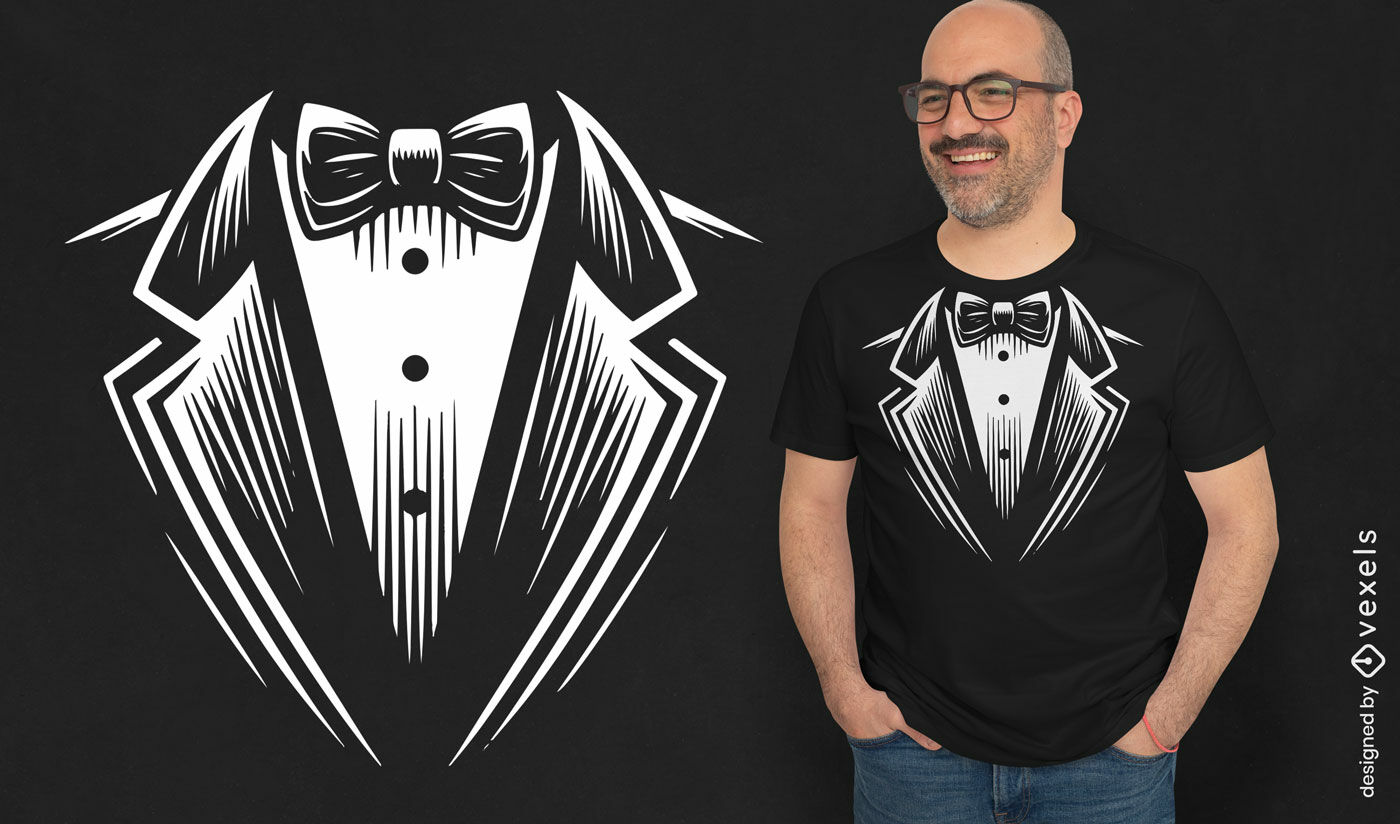
Design minimalista de camiseta smoking
Escolha uma pasta
Todos os favoritos
Criar novo
Salvar
Design minimalista de camiseta smoking
Pronto para imprimir
para Merch
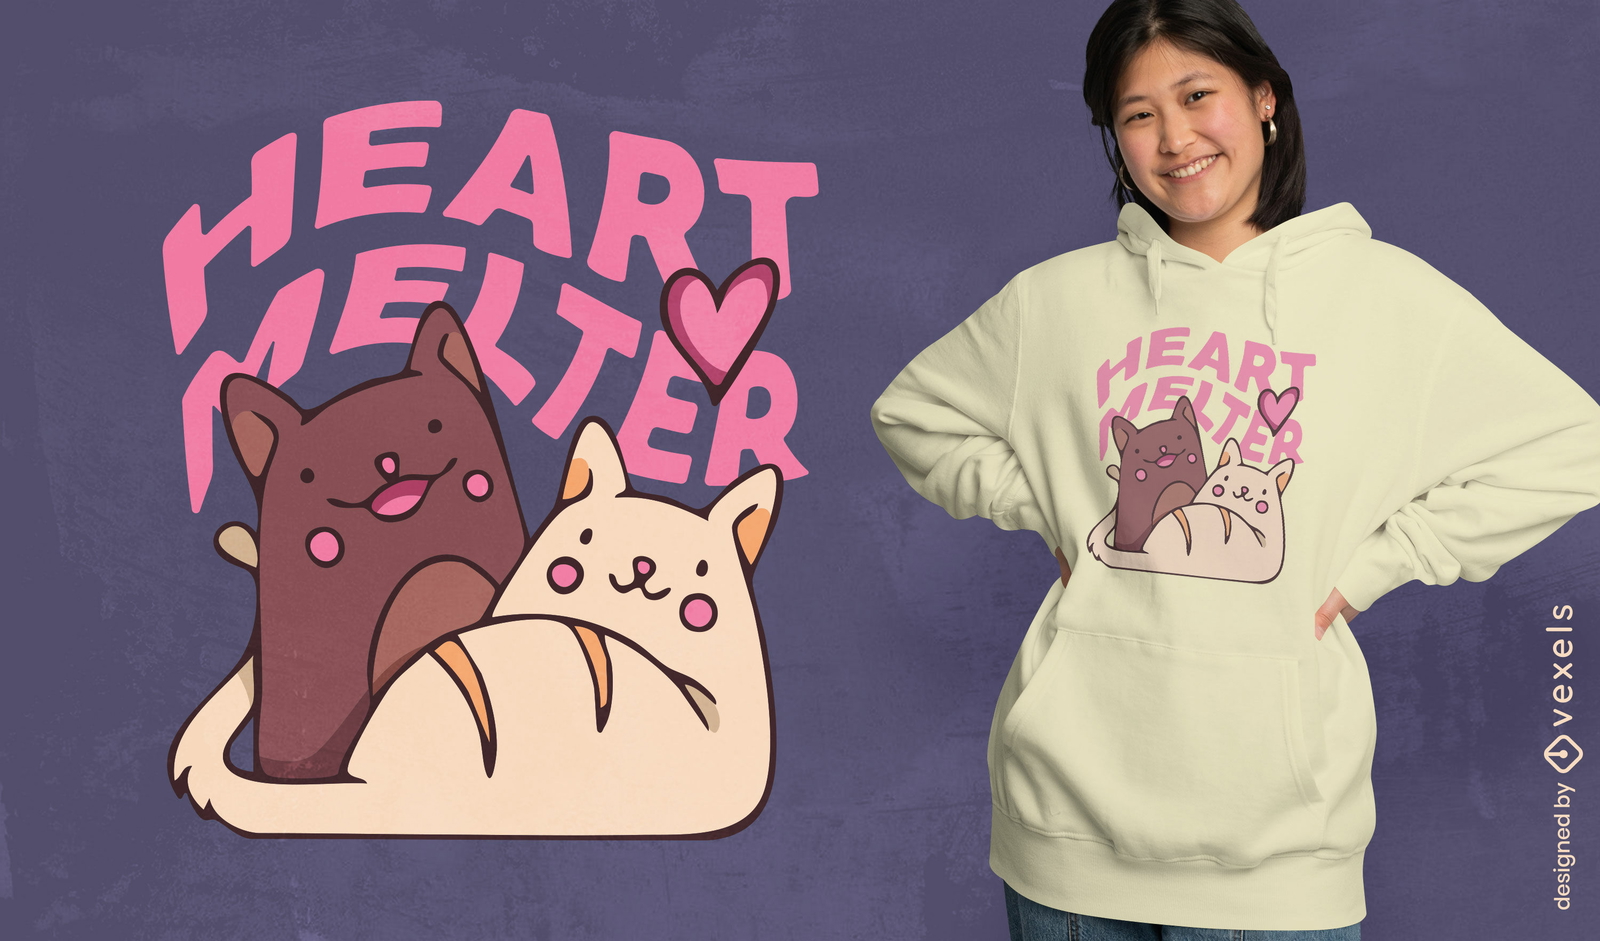
Design de camiseta de casal de gatos do dia dos namorados
Escolha uma pasta
Todos os favoritos
Criar novo
Salvar
Design de camiseta de casal de gatos do dia dos namorados
Pronto para imprimir
para Merch
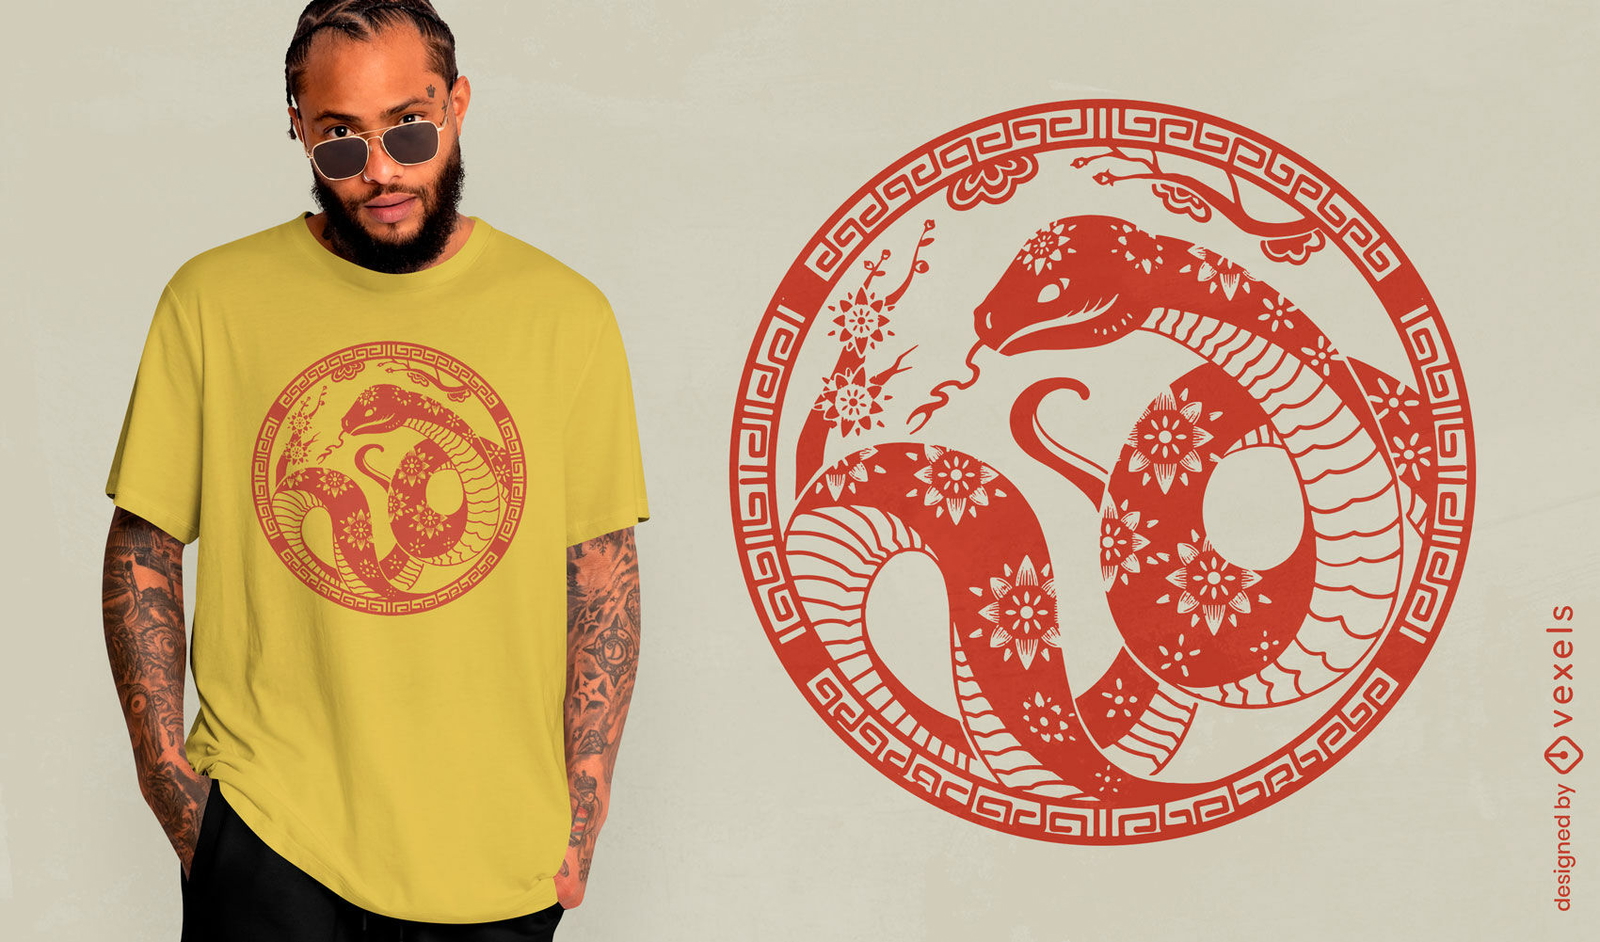
Design de camiseta de cobra tradicional chinesa
Escolha uma pasta
Todos os favoritos
Criar novo
Salvar
Design de camiseta de cobra tradicional chinesa
texto editável
Pronto para imprimir
para Merch
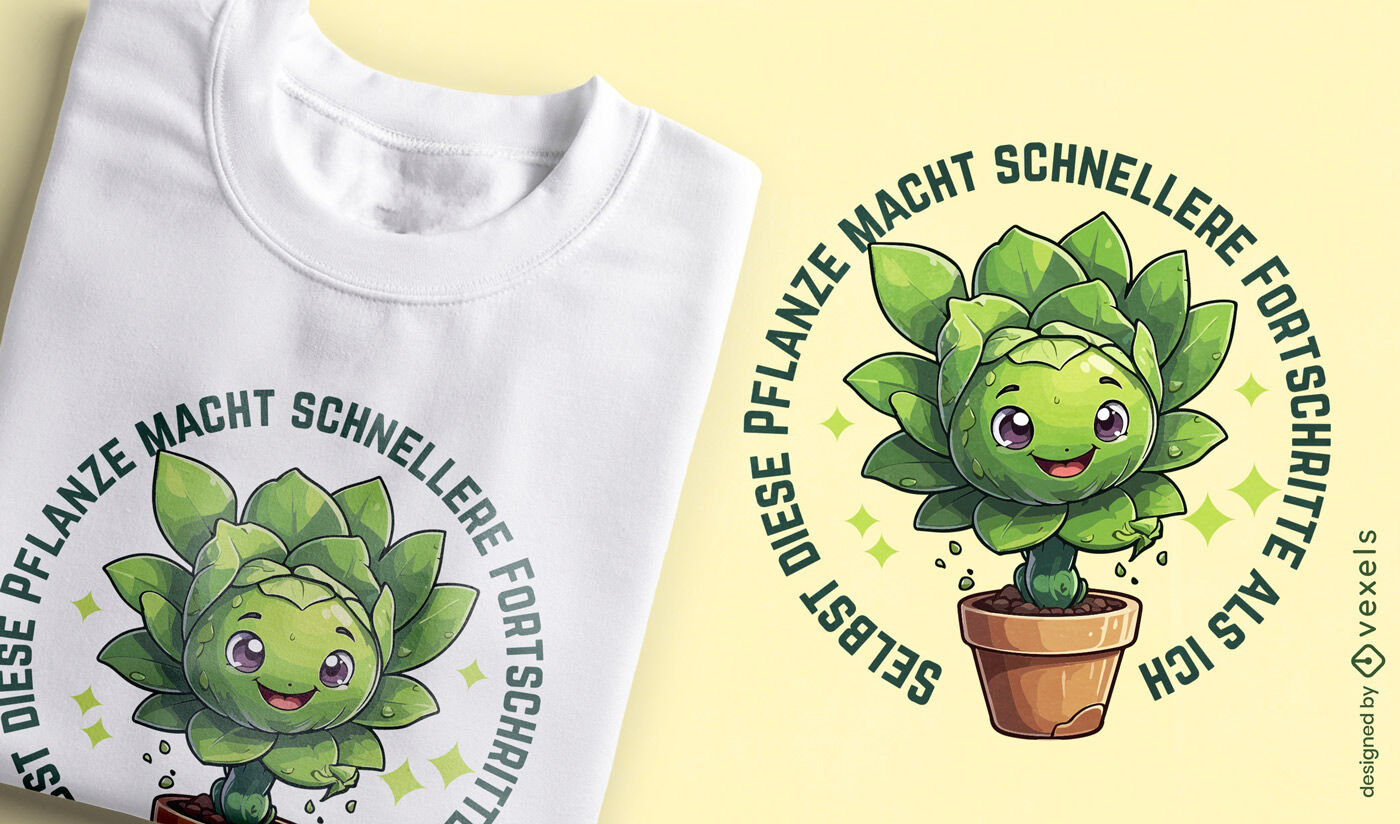
Design fofo de camiseta alemã suculenta
Escolha uma pasta
Todos os favoritos
Criar novo
Salvar
Design fofo de camiseta alemã suculenta
Gerado por IA, selecionado por nossos designers.
para Merch
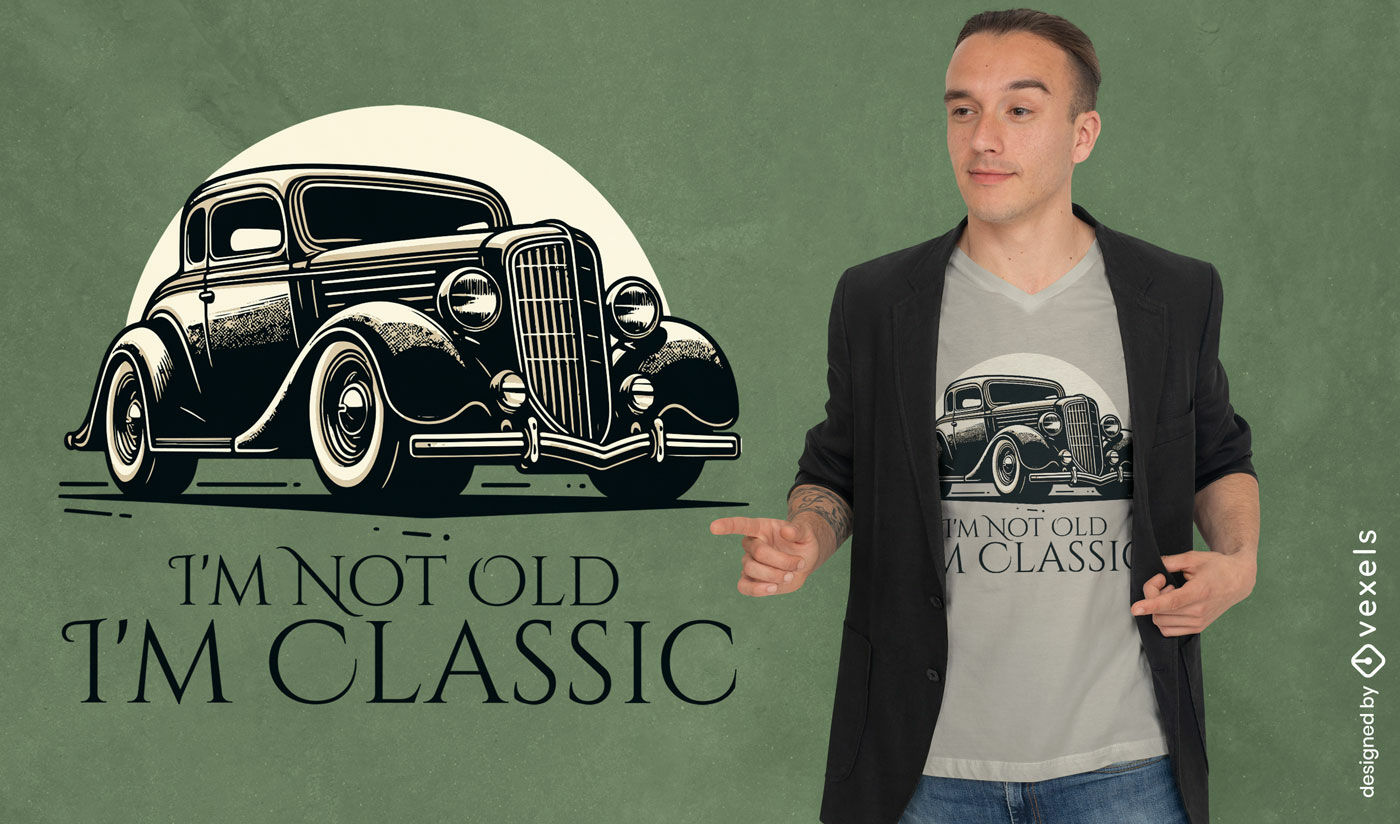
Design de camiseta vintage de carro clássico
Escolha uma pasta
Todos os favoritos
Criar novo
Salvar
Design de camiseta vintage de carro clássico
Editar online
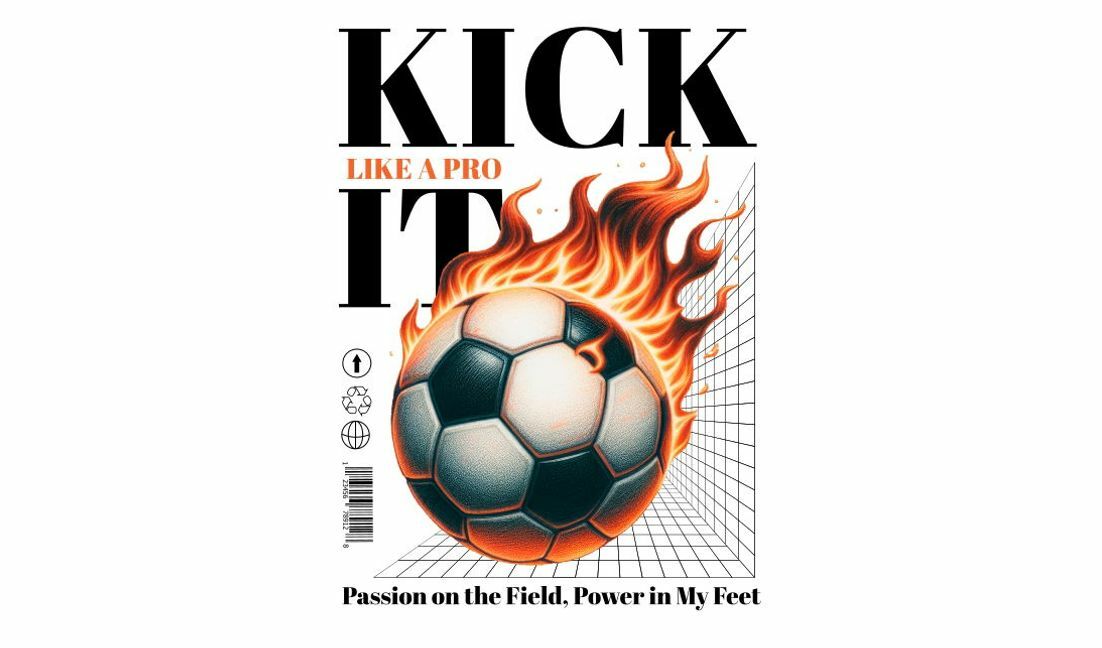
Modelo de design para camiseta Design dinâmico de capa de revista de futebol com uma bola em chamas
Escolha uma pasta
Todos os favoritos
Criar novo
Salvar
Modelo de design para camiseta Design dinâmico de capa de revista de futebol com uma bola em chamas
texto editável
Pronto para imprimir
para Merch
Design de camiseta "Cochilar é minha nova tradição de Natal"
Escolha uma pasta
Todos os favoritos
Criar novo
Salvar
Design de camiseta "Cochilar é minha nova tradição de Natal"
Pronto para imprimir
para Merch
Design de camiseta com cobra do zodíaco chinês
Escolha uma pasta
Todos os favoritos
Criar novo
Salvar
Design de camiseta com cobra do zodíaco chinês
Pronto para imprimir
para Merch
Design de camiseta com pílulas da felicidade de lhama
Escolha uma pasta
Todos os favoritos
Criar novo
Salvar
Design de camiseta com pílulas da felicidade de lhama
Gerado por IA, selecionado por nossos designers.
para Merch
Design de camiseta com citação de motociclista anjo
Escolha uma pasta
Todos os favoritos
Criar novo
Salvar
Design de camiseta com citação de motociclista anjo
Gerado por IA, selecionado por nossos designers.
para Merch
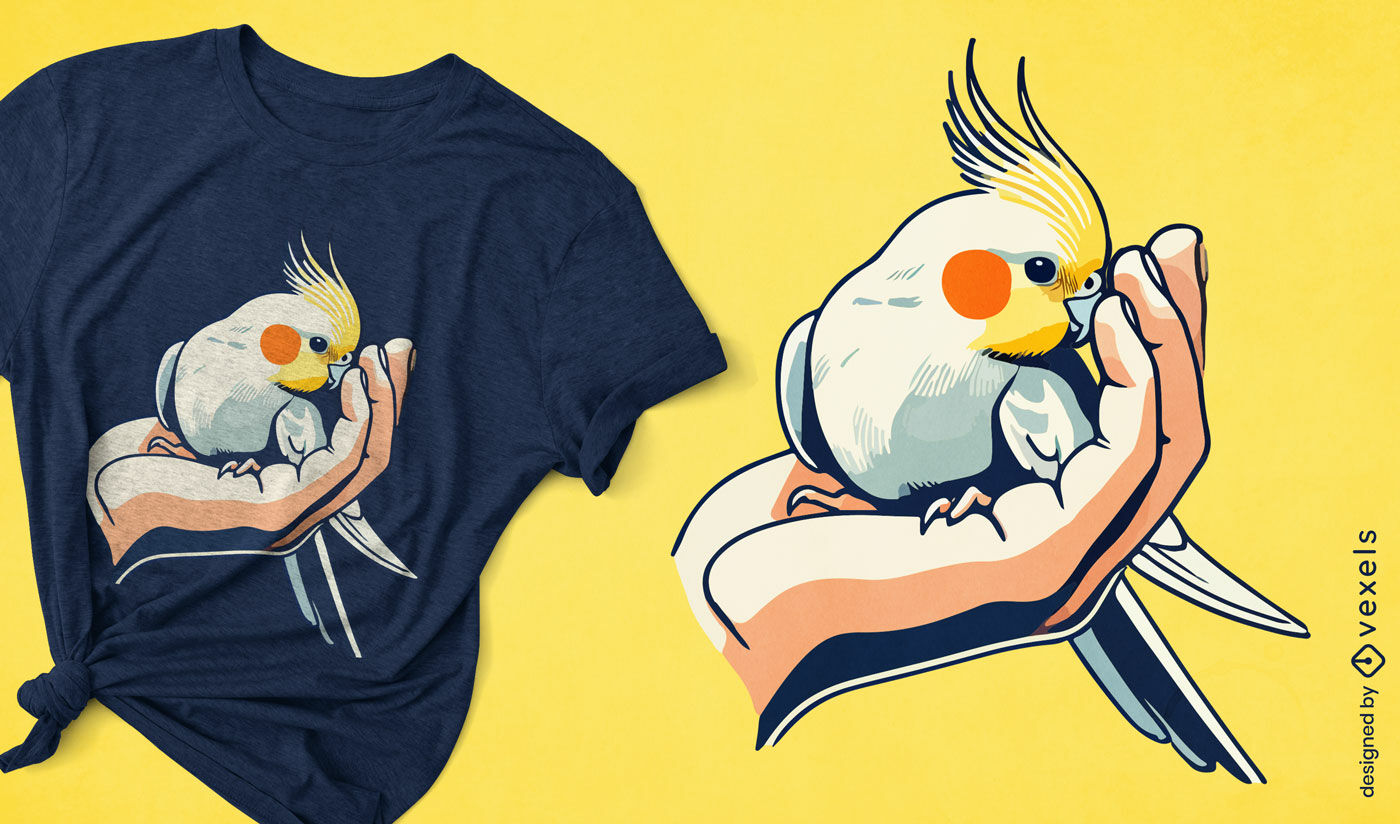
Design de camiseta de estimação de calopsita gentil
Escolha uma pasta
Todos os favoritos
Criar novo
Salvar
Design de camiseta de estimação de calopsita gentil
Pronto para imprimir
para Merch
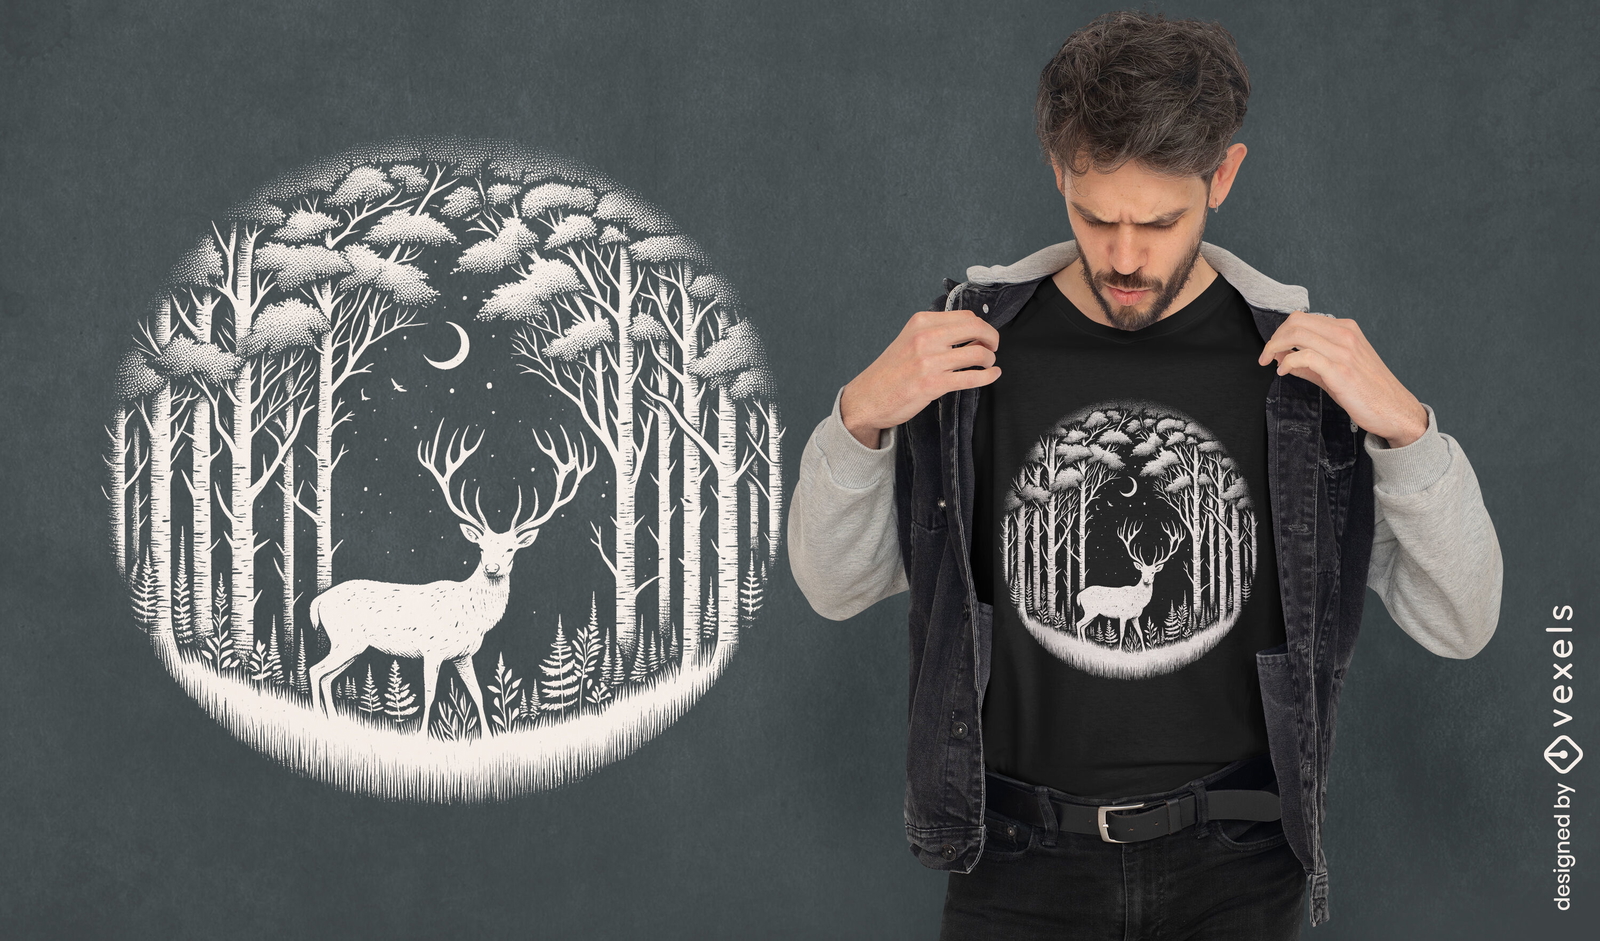
Design de camiseta com floresta de veados místicos
Escolha uma pasta
Todos os favoritos
Criar novo
Salvar
Design de camiseta com floresta de veados místicos
Pronto para imprimir
para Merch
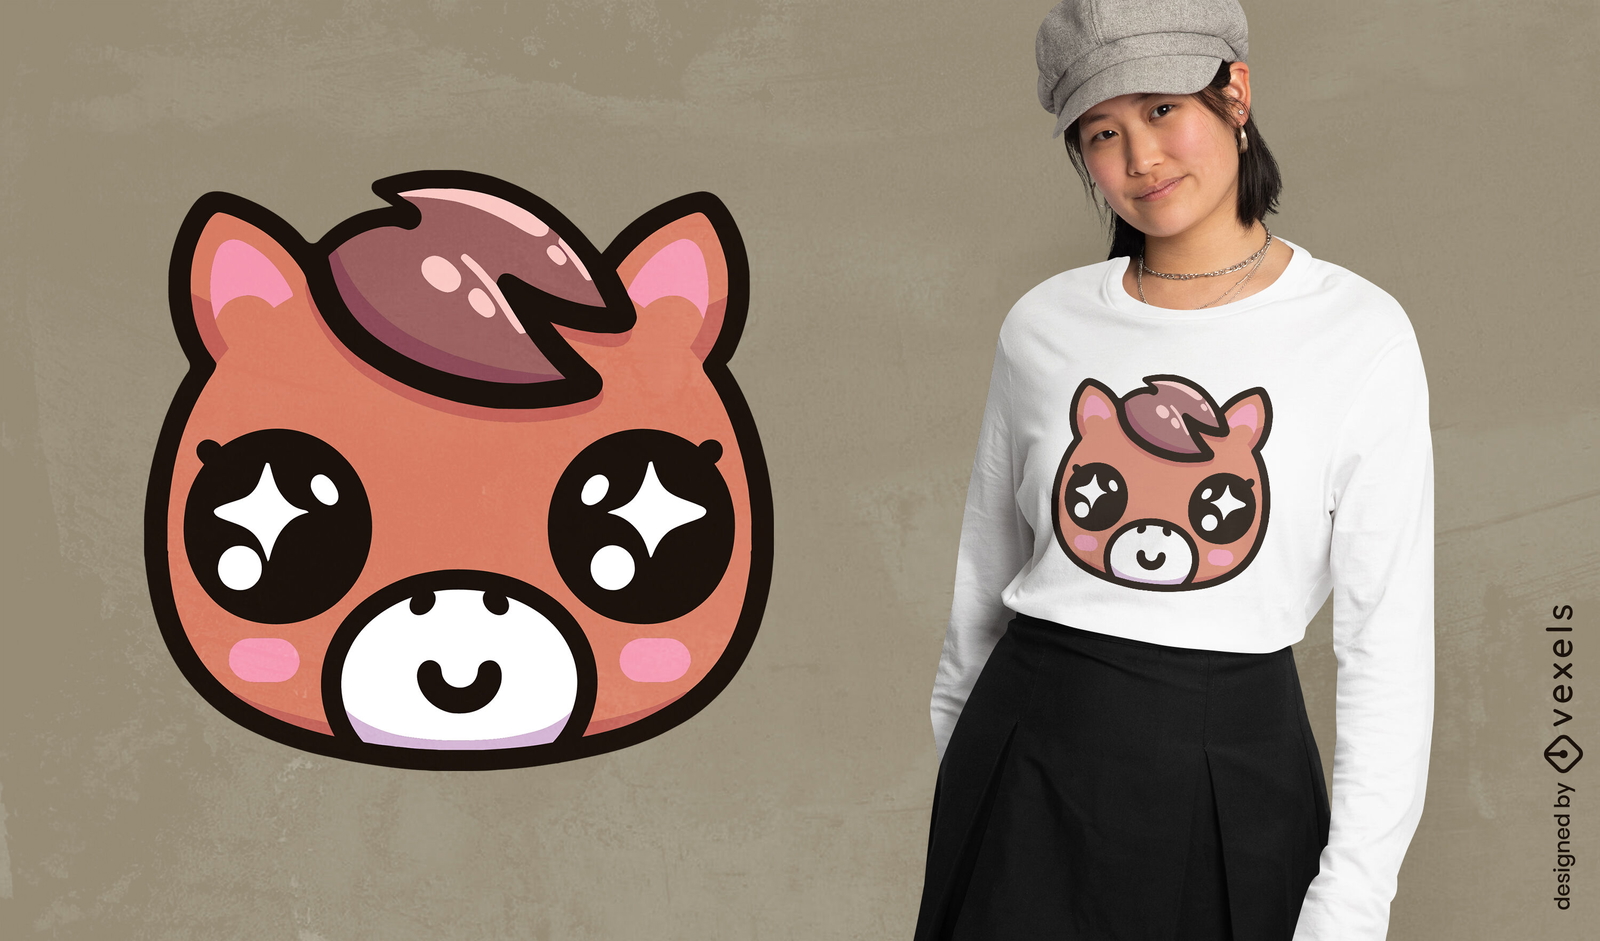
Design de camiseta com cara de cavalo kawaii
Escolha uma pasta
Todos os favoritos
Criar novo
Salvar
Design de camiseta com cara de cavalo kawaii
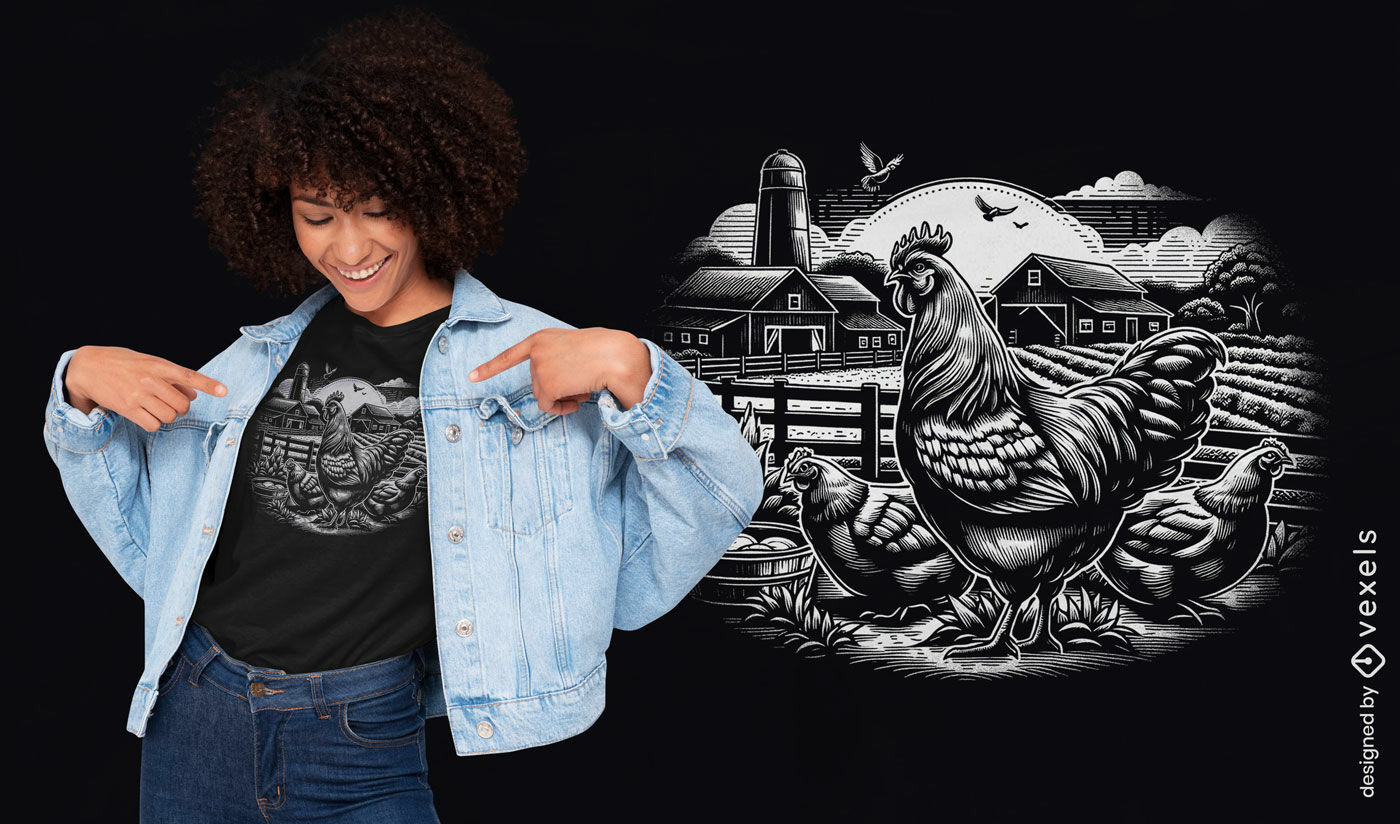
Gerado por IA, selecionado por nossos designers.
para Merch
Design de camiseta com ilustração de galinha de fazenda monocromática
Escolha uma pasta
Todos os favoritos
Criar novo
Salvar
Design de camiseta com ilustração de galinha de fazenda monocromática
Gerado por IA, selecionado por nossos designers.
para Merch
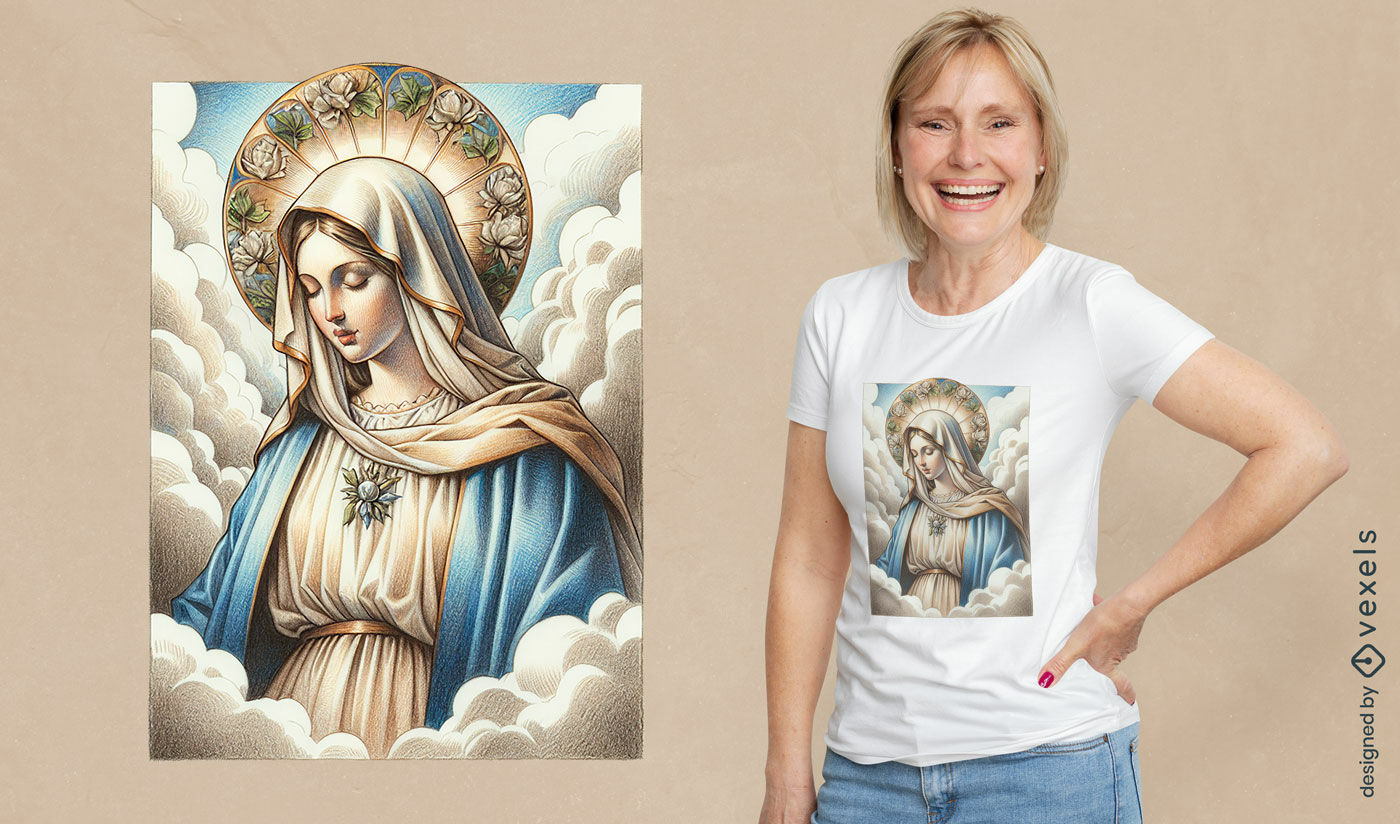
Arte da camiseta da Madonna Celestial
Escolha uma pasta
Todos os favoritos
Criar novo
Salvar
Arte da camiseta da Madonna Celestial
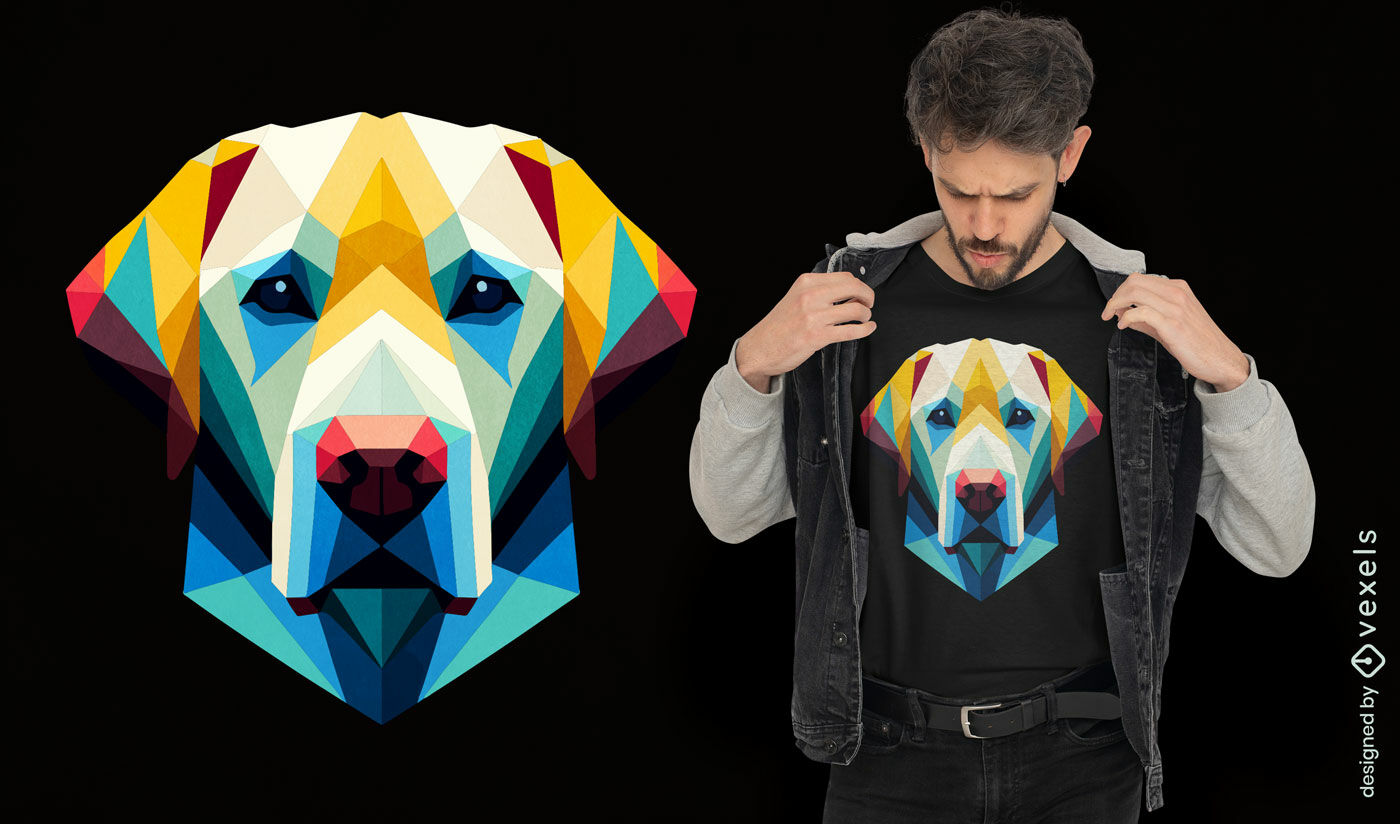
Gerado por IA, selecionado por nossos designers.
para Merch
Design geométrico para camiseta de cachorro Labrador
Escolha uma pasta
Todos os favoritos
Criar novo
Salvar
Design geométrico para camiseta de cachorro Labrador
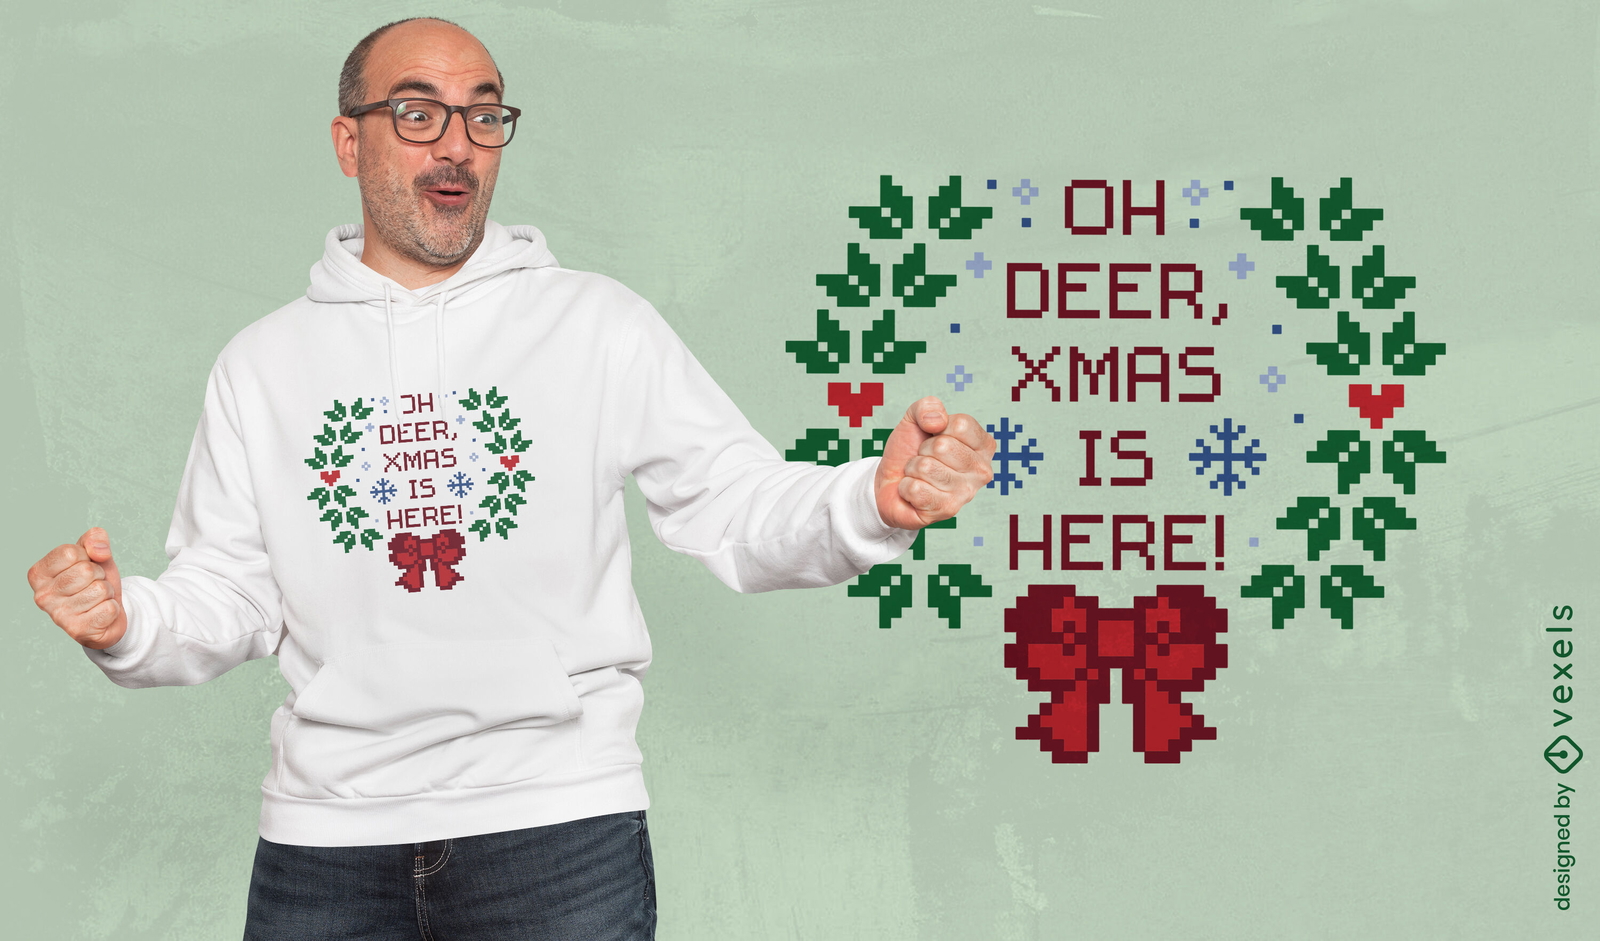
texto editável
Pronto para imprimir
para Merch
Design de camiseta de Natal Oh Deer
Escolha uma pasta
Todos os favoritos
Criar novo
Salvar
Design de camiseta de Natal Oh Deer
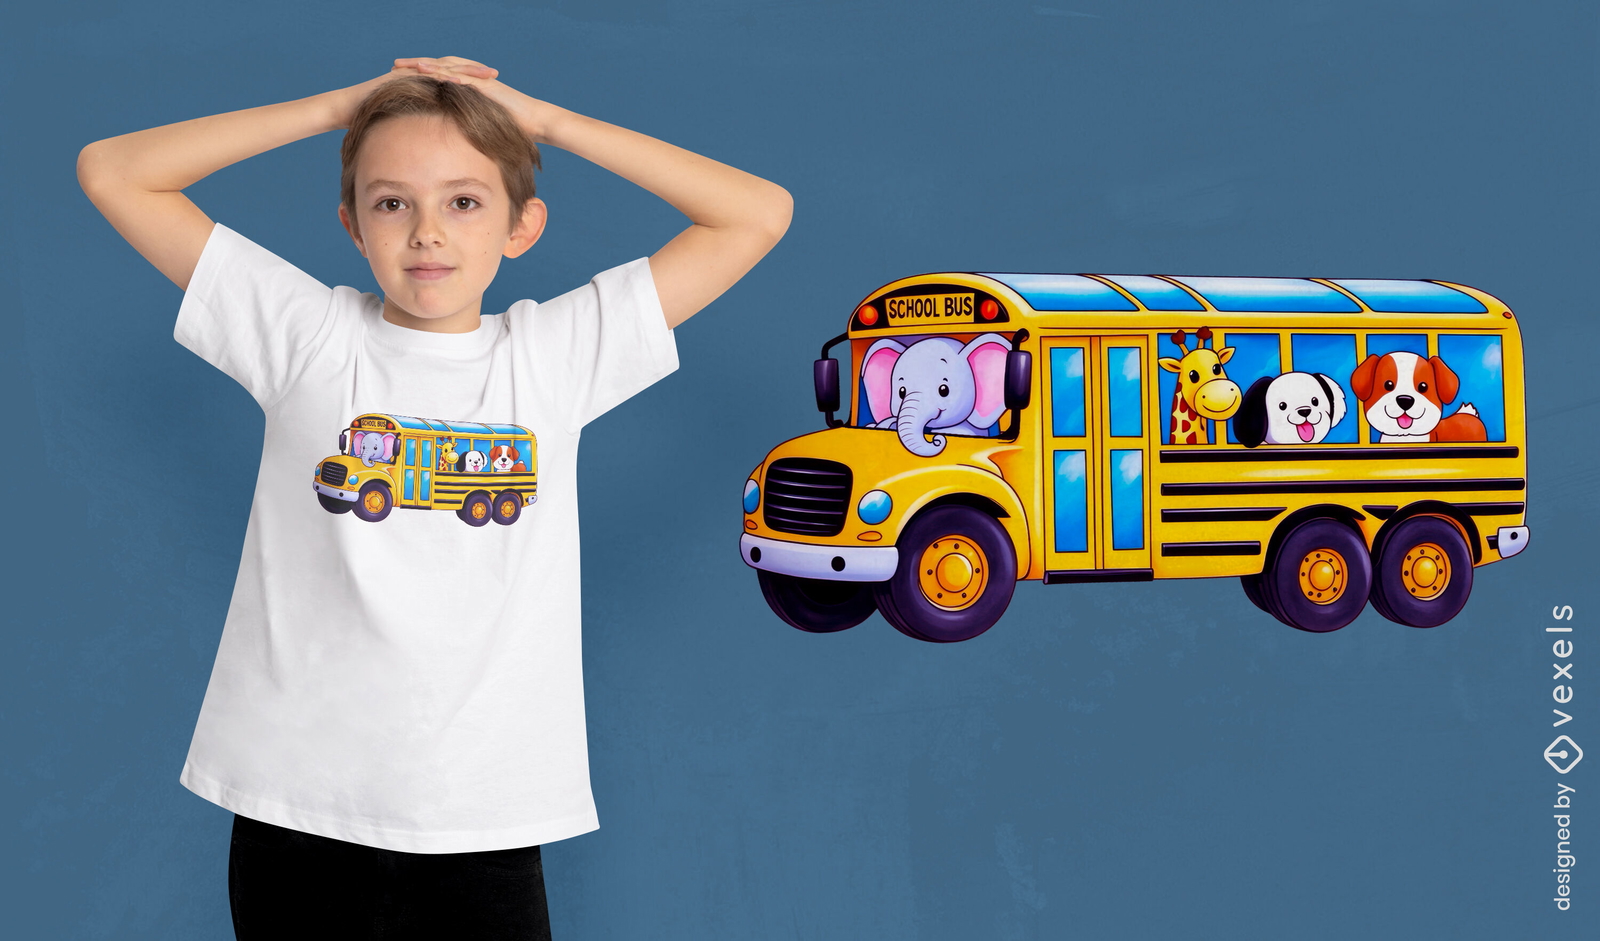
Gerado por IA, selecionado por nossos designers.
para Merch
Design de camiseta com retrato de leão majestoso
Escolha uma pasta
Todos os favoritos
Criar novo
Salvar
Design de camiseta com retrato de leão majestoso
Pronto para imprimir
para Merch
Design de camiseta de ônibus escolar com animais
Escolha uma pasta
Todos os favoritos
Criar novo
Salvar
Design de camiseta de ônibus escolar com animais
Gerado por IA, selecionado por nossos designers.
para Merch
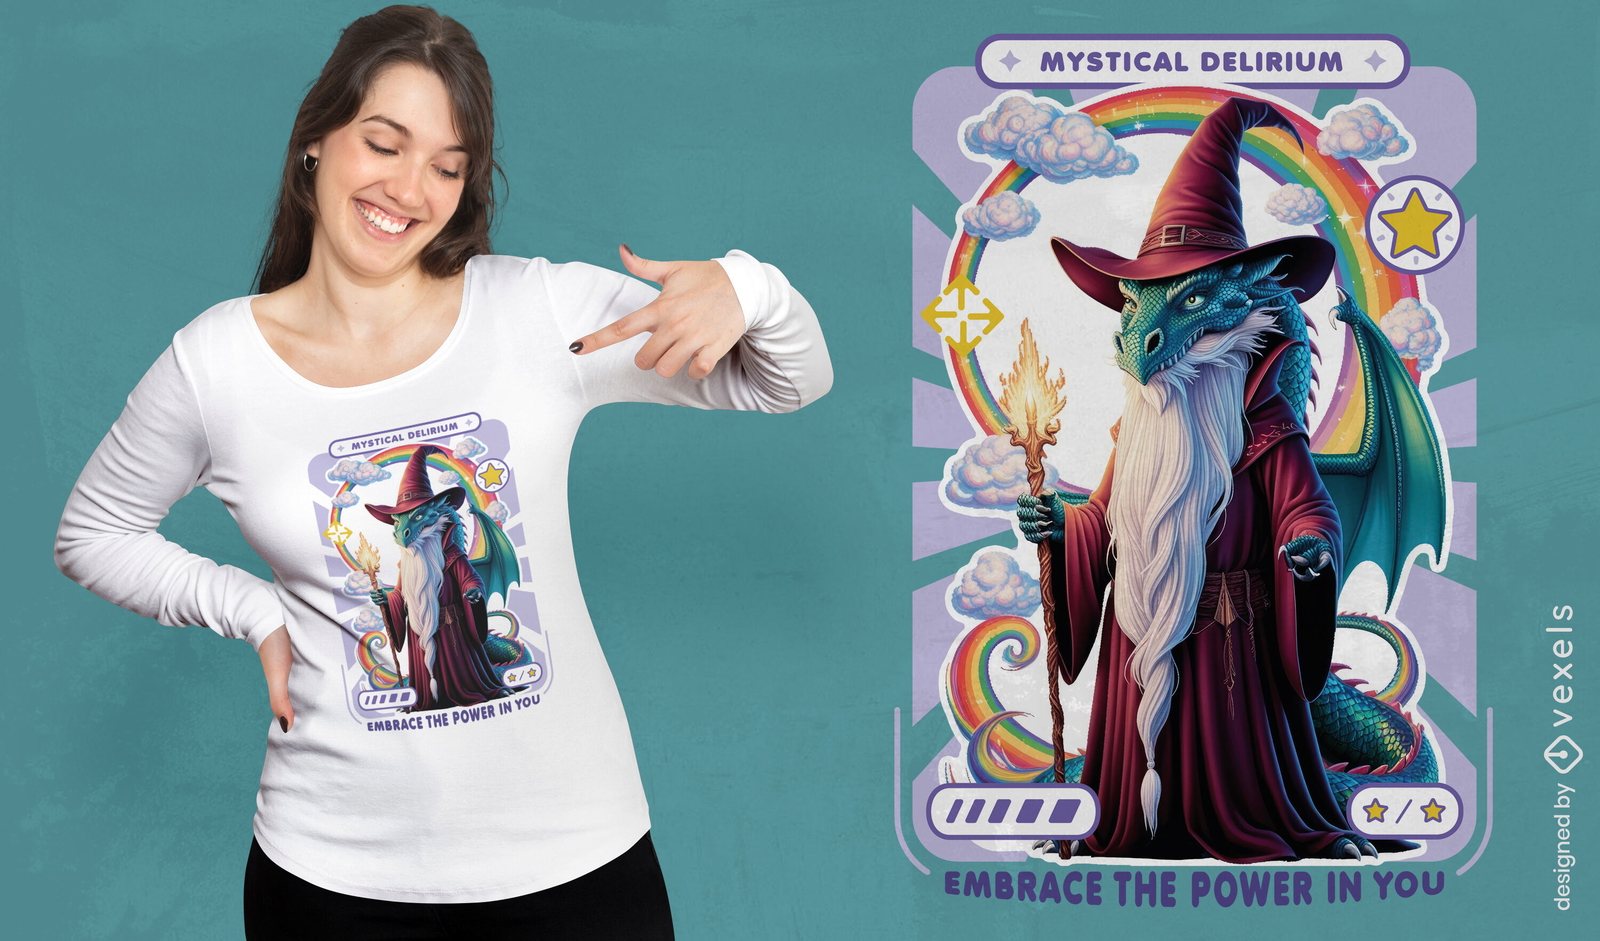
Design de camiseta do mago do delírio místico
Escolha uma pasta
Todos os favoritos
Criar novo
Salvar
Design de camiseta do mago do delírio místico
Gerado por IA, selecionado por nossos designers.
para Merch
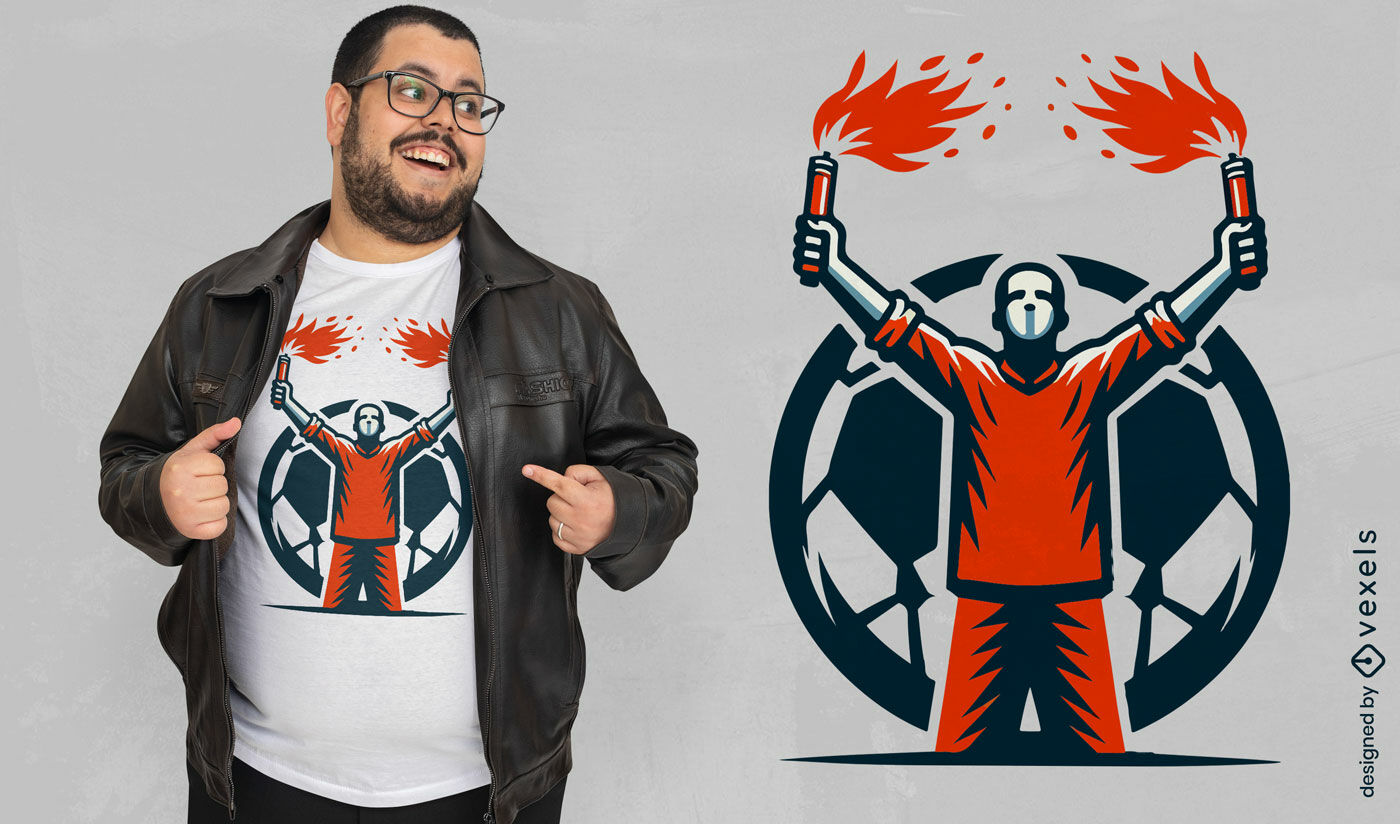
Design de camiseta fã de futebol com flares
Escolha uma pasta
Todos os favoritos
Criar novo
Salvar
Design de camiseta fã de futebol com flares
texto editável
Pronto para imprimir
para Merch
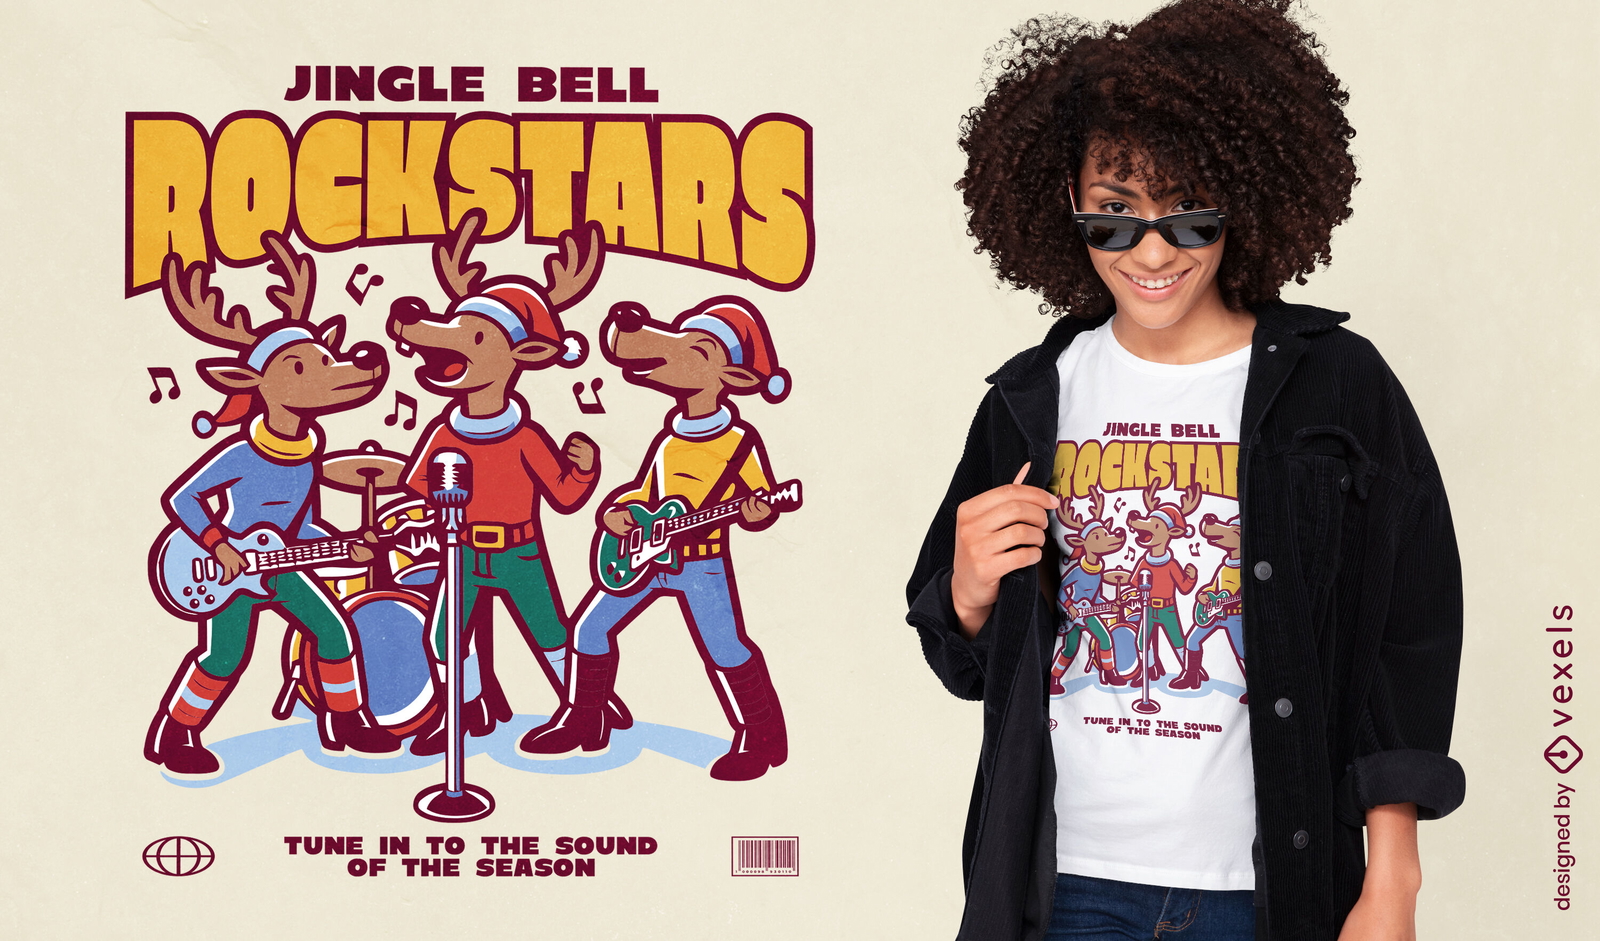
Design de camiseta Jingle Bell Rockstars
Escolha uma pasta
Todos os favoritos
Criar novo
Salvar
Design de camiseta Jingle Bell Rockstars
texto editável
Pronto para imprimir
para Merch
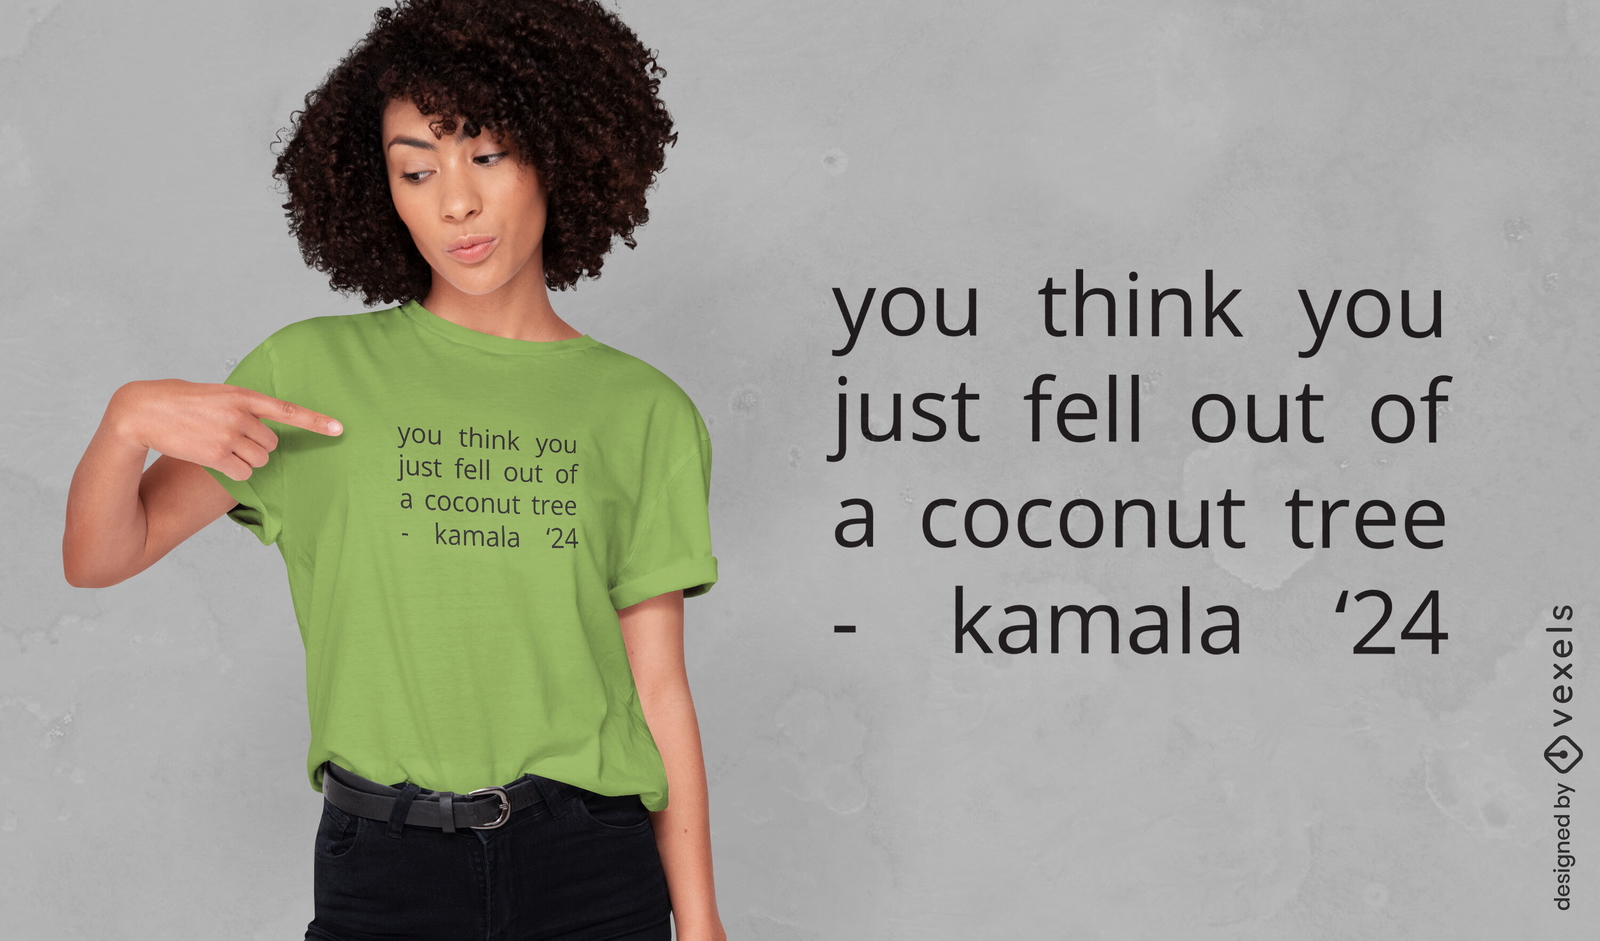
Design de camiseta com citação política de coqueiro
Escolha uma pasta
Todos os favoritos
Criar novo
Salvar
Design de camiseta com citação política de coqueiro
texto editável
Pronto para imprimir
para Merch
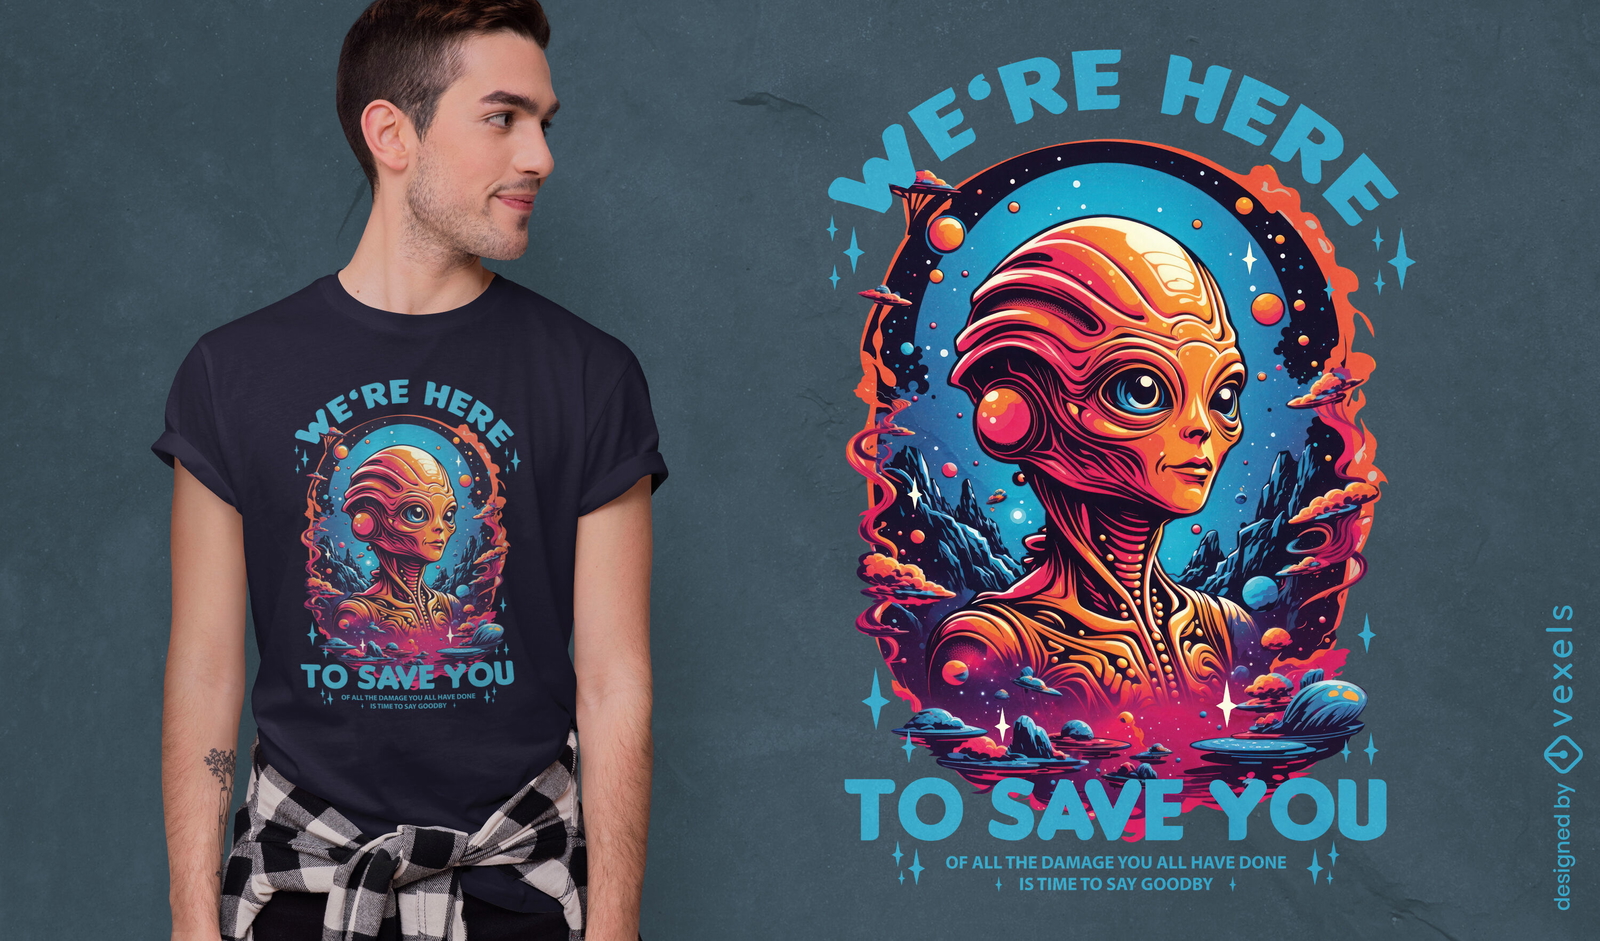
Design de camiseta de salvador alienígena
Escolha uma pasta
Todos os favoritos
Criar novo
Salvar
Design de camiseta de salvador alienígena
Gerado por IA, selecionado por nossos designers.
para Merch
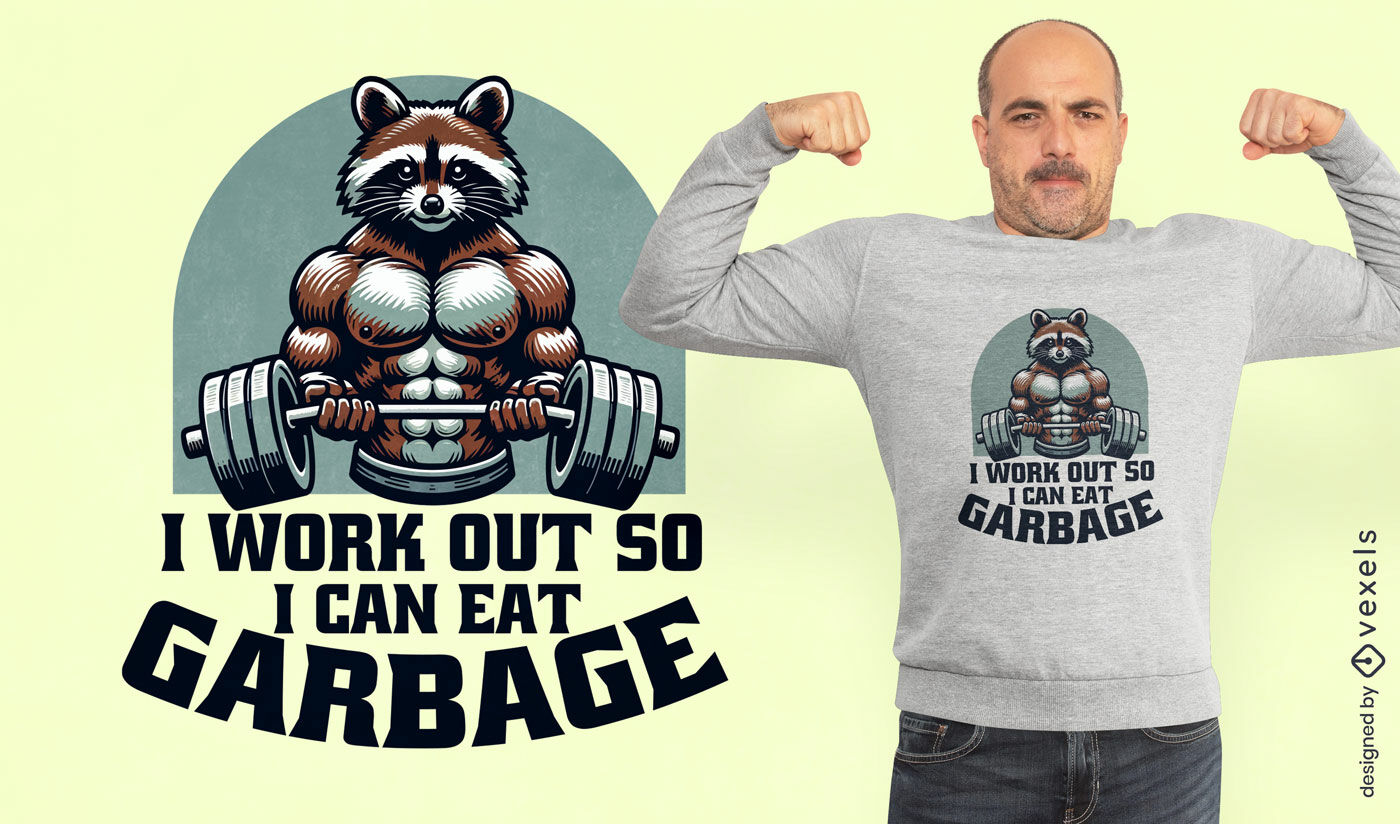
Design de camiseta com citação de treino de guaxinim Buff
Escolha uma pasta
Todos os favoritos
Criar novo
Salvar
Design de camiseta com citação de treino de guaxinim Buff
texto editável
Pronto para imprimir
para Merch
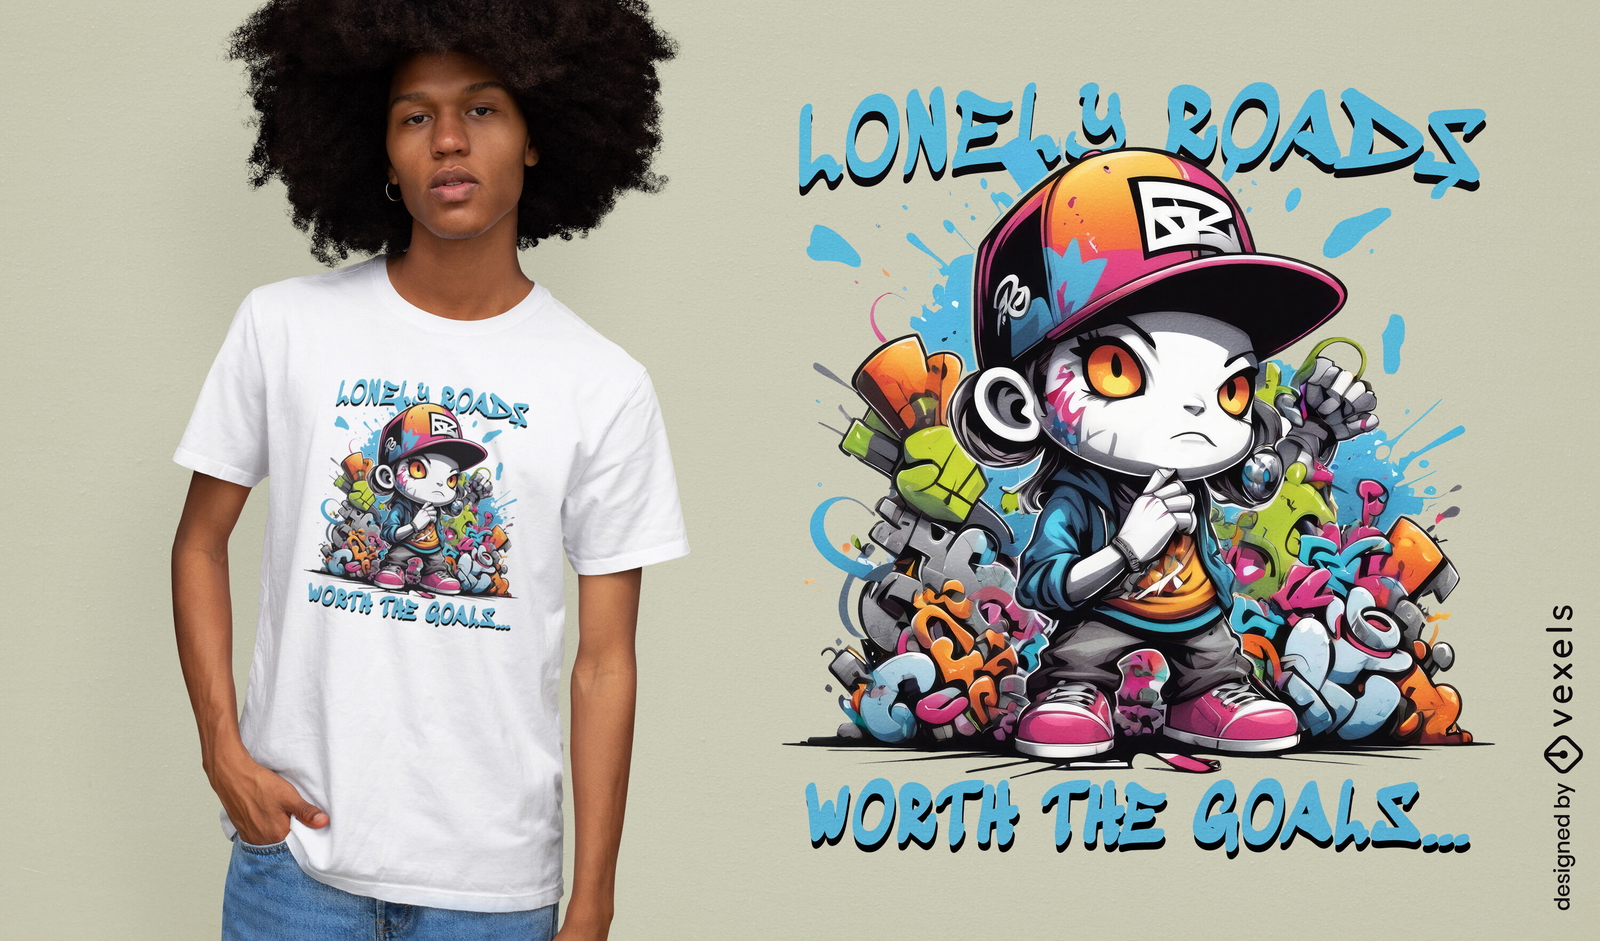
Design de camiseta com personagem de arte de rua
Escolha uma pasta
Todos os favoritos
Criar novo
Salvar
Design de camiseta com personagem de arte de rua
Pronto para imprimir
para Merch
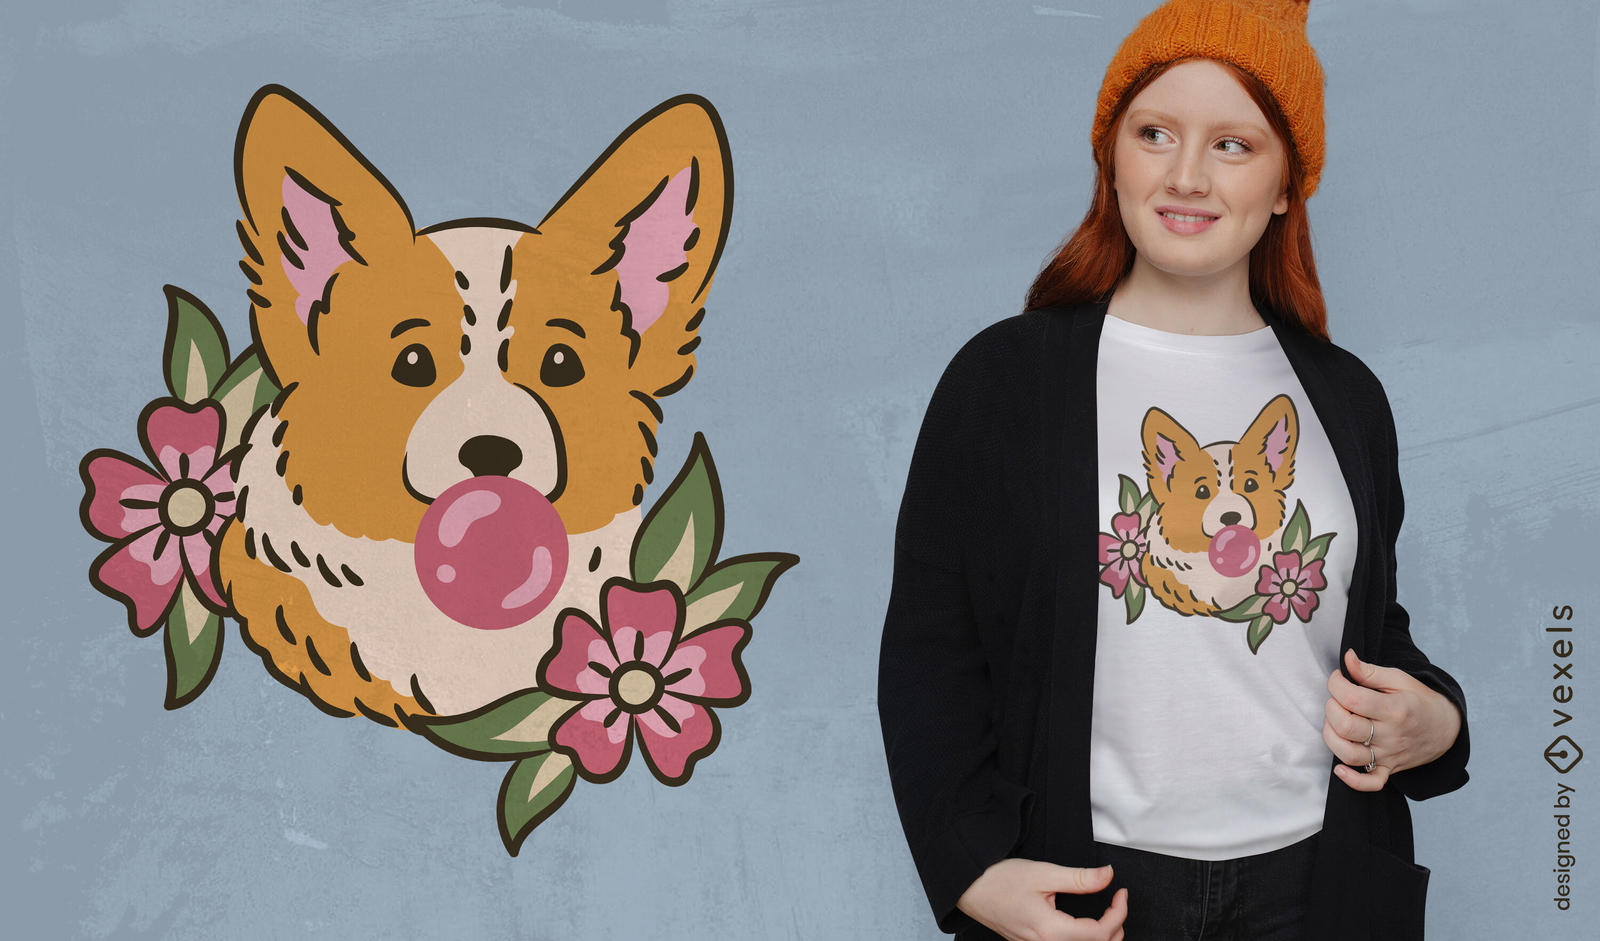
Design de camiseta Corgi bubblegum
Escolha uma pasta
Todos os favoritos
Criar novo
Salvar
Design de camiseta Corgi bubblegum
Gerado por IA, selecionado por nossos designers.
para Merch
Design de camiseta de menina anime sorrindo
Escolha uma pasta
Todos os favoritos
Criar novo
Salvar
Design de camiseta de menina anime sorrindo
Pronto para imprimir
para Merch
Design de camiseta com esqueleto de cerveja
Escolha uma pasta
Todos os favoritos
Criar novo
Salvar
Design de camiseta com esqueleto de cerveja
Pronto para imprimir
para Merch
Design de camiseta de porco enlameado
Escolha uma pasta
Todos os favoritos
Criar novo
Salvar
Design de camiseta de porco enlameado
Gerado por IA, selecionado por nossos designers.
para Merch
Design vibrante de camiseta de carro de corrida
Escolha uma pasta
Todos os favoritos
Criar novo
Salvar
Design vibrante de camiseta de carro de corrida
Gerado por IA, selecionado por nossos designers.
para Merch
Design diabólico de camiseta do diabo vermelho
Escolha uma pasta
Todos os favoritos
Criar novo
Salvar
Design diabólico de camiseta do diabo vermelho
texto editável
Pronto para imprimir
para Merch
Design de camiseta com asas de ?guia da liberdade
Escolha uma pasta
Todos os favoritos
Criar novo
Salvar
Design de camiseta com asas de ?guia da liberdade
Pronto para imprimir
para Merch
Design de camisetas com ?cones de banheiro
Escolha uma pasta
Todos os favoritos
Criar novo
Salvar
Design de camisetas com ?cones de banheiro
texto editável
Pronto para imprimir
para Merch
Design de camiseta de cachorro-quente com vibe americana
Escolha uma pasta
Todos os favoritos
Criar novo
Salvar
Design de camiseta de cachorro-quente com vibe americana
Pronto para imprimir
para Merch
Design de camiseta de desenho animado de amigo cannabis
Escolha uma pasta
Todos os favoritos
Criar novo
Salvar
Design de camiseta de desenho animado de amigo cannabis
Impulsione seu negócio
Com a plataforma gráfica líder de mercado.
Ver planos
Próxima
do 636
prev page
next page