Biblioteca de design
Novos designs Merch
Camisetas
Vectores
Designs de Merch de Tendência
PNGs & SVGs
Mockups
Modelos de T-Shirt PSD
Explorar Desenhos
Designs KDP
Pôsteres
Canecas
Capas para celular
Sacos de compras
Almofadas
Ferramentas de desenho
Merch Designer
Novo!
Mockup Generator
Gerador de Design de AI
Vetorizador
Quote Generator
T-Shirt Maker (Antigo)
Ajuda
Merch Digest
Blog
Centro de Ajuda
Saiba mais sobre o Merch
Feedback
Soluções Corporativas
Empresa
Acesso à API
Estúdio de Design
Design em Lote
Preços
Carregando...
Inscrever-se
Conecte-se
All
graph
Biblioteca de design
Novos designs Merch
Camisetas
Vectores
Designs de Merch de Tendência
PNGs & SVGs
Mockups
Modelos de T-Shirt PSD
Explorar Desenhos
Designs KDP
Pôsteres
Canecas
Capas para celular
Sacos de compras
Almofadas
Ferramentas de desenho
Merch Designer
Novo!
Mockup Generator
Gerador de Design de AI
Vetorizador
Quote Generator
T-Shirt Maker (Antigo)
Ajuda
Merch Digest
Blog
Centro de Ajuda
Saiba mais sobre o Merch
Feedback
Soluções Corporativas
Empresa
Acesso à API
Estúdio de Design
Design em Lote
PLANOS
All
graph
364 Gráficos e Designs de graph para Camisetas e Merch print on demand
Baixar designs de camisetas e para merch, como capas de livro, capas de celular, tote bags e mais de graph
Relacionado:
graphixshare
,
este design graphic tee pode ser usado em camisas
,
historia em quadrinhos
Ordenar por
Mais relevante
Resultados patrocinados da
Ganhe 15% de desconto com o código: VEXELS15
veja mais detalhes
Exibição de gráfico desenhado à mão Desenho PNG
Escolha uma pasta
Todos os favoritos
Criar novo
Salvar
Exibição de gráfico desenhado à mão Desenho PNG
Premium
Ícone de direção da seta do gráfico crescente Desenho PNG
Escolha uma pasta
Todos os favoritos
Criar novo
Salvar
Ícone de direção da seta do gráfico crescente Desenho PNG
Premium
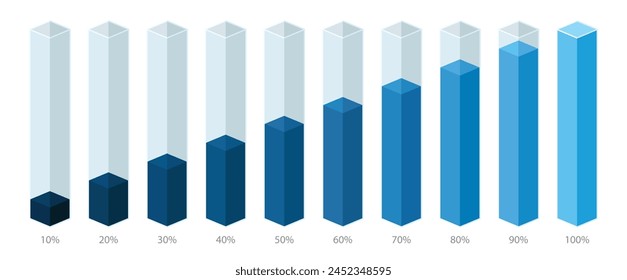
Gráfico de barras crescente Desenho PNG
Escolha uma pasta
Todos os favoritos
Criar novo
Salvar
Gráfico de barras crescente Desenho PNG
Empresário apresentando gráfico a bordo Desenho PNG
Escolha uma pasta
Todos os favoritos
Criar novo
Salvar
Empresário apresentando gráfico a bordo Desenho PNG
Premium
Ícone gráfico da tela do projetor Desenho PNG
Escolha uma pasta
Todos os favoritos
Criar novo
Salvar
Ícone gráfico da tela do projetor Desenho PNG
Premium
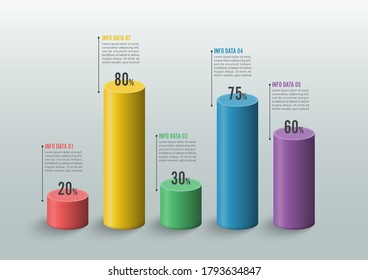
Gráfico de partes em 3D Desenho PNG
Escolha uma pasta
Todos os favoritos
Criar novo
Salvar
Gráfico de partes em 3D Desenho PNG
Premium
Gráfico de linha Desenho PNG
Escolha uma pasta
Todos os favoritos
Criar novo
Salvar
Gráfico de linha Desenho PNG
Diminuindo a seta de direção da seta do gráfico Desenho PNG
Escolha uma pasta
Todos os favoritos
Criar novo
Salvar
Diminuindo a seta de direção da seta do gráfico Desenho PNG
Premium
Infográfico de adesivo elíptico gráfico Desenho PNG
Escolha uma pasta
Todos os favoritos
Criar novo
Salvar
Infográfico de adesivo elíptico gráfico Desenho PNG
Premium
Gráfico de setas de barras crescentes Desenho PNG
Escolha uma pasta
Todos os favoritos
Criar novo
Salvar
Gráfico de setas de barras crescentes Desenho PNG
Premium
Gráfico laranja verde azul Desenho PNG
Escolha uma pasta
Todos os favoritos
Criar novo
Salvar
Gráfico laranja verde azul Desenho PNG
Premium
Traço da linha do círculo do gráfico Desenho PNG
Escolha uma pasta
Todos os favoritos
Criar novo
Salvar
Traço da linha do círculo do gráfico Desenho PNG
Premium
Ícone do gráfico de pizza Desenho PNG
Escolha uma pasta
Todos os favoritos
Criar novo
Salvar
Ícone do gráfico de pizza Desenho PNG
Premium
Ícone de gráfico Desenho PNG
Escolha uma pasta
Todos os favoritos
Criar novo
Salvar
Ícone de gráfico Desenho PNG
Traço gráfico de função quadrática Desenho PNG
Escolha uma pasta
Todos os favoritos
Criar novo
Salvar
Traço gráfico de função quadrática Desenho PNG
Gráfico de aumento de escala simples Desenho PNG
Escolha uma pasta
Todos os favoritos
Criar novo
Salvar
Gráfico de aumento de escala simples Desenho PNG
Ícone de gráfico de crescimento de empresário em pé Desenho PNG
Escolha uma pasta
Todos os favoritos
Criar novo
Salvar
Ícone de gráfico de crescimento de empresário em pé Desenho PNG
Premium
Ícone de círculo gráfico de tv Desenho PNG
Escolha uma pasta
Todos os favoritos
Criar novo
Salvar
Ícone de círculo gráfico de tv Desenho PNG
Premium
Gráfico de barras colorido de dois lados Desenho PNG
Escolha uma pasta
Todos os favoritos
Criar novo
Salvar
Gráfico de barras colorido de dois lados Desenho PNG
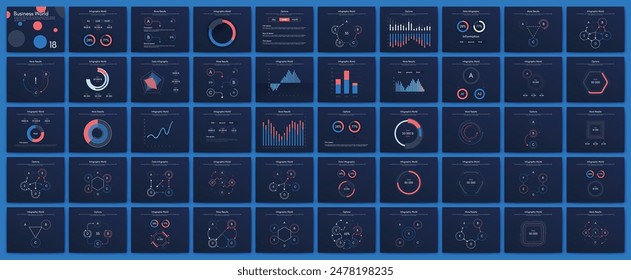
Pacote de ícones de gráficos e círculos
Escolha uma pasta
Todos os favoritos
Criar novo
Salvar
Pacote de ícones de gráficos e círculos
Premium
Ícone quadrado do gráfico de barras Desenho PNG
Escolha uma pasta
Todos os favoritos
Criar novo
Salvar
Ícone quadrado do gráfico de barras Desenho PNG
Premium
Gráfico de barras multicolorido com ícones Desenho PNG
Escolha uma pasta
Todos os favoritos
Criar novo
Salvar
Gráfico de barras multicolorido com ícones Desenho PNG
Traço de barras do gráfico crescente Desenho PNG
Escolha uma pasta
Todos os favoritos
Criar novo
Salvar
Traço de barras do gráfico crescente Desenho PNG
Gráfico de função logarítmica plano Desenho PNG
Escolha uma pasta
Todos os favoritos
Criar novo
Salvar
Gráfico de função logarítmica plano Desenho PNG
Premium
Adesivo de infográfico quadrado gráfico Desenho PNG
Escolha uma pasta
Todos os favoritos
Criar novo
Salvar
Adesivo de infográfico quadrado gráfico Desenho PNG
Ícone de gráfico de barras colorido Desenho PNG
Escolha uma pasta
Todos os favoritos
Criar novo
Salvar
Ícone de gráfico de barras colorido Desenho PNG
Doodle de apresentação de gráfico Desenho PNG
Escolha uma pasta
Todos os favoritos
Criar novo
Salvar
Doodle de apresentação de gráfico Desenho PNG
Premium
Smartphone com ícone de gráfico Desenho PNG
Escolha uma pasta
Todos os favoritos
Criar novo
Salvar
Smartphone com ícone de gráfico Desenho PNG
Doodle de gráfico de função linear Desenho PNG
Escolha uma pasta
Todos os favoritos
Criar novo
Salvar
Doodle de gráfico de função linear Desenho PNG
Premium
Ícone de quadro gráfico isométrico Desenho PNG
Escolha uma pasta
Todos os favoritos
Criar novo
Salvar
Ícone de quadro gráfico isométrico Desenho PNG
texto editável
Premium
Logotipo de formas planas de gráfico
Escolha uma pasta
Todos os favoritos
Criar novo
Salvar
Logotipo de formas planas de gráfico
Premium
Sinal gráfico crescente Desenho PNG
Escolha uma pasta
Todos os favoritos
Criar novo
Salvar
Sinal gráfico crescente Desenho PNG
texto editável
Premium
Logotipo de formas de gráfico de contabilidade
Escolha uma pasta
Todos os favoritos
Criar novo
Salvar
Logotipo de formas de gráfico de contabilidade
Gráfico de função linear Desenho PNG
Escolha uma pasta
Todos os favoritos
Criar novo
Salvar
Gráfico de função linear Desenho PNG
Ícone de traço gráfico Desenho PNG
Escolha uma pasta
Todos os favoritos
Criar novo
Salvar
Ícone de traço gráfico Desenho PNG
Premium
Ícone de bolha do gráfico Desenho PNG
Escolha uma pasta
Todos os favoritos
Criar novo
Salvar
Ícone de bolha do gráfico Desenho PNG
Premium
Gráfico no ícone do smartphone Desenho PNG
Escolha uma pasta
Todos os favoritos
Criar novo
Salvar
Gráfico no ícone do smartphone Desenho PNG
Premium
Gráfico na tela do celular Desenho PNG
Escolha uma pasta
Todos os favoritos
Criar novo
Salvar
Gráfico na tela do celular Desenho PNG
Premium
Ferramenta de gráfico de radar Desenho PNG
Escolha uma pasta
Todos os favoritos
Criar novo
Salvar
Ferramenta de gráfico de radar Desenho PNG
Traço gráfico de função linear Desenho PNG
Escolha uma pasta
Todos os favoritos
Criar novo
Salvar
Traço gráfico de função linear Desenho PNG
Doodle de gráfico de função quadrática Desenho PNG
Escolha uma pasta
Todos os favoritos
Criar novo
Salvar
Doodle de gráfico de função quadrática Desenho PNG
Premium
Gráfico de tira redonda Desenho PNG
Escolha uma pasta
Todos os favoritos
Criar novo
Salvar
Gráfico de tira redonda Desenho PNG
Premium
Gráfico de crescimento no ícone do smartphone Desenho PNG
Escolha uma pasta
Todos os favoritos
Criar novo
Salvar
Gráfico de crescimento no ícone do smartphone Desenho PNG
Premium
Ferramenta de gráfico de linha Desenho PNG
Escolha uma pasta
Todos os favoritos
Criar novo
Salvar
Ferramenta de gráfico de linha Desenho PNG
Barras do gráfico planas Desenho PNG
Escolha uma pasta
Todos os favoritos
Criar novo
Salvar
Barras do gráfico planas Desenho PNG
Traço da curva do gráfico Desenho PNG
Escolha uma pasta
Todos os favoritos
Criar novo
Salvar
Traço da curva do gráfico Desenho PNG
Gráfico de função quadrática plana Desenho PNG
Escolha uma pasta
Todos os favoritos
Criar novo
Salvar
Gráfico de função quadrática plana Desenho PNG
Premium
Ícone de traço gráfico crescente Desenho PNG
Escolha uma pasta
Todos os favoritos
Criar novo
Salvar
Ícone de traço gráfico crescente Desenho PNG
Gráfico de função linear plano Desenho PNG
Escolha uma pasta
Todos os favoritos
Criar novo
Salvar
Gráfico de função linear plano Desenho PNG
Premium
Ferramenta de gráfico de pizza Desenho PNG
Escolha uma pasta
Todos os favoritos
Criar novo
Salvar
Ferramenta de gráfico de pizza Desenho PNG
Impulsione seu negócio
Com a plataforma gráfica líder de mercado.
Ver planos
Próxima
do 8
prev page
next page