Biblioteca de design
Novos designs Merch
Camisetas
Vectores
Designs de Merch de Tendência
PNGs & SVGs
Mockups
Modelos de T-Shirt PSD
Explorar Desenhos
Designs KDP
Pôsteres
Canecas
Capas para celular
Sacos de compras
Almofadas
Ferramentas de desenho
Merch Designer
Novo!
Mockup Generator
Gerador de Design de AI
Vetorizador
Quote Generator
T-Shirt Maker (Antigo)
Ajuda
Merch Digest
Blog
Centro de Ajuda
Saiba mais sobre o Merch
Feedback
Soluções Corporativas
Empresa
Acesso à API
Estúdio de Design
Design em Lote
Preços
Carregando...
Inscrever-se
Conecte-se
All
graph
Biblioteca de design
Novos designs Merch
Camisetas
Vectores
Designs de Merch de Tendência
PNGs & SVGs
Mockups
Modelos de T-Shirt PSD
Explorar Desenhos
Designs KDP
Pôsteres
Canecas
Capas para celular
Sacos de compras
Almofadas
Ferramentas de desenho
Merch Designer
Novo!
Mockup Generator
Gerador de Design de AI
Vetorizador
Quote Generator
T-Shirt Maker (Antigo)
Ajuda
Merch Digest
Blog
Centro de Ajuda
Saiba mais sobre o Merch
Feedback
Soluções Corporativas
Empresa
Acesso à API
Estúdio de Design
Design em Lote
PLANOS
All
graph
364 Gráficos e Designs de graph para Camisetas e Merch print on demand
Baixar designs de camisetas e para merch, como capas de livro, capas de celular, tote bags e mais de graph
Relacionado:
graphixshare
,
este design graphic tee pode ser usado em camisas
,
historia em quadrinhos
Ordenar por
Mais relevante
Resultados patrocinados da
Ganhe 15% de desconto com o código: VEXELS15
veja mais detalhes
Ilustração de gráfico de triângulo cumulativo Desenho PNG
Escolha uma pasta
Todos os favoritos
Criar novo
Salvar
Ilustração de gráfico de triângulo cumulativo Desenho PNG
Ferramenta de gráfico de barras Desenho PNG
Escolha uma pasta
Todos os favoritos
Criar novo
Salvar
Ferramenta de gráfico de barras Desenho PNG
Premium
Ferramenta de gráfico de dispersão Desenho PNG
Escolha uma pasta
Todos os favoritos
Criar novo
Salvar
Ferramenta de gráfico de dispersão Desenho PNG
Premium
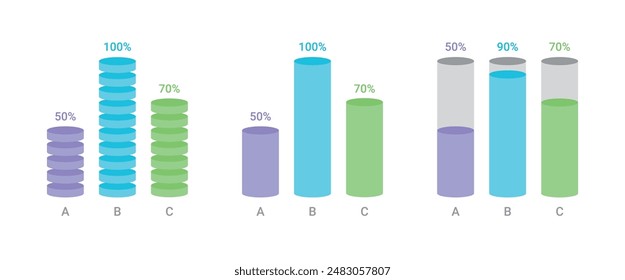
Ferramenta de gráfico de colunas empilhadas Desenho PNG
Escolha uma pasta
Todos os favoritos
Criar novo
Salvar
Ferramenta de gráfico de colunas empilhadas Desenho PNG
Gráfico de barras dentro do ícone da janela do computador Desenho PNG
Escolha uma pasta
Todos os favoritos
Criar novo
Salvar
Gráfico de barras dentro do ícone da janela do computador Desenho PNG
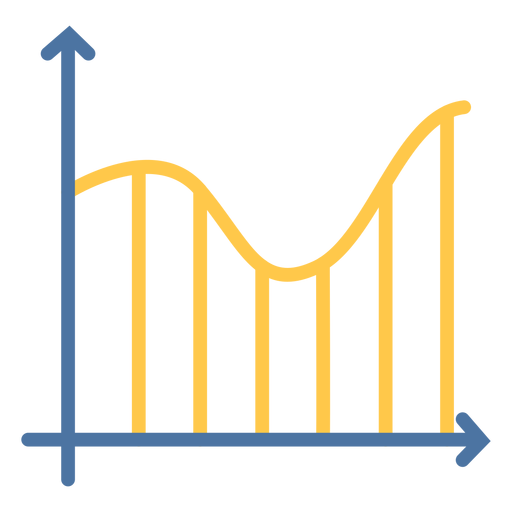
Curva do gráfico plana Desenho PNG
Escolha uma pasta
Todos os favoritos
Criar novo
Salvar
Curva do gráfico plana Desenho PNG
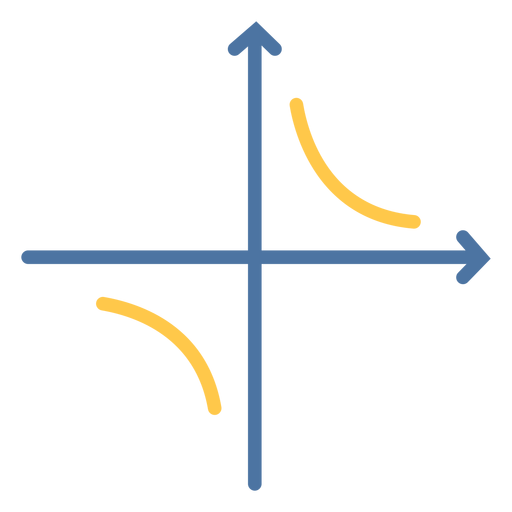
Gráfico de função hiperbólica plano Desenho PNG
Escolha uma pasta
Todos os favoritos
Criar novo
Salvar
Gráfico de função hiperbólica plano Desenho PNG
Traço gráfico de função hiperbólica Desenho PNG
Escolha uma pasta
Todos os favoritos
Criar novo
Salvar
Traço gráfico de função hiperbólica Desenho PNG
Doodle de gráfico de função logarítmica Desenho PNG
Escolha uma pasta
Todos os favoritos
Criar novo
Salvar
Doodle de gráfico de função logarítmica Desenho PNG
Ferramenta de gráfico de coluna Desenho PNG
Escolha uma pasta
Todos os favoritos
Criar novo
Salvar
Ferramenta de gráfico de coluna Desenho PNG
Gráfico de barras dentro do ícone da janela do computador Desenho PNG
Escolha uma pasta
Todos os favoritos
Criar novo
Salvar
Gráfico de barras dentro do ícone da janela do computador Desenho PNG
Ícone de gráfico crescente Desenho PNG
Escolha uma pasta
Todos os favoritos
Criar novo
Salvar
Ícone de gráfico crescente Desenho PNG
Ícone de gráfico crescente com traço rosa Desenho PNG
Escolha uma pasta
Todos os favoritos
Criar novo
Salvar
Ícone de gráfico crescente com traço rosa Desenho PNG
Premium
Ícone quadrado do gráfico Desenho PNG
Escolha uma pasta
Todos os favoritos
Criar novo
Salvar
Ícone quadrado do gráfico Desenho PNG
Ícone plano de gráfico Desenho PNG
Escolha uma pasta
Todos os favoritos
Criar novo
Salvar
Ícone plano de gráfico Desenho PNG
Premium
Ícone de traçado da tela do gráfico crescente Desenho PNG
Escolha uma pasta
Todos os favoritos
Criar novo
Salvar
Ícone de traçado da tela do gráfico crescente Desenho PNG
Traço gráfico de movimento no sentido horário Desenho PNG
Escolha uma pasta
Todos os favoritos
Criar novo
Salvar
Traço gráfico de movimento no sentido horário Desenho PNG
Doodle de curva de gráfico Desenho PNG
Escolha uma pasta
Todos os favoritos
Criar novo
Salvar
Doodle de curva de gráfico Desenho PNG
Ferramenta de gráfico de área Desenho PNG
Escolha uma pasta
Todos os favoritos
Criar novo
Salvar
Ferramenta de gráfico de área Desenho PNG
Premium
Ferramenta de gráfico de barras empilhadas Desenho PNG
Escolha uma pasta
Todos os favoritos
Criar novo
Salvar
Ferramenta de gráfico de barras empilhadas Desenho PNG
Gráfico de movimento no sentido horário plano Desenho PNG
Escolha uma pasta
Todos os favoritos
Criar novo
Salvar
Gráfico de movimento no sentido horário plano Desenho PNG
Gráfico de função hiperbólica Desenho PNG
Escolha uma pasta
Todos os favoritos
Criar novo
Salvar
Gráfico de função hiperbólica Desenho PNG
Traço gráfico de função logarítmica Desenho PNG
Escolha uma pasta
Todos os favoritos
Criar novo
Salvar
Traço gráfico de função logarítmica Desenho PNG
Pronto para imprimir
Premium
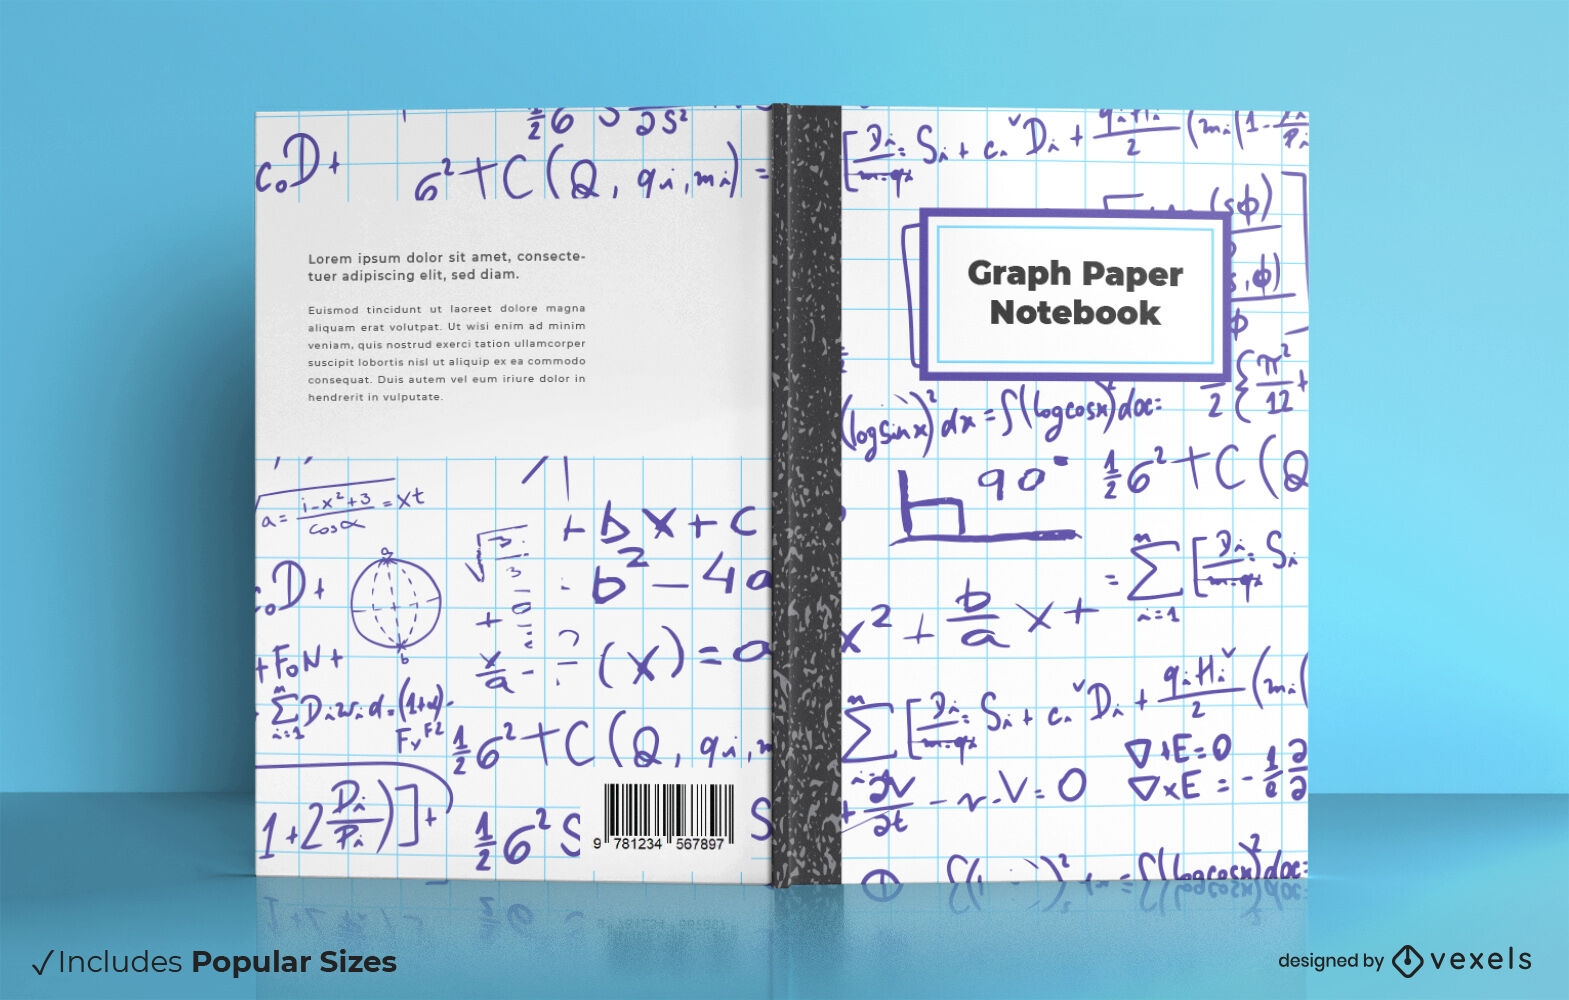
Design legal da capa do livro em papel quadriculado
Escolha uma pasta
Todos os favoritos
Criar novo
Salvar
Design legal da capa do livro em papel quadriculado
Gráfico de preço de criptomoeda
Escolha uma pasta
Todos os favoritos
Criar novo
Salvar
Gráfico de preço de criptomoeda
Pronto para imprimir
Premium
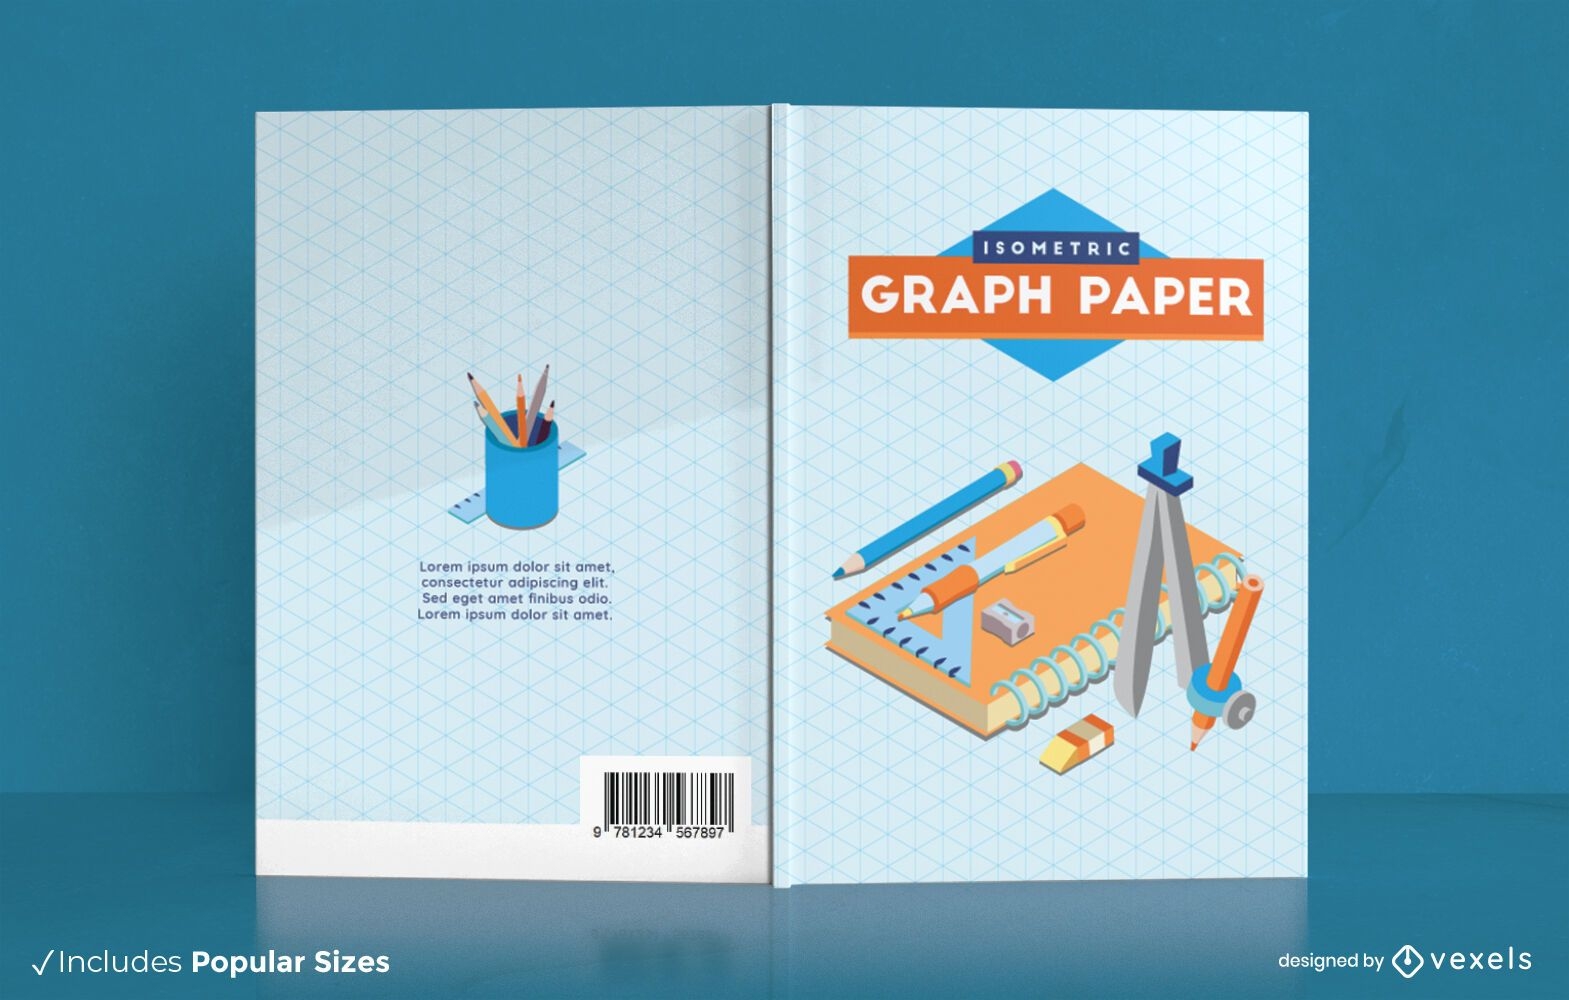
Design da capa do livro em papel quadriculado
Escolha uma pasta
Todos os favoritos
Criar novo
Salvar
Design da capa do livro em papel quadriculado
Pronto para imprimir
para Merch
Design de camiseta gráfica de negociação de batimentos cardíacos
Escolha uma pasta
Todos os favoritos
Criar novo
Salvar
Design de camiseta gráfica de negociação de batimentos cardíacos
texto editável
Pronto para imprimir
Premium
Design de capa de livro de símbolos matemáticos
Escolha uma pasta
Todos os favoritos
Criar novo
Salvar
Design de capa de livro de símbolos matemáticos
Pronto para imprimir
para Merch
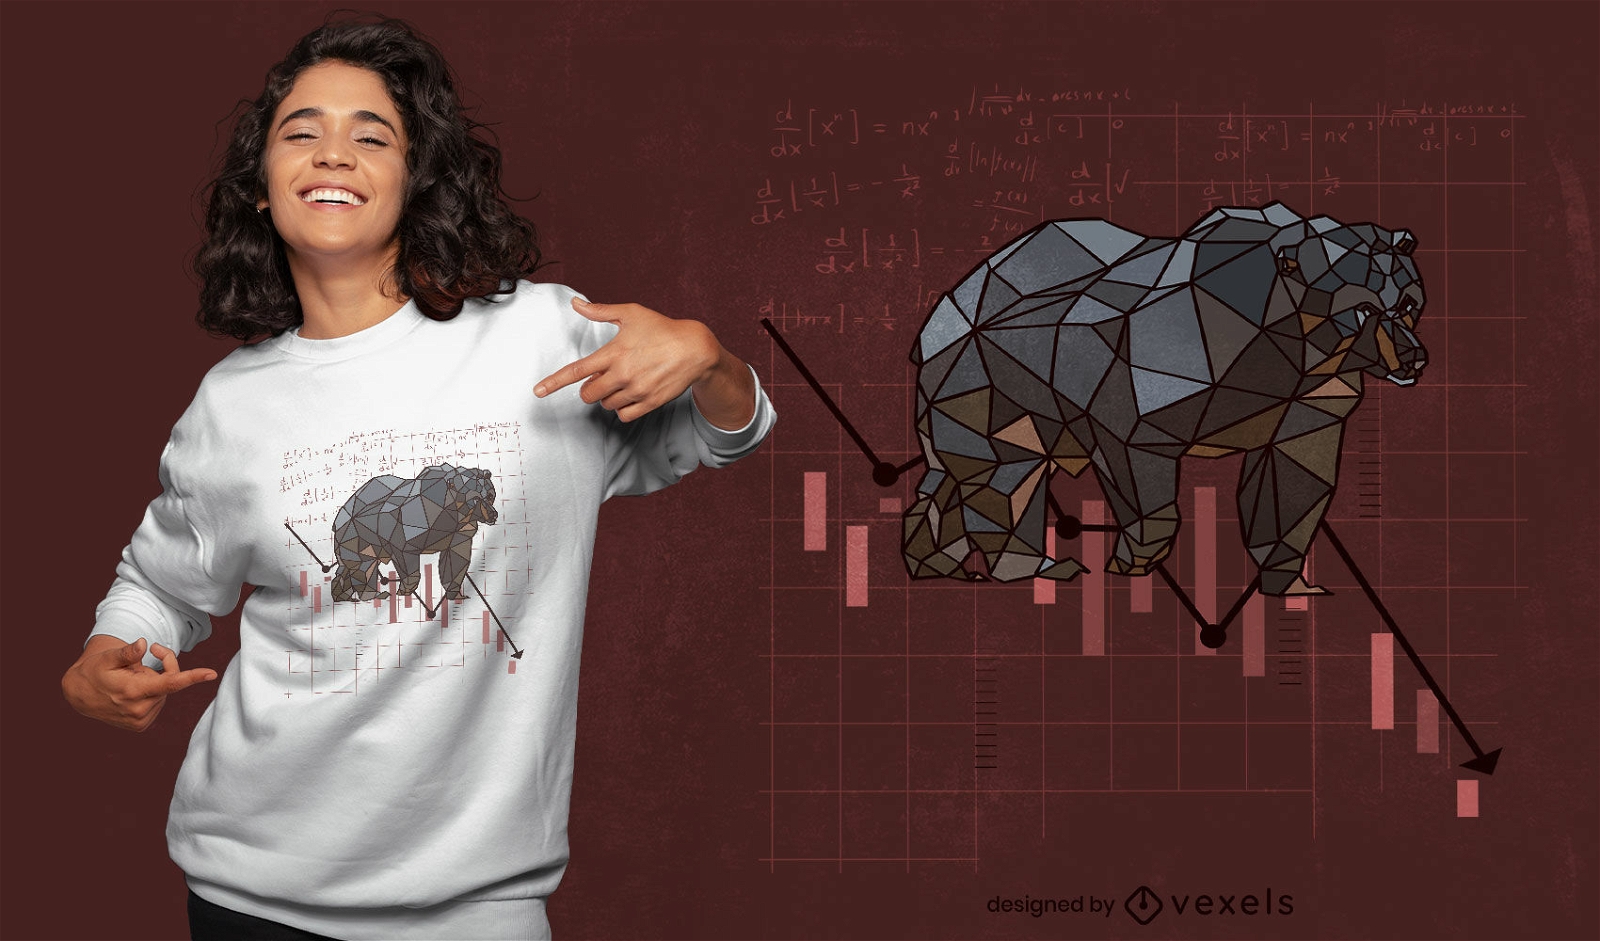
Design poligonal de t-shirt animal com urso
Escolha uma pasta
Todos os favoritos
Criar novo
Salvar
Design poligonal de t-shirt animal com urso
Pronto para imprimir
para Merch
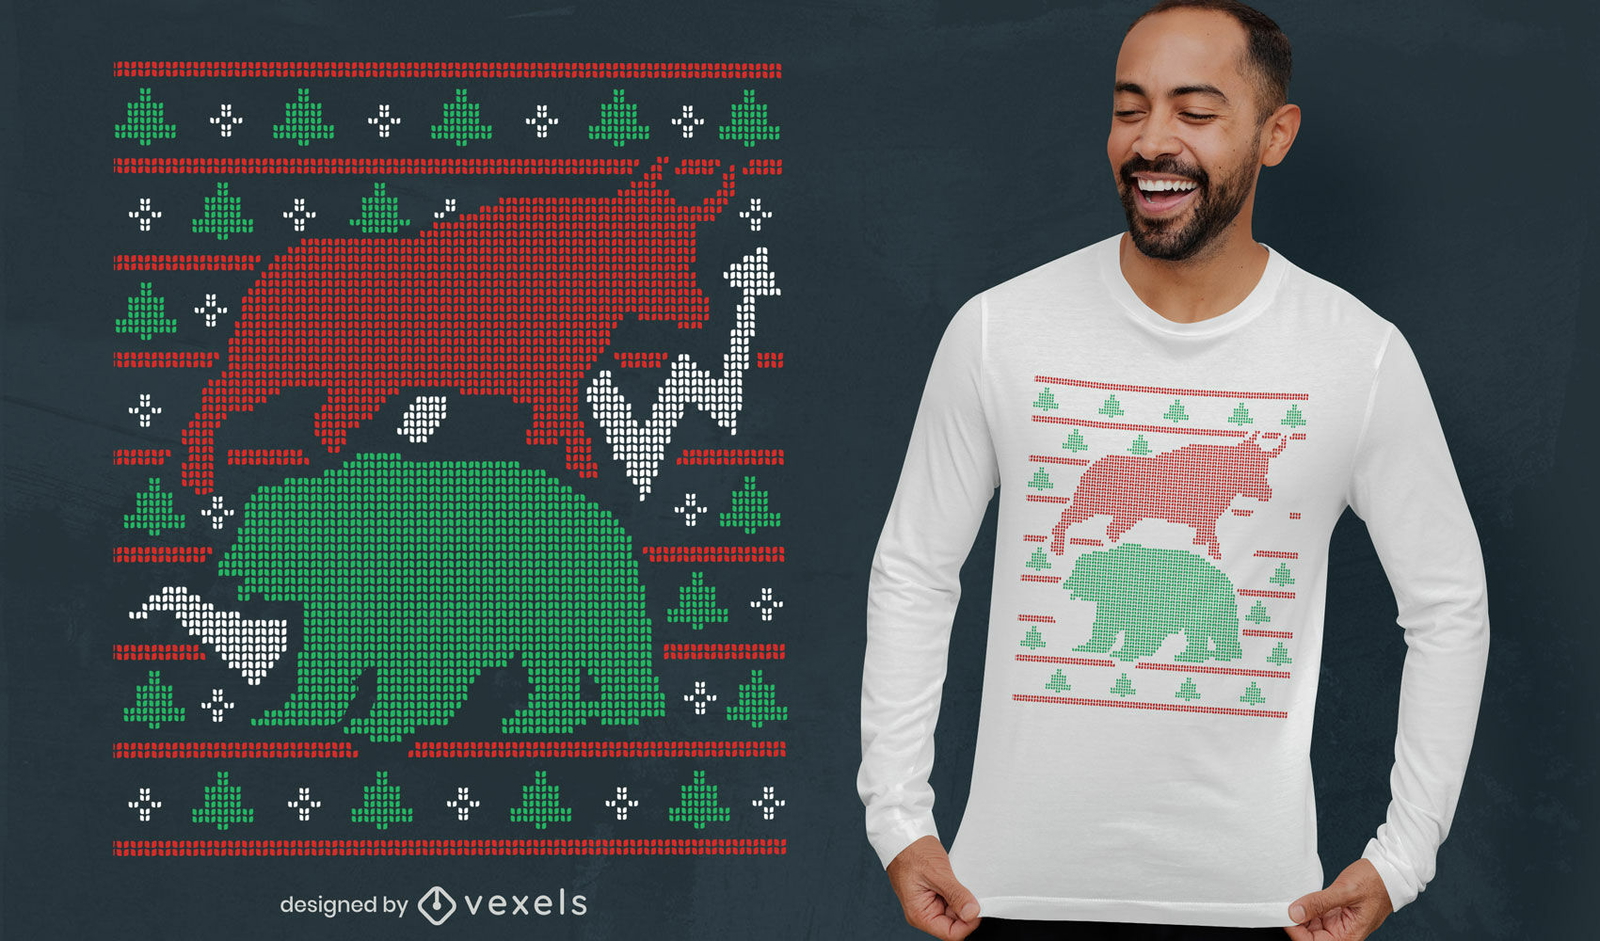
Animais do mercado de ações design de t-shirt de suéter feio
Escolha uma pasta
Todos os favoritos
Criar novo
Salvar
Animais do mercado de ações design de t-shirt de suéter feio
Pronto para imprimir
para Merch
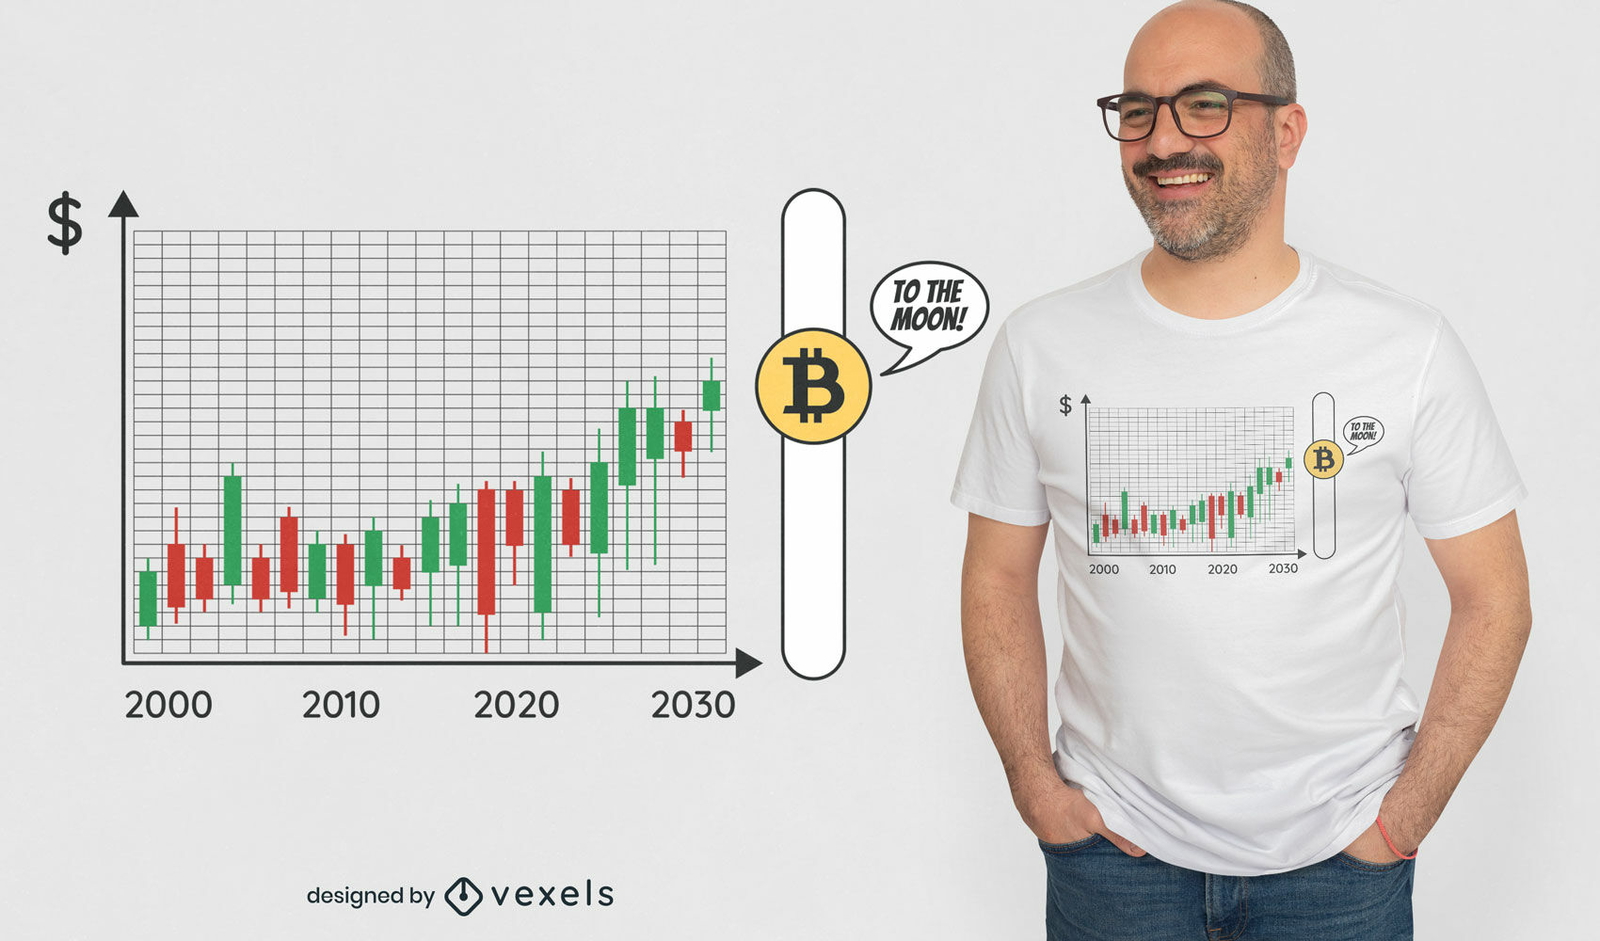
Design gráfico de camiseta com moeda criptográfica
Escolha uma pasta
Todos os favoritos
Criar novo
Salvar
Design gráfico de camiseta com moeda criptográfica
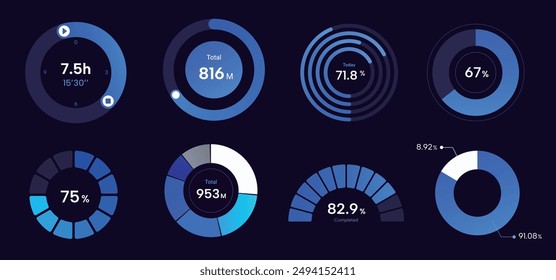
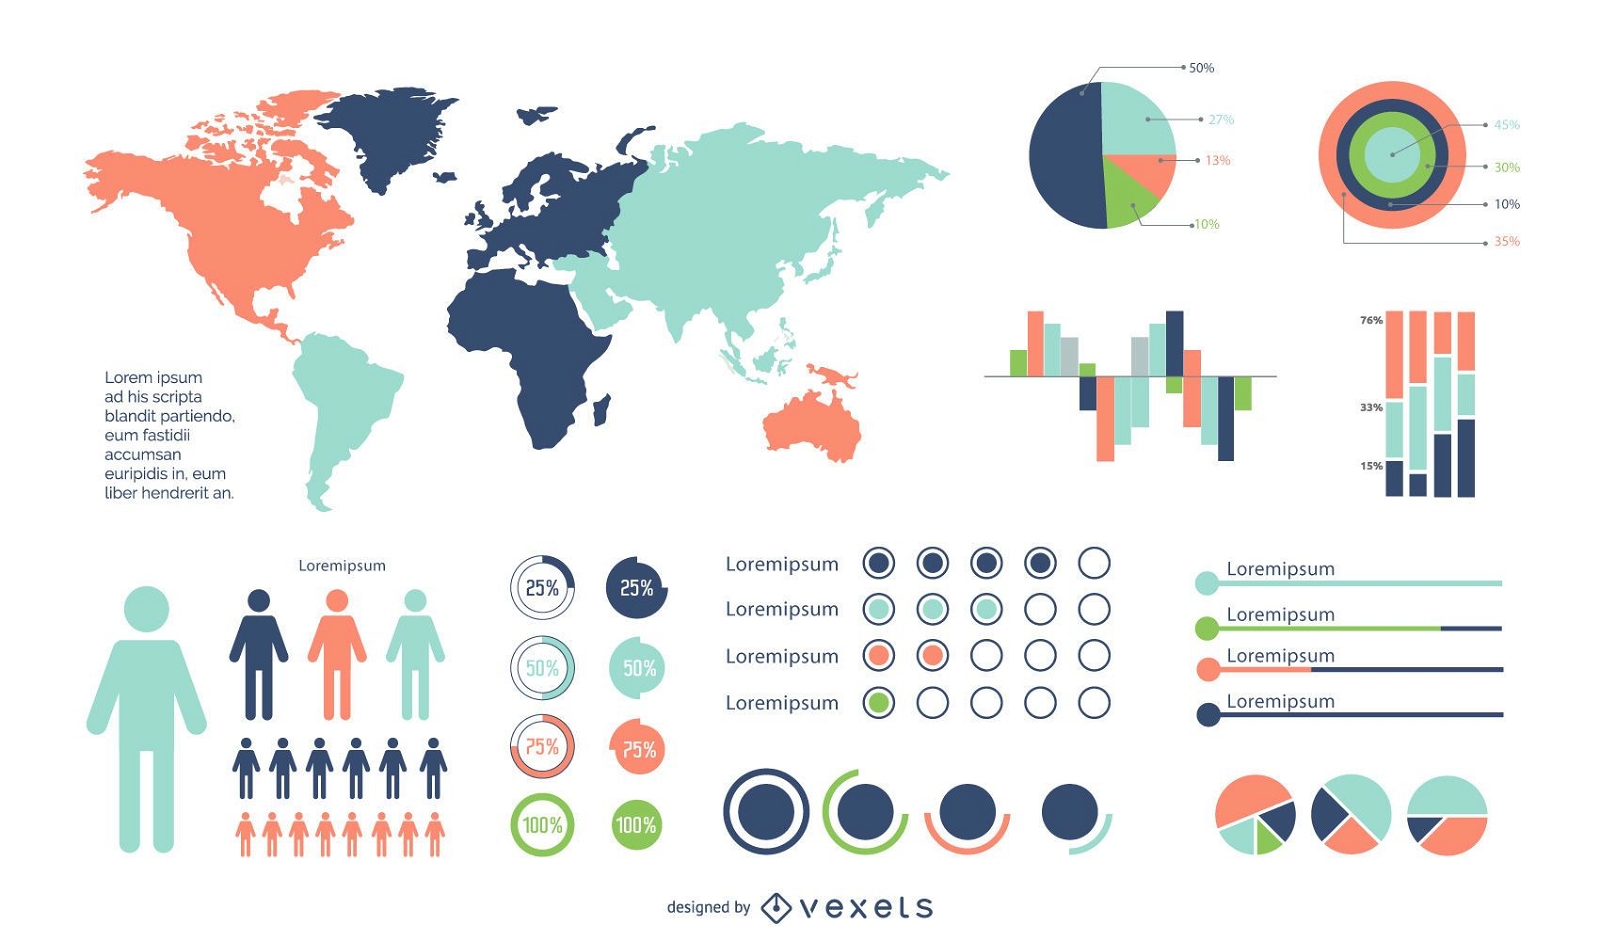
Conjunto mínimo de infográfico colorido
Escolha uma pasta
Todos os favoritos
Criar novo
Salvar
Conjunto mínimo de infográfico colorido
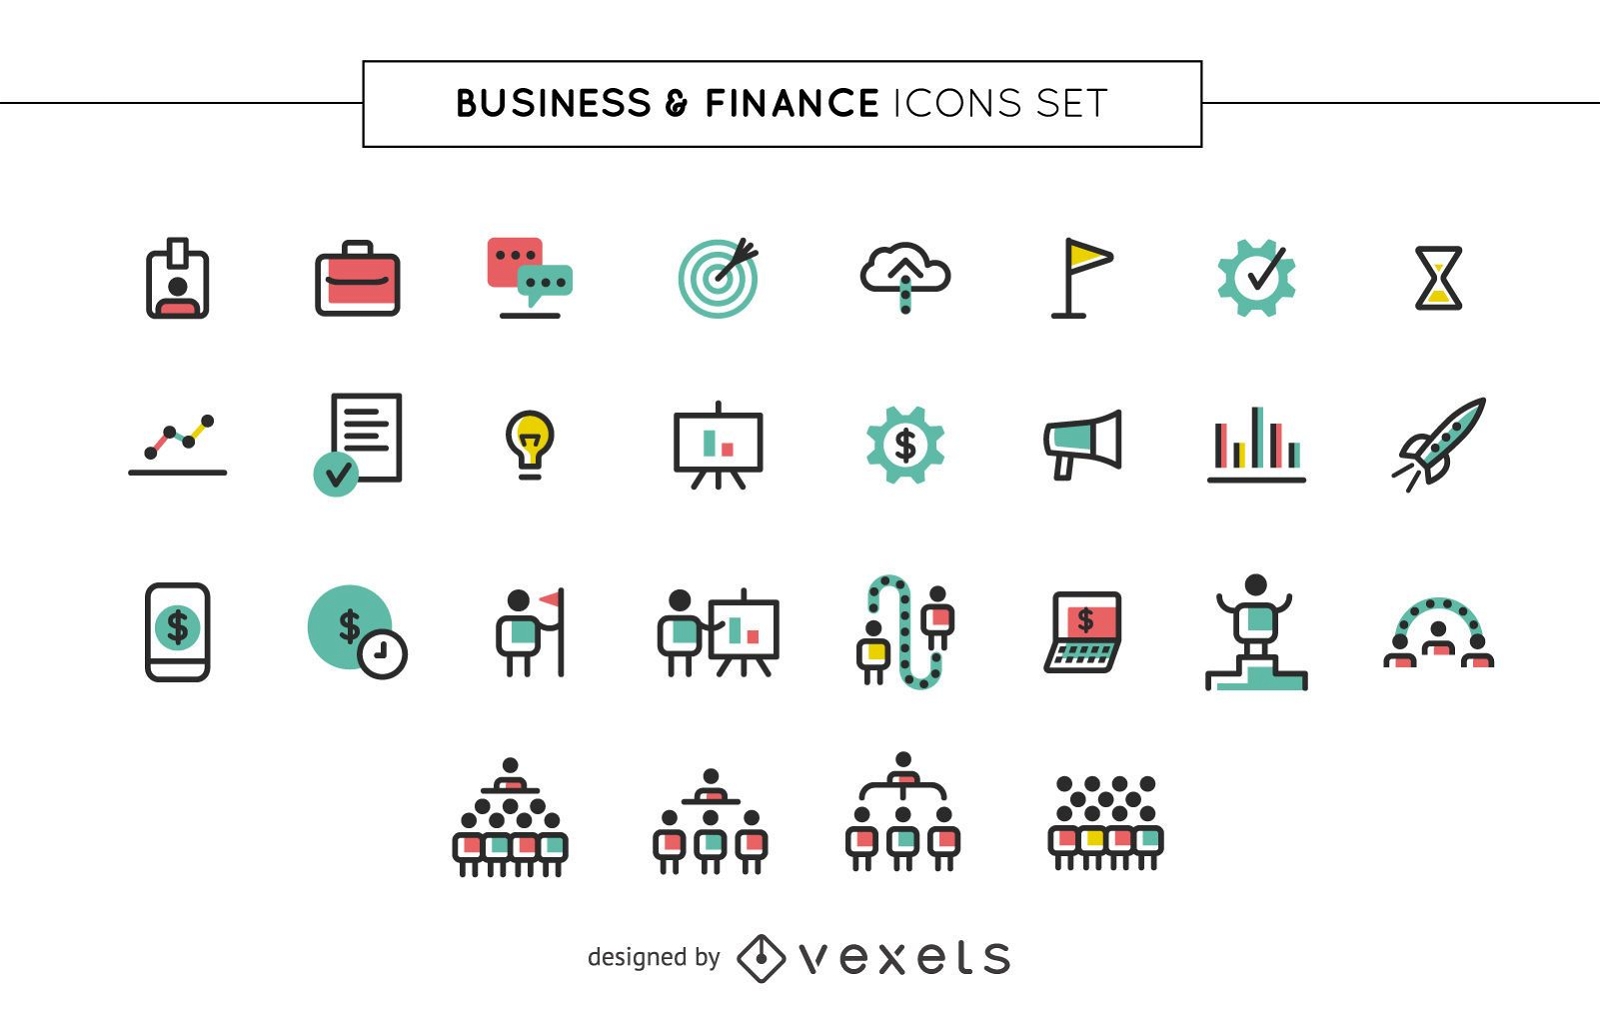
Conjunto de ícones de negócios e finanças
Escolha uma pasta
Todos os favoritos
Criar novo
Salvar
Conjunto de ícones de negócios e finanças
texto editável
Pronto para imprimir
Premium
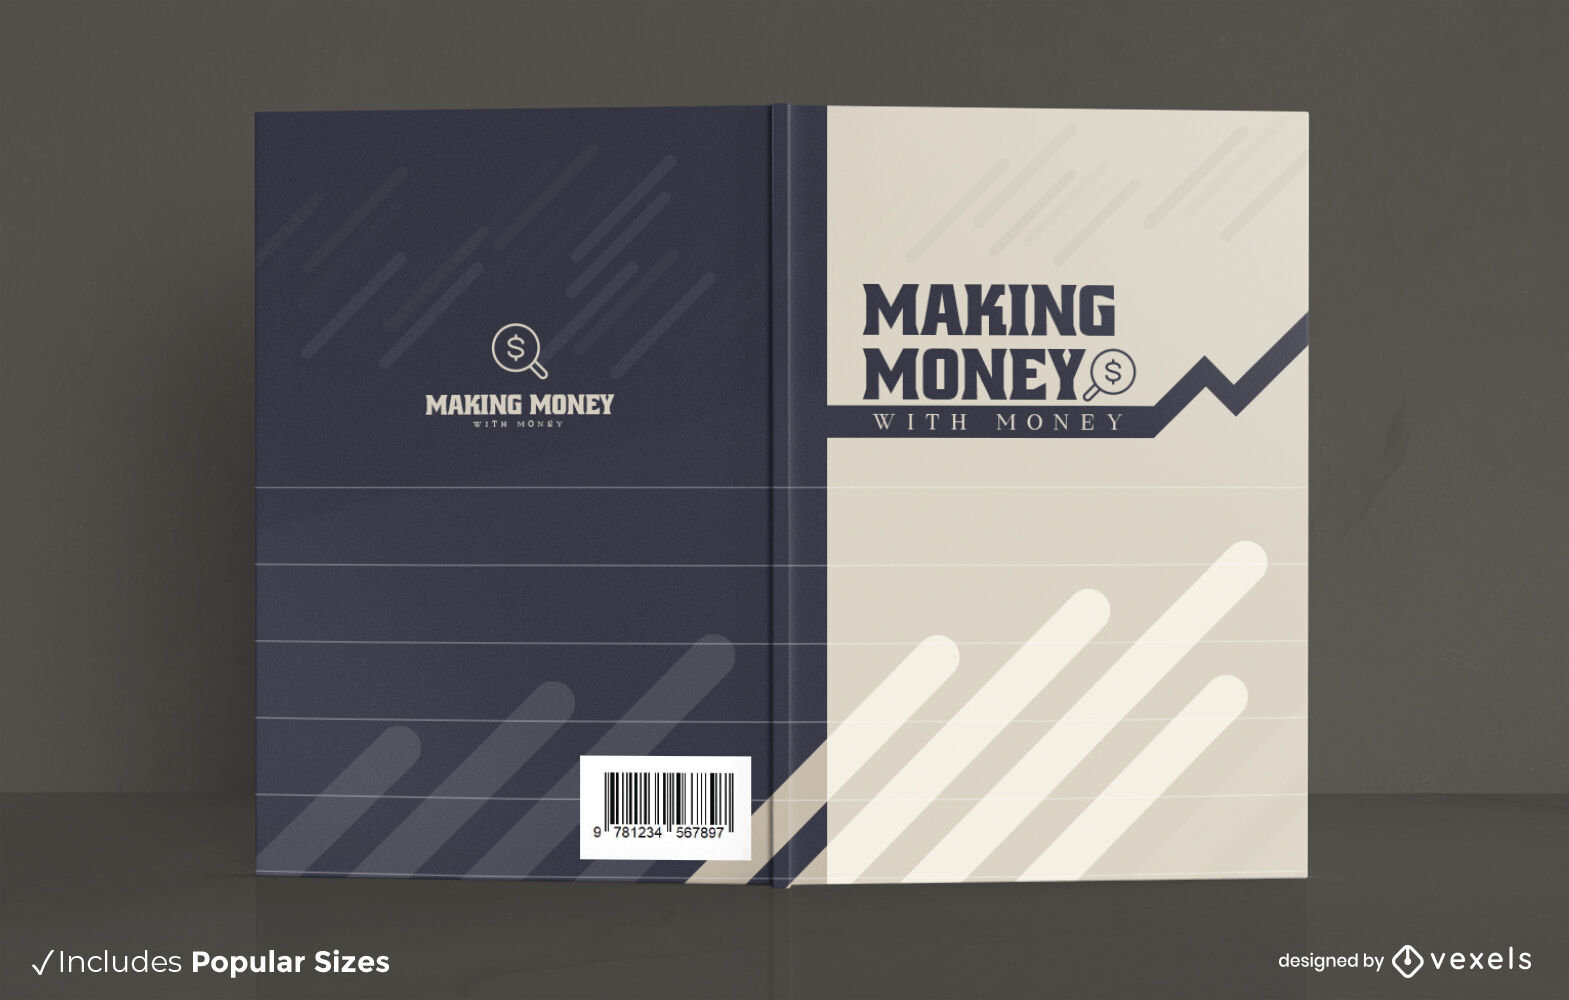
Design gráfico de capa de livro de dinheiro
Escolha uma pasta
Todos os favoritos
Criar novo
Salvar
Design gráfico de capa de livro de dinheiro
Ilustração de fracasso de mulher de negócios
Escolha uma pasta
Todos os favoritos
Criar novo
Salvar
Ilustração de fracasso de mulher de negócios
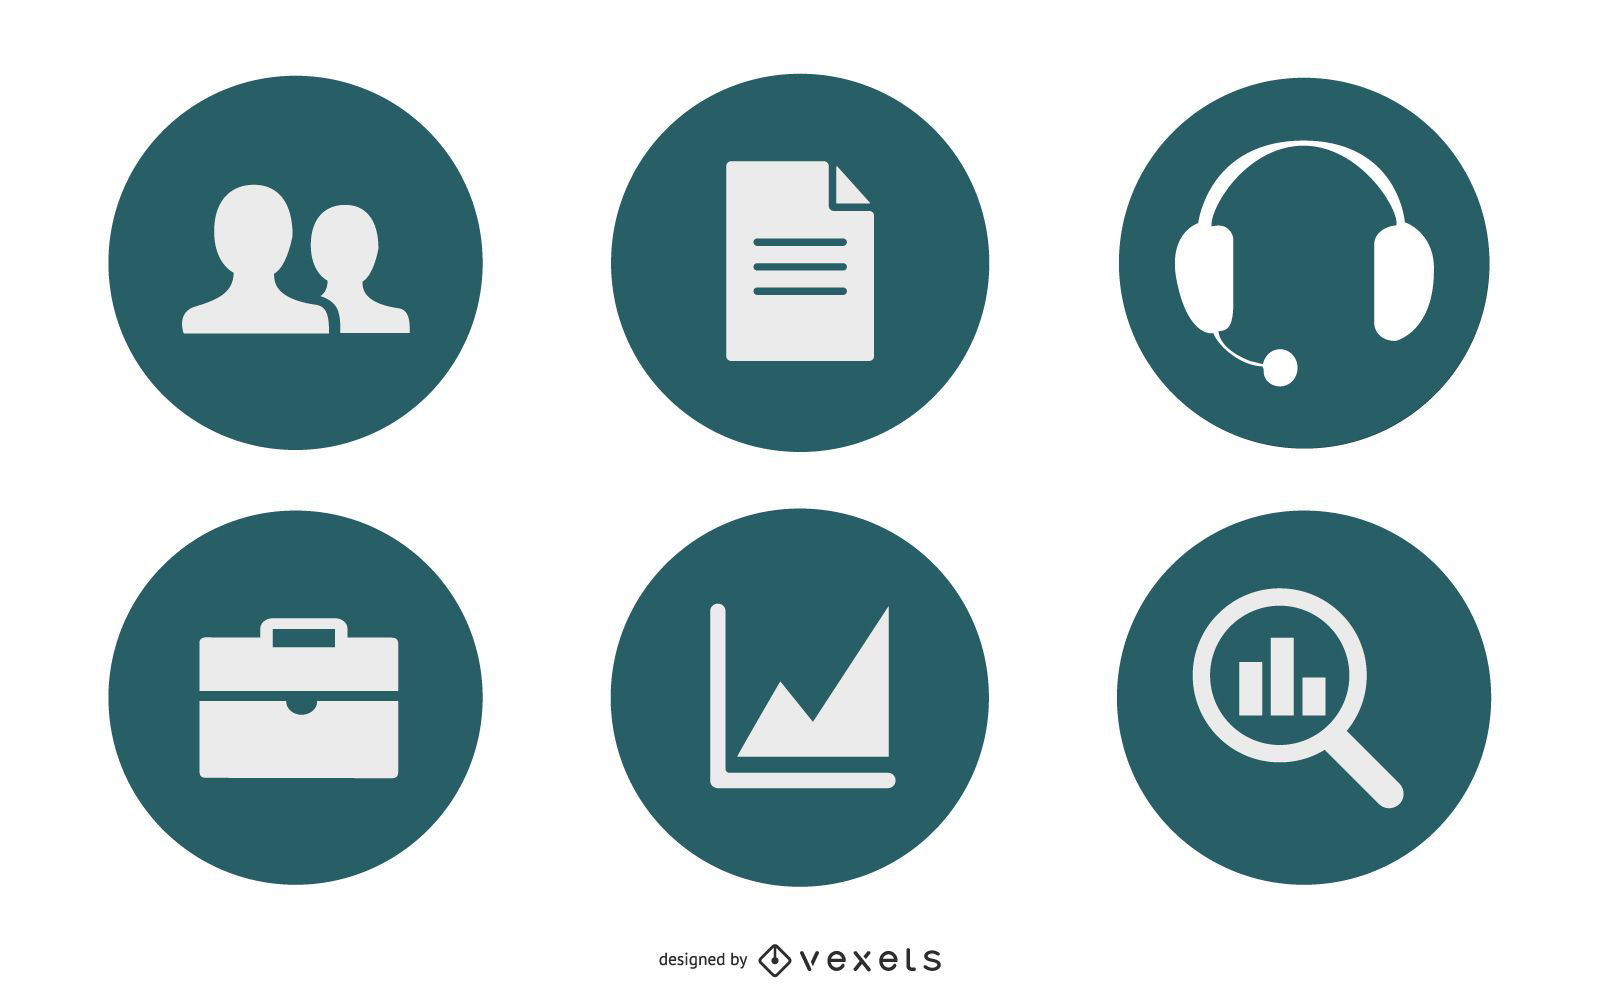
Pacote de ícones de negócios elegantes
Escolha uma pasta
Todos os favoritos
Criar novo
Salvar
Pacote de ícones de negócios elegantes
Fundo do gráfico financeiro fluorescente da Blue Tech
Escolha uma pasta
Todos os favoritos
Criar novo
Salvar
Fundo do gráfico financeiro fluorescente da Blue Tech
Fracasso do homem de negócios
Escolha uma pasta
Todos os favoritos
Criar novo
Salvar
Fracasso do homem de negócios
texto editável
Pronto para imprimir
Premium
Papel gráfico para design de capa de livro infantil
Escolha uma pasta
Todos os favoritos
Criar novo
Salvar
Papel gráfico para design de capa de livro infantil
Homem de negócios falido
Escolha uma pasta
Todos os favoritos
Criar novo
Salvar
Homem de negócios falido
Conjunto de 78 ícones de ferramentas de menu
Escolha uma pasta
Todos os favoritos
Criar novo
Salvar
Conjunto de 78 ícones de ferramentas de menu
Lindo conjunto de ícones financeiros
Escolha uma pasta
Todos os favoritos
Criar novo
Salvar
Lindo conjunto de ícones financeiros
Ícones de diagramas 3D limpos
Escolha uma pasta
Todos os favoritos
Criar novo
Salvar
Ícones de diagramas 3D limpos
Gráfico de pizza brilhante
Escolha uma pasta
Todos os favoritos
Criar novo
Salvar
Gráfico de pizza brilhante
Layout de infográfico de negócios bonito cinza 3D
Escolha uma pasta
Todos os favoritos
Criar novo
Salvar
Layout de infográfico de negócios bonito cinza 3D
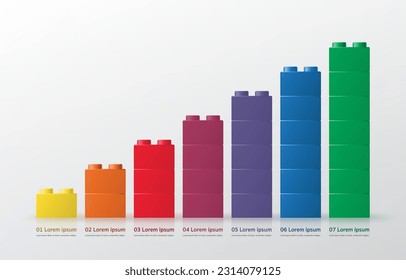
Gráfico crescente de configuração 3D mínimo
Escolha uma pasta
Todos os favoritos
Criar novo
Salvar
Gráfico crescente de configuração 3D mínimo
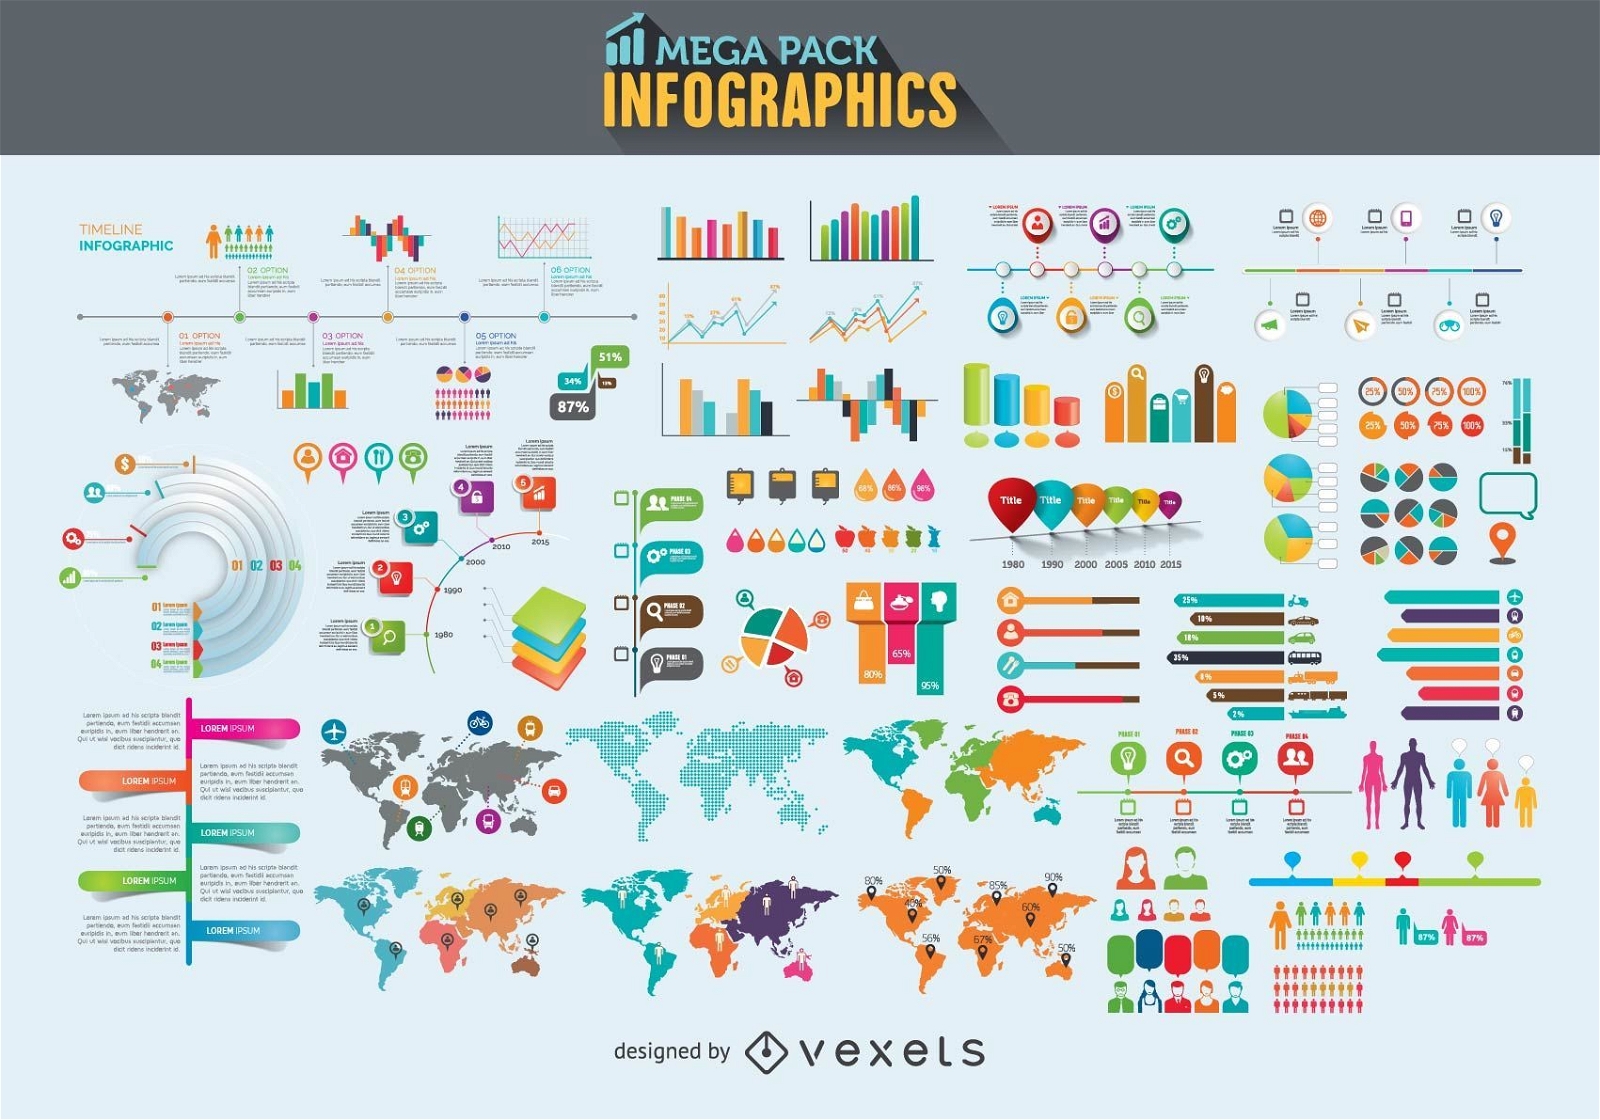
Mega pack de elementos infográficos
Escolha uma pasta
Todos os favoritos
Criar novo
Salvar
Mega pack de elementos infográficos
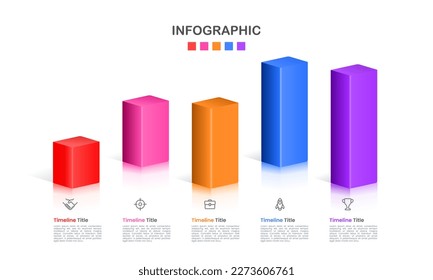
Linha do tempo infográfico
Escolha uma pasta
Todos os favoritos
Criar novo
Salvar
Linha do tempo infográfico
Premium
Símbolo do átomo da ciência recortado Desenho PNG
Escolha uma pasta
Todos os favoritos
Criar novo
Salvar
Símbolo do átomo da ciência recortado Desenho PNG
Premium
Crescente gráfico de linha multicolor Desenho PNG
Escolha uma pasta
Todos os favoritos
Criar novo
Salvar
Crescente gráfico de linha multicolor Desenho PNG
Impulsione seu negócio
Com a plataforma gráfica líder de mercado.
Ver planos
Próxima
do 8
prev page
next page