Biblioteca de design
Novos designs Merch
Camisetas
Vectores
Designs de Merch de Tendência
PNGs & SVGs
Mockups
Modelos de T-Shirt PSD
Explorar Desenhos
Designs KDP
Pôsteres
Canecas
Capas para celular
Sacos de compras
Almofadas
Ferramentas de desenho
Merch Designer
Novo!
Mockup Generator
Gerador de Design de AI
Vetorizador
Quote Generator
T-Shirt Maker (Antigo)
Ajuda
Merch Digest
Blog
Centro de Ajuda
Saiba mais sobre o Merch
Feedback
Soluções Corporativas
Empresa
Acesso à API
Estúdio de Design
Design em Lote
Preços
Carregando...
Inscrever-se
Conecte-se
All
graph
Biblioteca de design
Novos designs Merch
Camisetas
Vectores
Designs de Merch de Tendência
PNGs & SVGs
Mockups
Modelos de T-Shirt PSD
Explorar Desenhos
Designs KDP
Pôsteres
Canecas
Capas para celular
Sacos de compras
Almofadas
Ferramentas de desenho
Merch Designer
Novo!
Mockup Generator
Gerador de Design de AI
Vetorizador
Quote Generator
T-Shirt Maker (Antigo)
Ajuda
Merch Digest
Blog
Centro de Ajuda
Saiba mais sobre o Merch
Feedback
Soluções Corporativas
Empresa
Acesso à API
Estúdio de Design
Design em Lote
PLANOS
All
graph
364 Gráficos e Designs de graph para Camisetas e Merch print on demand
Baixar designs de camisetas e para merch, como capas de livro, capas de celular, tote bags e mais de graph
Relacionado:
graphixshare
,
este design graphic tee pode ser usado em camisas
,
historia em quadrinhos
Ordenar por
Mais relevante
Resultados patrocinados da
Ganhe 15% de desconto com o código: VEXELS15
veja mais detalhes
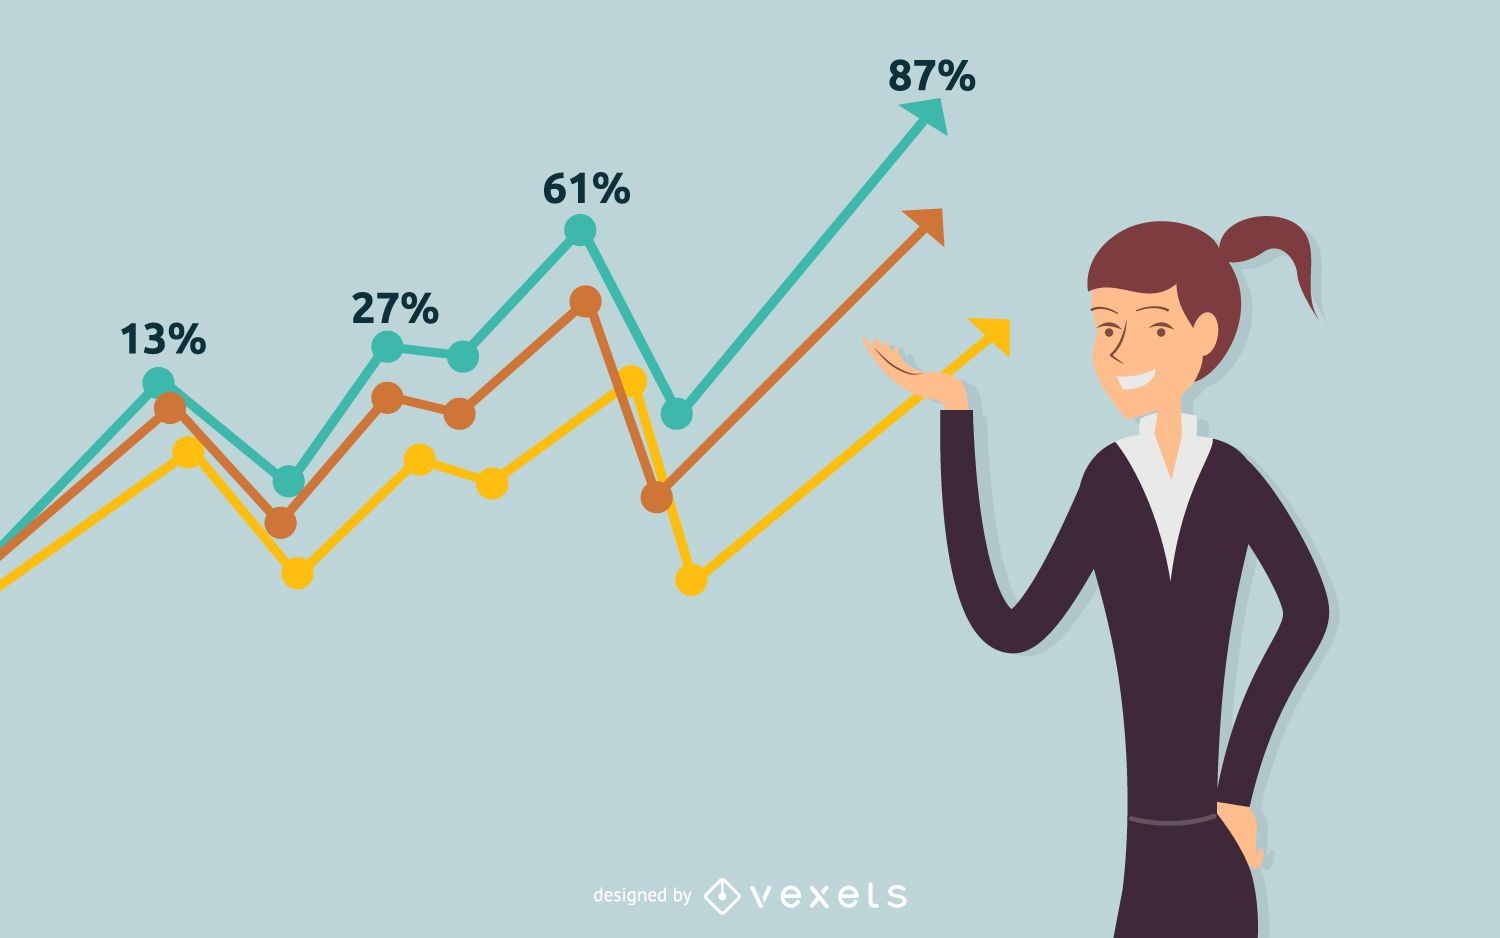
Ilustração de sucesso de empresária
Escolha uma pasta
Todos os favoritos
Criar novo
Salvar
Ilustração de sucesso de empresária
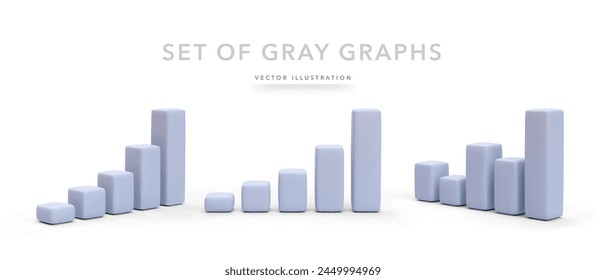
Gráfico gráfico de crescimento em 3D cinza
Escolha uma pasta
Todos os favoritos
Criar novo
Salvar
Gráfico gráfico de crescimento em 3D cinza
Premium
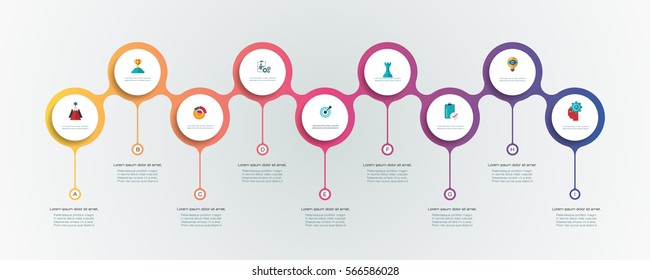
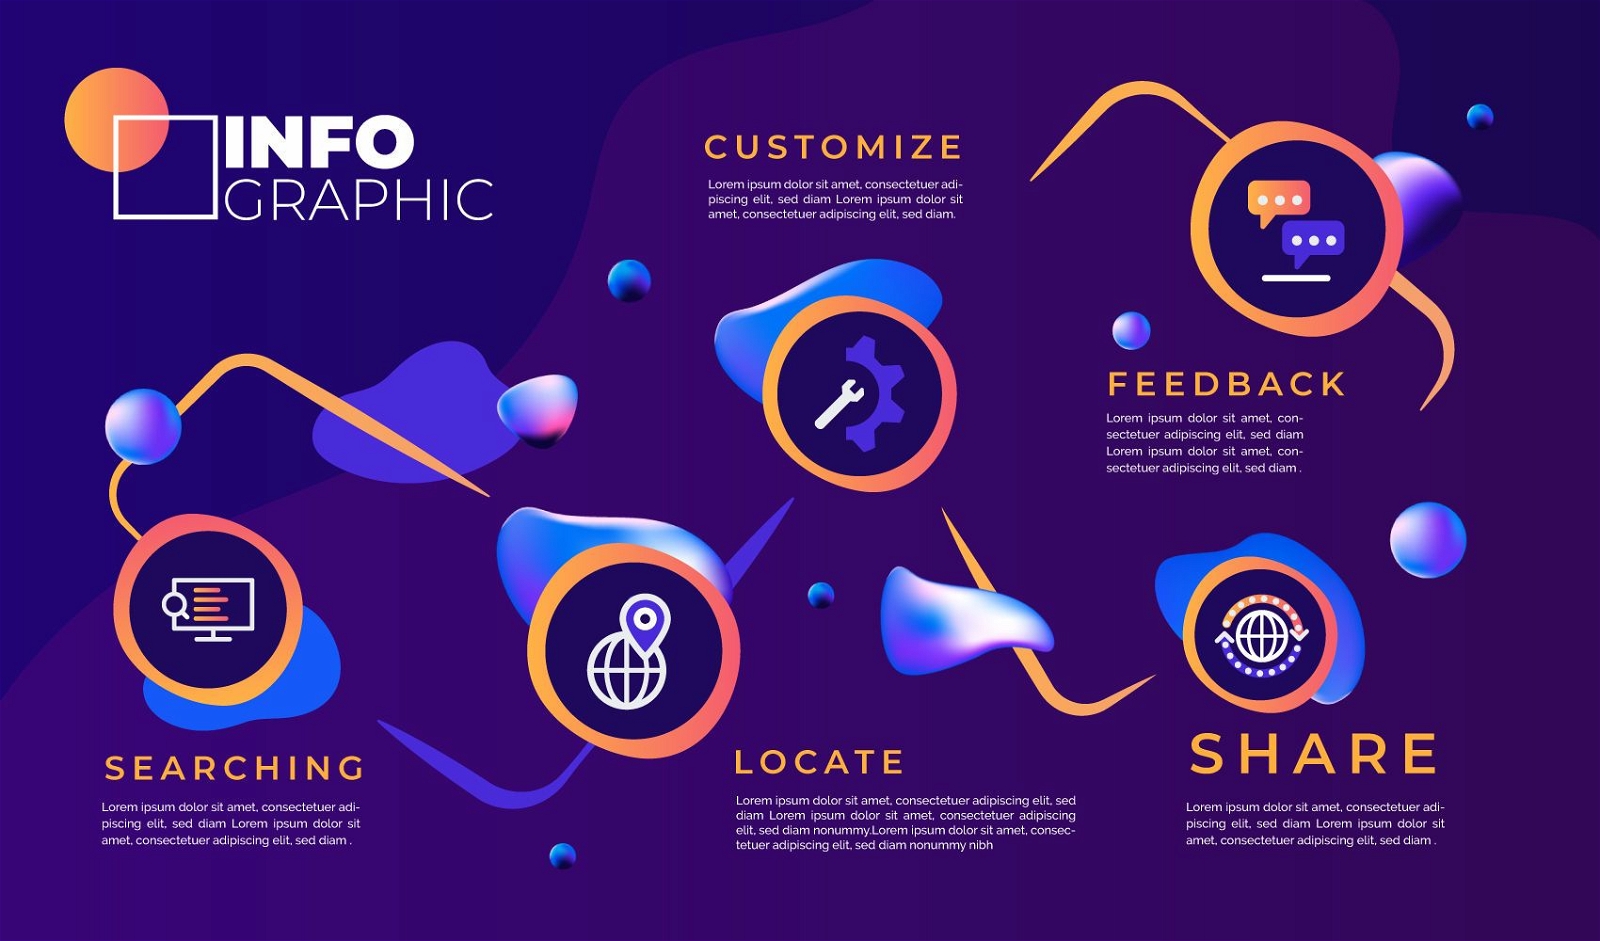
Infográfico de ícones redondos de vários estágios Desenho PNG
Escolha uma pasta
Todos os favoritos
Criar novo
Salvar
Infográfico de ícones redondos de vários estágios Desenho PNG
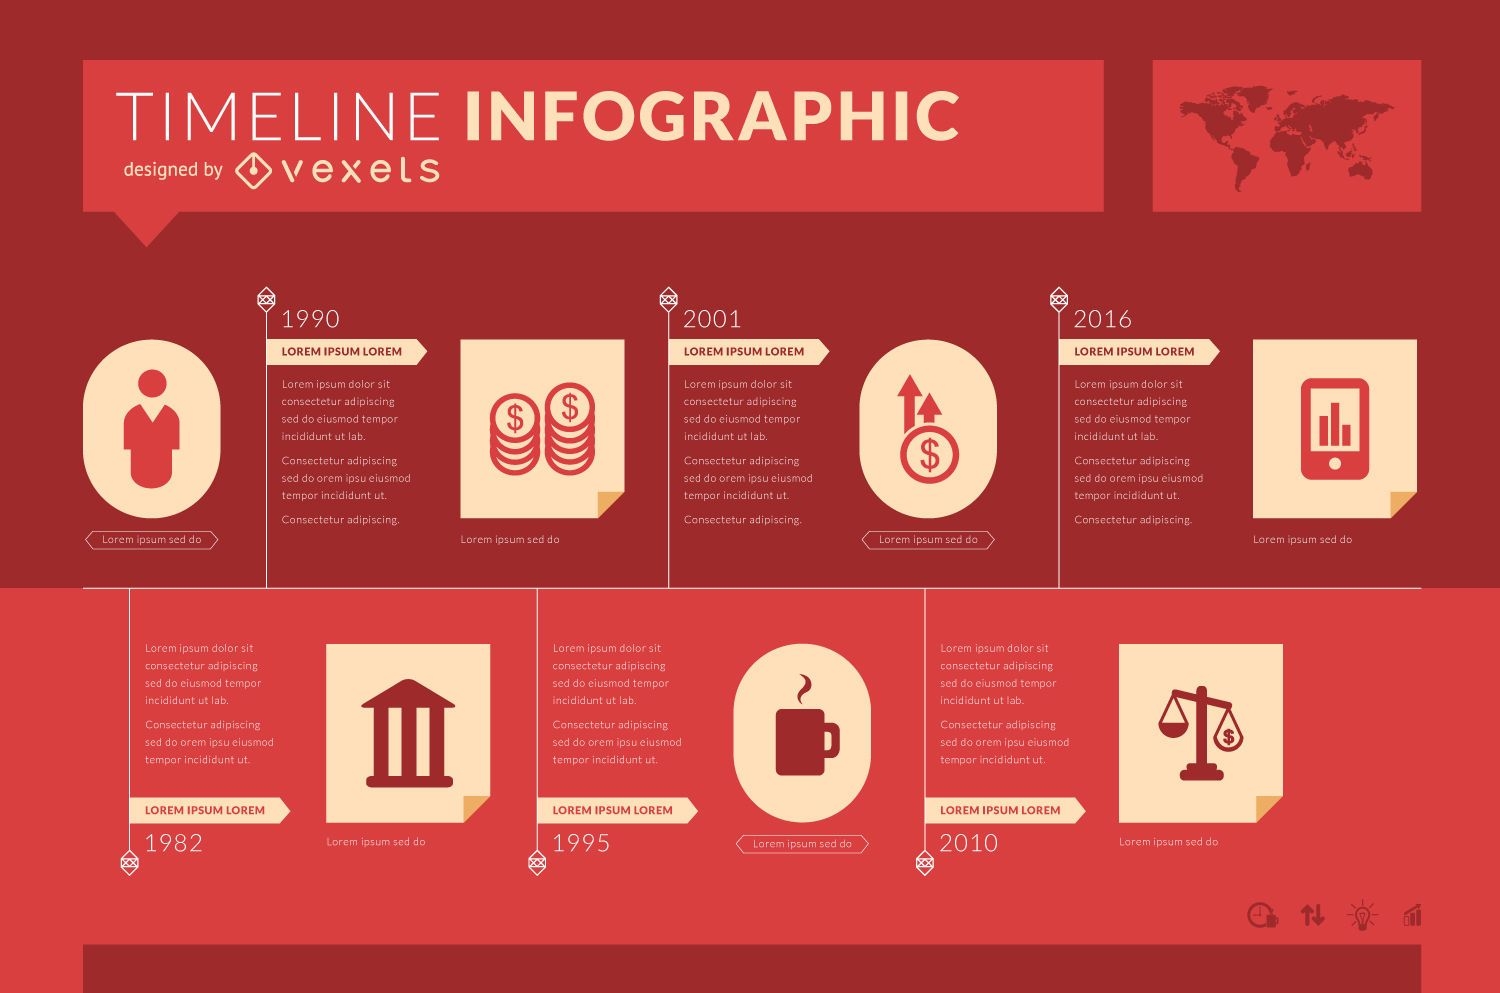
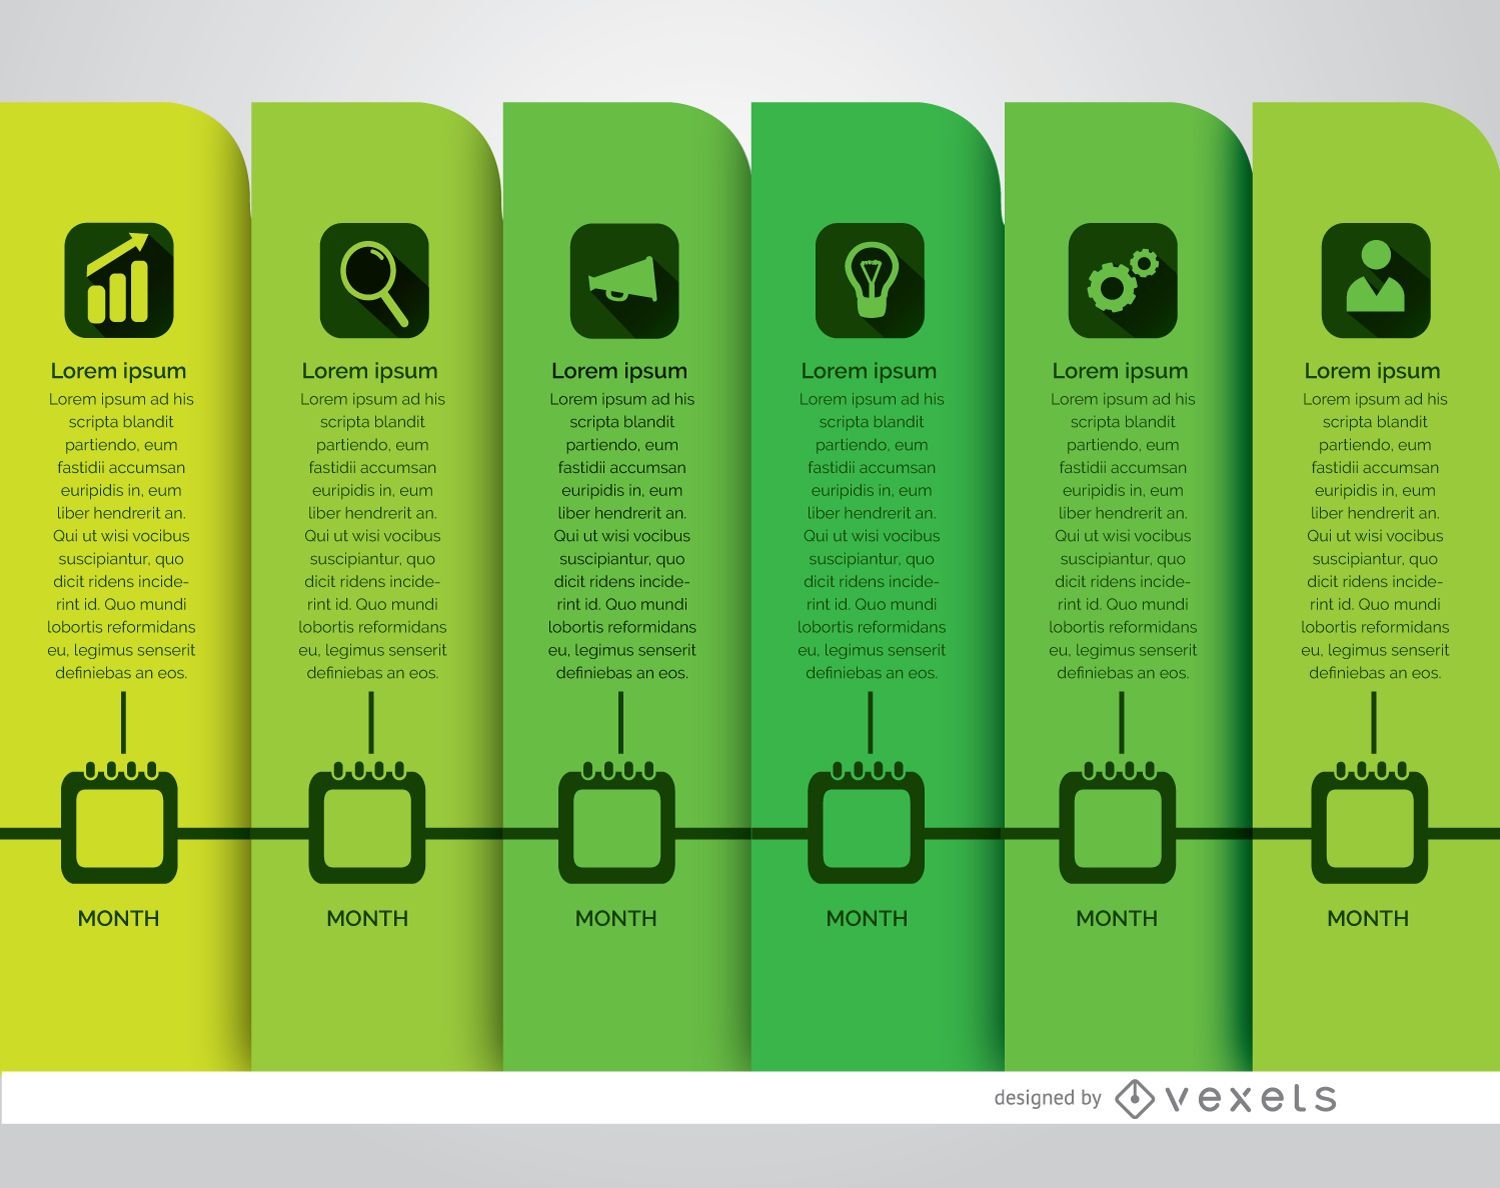
Modelo de cronograma infográfico
Escolha uma pasta
Todos os favoritos
Criar novo
Salvar
Modelo de cronograma infográfico
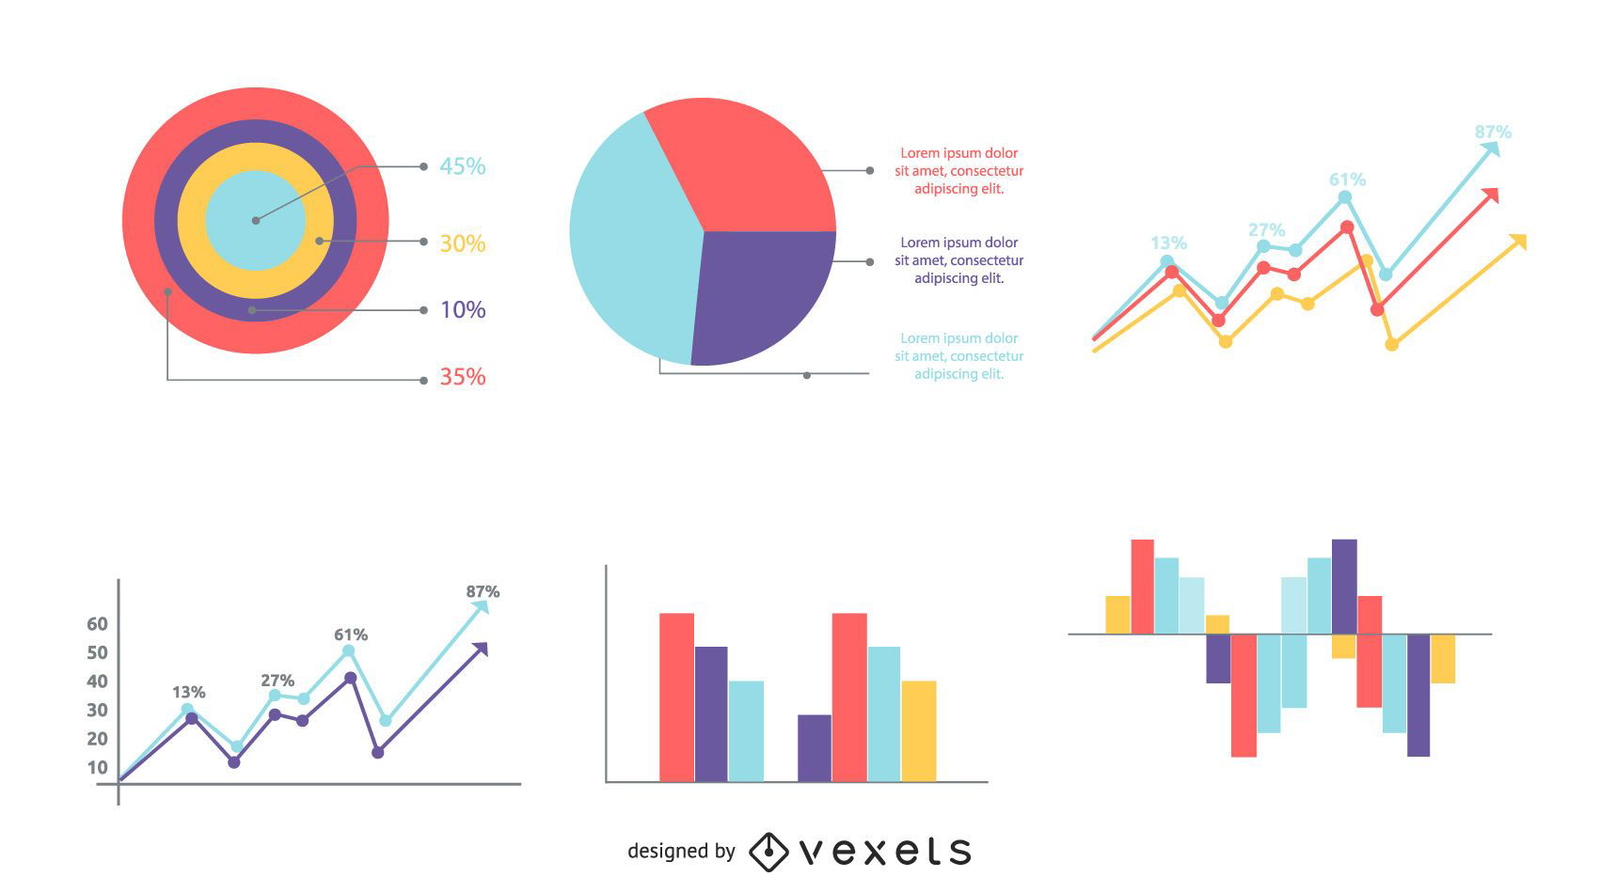
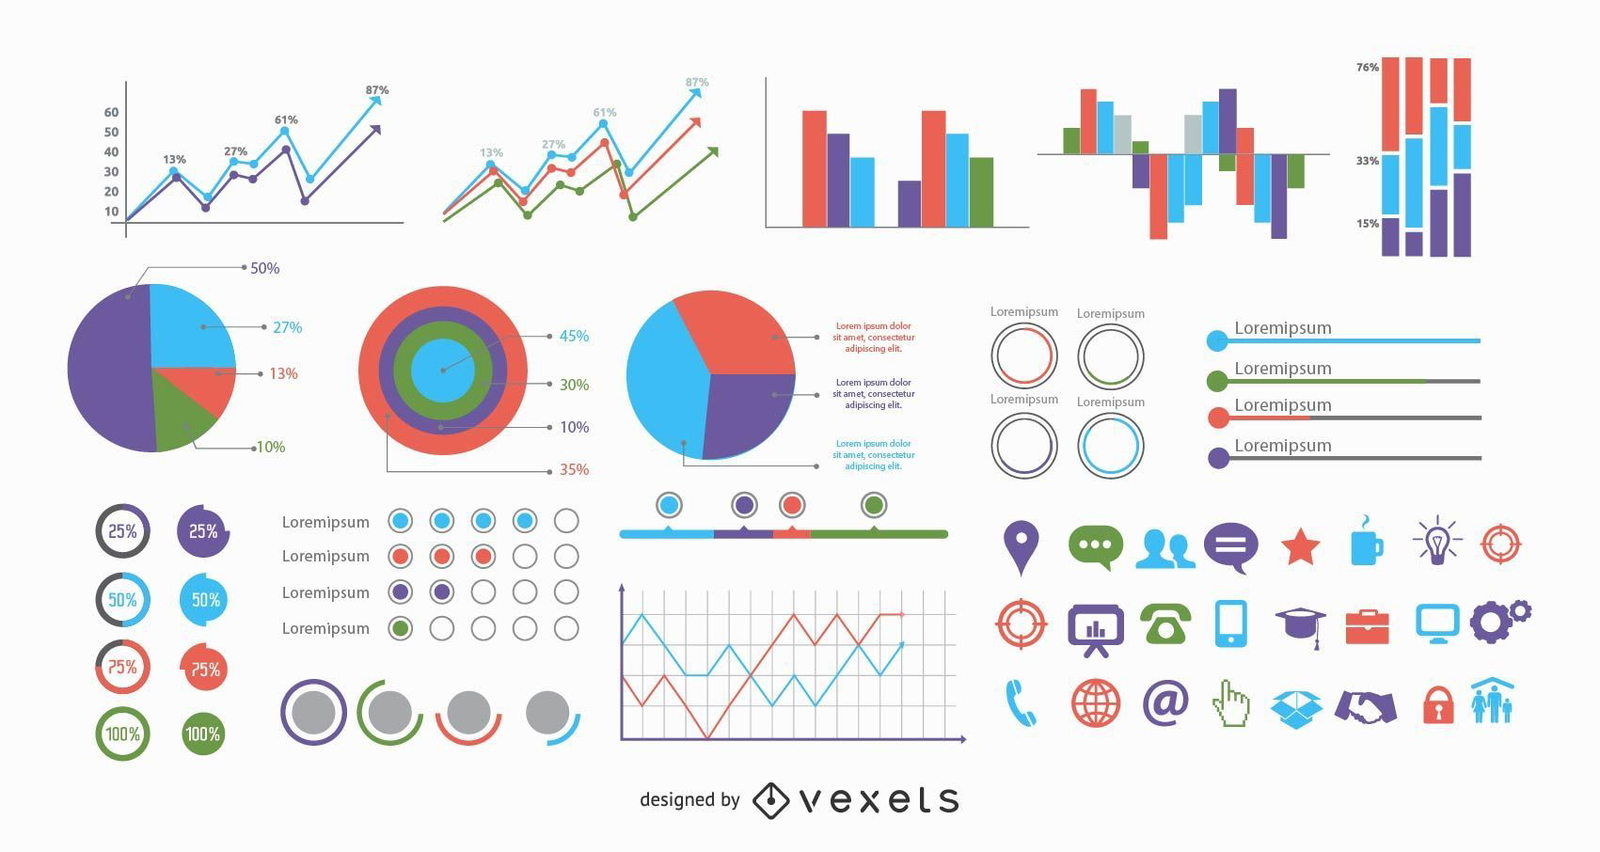
Pacote de gráficos gráficos de informações de estilo clássico
Escolha uma pasta
Todos os favoritos
Criar novo
Salvar
Pacote de gráficos gráficos de informações de estilo clássico
Premium
Doodle 3D do gráfico de colunas Desenho PNG
Escolha uma pasta
Todos os favoritos
Criar novo
Salvar
Doodle 3D do gráfico de colunas Desenho PNG
Doodle desenhado à mão em gráfico de pizza Desenho PNG
Escolha uma pasta
Todos os favoritos
Criar novo
Salvar
Doodle desenhado à mão em gráfico de pizza Desenho PNG
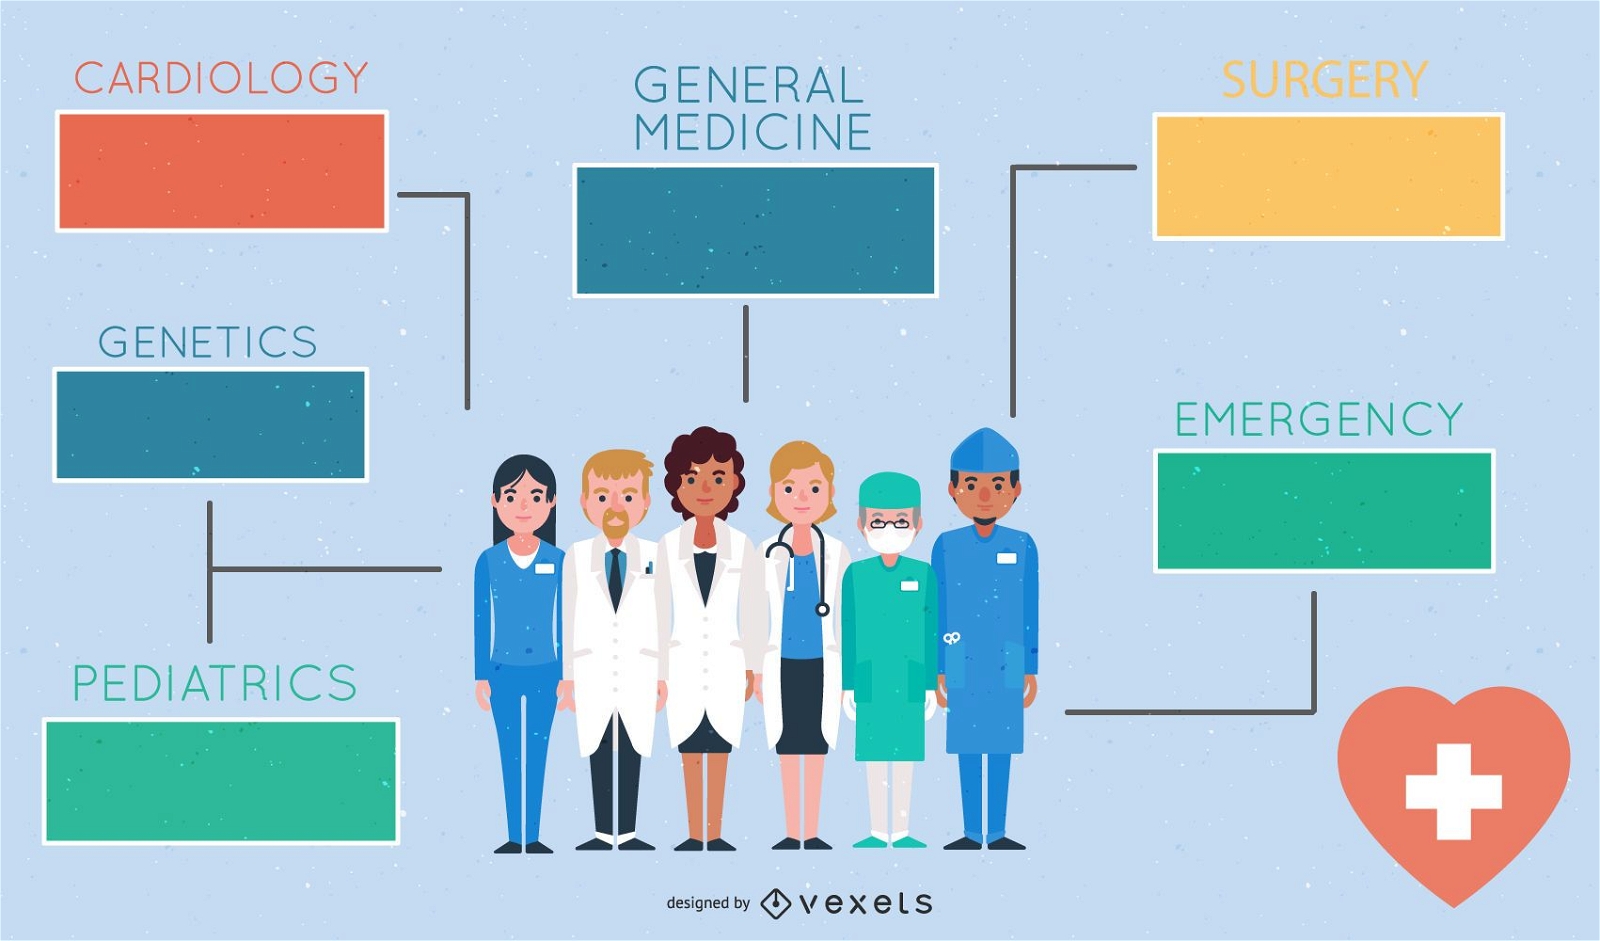
Infográfico Retro Flat Healthcare
Escolha uma pasta
Todos os favoritos
Criar novo
Salvar
Infográfico Retro Flat Healthcare
Conjunto de ícones de marketing de linha fina
Escolha uma pasta
Todos os favoritos
Criar novo
Salvar
Conjunto de ícones de marketing de linha fina
Premium
Gráfico de colunas de cilindro Desenho PNG
Escolha uma pasta
Todos os favoritos
Criar novo
Salvar
Gráfico de colunas de cilindro Desenho PNG
texto editável
Pronto para imprimir
Premium
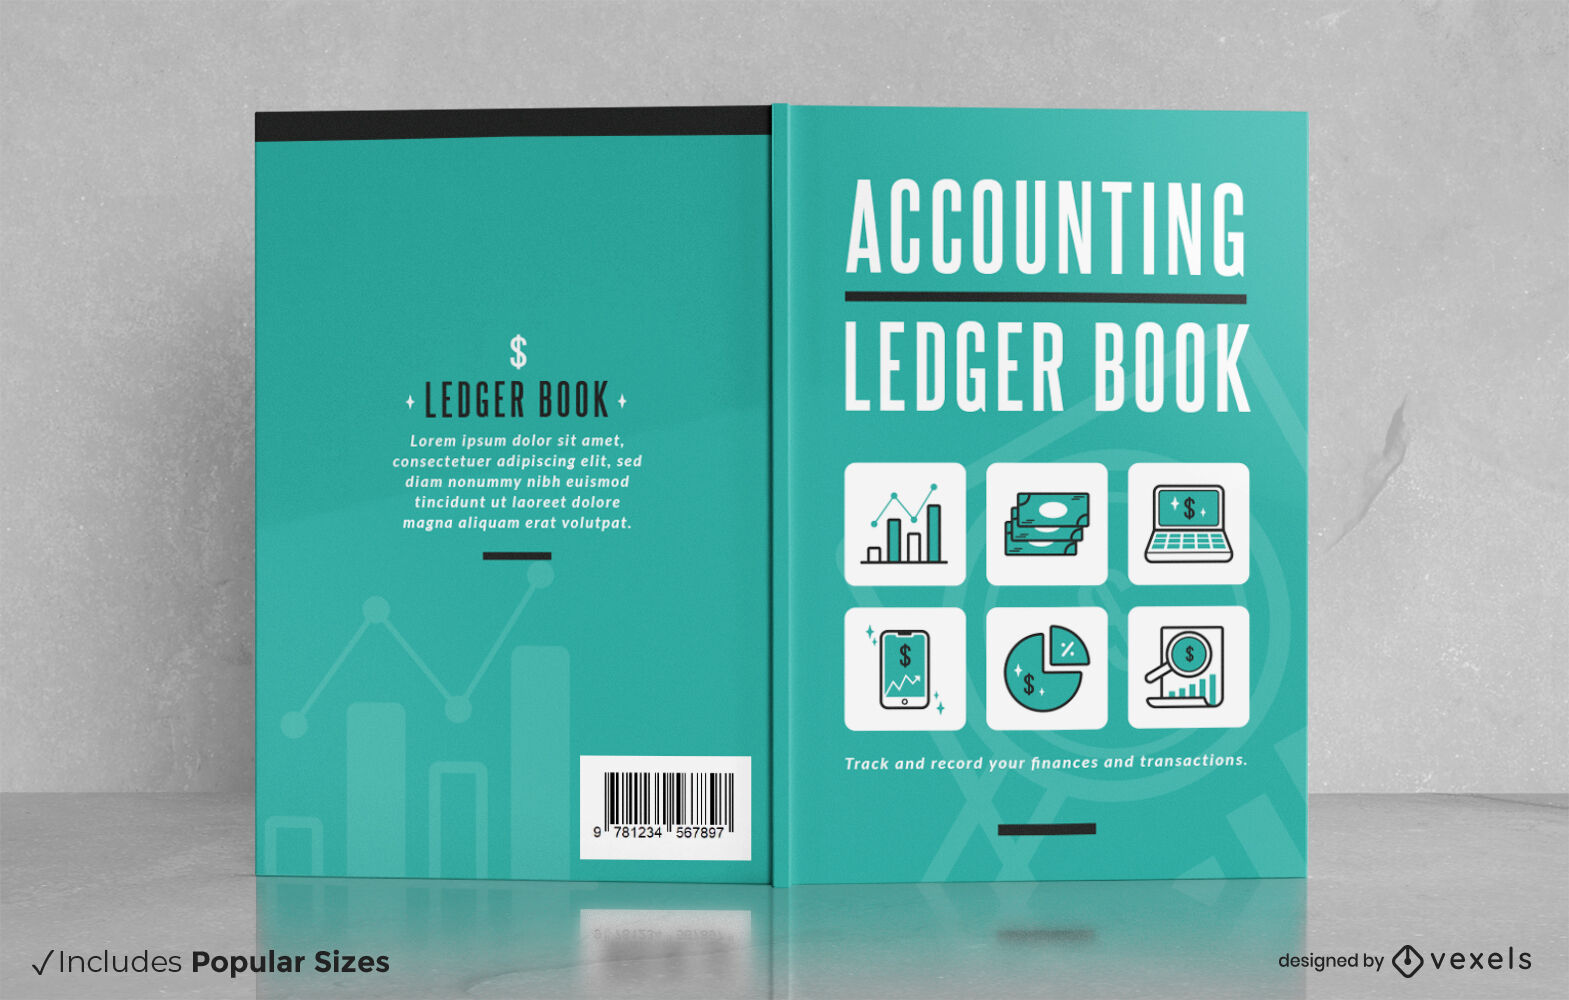
Design de capa de livro de elementos contábeis
Escolha uma pasta
Todos os favoritos
Criar novo
Salvar
Design de capa de livro de elementos contábeis
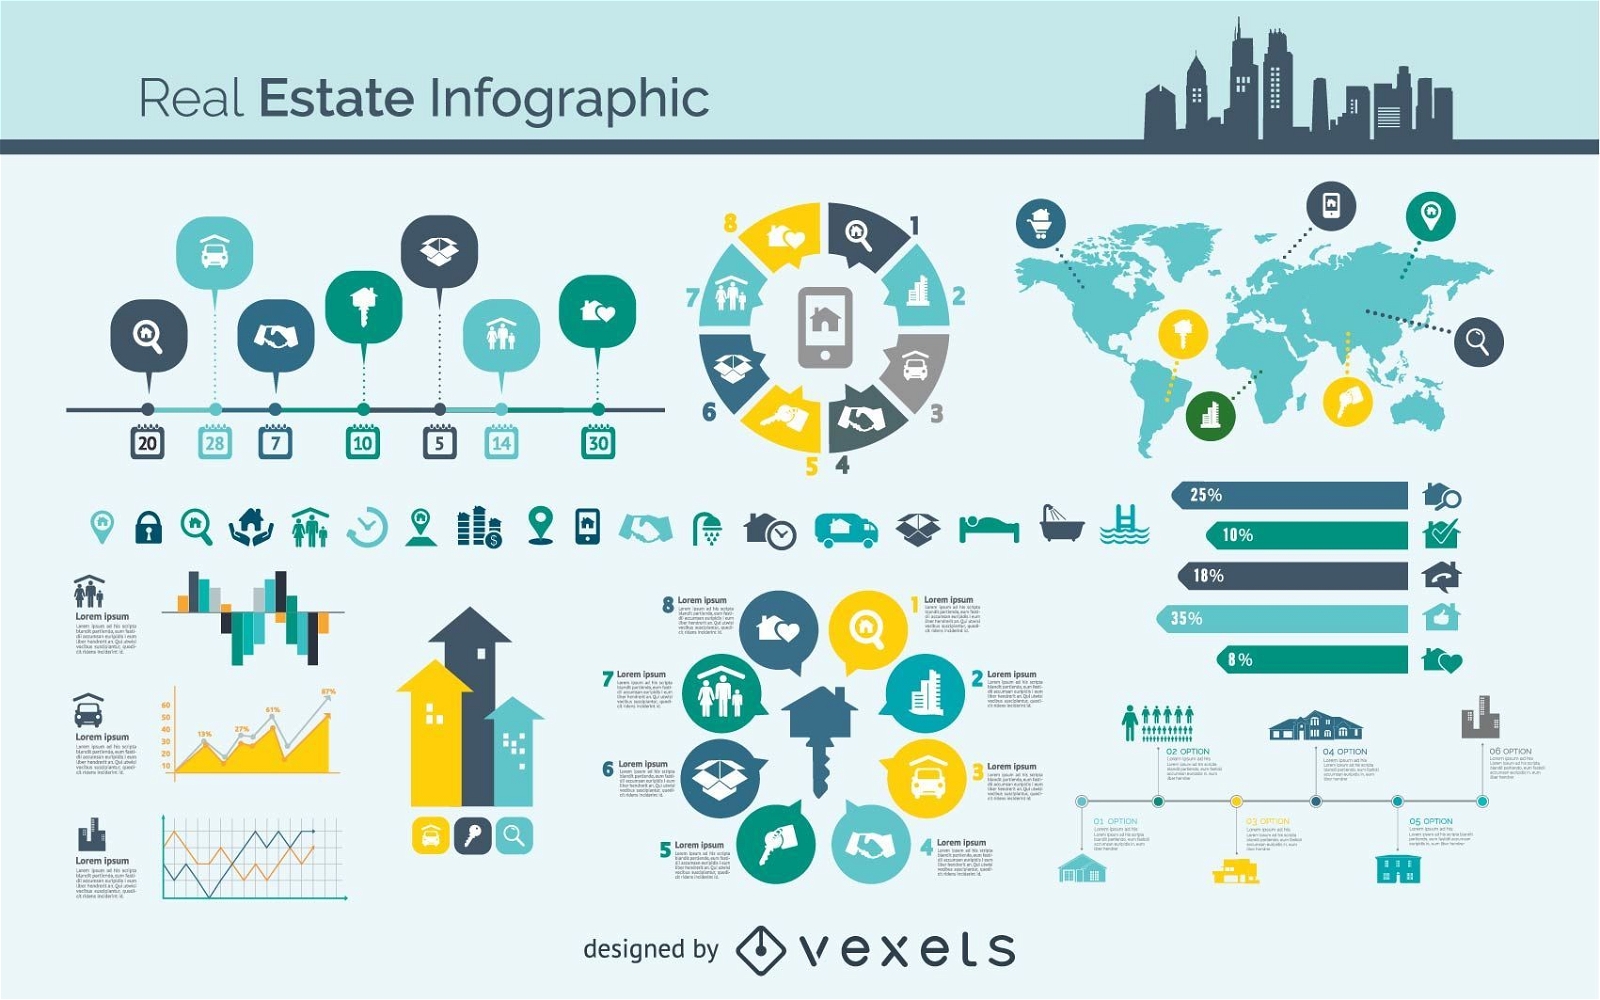
Vetor de infográfico de imóveis
Escolha uma pasta
Todos os favoritos
Criar novo
Salvar
Vetor de infográfico de imóveis
Premium
Barras piechart 3D Desenho PNG
Escolha uma pasta
Todos os favoritos
Criar novo
Salvar
Barras piechart 3D Desenho PNG
Lucros crescentes
Escolha uma pasta
Todos os favoritos
Criar novo
Salvar
Lucros crescentes
Premium
Moeda de dólar em forma de seta em crescimento Desenho PNG
Escolha uma pasta
Todos os favoritos
Criar novo
Salvar
Moeda de dólar em forma de seta em crescimento Desenho PNG
Line Art SEO Icon Pack
Escolha uma pasta
Todos os favoritos
Criar novo
Salvar
Line Art SEO Icon Pack
texto editável
Premium
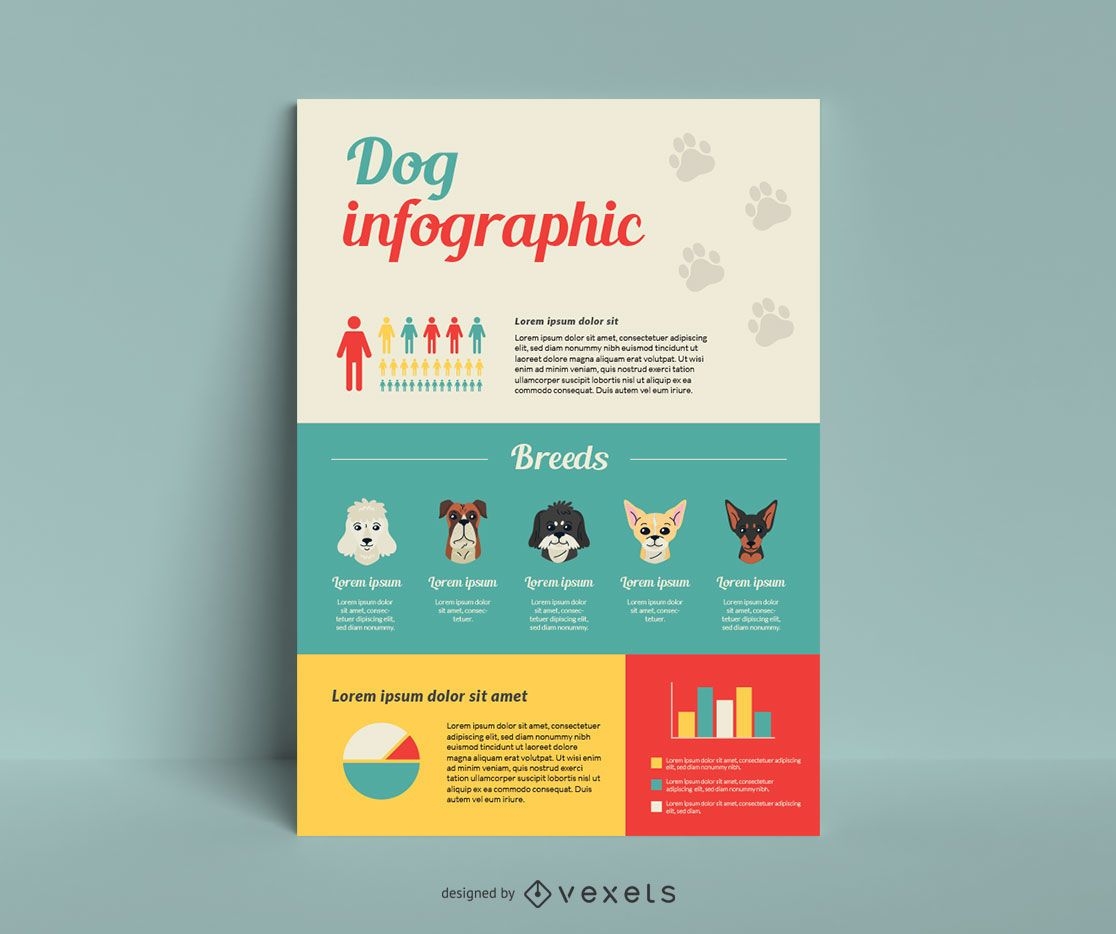
Modelo de infográfico de raça de cachorro
Escolha uma pasta
Todos os favoritos
Criar novo
Salvar
Modelo de infográfico de raça de cachorro
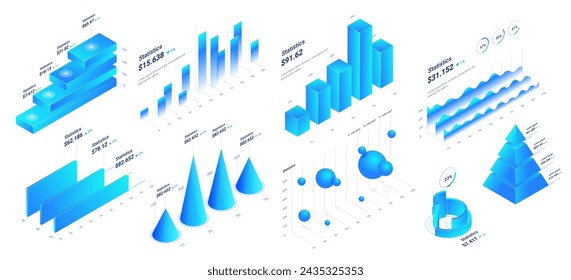
7 elementos 3D de estatísticas infográfico
Escolha uma pasta
Todos os favoritos
Criar novo
Salvar
7 elementos 3D de estatísticas infográfico
Premium
Empresário mostrando gráfico Desenho PNG
Escolha uma pasta
Todos os favoritos
Criar novo
Salvar
Empresário mostrando gráfico Desenho PNG
Gráfico de pizza colorido de quatro partes Desenho PNG
Escolha uma pasta
Todos os favoritos
Criar novo
Salvar
Gráfico de pizza colorido de quatro partes Desenho PNG
40 Plus Minimallist Info Graphics com Ícones
Escolha uma pasta
Todos os favoritos
Criar novo
Salvar
40 Plus Minimallist Info Graphics com Ícones
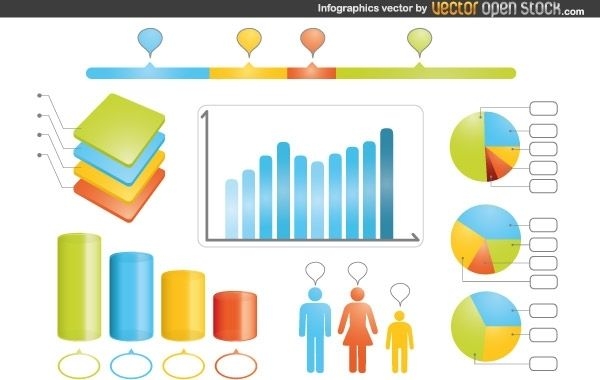
Infográficos
Escolha uma pasta
Todos os favoritos
Criar novo
Salvar
Infográficos
Exchange Chart Design Gráfico
Escolha uma pasta
Todos os favoritos
Criar novo
Salvar
Exchange Chart Design Gráfico
Premium
Quadro de apresentação de negócios Desenho PNG
Escolha uma pasta
Todos os favoritos
Criar novo
Salvar
Quadro de apresentação de negócios Desenho PNG
Infográfico ilustrado de cabeças
Escolha uma pasta
Todos os favoritos
Criar novo
Salvar
Infográfico ilustrado de cabeças
texto editável
Premium
Modelo de infográfico de raças de gatos
Escolha uma pasta
Todos os favoritos
Criar novo
Salvar
Modelo de infográfico de raças de gatos
Barra do elemento desenhado à mão do gráfico de barras Desenho PNG
Escolha uma pasta
Todos os favoritos
Criar novo
Salvar
Barra do elemento desenhado à mão do gráfico de barras Desenho PNG
Infográfico de gráfico de barras colorido 2d Desenho PNG
Escolha uma pasta
Todos os favoritos
Criar novo
Salvar
Infográfico de gráfico de barras colorido 2d Desenho PNG
Premium
Gráfico de coleta de cubos Desenho PNG
Escolha uma pasta
Todos os favoritos
Criar novo
Salvar
Gráfico de coleta de cubos Desenho PNG
Infográfico elegante e conjunto de cronograma de projeto
Escolha uma pasta
Todos os favoritos
Criar novo
Salvar
Infográfico elegante e conjunto de cronograma de projeto
Modelo de diagrama de pirâmide cinza 3D
Escolha uma pasta
Todos os favoritos
Criar novo
Salvar
Modelo de diagrama de pirâmide cinza 3D
Premium
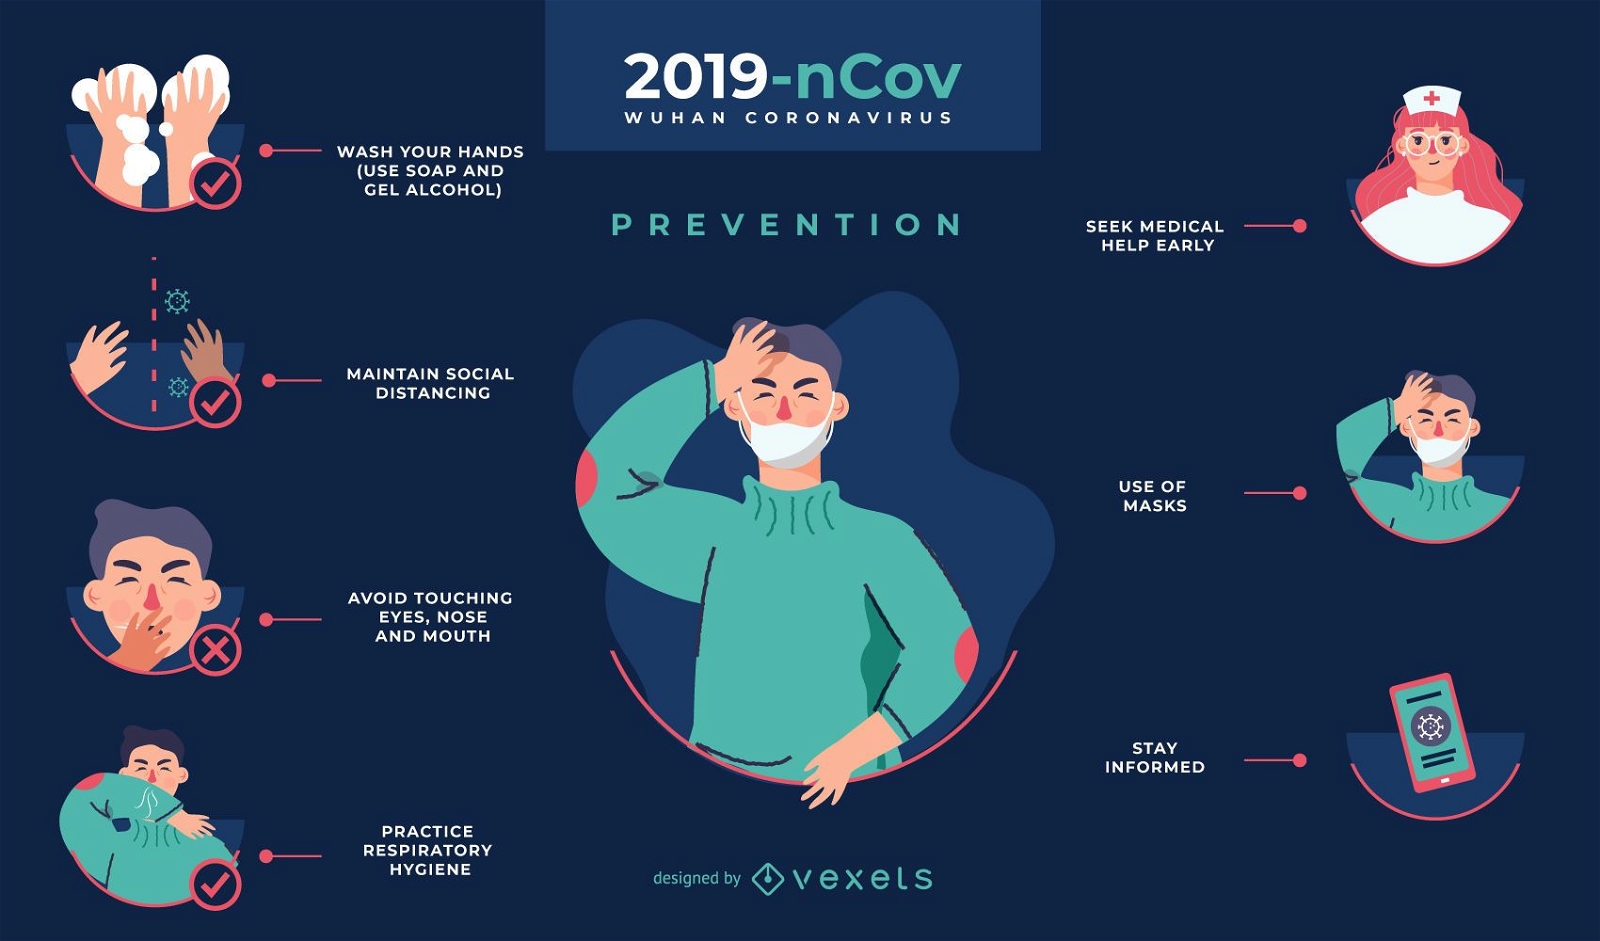
Modelo de infográfico de prevenção Covid-19
Escolha uma pasta
Todos os favoritos
Criar novo
Salvar
Modelo de infográfico de prevenção Covid-19
Premium
Gráfico de pizza liso colorido Desenho PNG
Escolha uma pasta
Todos os favoritos
Criar novo
Salvar
Gráfico de pizza liso colorido Desenho PNG
Jovem empresário com design infográfico
Escolha uma pasta
Todos os favoritos
Criar novo
Salvar
Jovem empresário com design infográfico
Premium
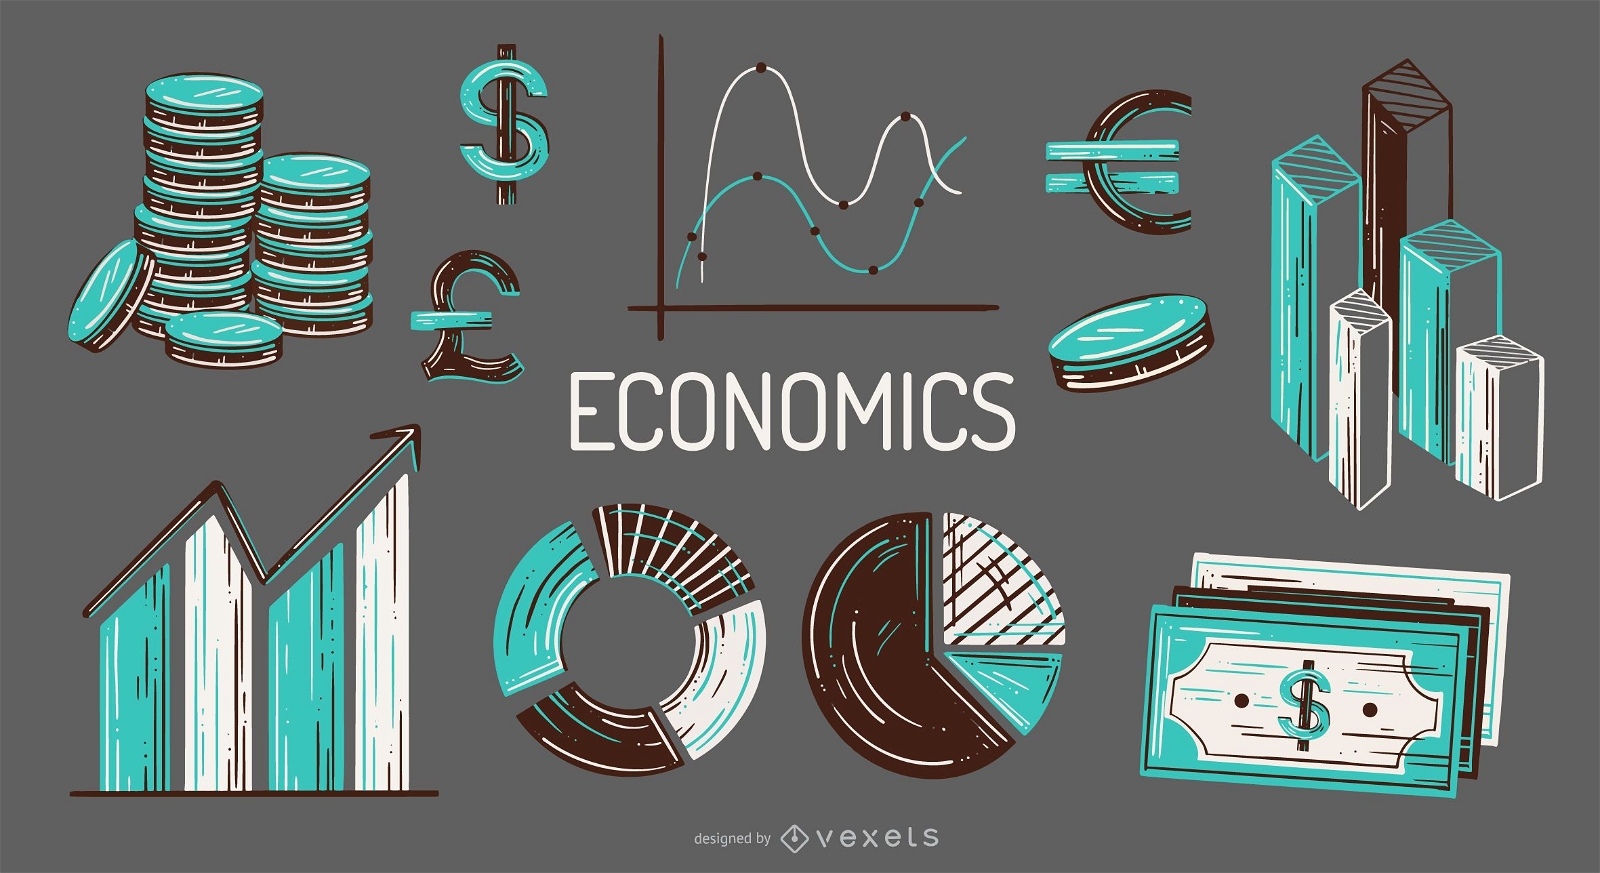
Conjunto de ilustração de elementos econômicos
Escolha uma pasta
Todos os favoritos
Criar novo
Salvar
Conjunto de ilustração de elementos econômicos
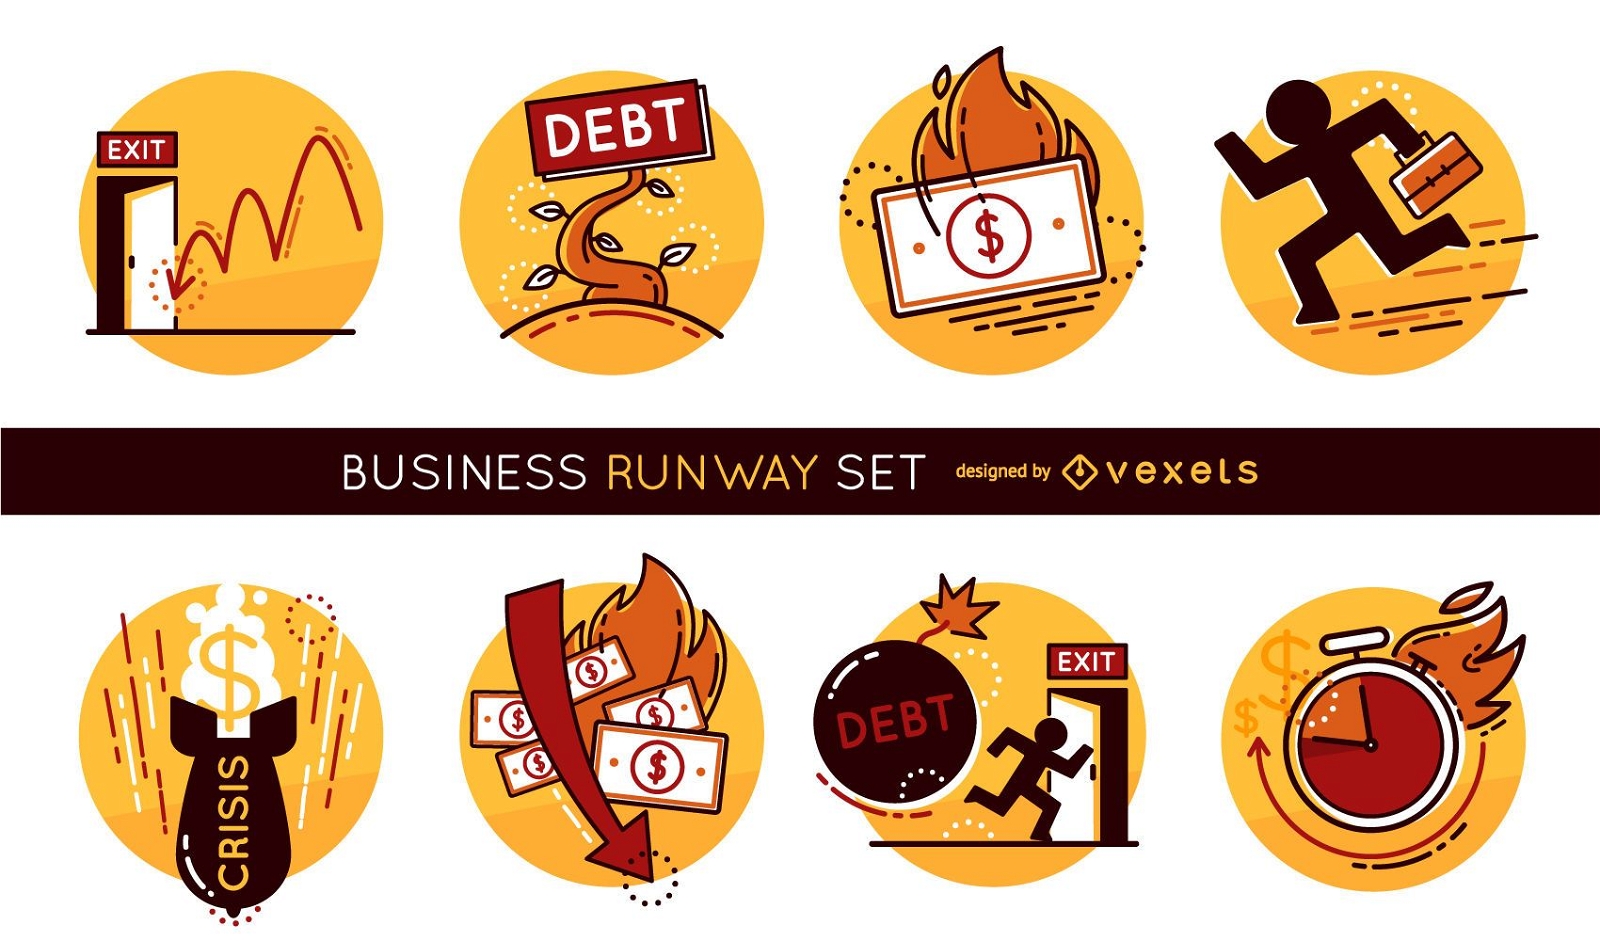
Conjunto de ilustração de passarela de negócios
Escolha uma pasta
Todos os favoritos
Criar novo
Salvar
Conjunto de ilustração de passarela de negócios
Ícone de serviço da rodada de progresso Desenho PNG
Escolha uma pasta
Todos os favoritos
Criar novo
Salvar
Ícone de serviço da rodada de progresso Desenho PNG
Círculo de Seta Brilhante
Escolha uma pasta
Todos os favoritos
Criar novo
Salvar
Círculo de Seta Brilhante
Modelos de Apresentação
Premium
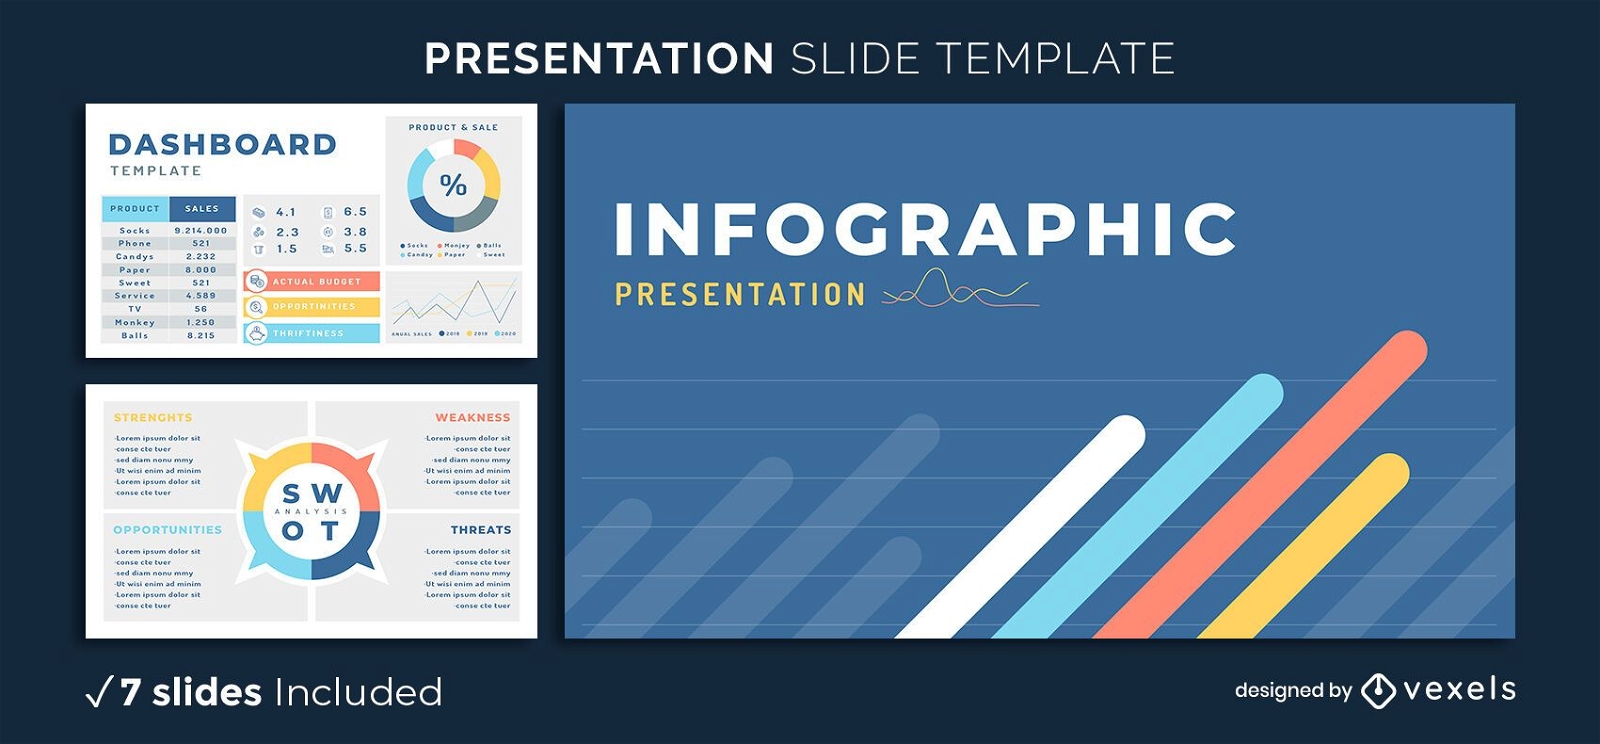
Modelo de apresentação de elementos infográfico
Escolha uma pasta
Todos os favoritos
Criar novo
Salvar
Modelo de apresentação de elementos infográfico
Premium
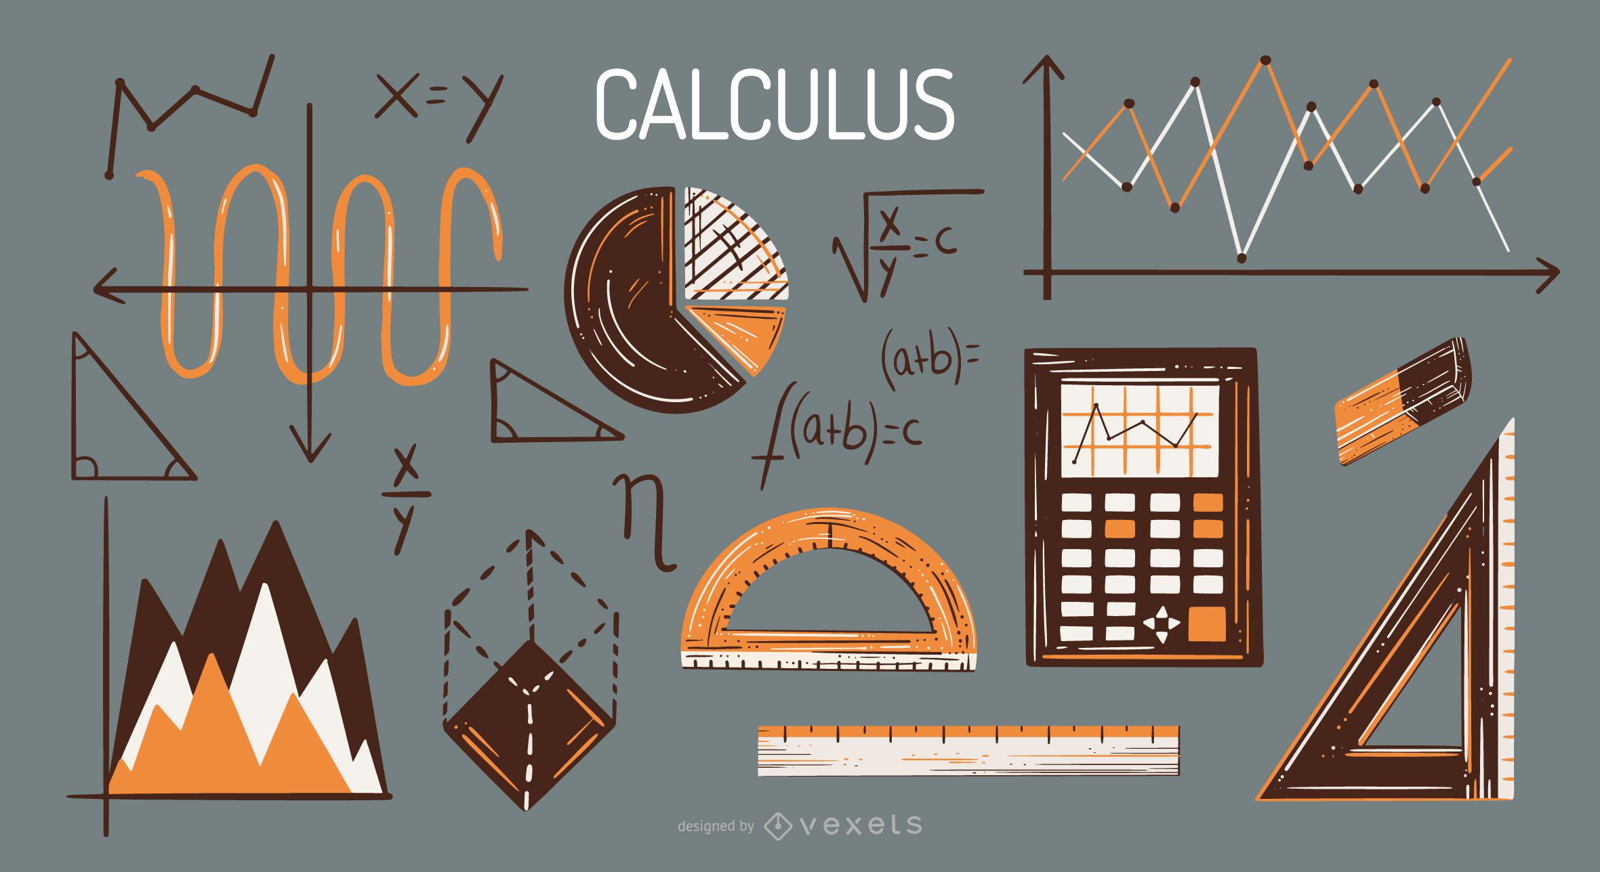
Conjunto de ilustração de elementos de cálculo
Escolha uma pasta
Todos os favoritos
Criar novo
Salvar
Conjunto de ilustração de elementos de cálculo
Premium
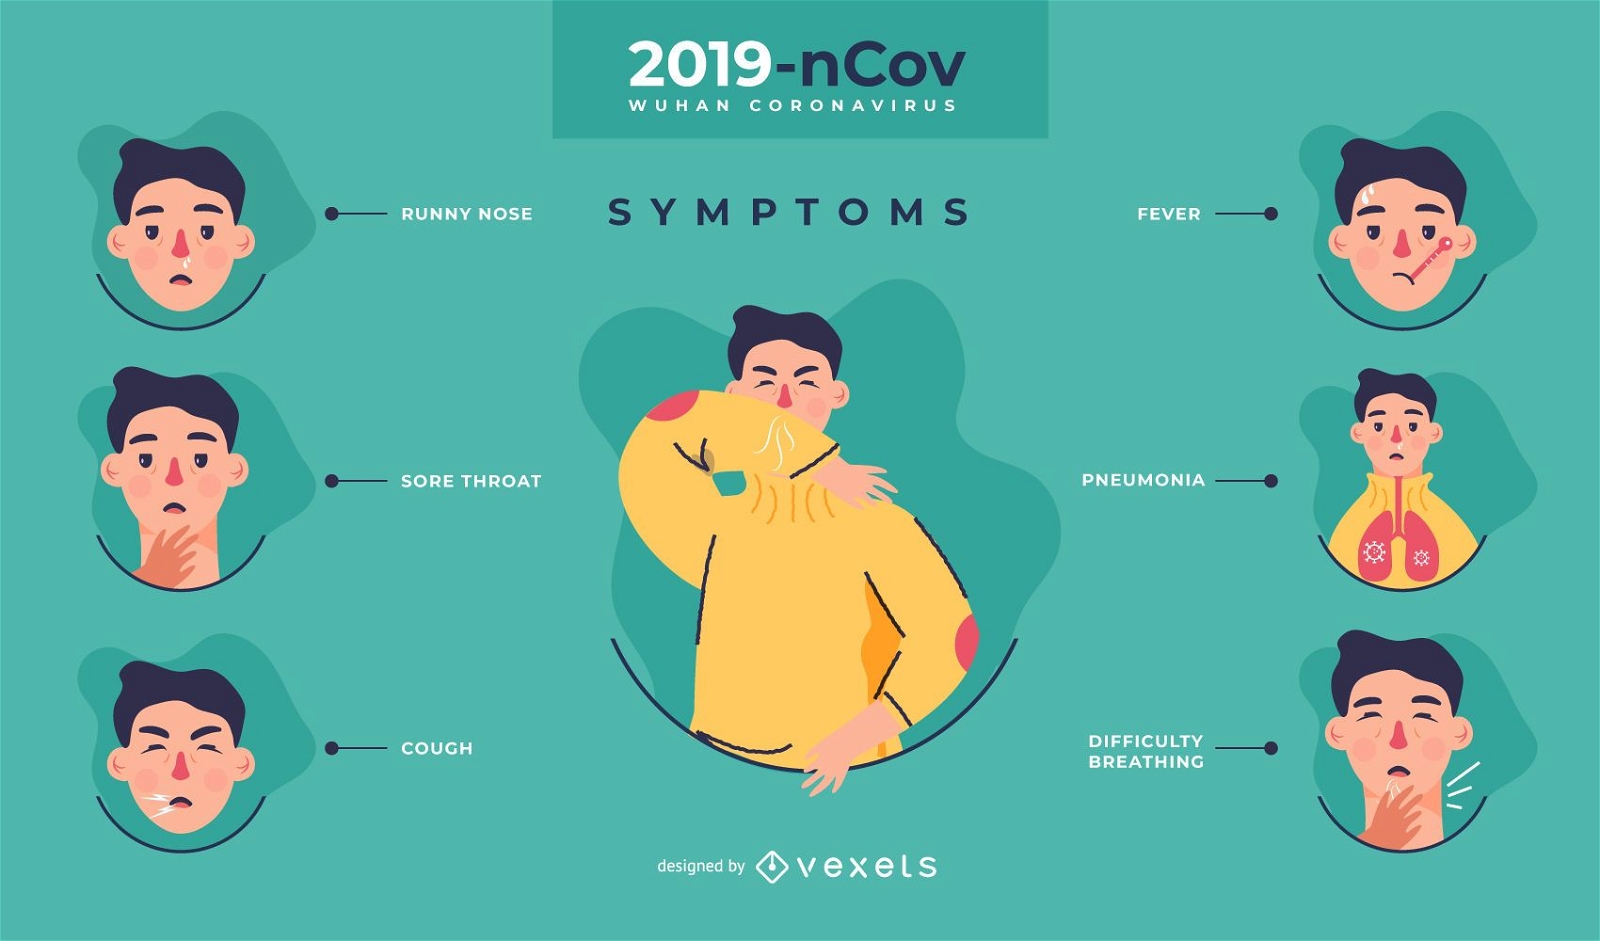
Modelo de infográfico de sintomas de Covid-19
Escolha uma pasta
Todos os favoritos
Criar novo
Salvar
Modelo de infográfico de sintomas de Covid-19
Modelo editável
Premium
Modelo de infográfico abstrato
Escolha uma pasta
Todos os favoritos
Criar novo
Salvar
Modelo de infográfico abstrato
Premium
Gráfico de pizza com setas Desenho PNG
Escolha uma pasta
Todos os favoritos
Criar novo
Salvar
Gráfico de pizza com setas Desenho PNG
Empresário com mapa global e avião
Escolha uma pasta
Todos os favoritos
Criar novo
Salvar
Empresário com mapa global e avião
Premium
Seta do gráfico de pizza Desenho PNG
Escolha uma pasta
Todos os favoritos
Criar novo
Salvar
Seta do gráfico de pizza Desenho PNG
Van com direção de seta coberta Desenho PNG
Escolha uma pasta
Todos os favoritos
Criar novo
Salvar
Van com direção de seta coberta Desenho PNG
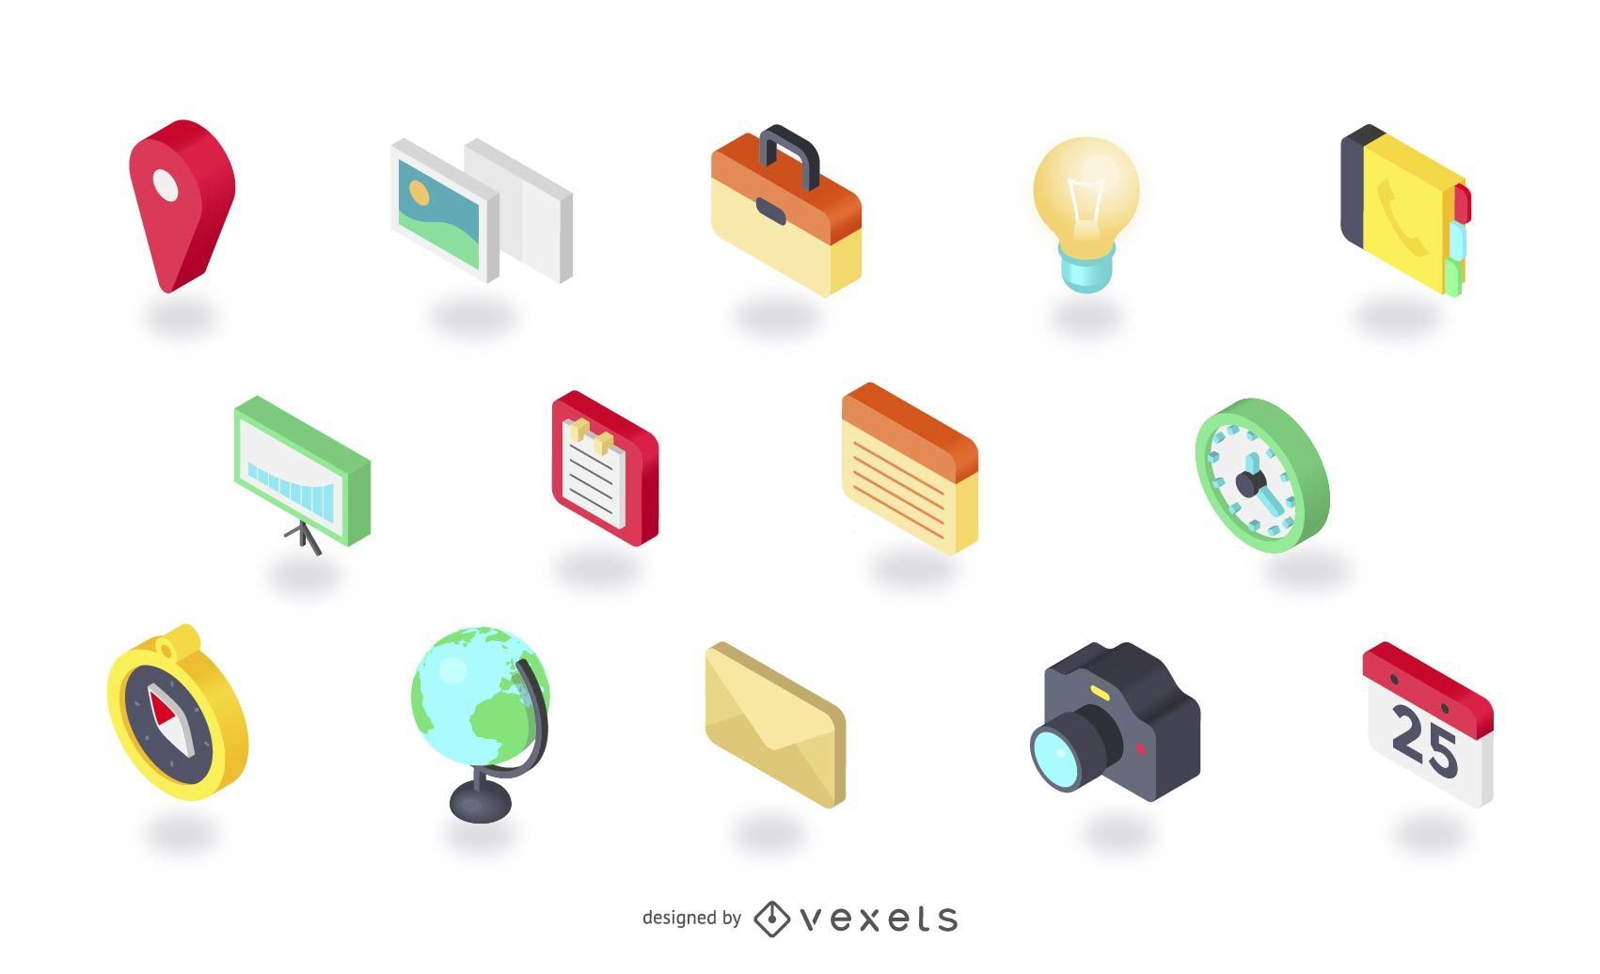
Ícones de vetor isométrico
Escolha uma pasta
Todos os favoritos
Criar novo
Salvar
Ícones de vetor isométrico
Últimas notícias de negócios no laptop
Escolha uma pasta
Todos os favoritos
Criar novo
Salvar
Últimas notícias de negócios no laptop
Cronograma de desenvolvimento de negócios
Escolha uma pasta
Todos os favoritos
Criar novo
Salvar
Cronograma de desenvolvimento de negócios
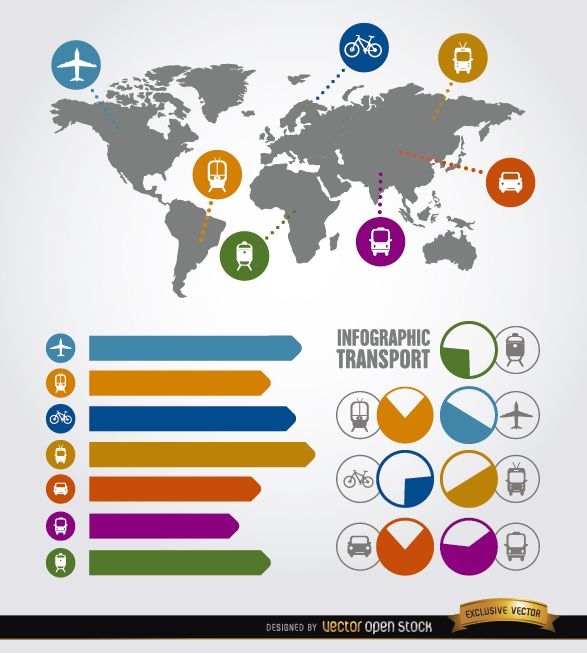
Elementos de transporte de infográfico de viagens
Escolha uma pasta
Todos os favoritos
Criar novo
Salvar
Elementos de transporte de infográfico de viagens
Impulsione seu negócio
Com a plataforma gráfica líder de mercado.
Ver planos
Próxima
do 8
prev page
next page