Biblioteca de design
Novos designs Merch
Camisetas
Vectores
Designs de Merch de Tendência
PNGs & SVGs
Mockups
Modelos de T-Shirt PSD
Explorar Desenhos
Designs KDP
Pôsteres
Canecas
Capas para celular
Sacos de compras
Almofadas
Ferramentas de desenho
Merch Designer
Novo!
Mockup Generator
Gerador de Design de AI
Vetorizador
Quote Generator
T-Shirt Maker (Antigo)
Ajuda
Merch Digest
Blog
Centro de Ajuda
Saiba mais sobre o Merch
Feedback
Soluções Corporativas
Empresa
Acesso à API
Estúdio de Design
Design em Lote
Preços
Carregando...
Inscrever-se
Conecte-se
All
graph
Biblioteca de design
Novos designs Merch
Camisetas
Vectores
Designs de Merch de Tendência
PNGs & SVGs
Mockups
Modelos de T-Shirt PSD
Explorar Desenhos
Designs KDP
Pôsteres
Canecas
Capas para celular
Sacos de compras
Almofadas
Ferramentas de desenho
Merch Designer
Novo!
Mockup Generator
Gerador de Design de AI
Vetorizador
Quote Generator
T-Shirt Maker (Antigo)
Ajuda
Merch Digest
Blog
Centro de Ajuda
Saiba mais sobre o Merch
Feedback
Soluções Corporativas
Empresa
Acesso à API
Estúdio de Design
Design em Lote
PLANOS
All
graph
364 Gráficos e Designs de graph para Camisetas e Merch print on demand
Baixar designs de camisetas e para merch, como capas de livro, capas de celular, tote bags e mais de graph
Relacionado:
graphixshare
,
este design graphic tee pode ser usado em camisas
,
historia em quadrinhos
Ordenar por
Mais relevante
Resultados patrocinados da
Ganhe 15% de desconto com o código: VEXELS15
veja mais detalhes
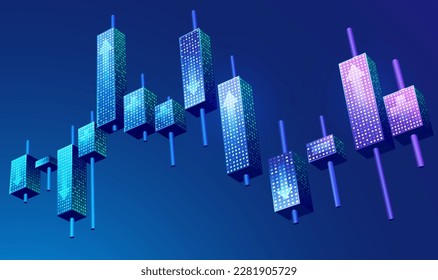
Gráfico de barras 3D desenhado à mão Desenho PNG
Escolha uma pasta
Todos os favoritos
Criar novo
Salvar
Gráfico de barras 3D desenhado à mão Desenho PNG
Doodle de escola angular Desenho PNG
Escolha uma pasta
Todos os favoritos
Criar novo
Salvar
Doodle de escola angular Desenho PNG
Conjunto de vetores de fundo de ondas abstratas de 4 cores
Escolha uma pasta
Todos os favoritos
Criar novo
Salvar
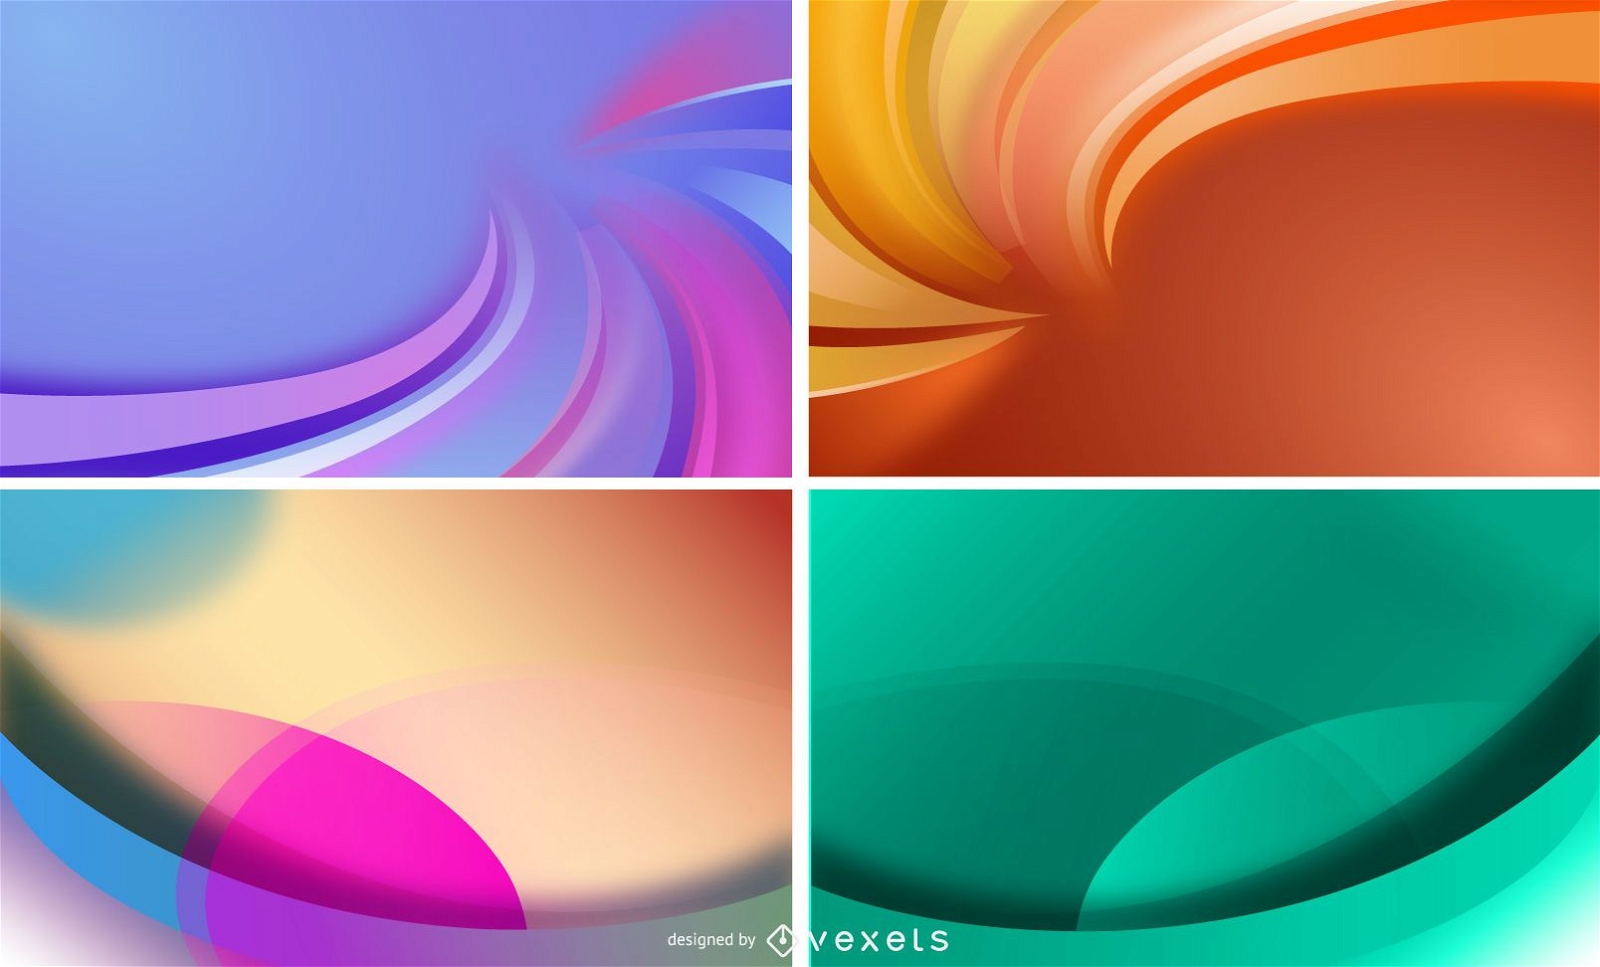
Conjunto de vetores de fundo de ondas abstratas de 4 cores
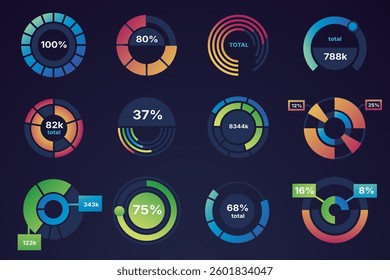
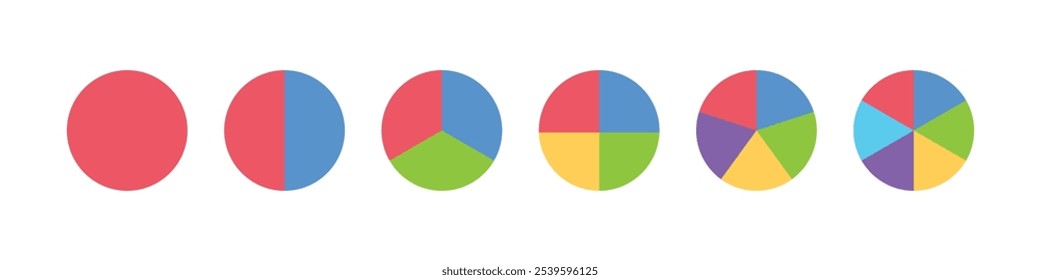
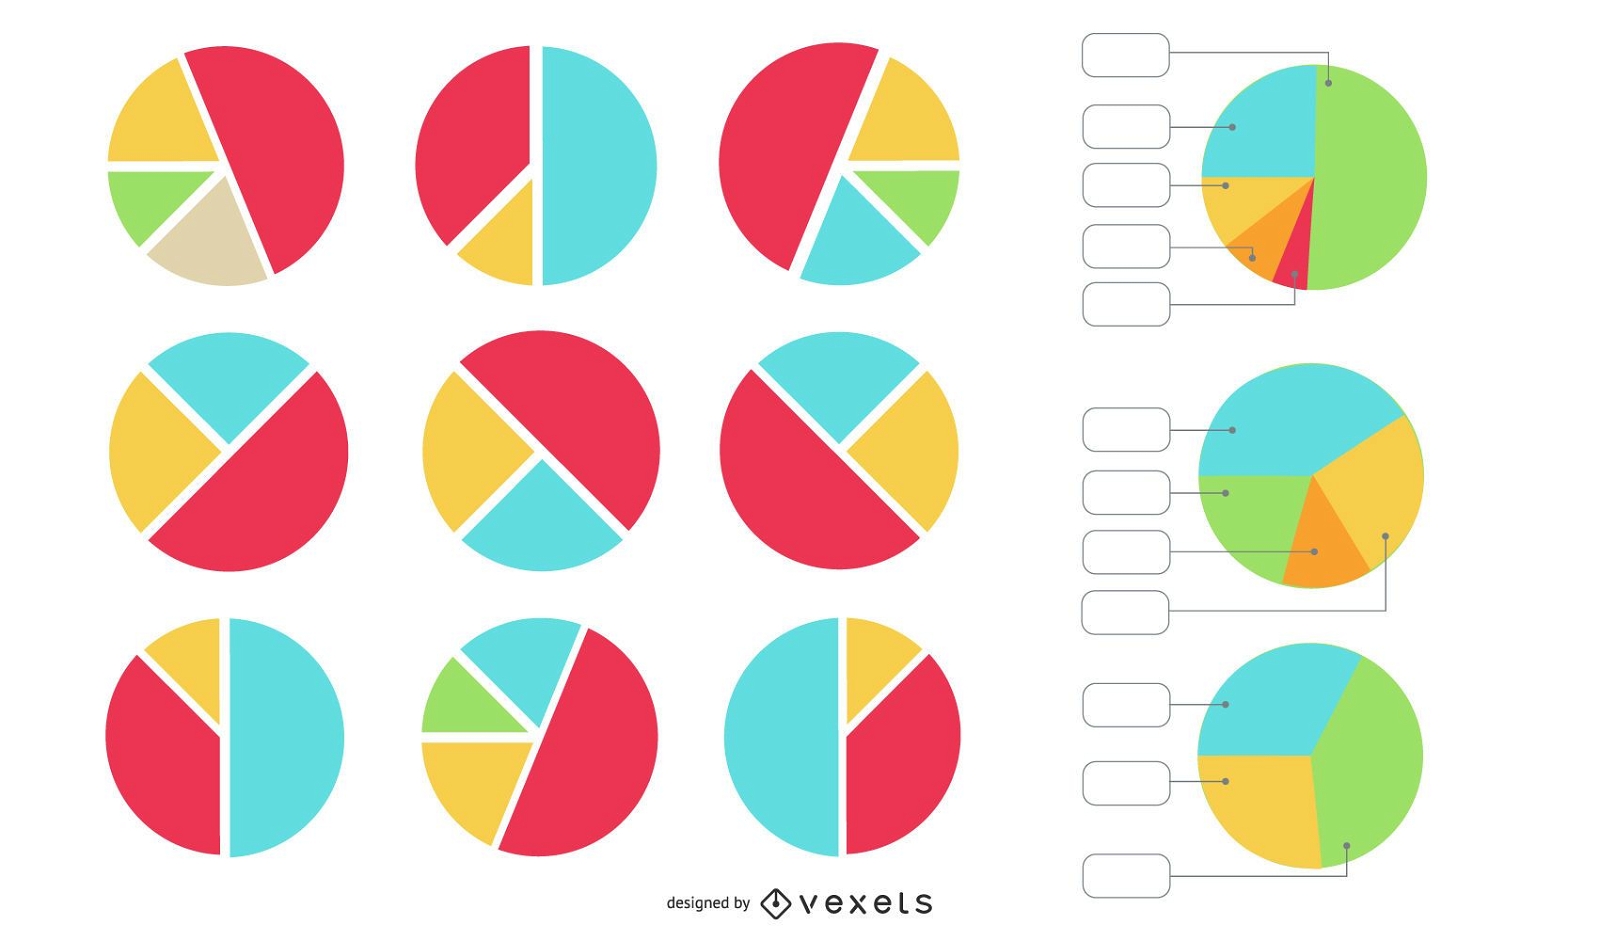
Conjunto de vetores de gráfico de pizza
Escolha uma pasta
Todos os favoritos
Criar novo
Salvar
Conjunto de vetores de gráfico de pizza
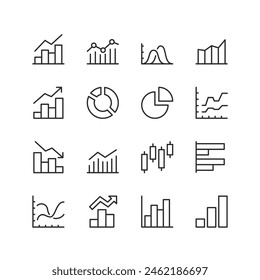
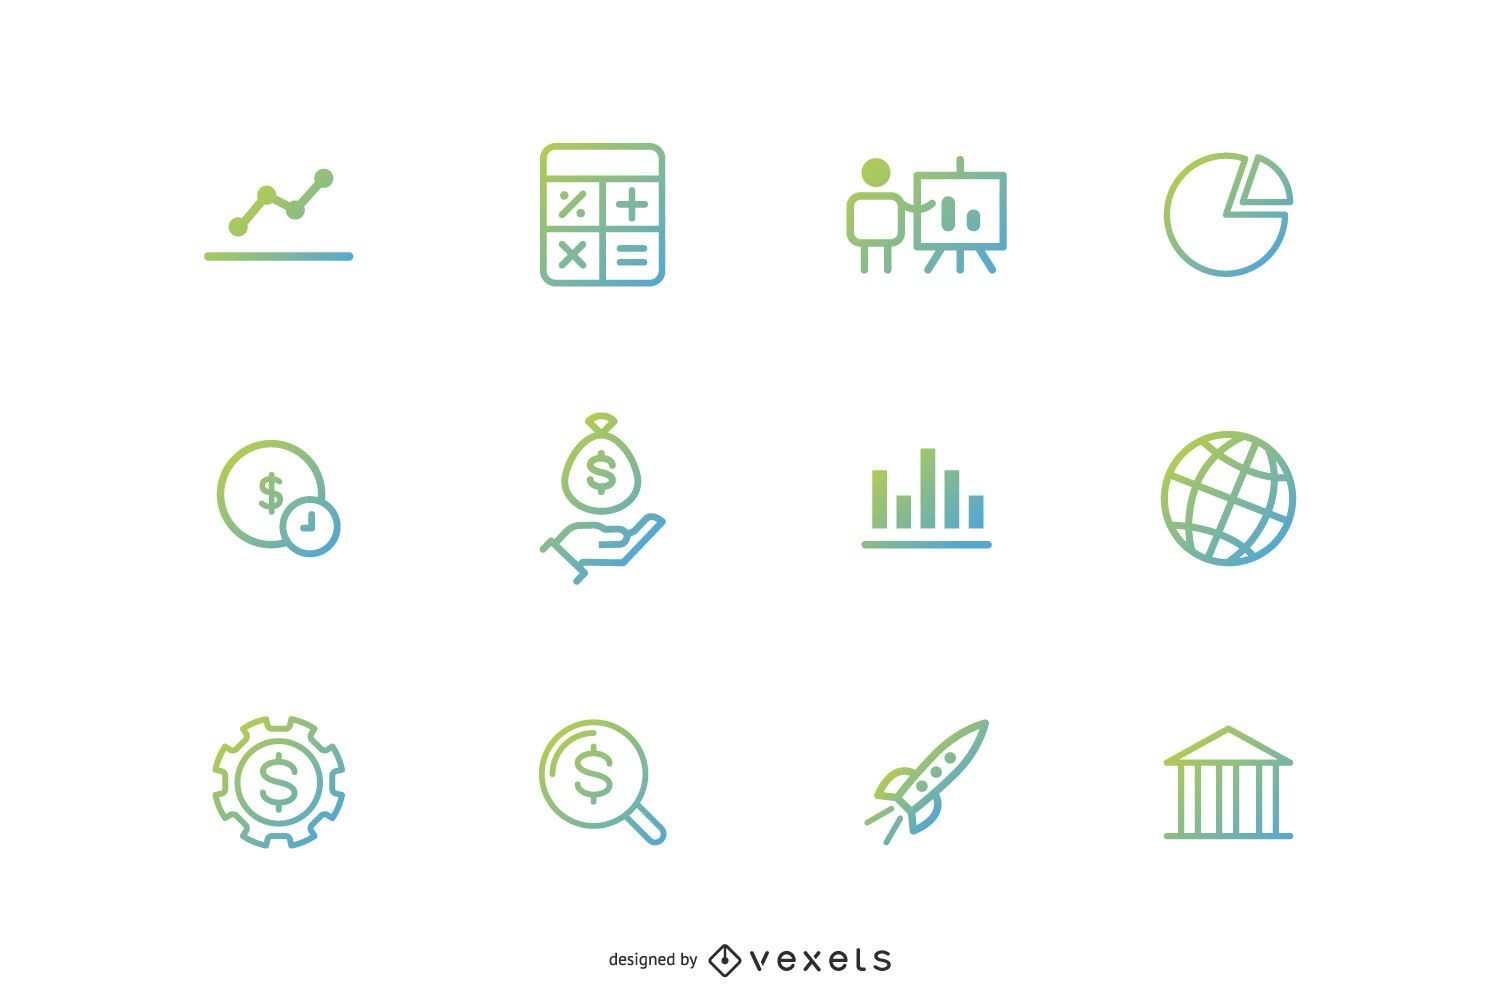
Ícones de investimento financeiro
Escolha uma pasta
Todos os favoritos
Criar novo
Salvar
Ícones de investimento financeiro
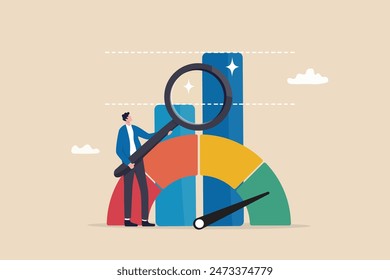
Ilustração de sucesso de crescimento empresarial
Escolha uma pasta
Todos os favoritos
Criar novo
Salvar
Ilustração de sucesso de crescimento empresarial
Pronto para imprimir
para Merch
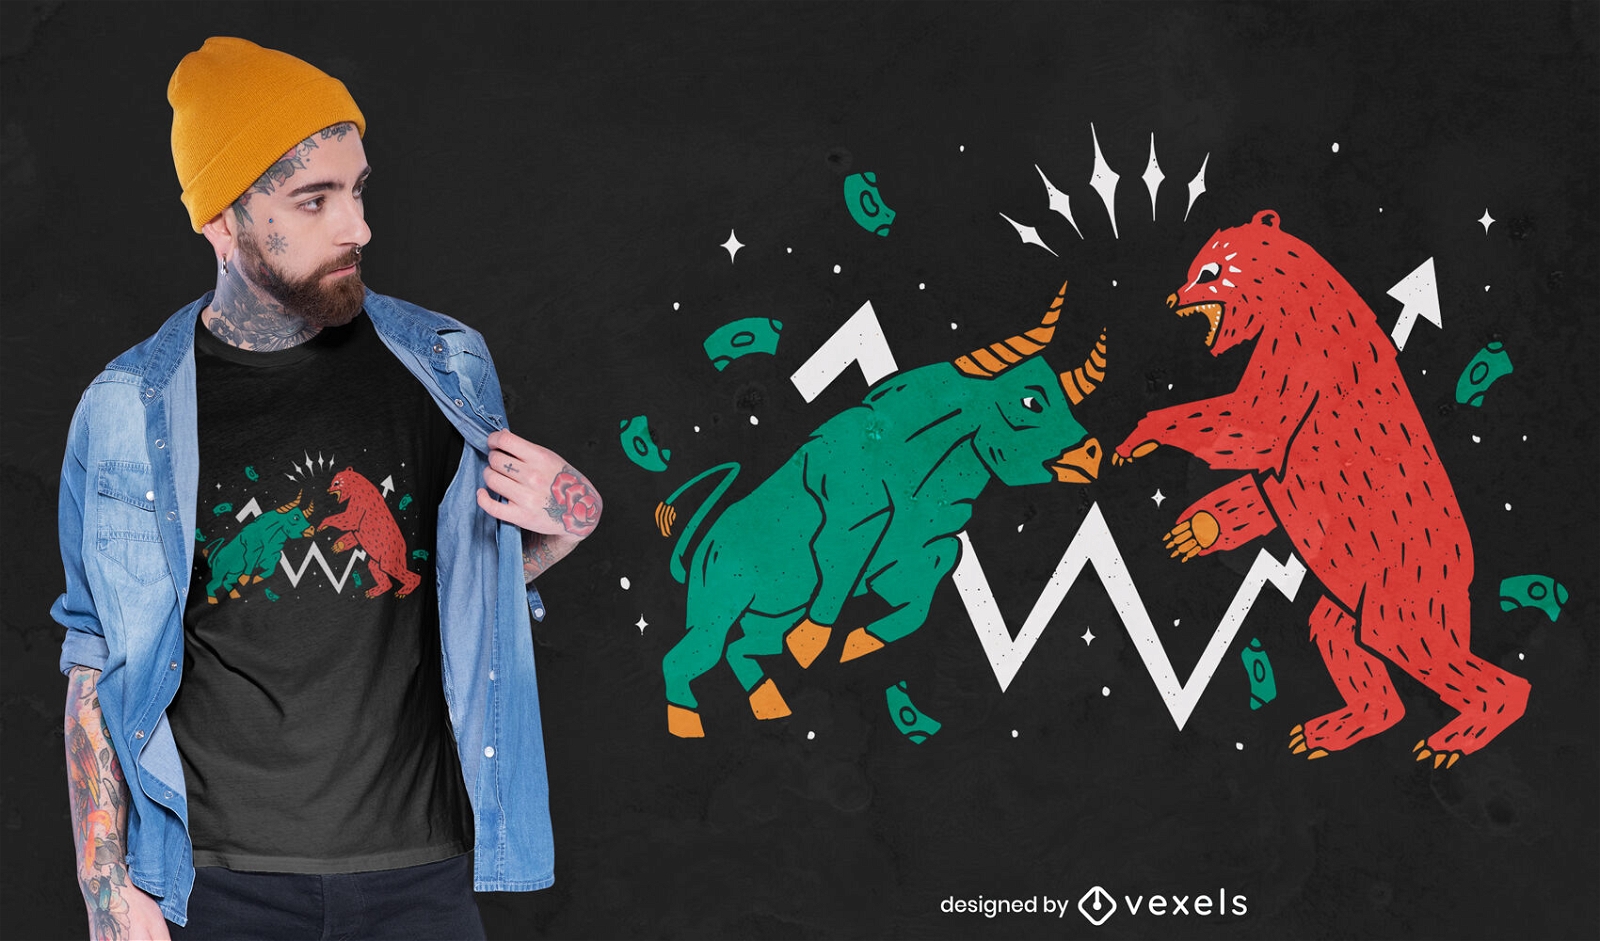
Design de t-shirt de luta de animais de touro e urso
Escolha uma pasta
Todos os favoritos
Criar novo
Salvar
Design de t-shirt de luta de animais de touro e urso
Pronto para imprimir
para Merch
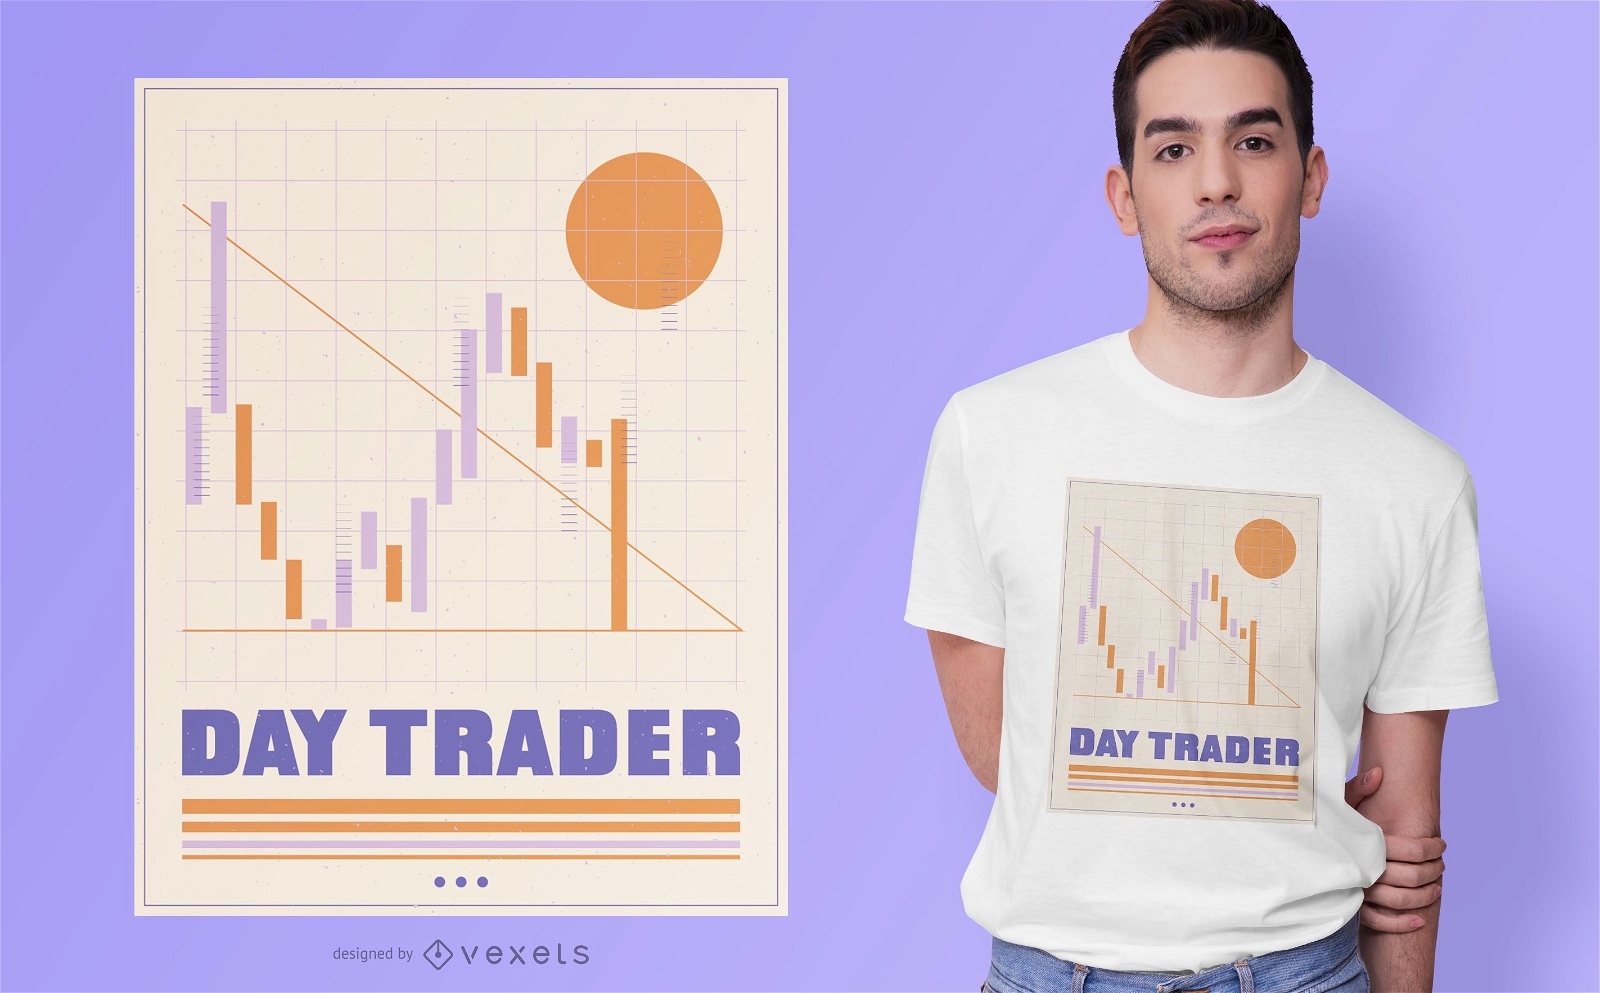
Day Trader Finances Design de camisetas
Escolha uma pasta
Todos os favoritos
Criar novo
Salvar
Day Trader Finances Design de camisetas
Pronto para imprimir
para Merch
Design de camisetas para acionistas da Stocks
Escolha uma pasta
Todos os favoritos
Criar novo
Salvar
Design de camisetas para acionistas da Stocks
Silhueta de encontro com empresários
Escolha uma pasta
Todos os favoritos
Criar novo
Salvar
Silhueta de encontro com empresários
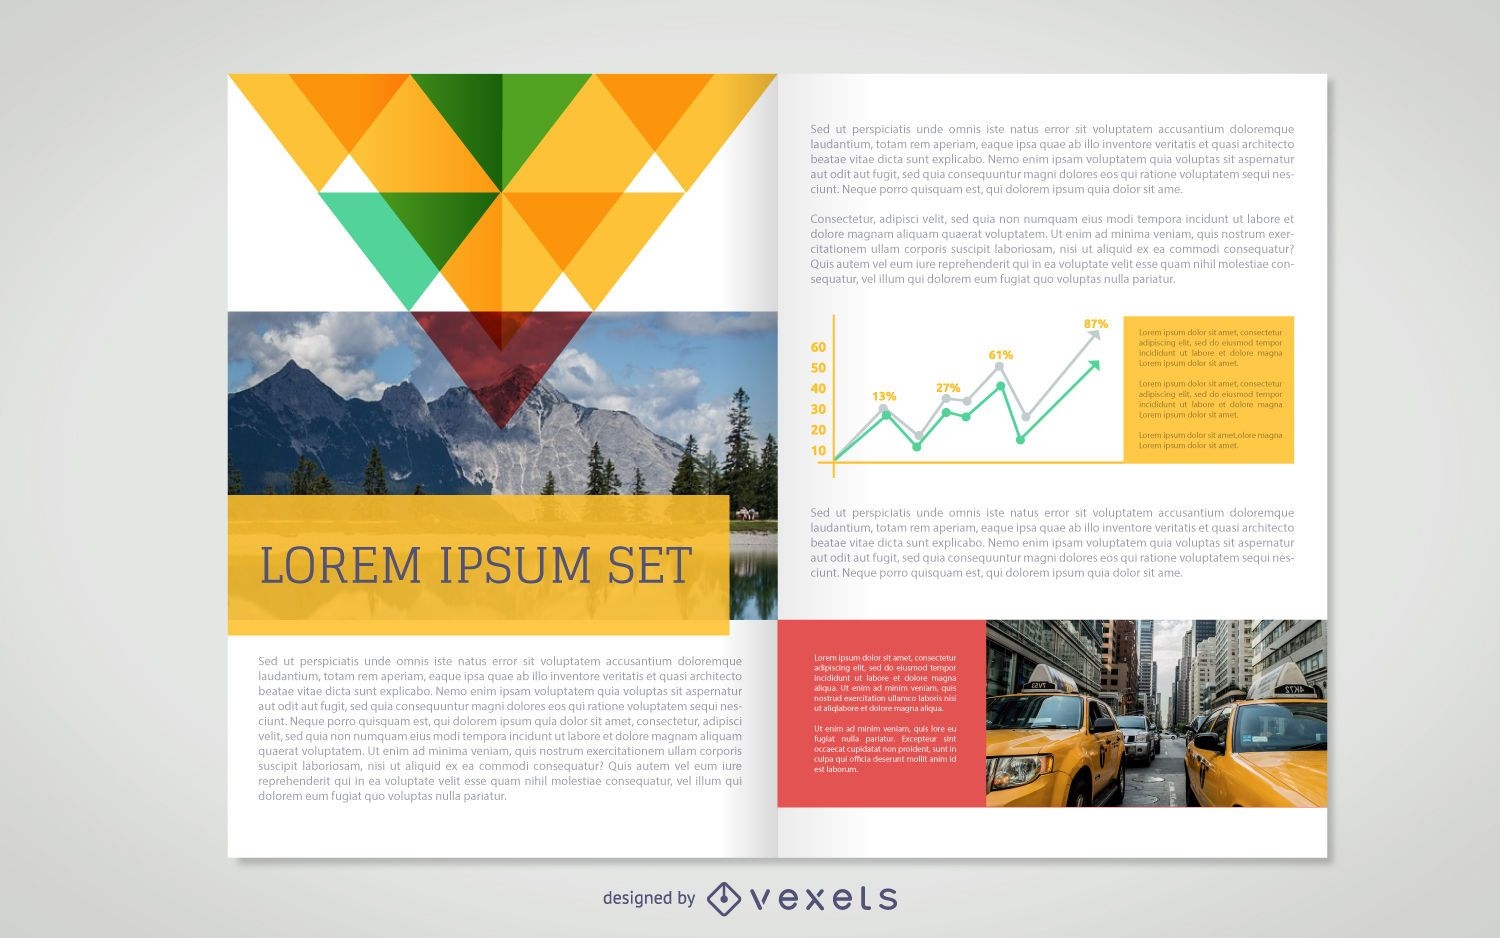
Modelo de folheto liso amarelo
Escolha uma pasta
Todos os favoritos
Criar novo
Salvar
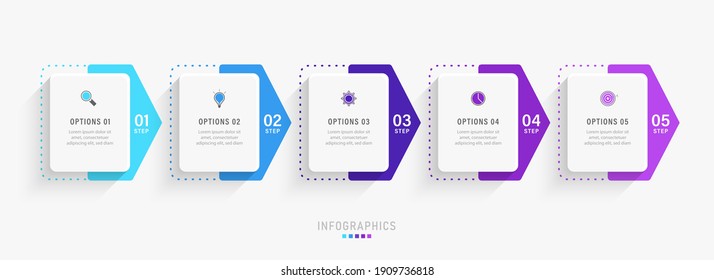
Modelo de folheto liso amarelo
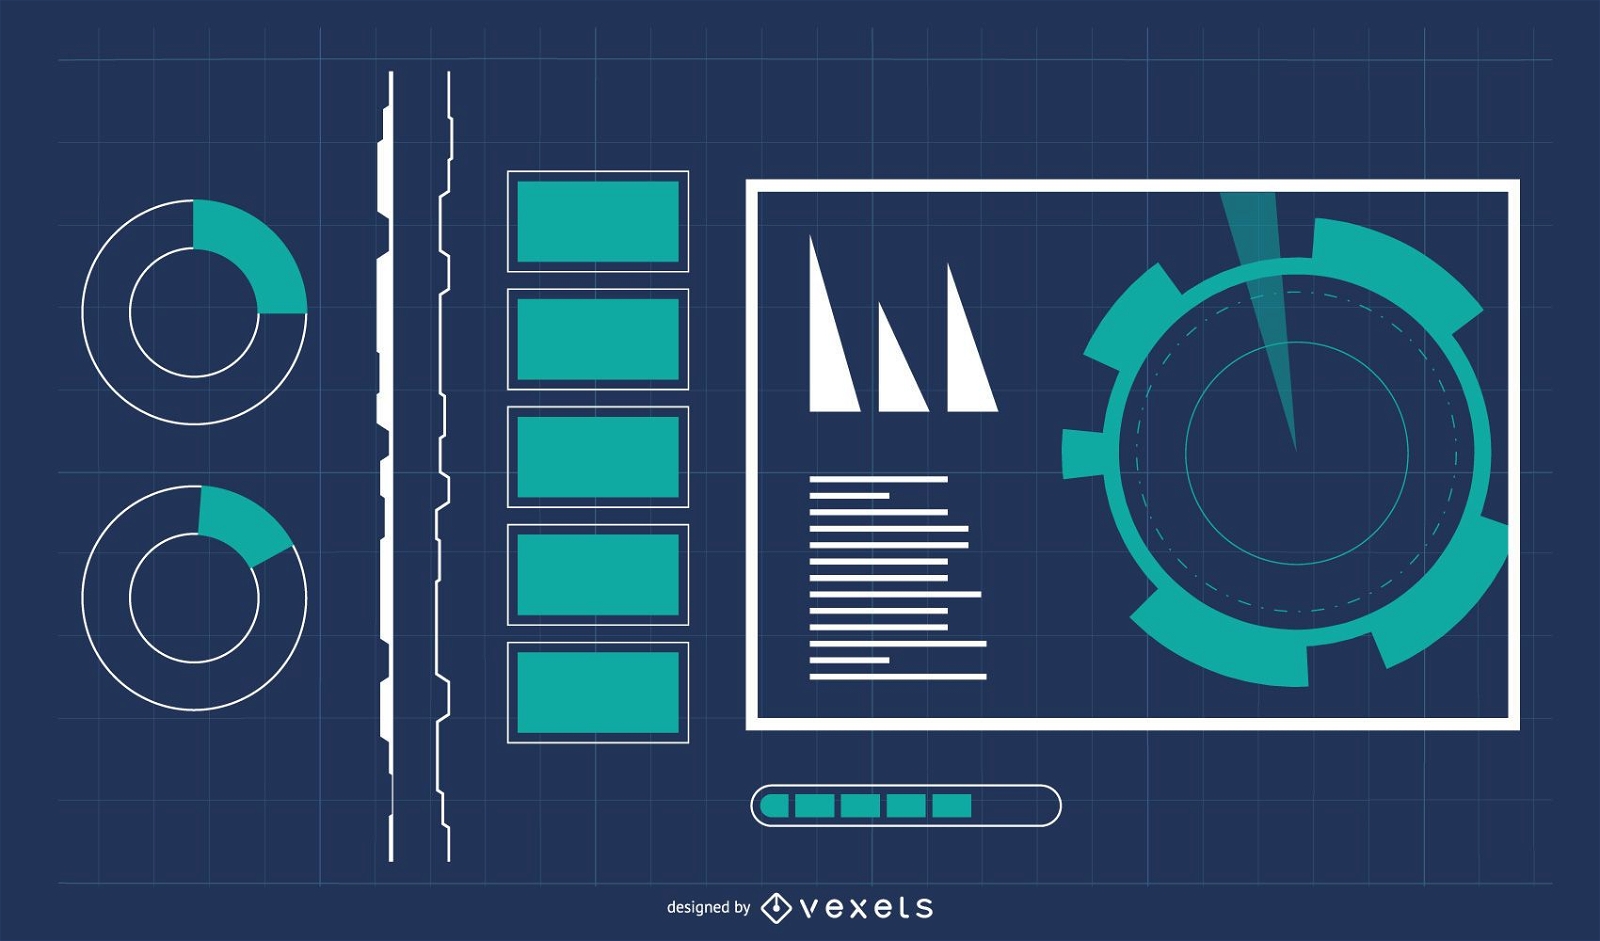
Fundo de tecnologia digital com info-gráfico
Escolha uma pasta
Todos os favoritos
Criar novo
Salvar
Fundo de tecnologia digital com info-gráfico
Premium
Design estilizado do monitor de frequência cardíaca Desenho PNG
Escolha uma pasta
Todos os favoritos
Criar novo
Salvar
Design estilizado do monitor de frequência cardíaca Desenho PNG
Série de elementos de design em preto e branco gráfico de vetor 10
Escolha uma pasta
Todos os favoritos
Criar novo
Salvar
Série de elementos de design em preto e branco gráfico de vetor 10
Impulsione seu negócio
Com a plataforma gráfica líder de mercado.
Ver planos
do 8
prev page
next page