Biblioteca de design
Novos designs Merch
Camisetas
Vectores
Designs de Merch de Tendência
PNGs & SVGs
Mockups
Modelos de T-Shirt PSD
Explorar Desenhos
Designs KDP
Pôsteres
Canecas
Capas para celular
Sacos de compras
Almofadas
Ferramentas de desenho
Merch Designer
Novo!
Mockup Generator
Gerador de Design de AI
Vetorizador
Quote Generator
T-Shirt Maker (Antigo)
Ajuda
Merch Digest
Blog
Centro de Ajuda
Saiba mais sobre o Merch
Feedback
Soluções Corporativas
Empresa
Acesso à API
Estúdio de Design
Design em Lote
Preços
Carregando...
Inscrever-se
Conecte-se
PSD Templates
graficos
Biblioteca de design
Novos designs Merch
Camisetas
Vectores
Designs de Merch de Tendência
PNGs & SVGs
Mockups
Modelos de T-Shirt PSD
Explorar Desenhos
Designs KDP
Pôsteres
Canecas
Capas para celular
Sacos de compras
Almofadas
Ferramentas de desenho
Merch Designer
Novo!
Mockup Generator
Gerador de Design de AI
Vetorizador
Quote Generator
T-Shirt Maker (Antigo)
Ajuda
Merch Digest
Blog
Centro de Ajuda
Saiba mais sobre o Merch
Feedback
Soluções Corporativas
Empresa
Acesso à API
Estúdio de Design
Design em Lote
PLANOS
PSD Templates
graficos
3308 Designs de Camisetas e Mockups PSD de graficos
Baixar designs de camisetas ou mockups PSD editáveis de graficos
Relacionado:
graficos vetoriais
,
desenhos graficos de ações
,
graficos tridimensionais
Ordenar por
Mais relevante
Resultados patrocinados da
Ganhe 15% de desconto com o código: VEXELS15
veja mais detalhes
Pronto para imprimir
para Merch
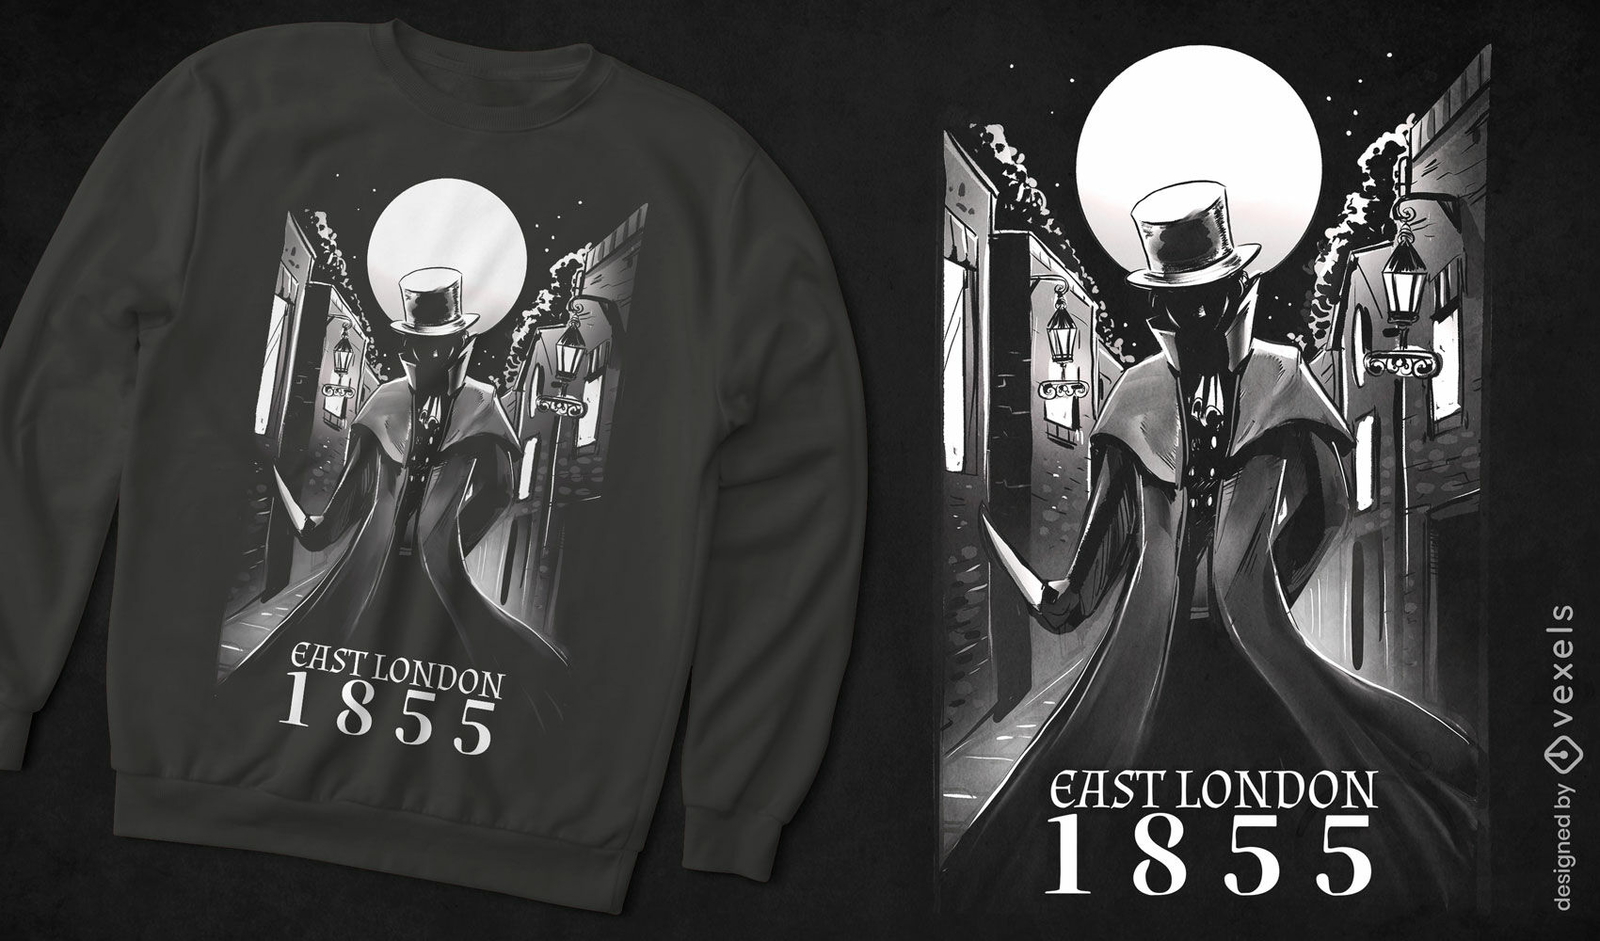
Design de camiseta com ilustração de Jack, o Estripador
Escolha uma pasta
Todos os favoritos
Criar novo
Salvar
Design de camiseta com ilustração de Jack, o Estripador
Pronto para imprimir
para Merch
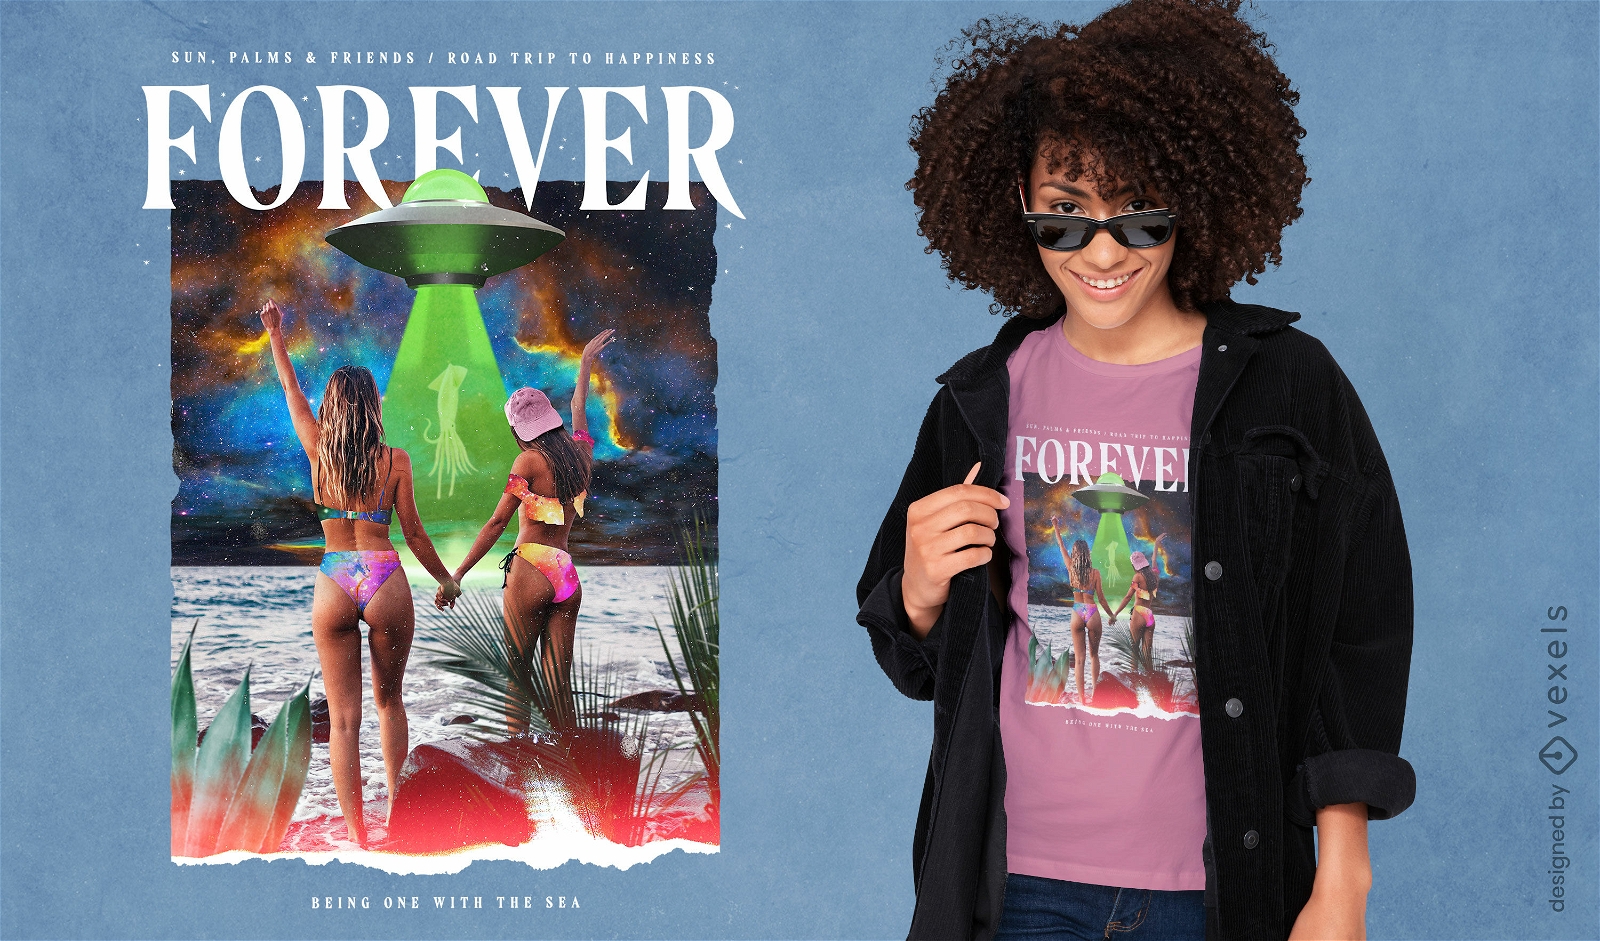
Meninas em colagem de praia com design de camisetas em psd
Escolha uma pasta
Todos os favoritos
Criar novo
Salvar
Meninas em colagem de praia com design de camisetas em psd
Pronto para imprimir
para Merch
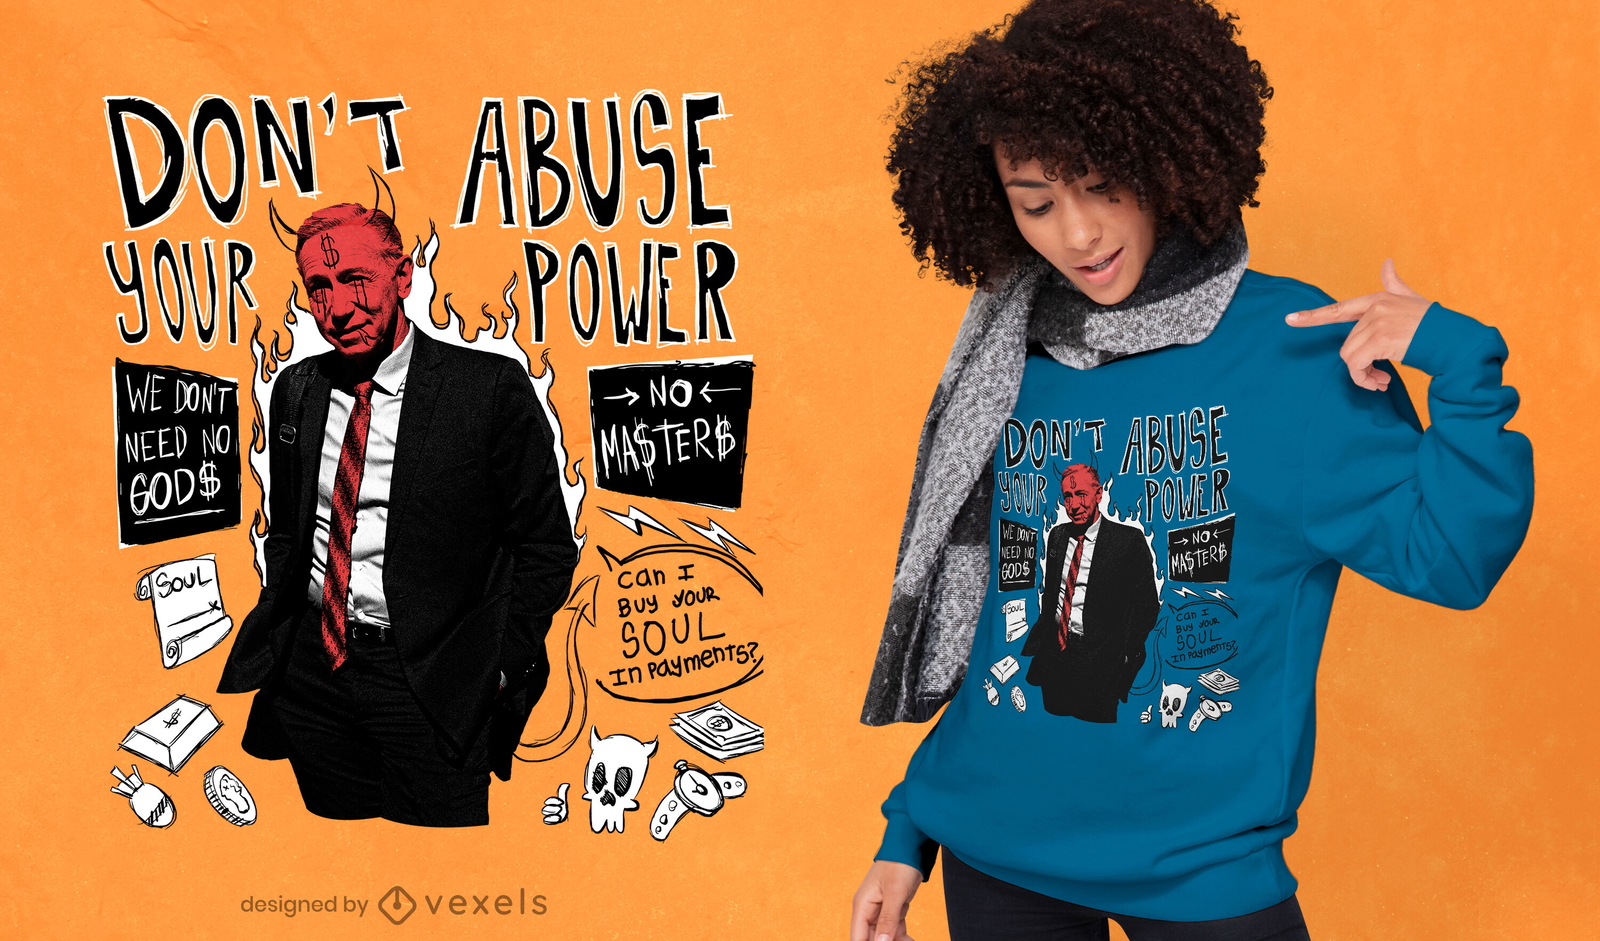
Design de t-shirt psd do chefe demônio
Escolha uma pasta
Todos os favoritos
Criar novo
Salvar
Design de t-shirt psd do chefe demônio
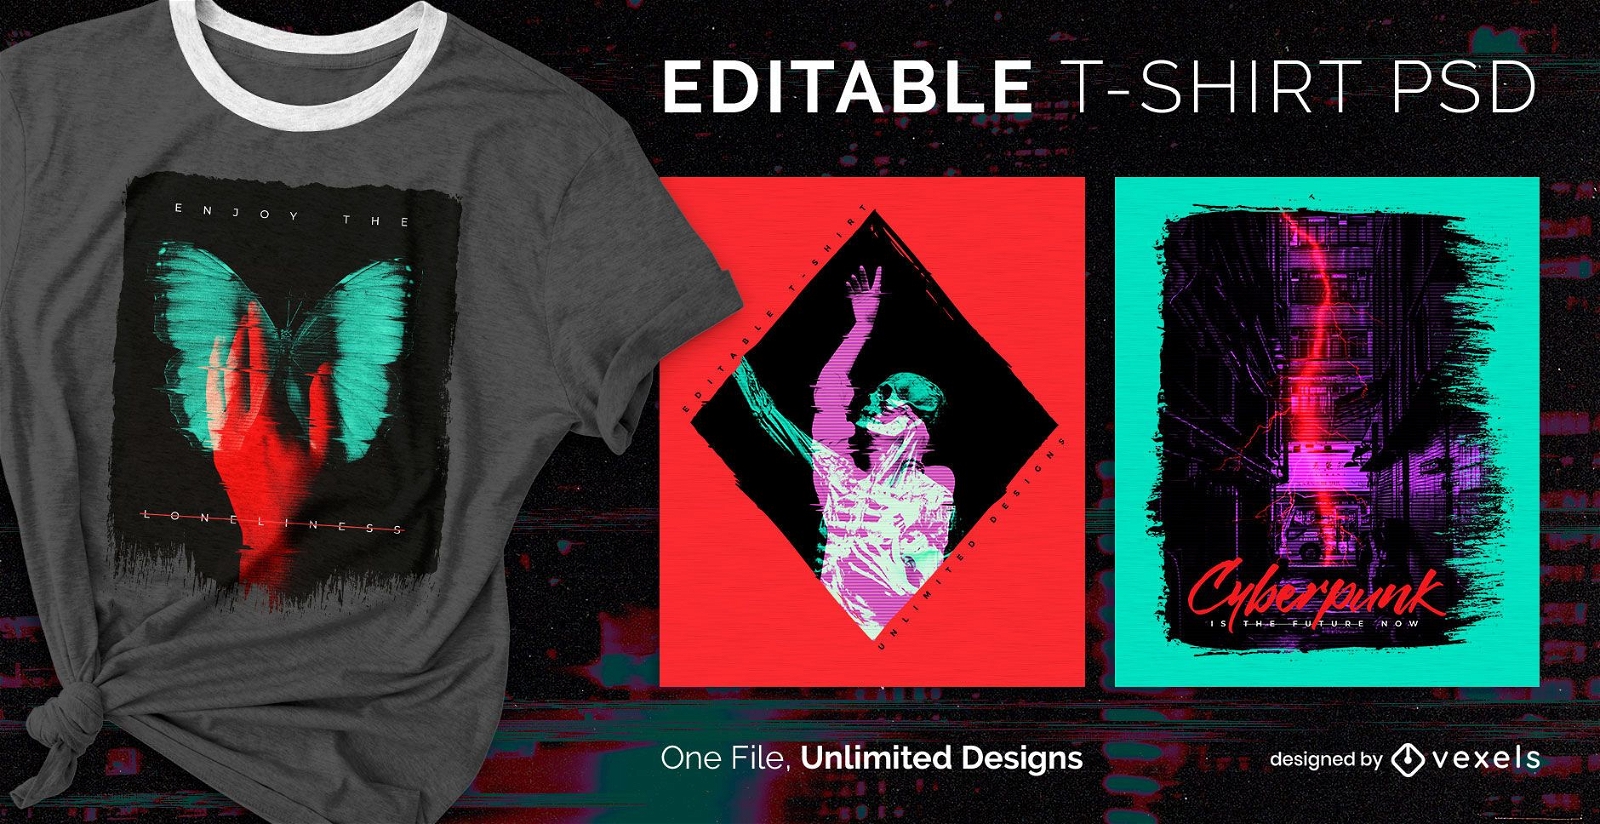
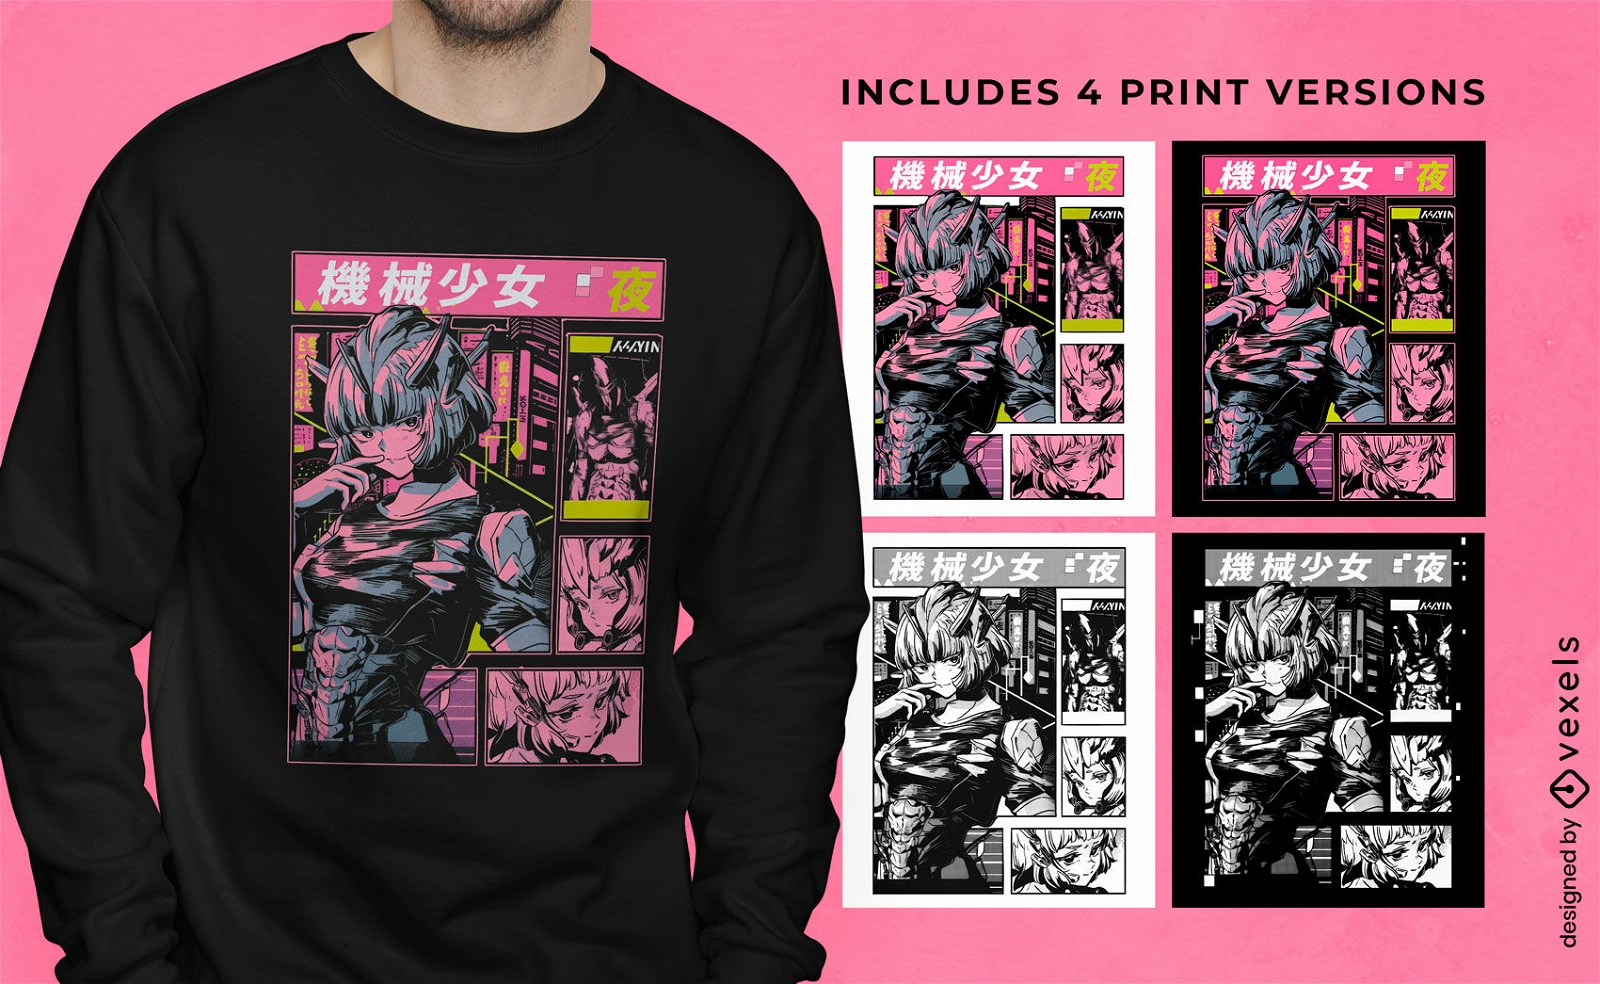
Camiseta PSD escalável
para Merch
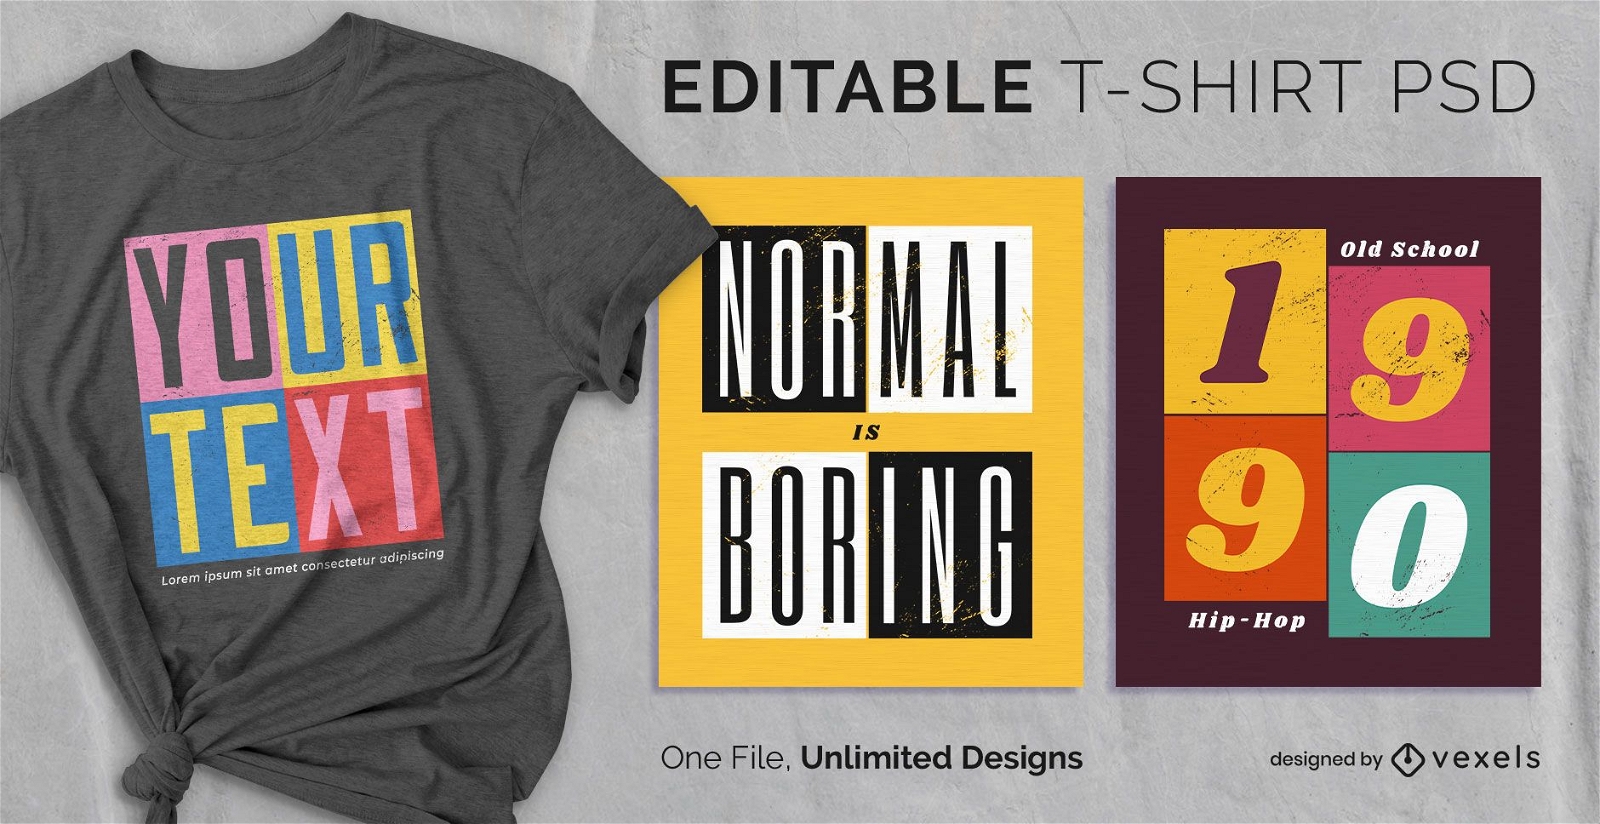
Painéis quadrados escaláveis t-shirt psd
Escolha uma pasta
Todos os favoritos
Criar novo
Salvar
Painéis quadrados escaláveis t-shirt psd
texto editável
Pronto para imprimir
para Merch
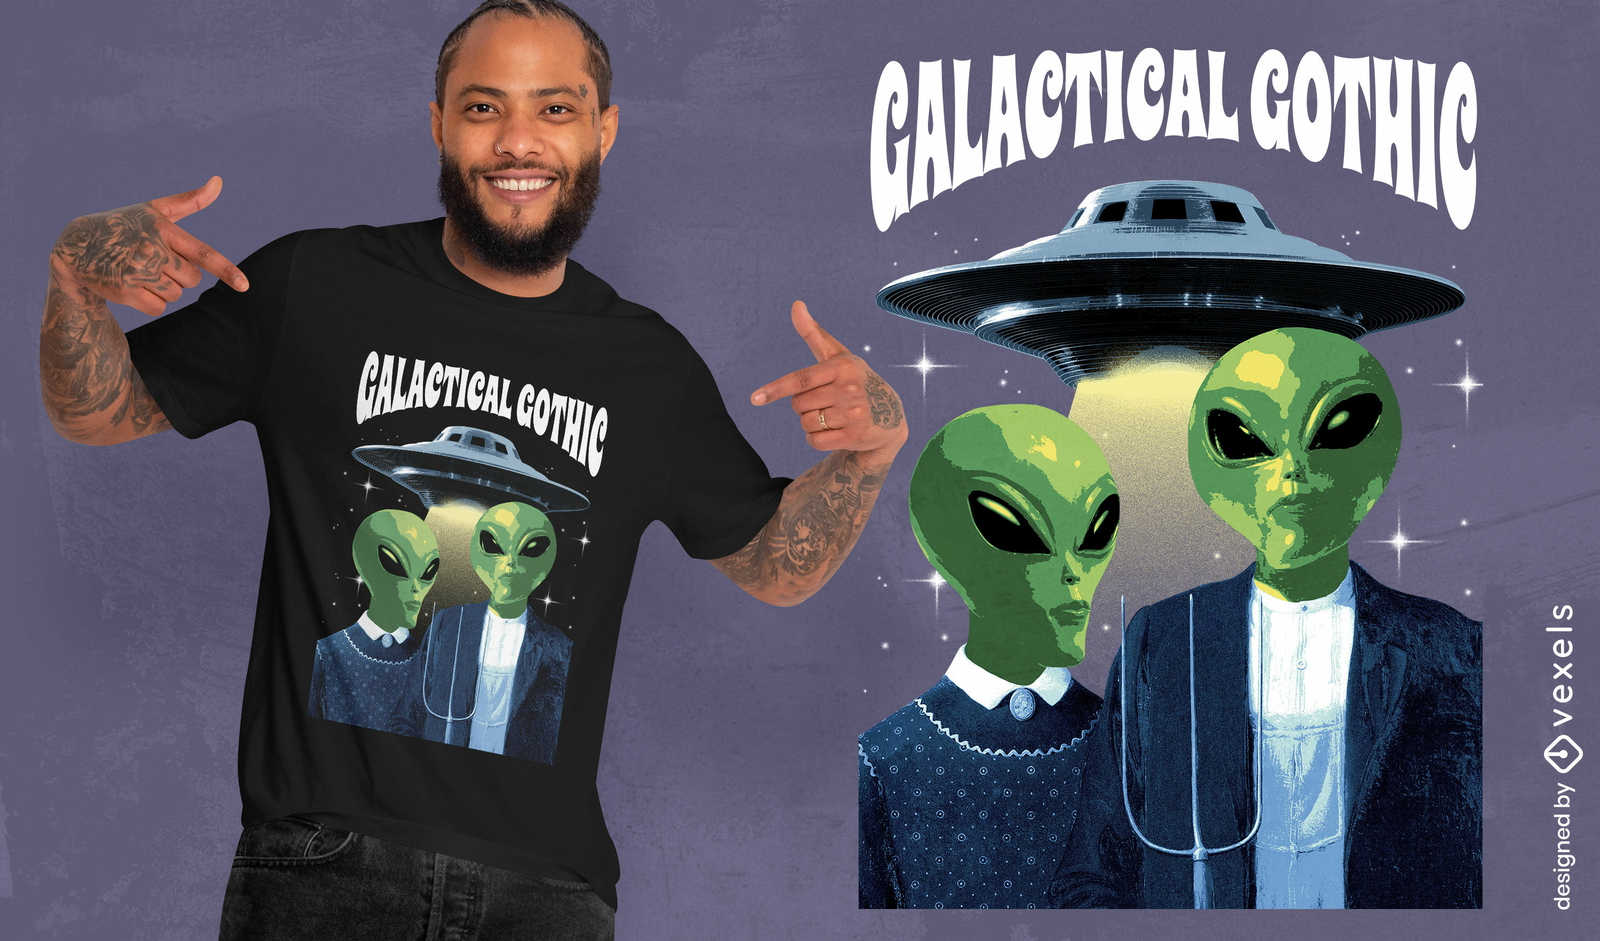
Casal alienígena e camiseta psd da nave espacial
Escolha uma pasta
Todos os favoritos
Criar novo
Salvar
Casal alienígena e camiseta psd da nave espacial
texto editável
Pronto para imprimir
para Merch
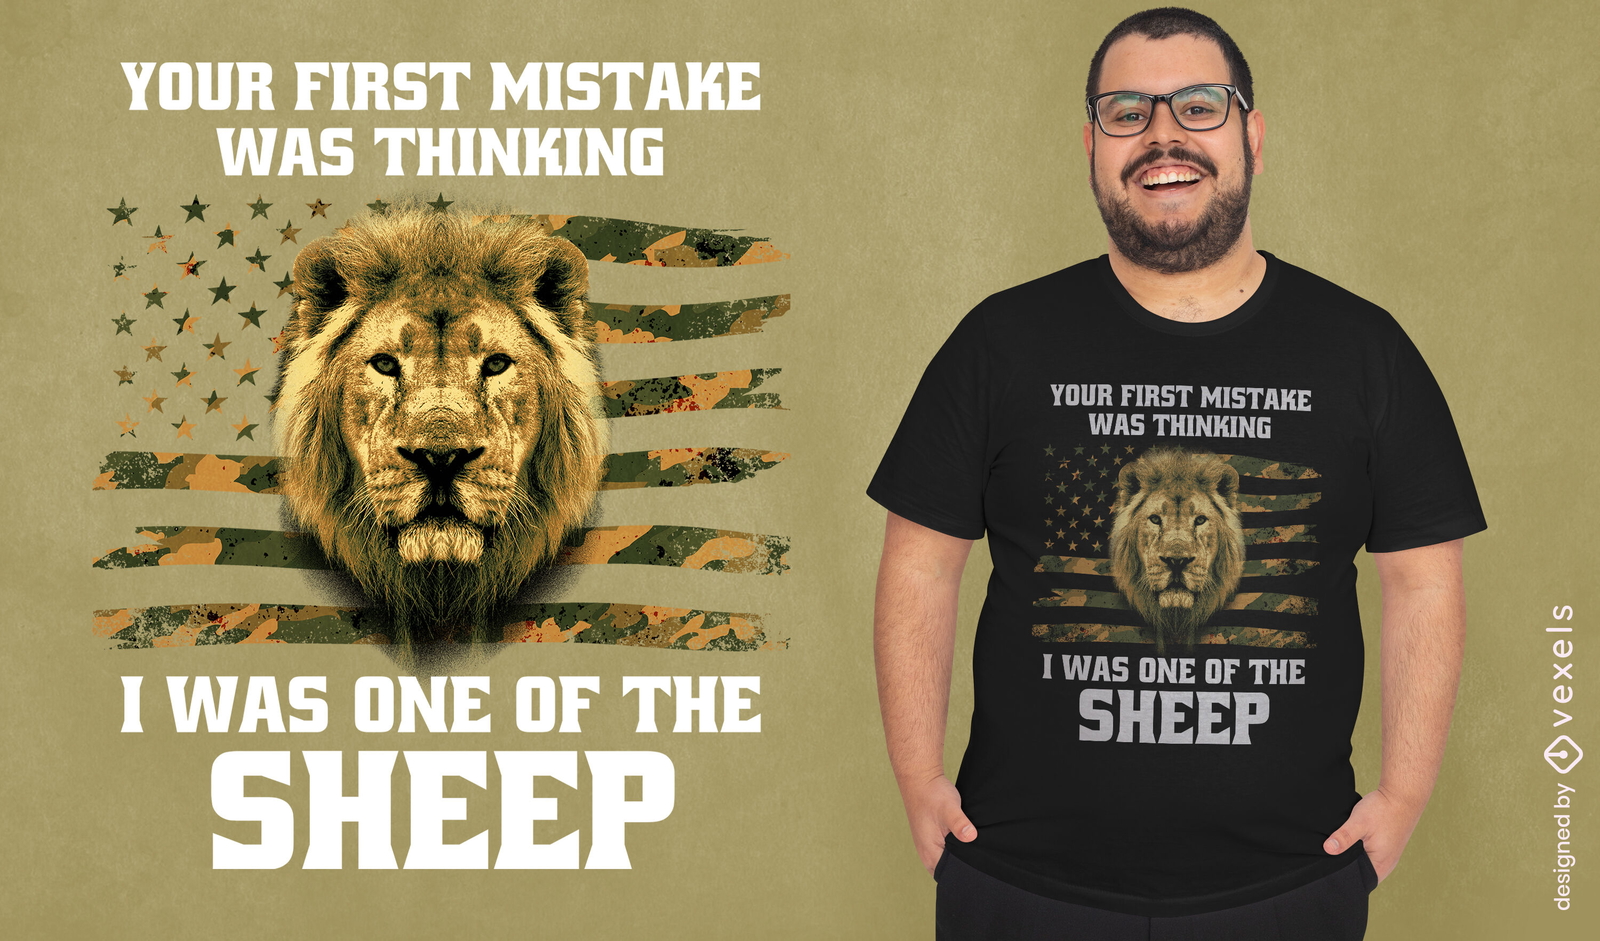
Bandeira dos EUA e design de camiseta de leão
Escolha uma pasta
Todos os favoritos
Criar novo
Salvar
Bandeira dos EUA e design de camiseta de leão
Pronto para imprimir
para Merch
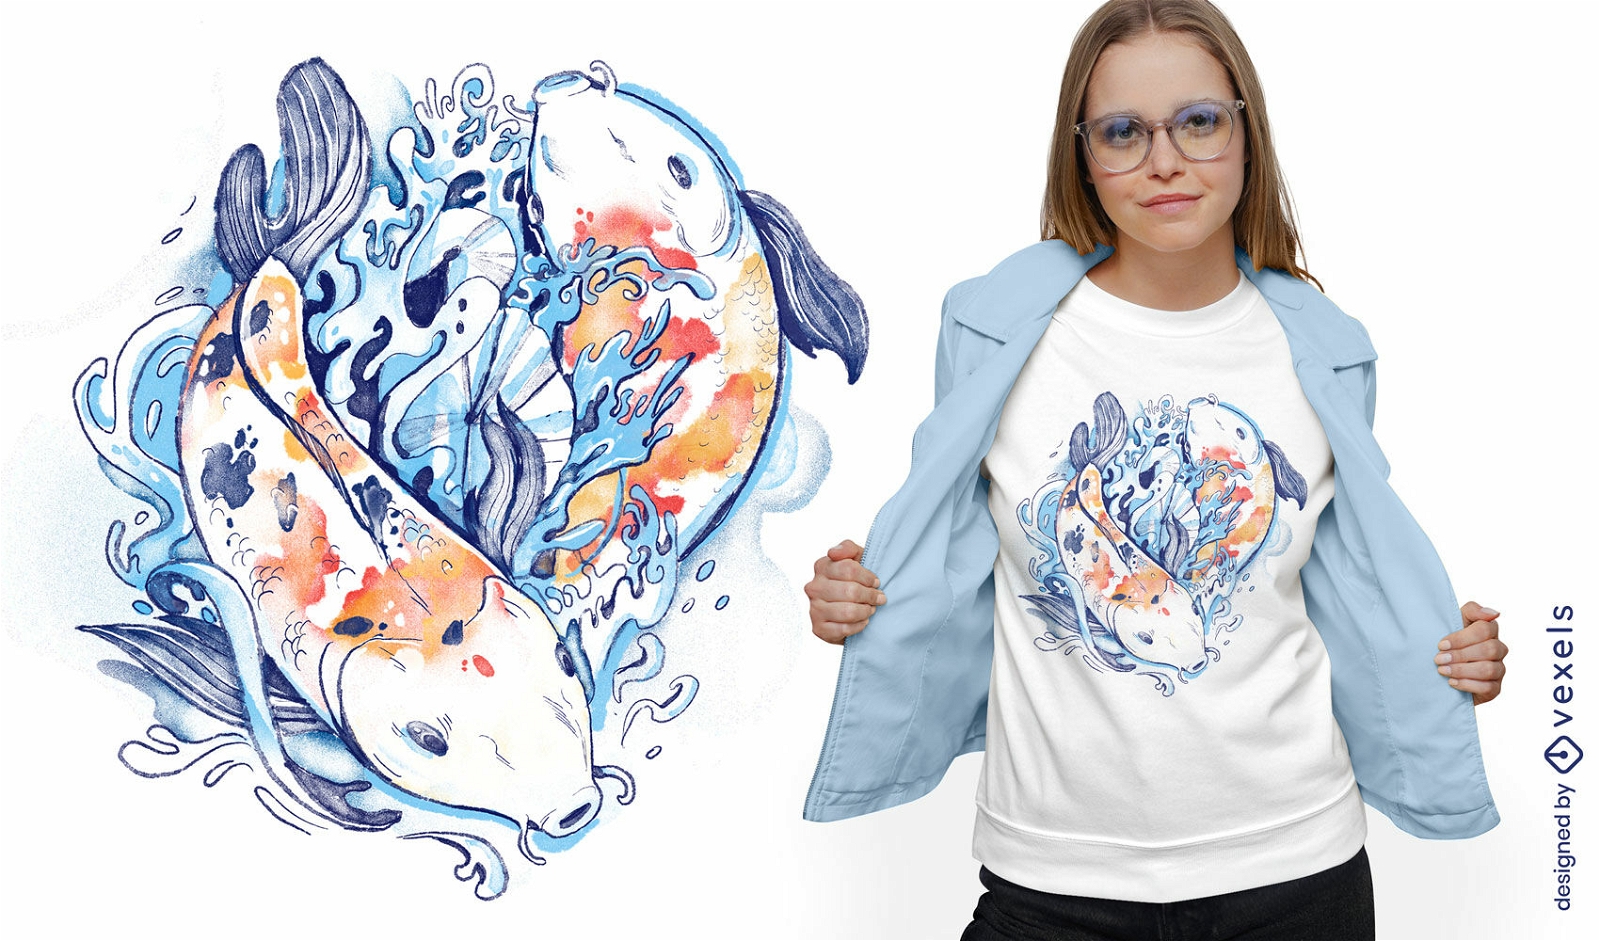
Design de camiseta de peixe aquarela yin yang koi
Escolha uma pasta
Todos os favoritos
Criar novo
Salvar
Design de camiseta de peixe aquarela yin yang koi
Pronto para imprimir
para Merch
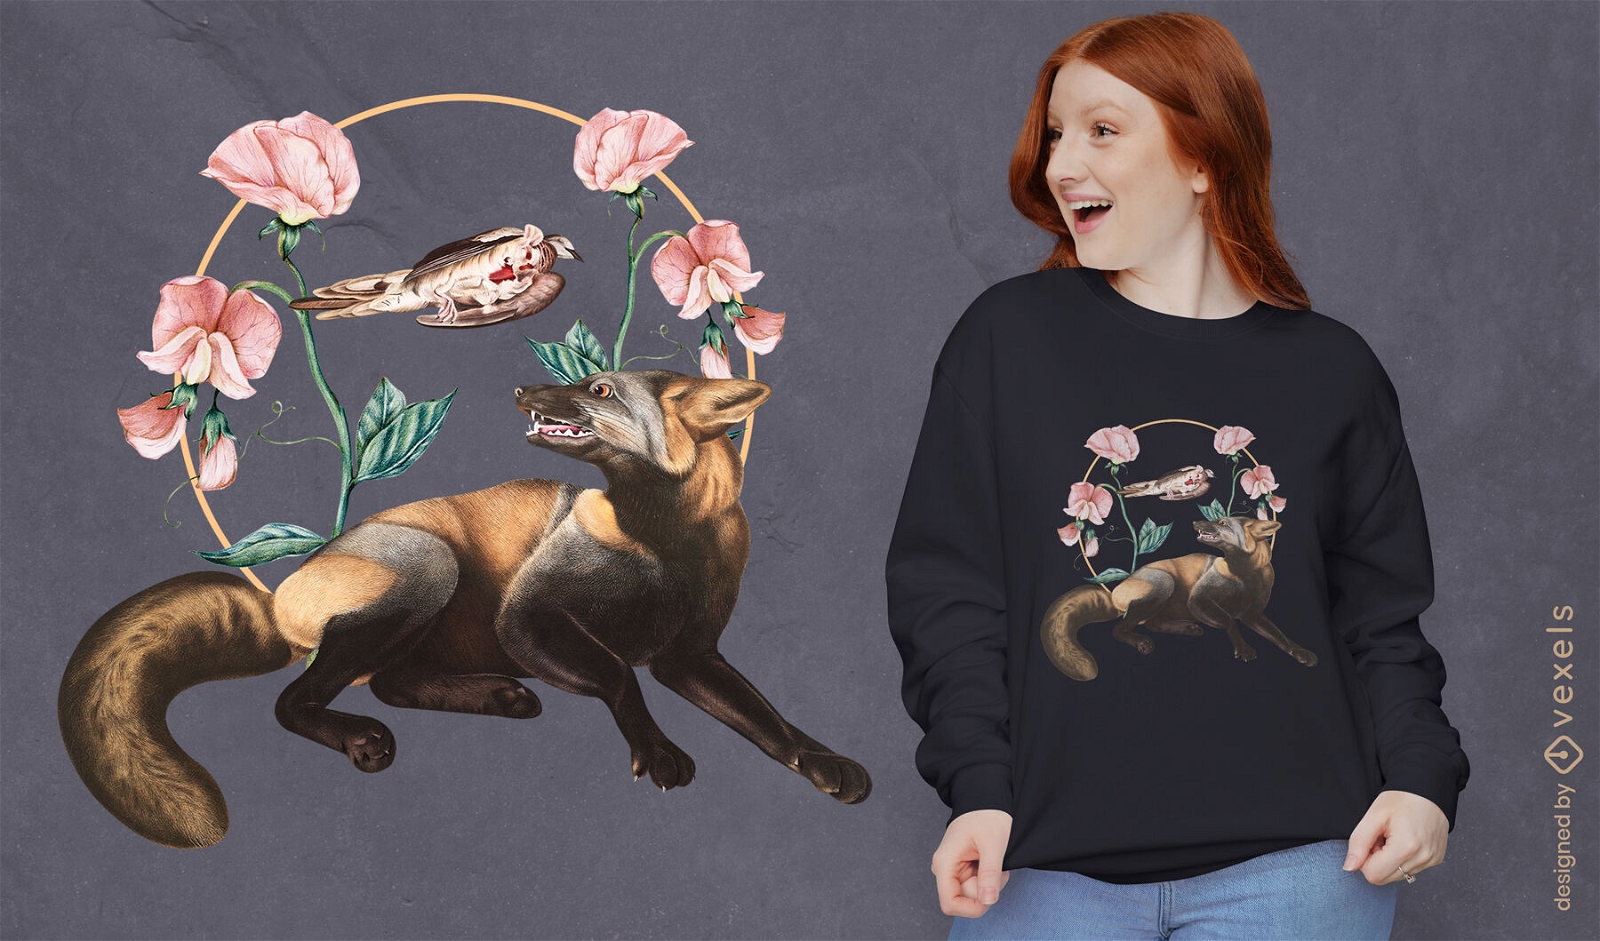
Design de camiseta de raposa escura cottagecore
Escolha uma pasta
Todos os favoritos
Criar novo
Salvar
Design de camiseta de raposa escura cottagecore
Pronto para imprimir
para Merch
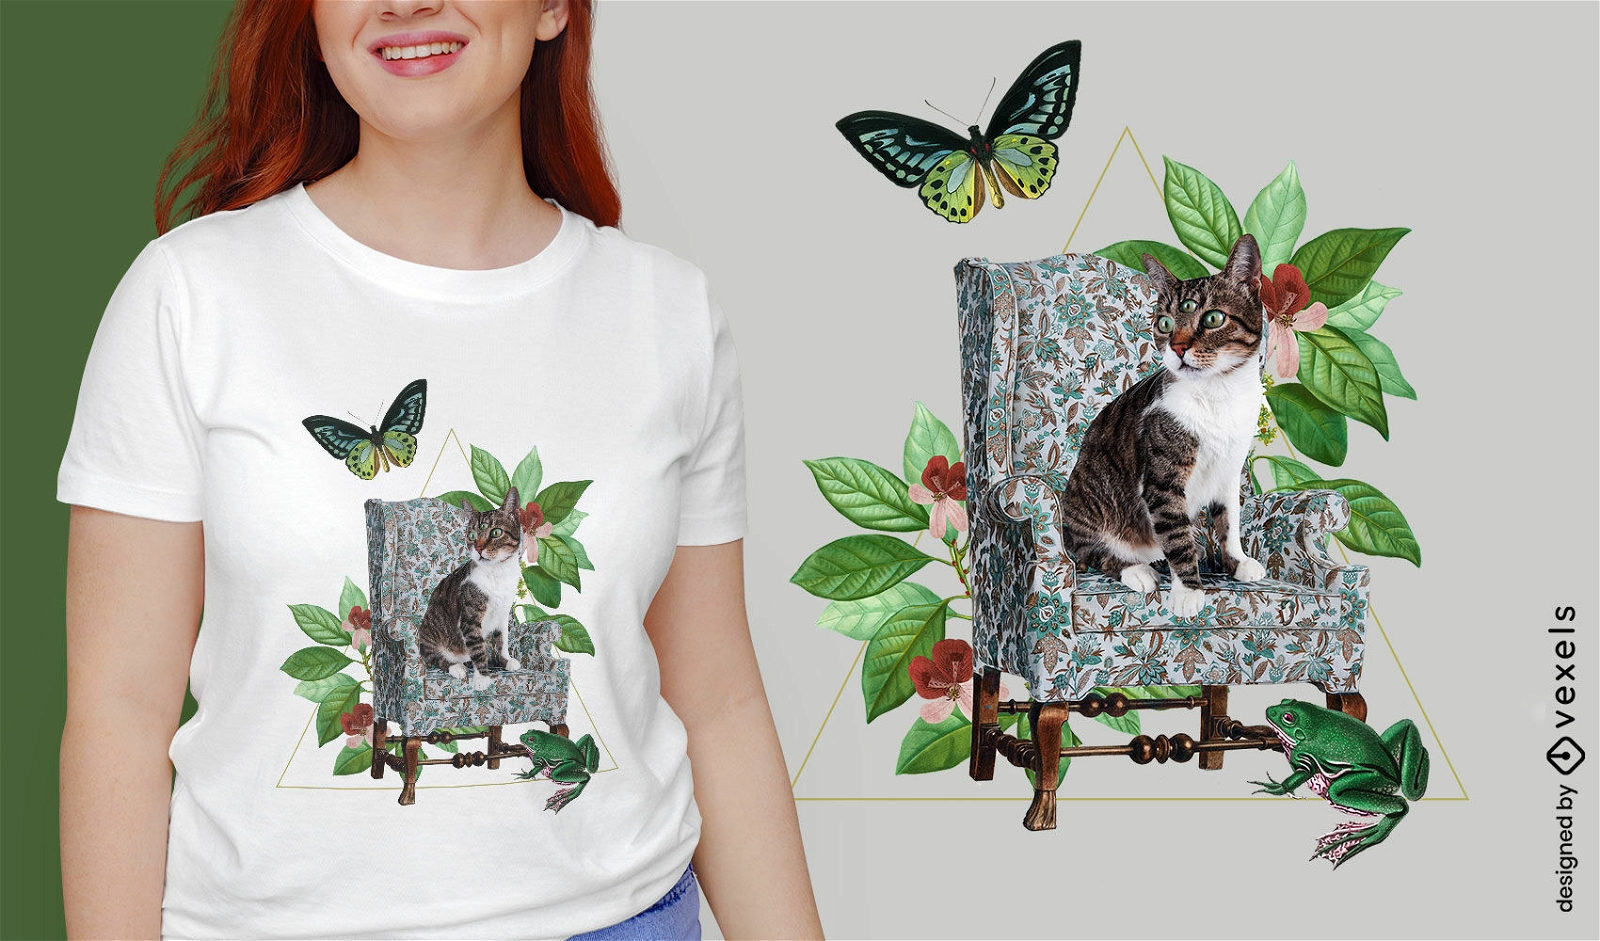
Design de camiseta psd de natureza absurda de gatos e plantas
Escolha uma pasta
Todos os favoritos
Criar novo
Salvar
Design de camiseta psd de natureza absurda de gatos e plantas
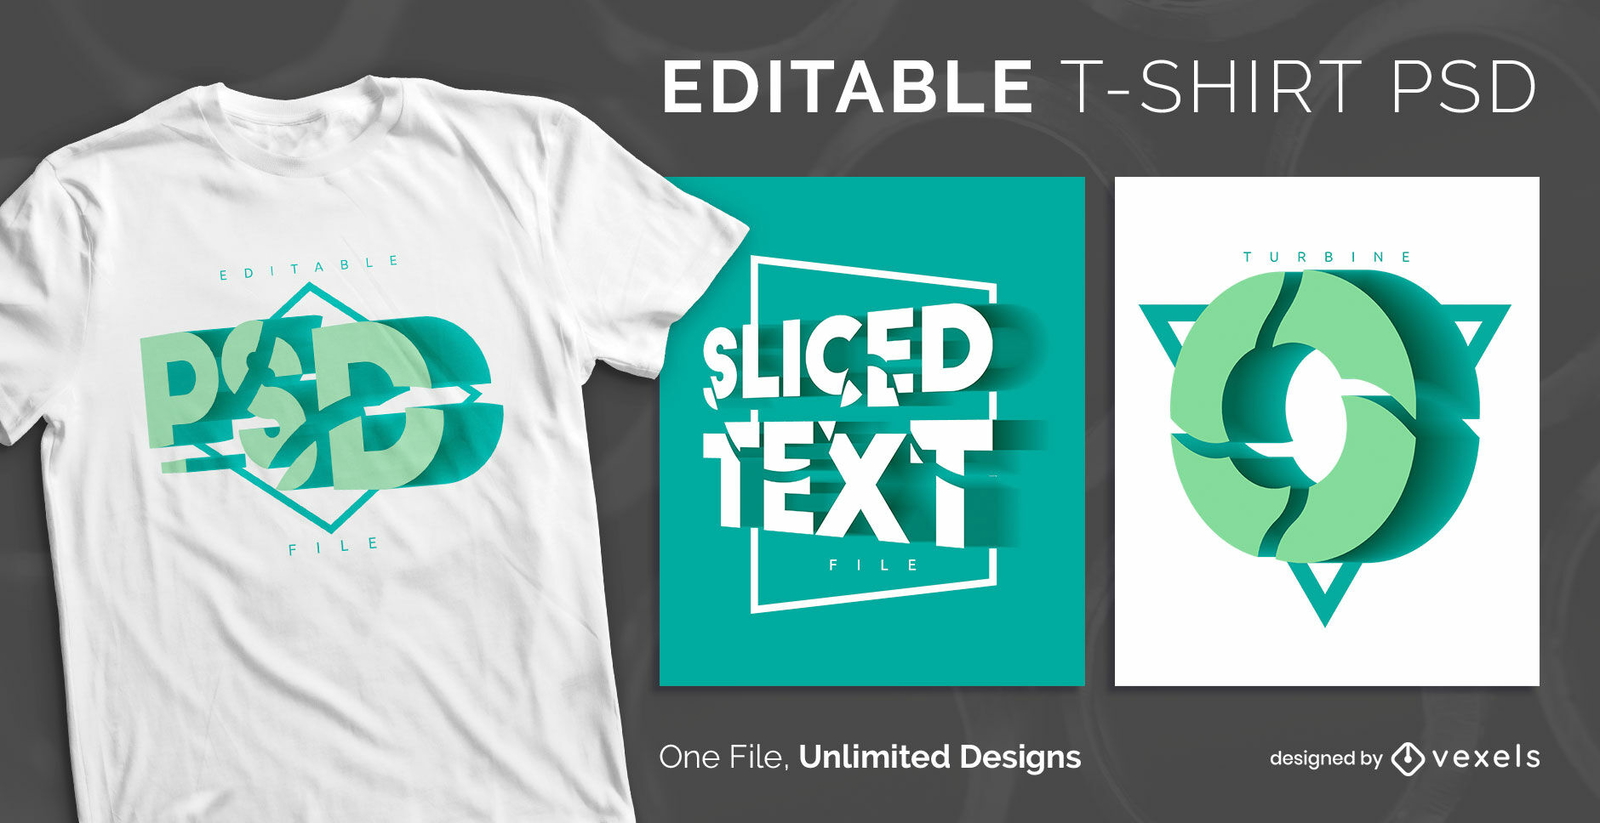
texto editável
para Merch
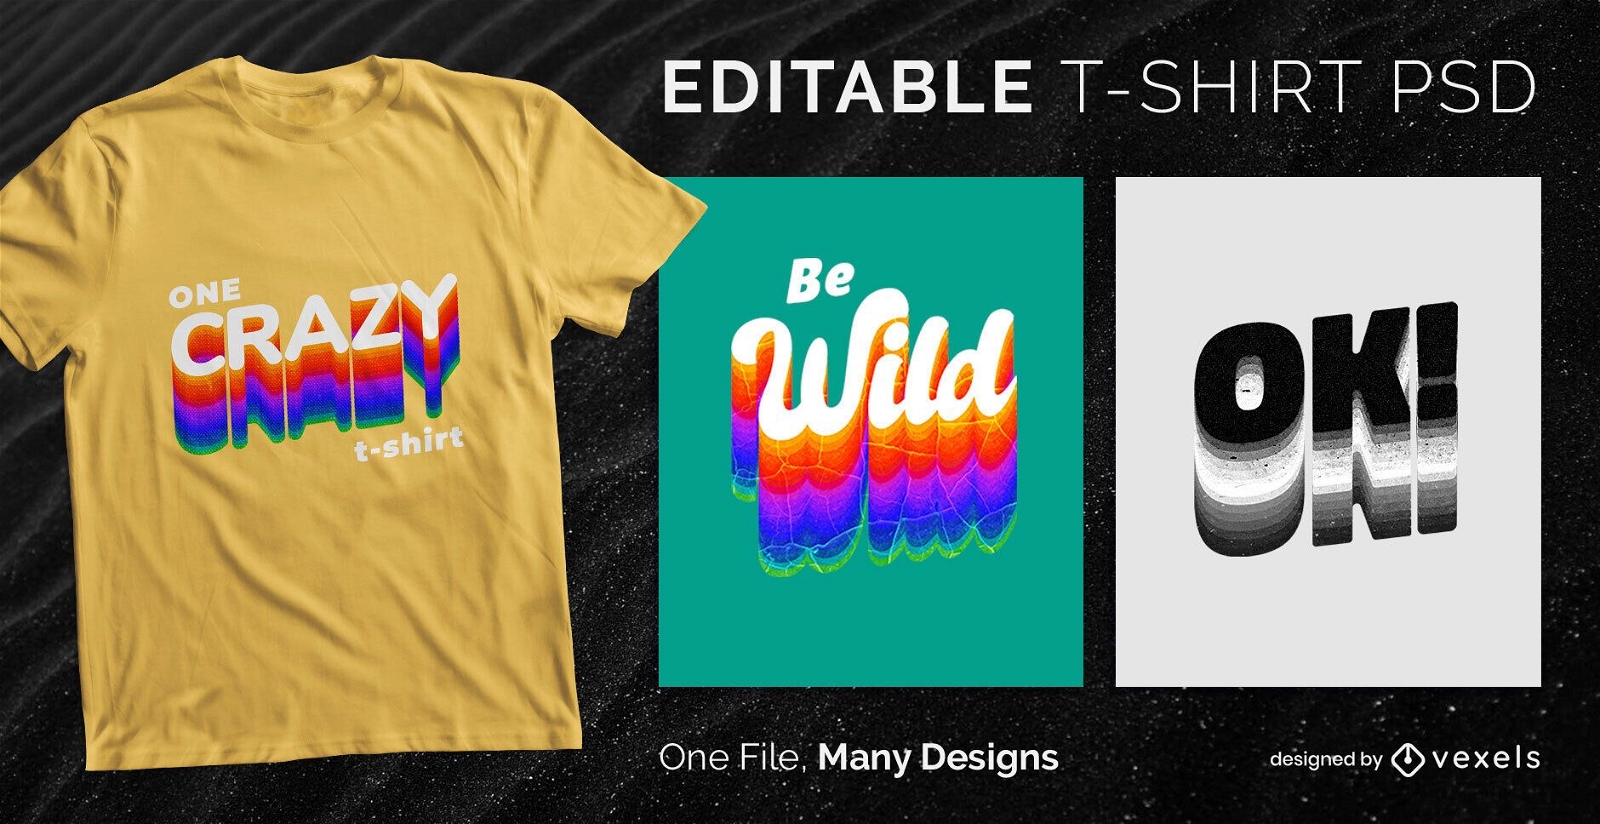
T-shirt escalável de textos em fatias 3D psd
Escolha uma pasta
Todos os favoritos
Criar novo
Salvar
T-shirt escalável de textos em fatias 3D psd
Pronto para imprimir
para Merch
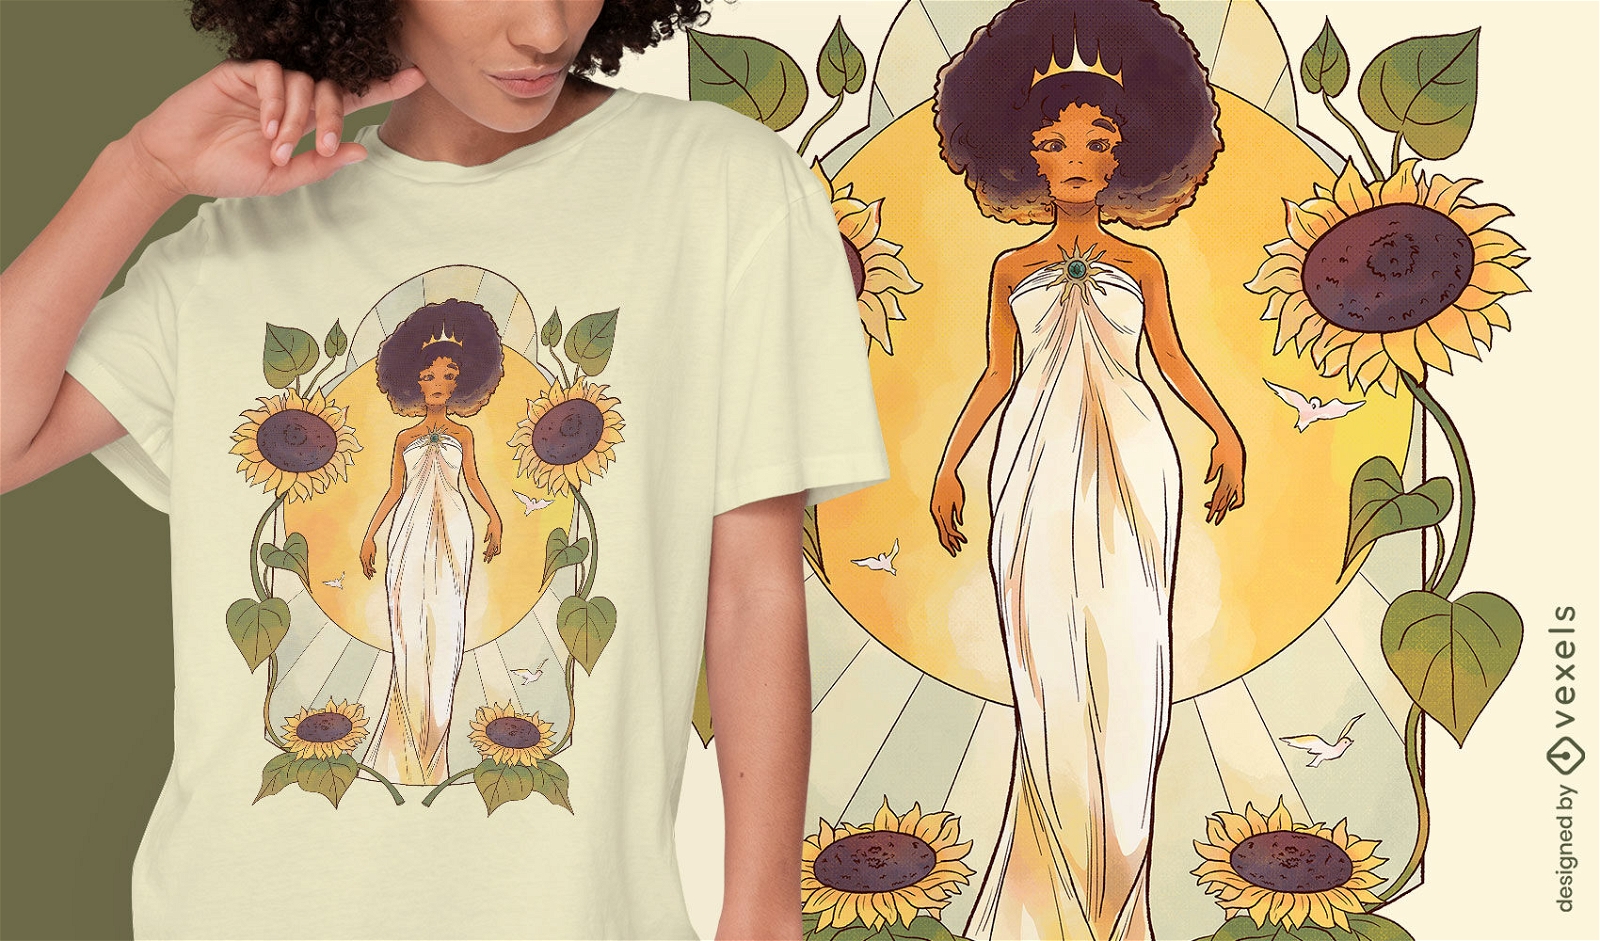
Design de camiseta de princesa girassol
Escolha uma pasta
Todos os favoritos
Criar novo
Salvar
Design de camiseta de princesa girassol
Pronto para imprimir
para Merch
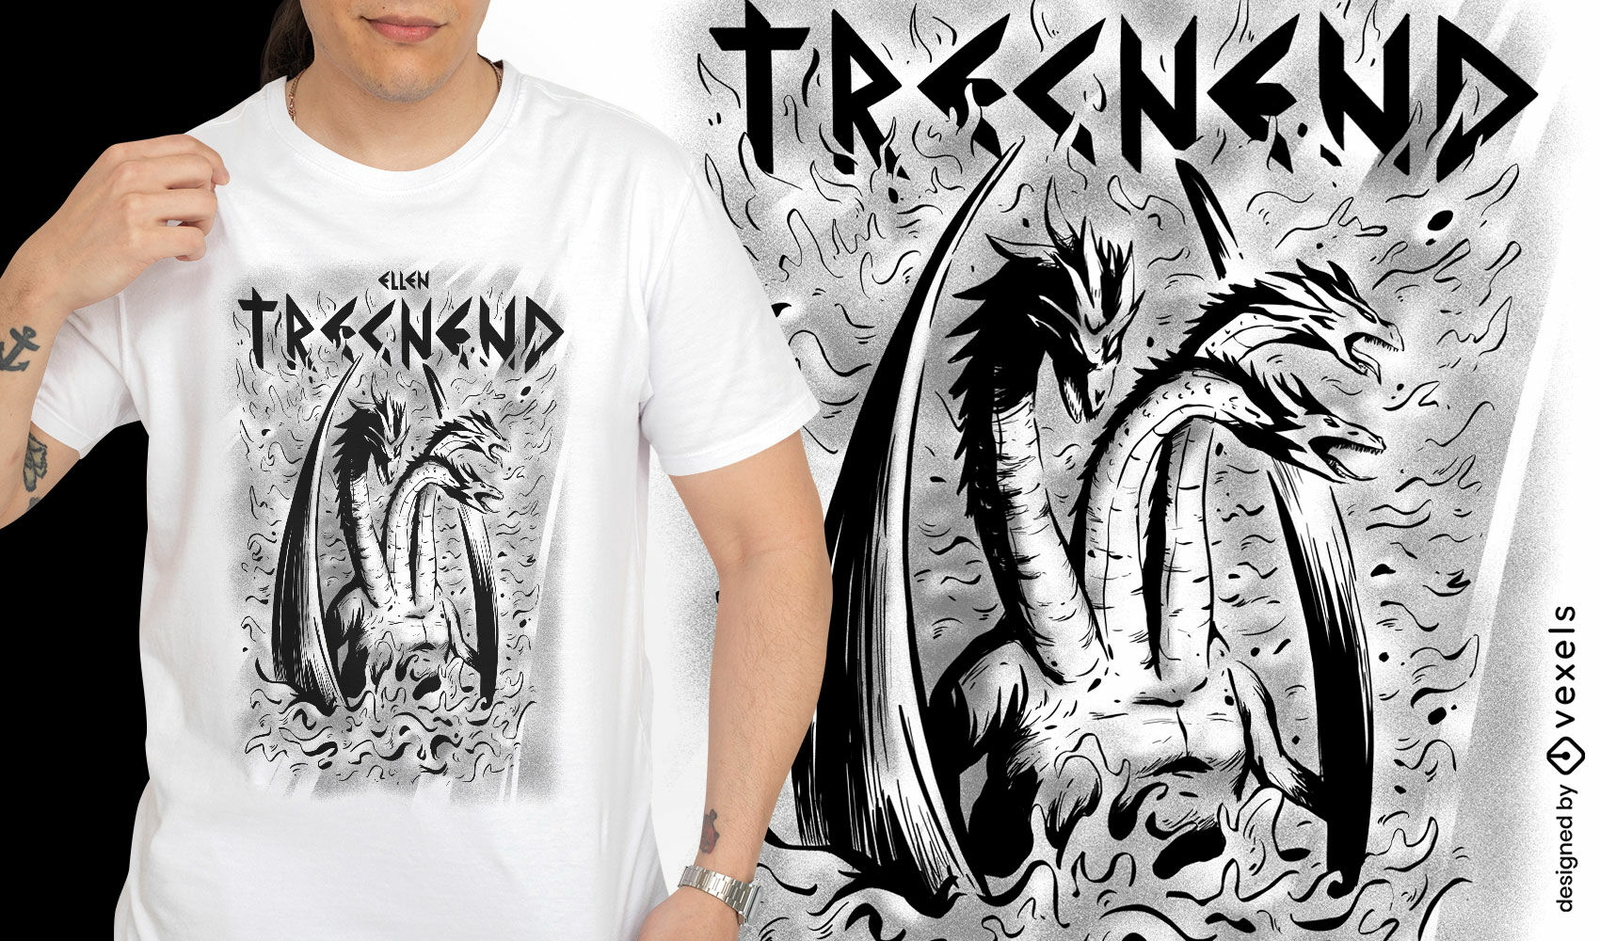
Design de camiseta de criatura de dragão celta
Escolha uma pasta
Todos os favoritos
Criar novo
Salvar
Design de camiseta de criatura de dragão celta
Pronto para imprimir
para Merch
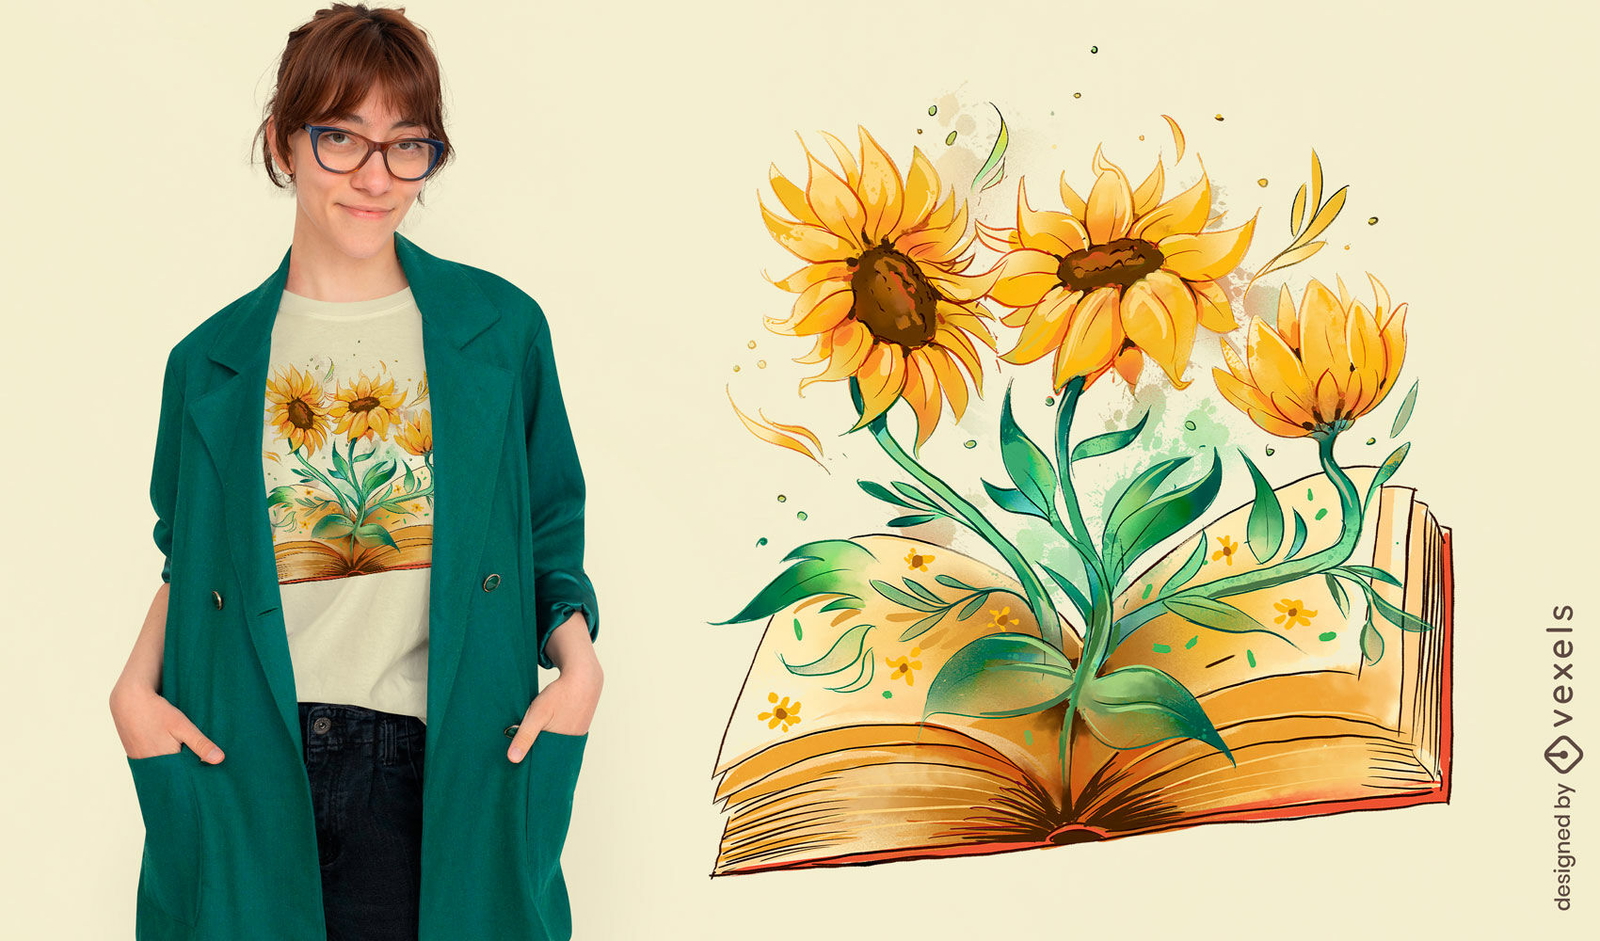
Girassóis saindo do design de camiseta de livro
Escolha uma pasta
Todos os favoritos
Criar novo
Salvar
Girassóis saindo do design de camiseta de livro
Pronto para imprimir
para Merch
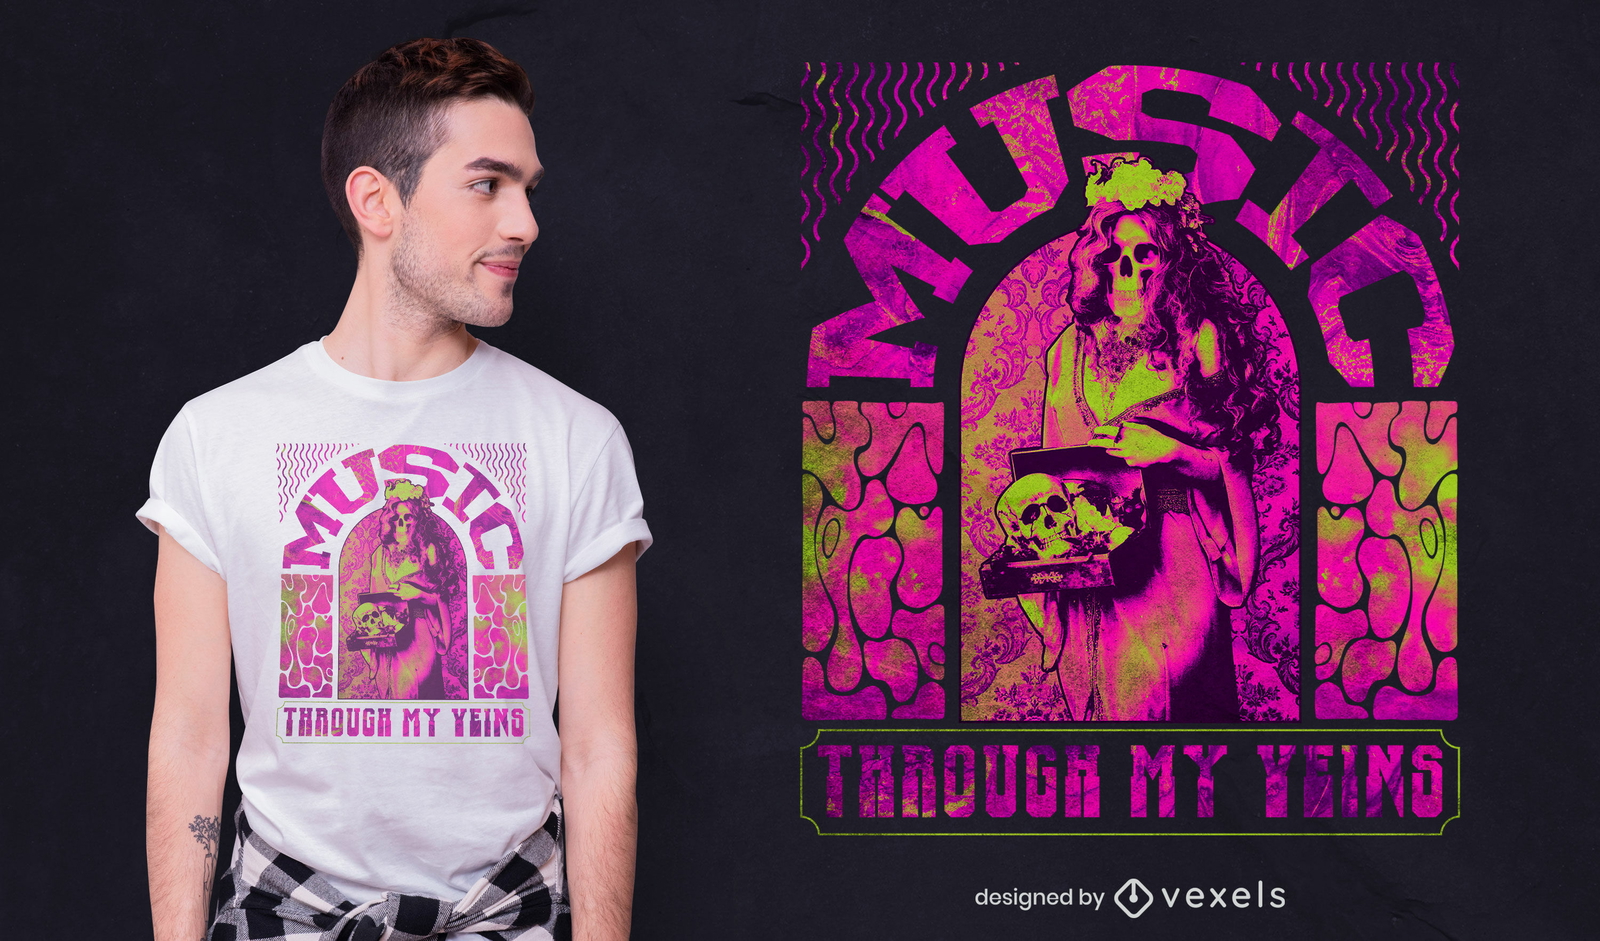
Esqueleto de menina com design psicodélico de camiseta psd
Escolha uma pasta
Todos os favoritos
Criar novo
Salvar
Esqueleto de menina com design psicodélico de camiseta psd
Pronto para imprimir
para Merch
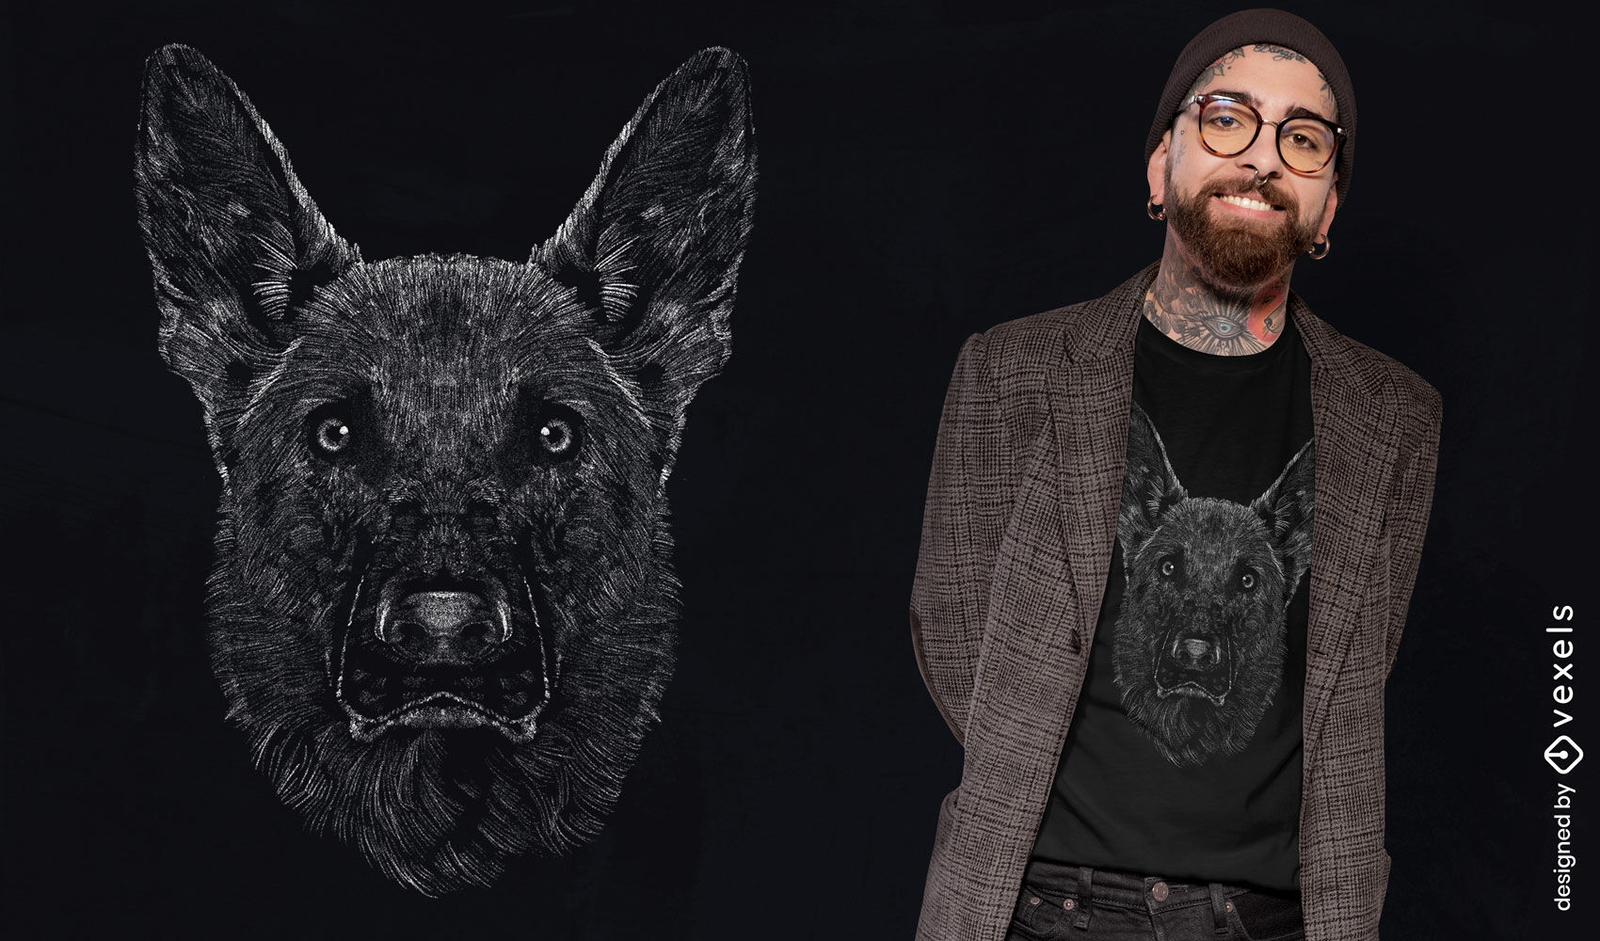
Design de camiseta de animal pastor alemão
Escolha uma pasta
Todos os favoritos
Criar novo
Salvar
Design de camiseta de animal pastor alemão
Pronto para imprimir
para Merch
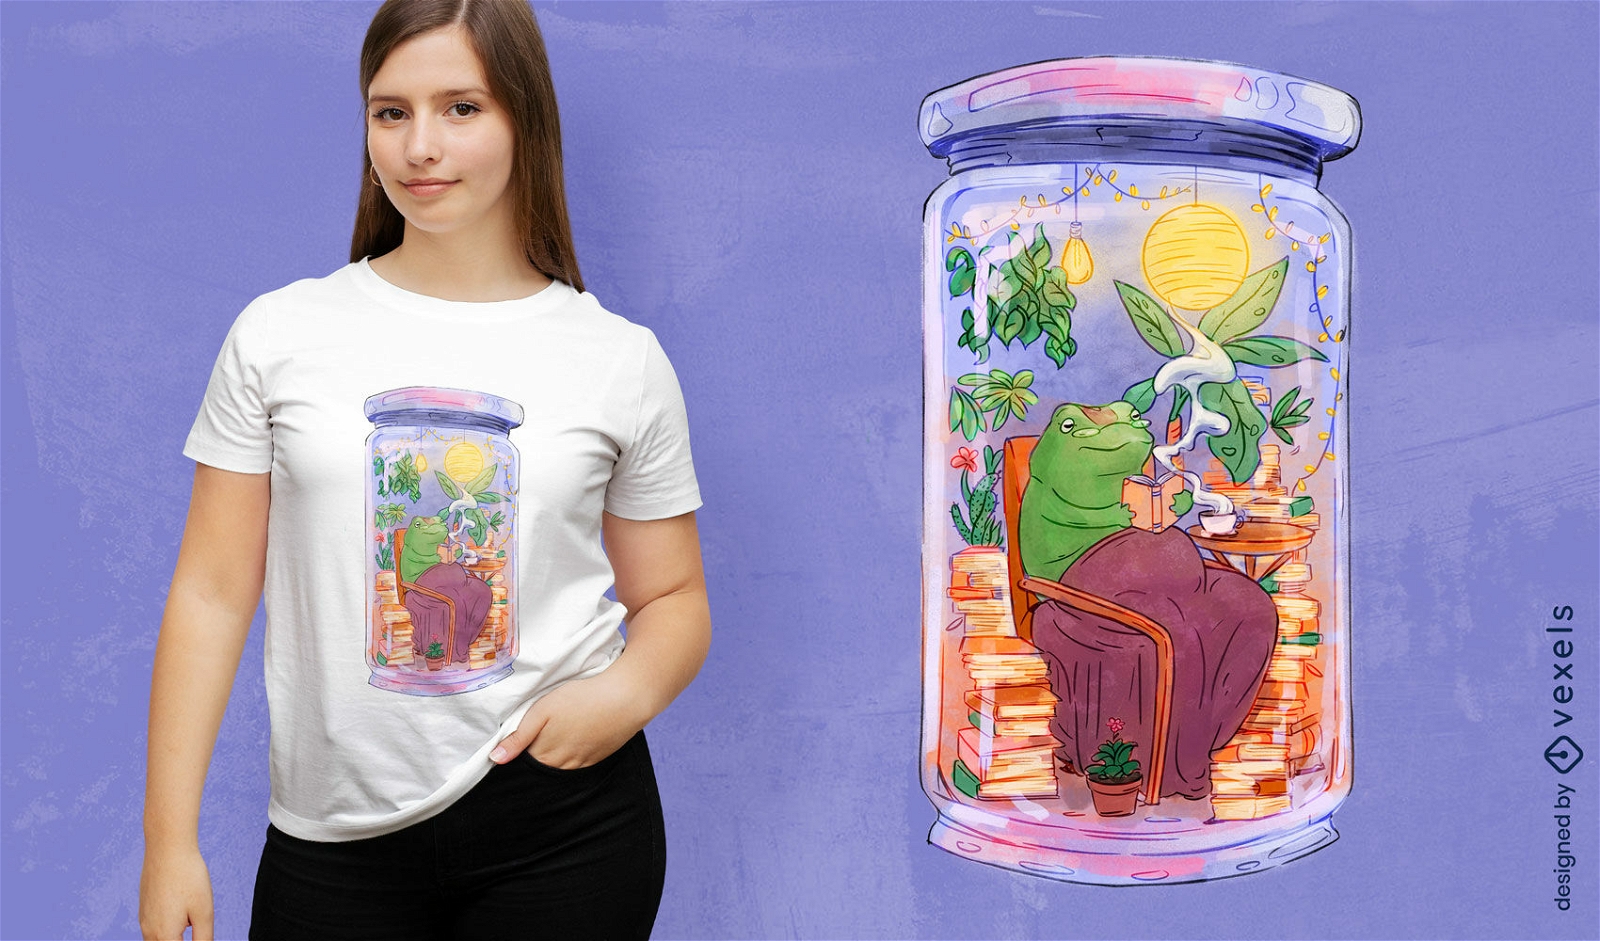
Animal sapo lendo em design de t-shirt jar
Escolha uma pasta
Todos os favoritos
Criar novo
Salvar
Animal sapo lendo em design de t-shirt jar
Pronto para imprimir
para Merch
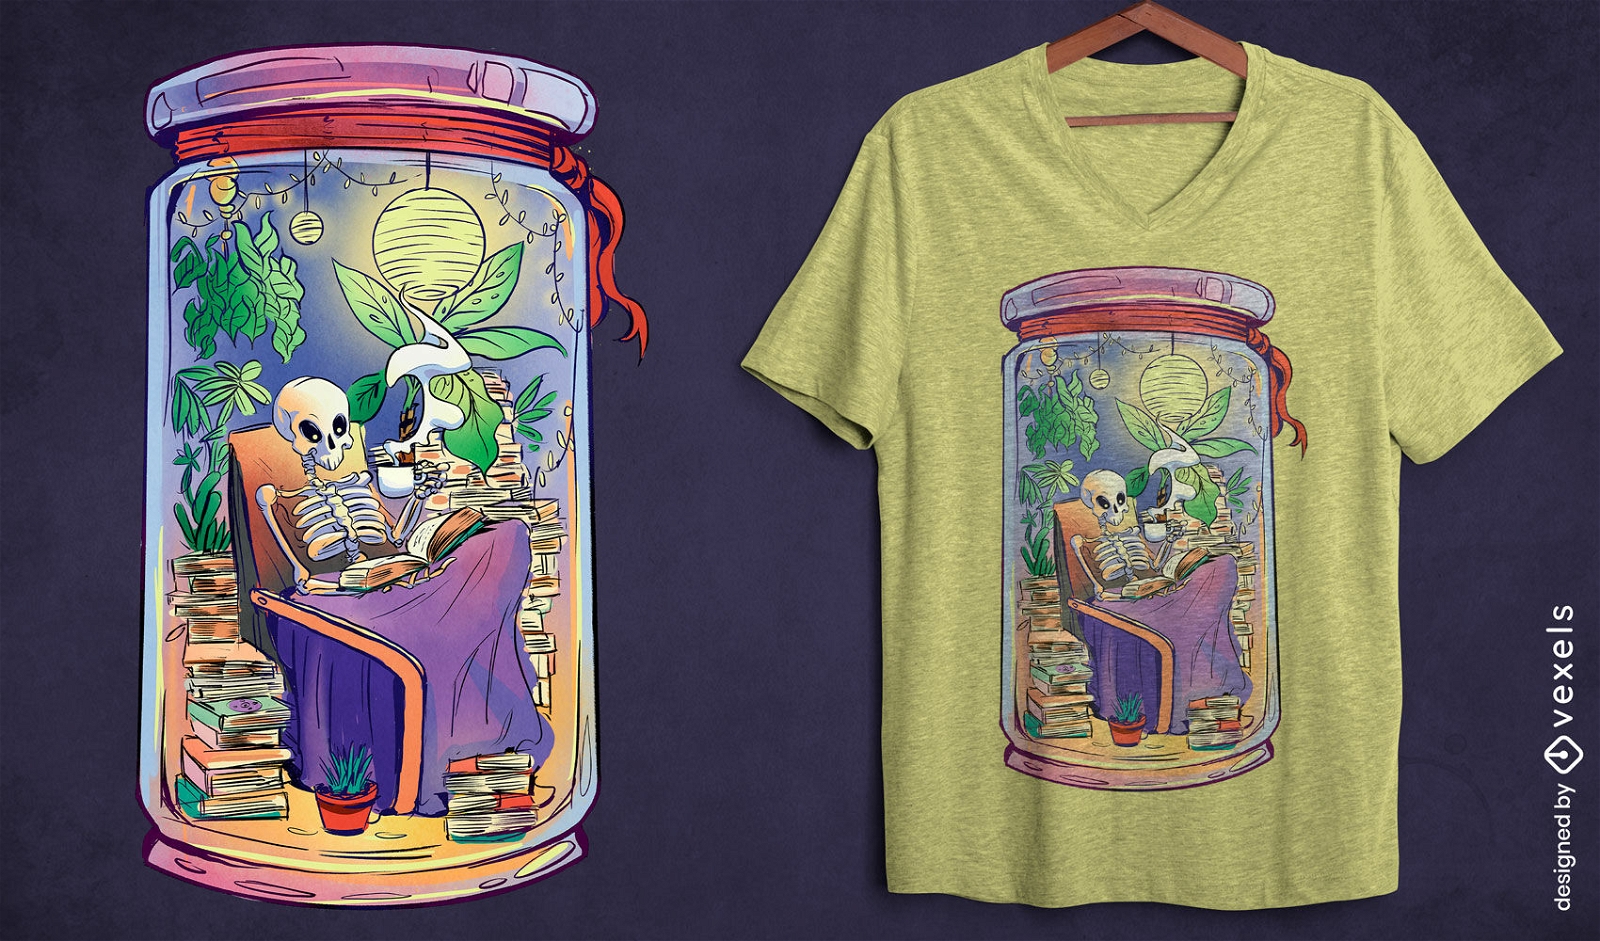
Design de camiseta de livros de leitura de esqueleto aconchegante
Escolha uma pasta
Todos os favoritos
Criar novo
Salvar
Design de camiseta de livros de leitura de esqueleto aconchegante
Pronto para imprimir
para Merch
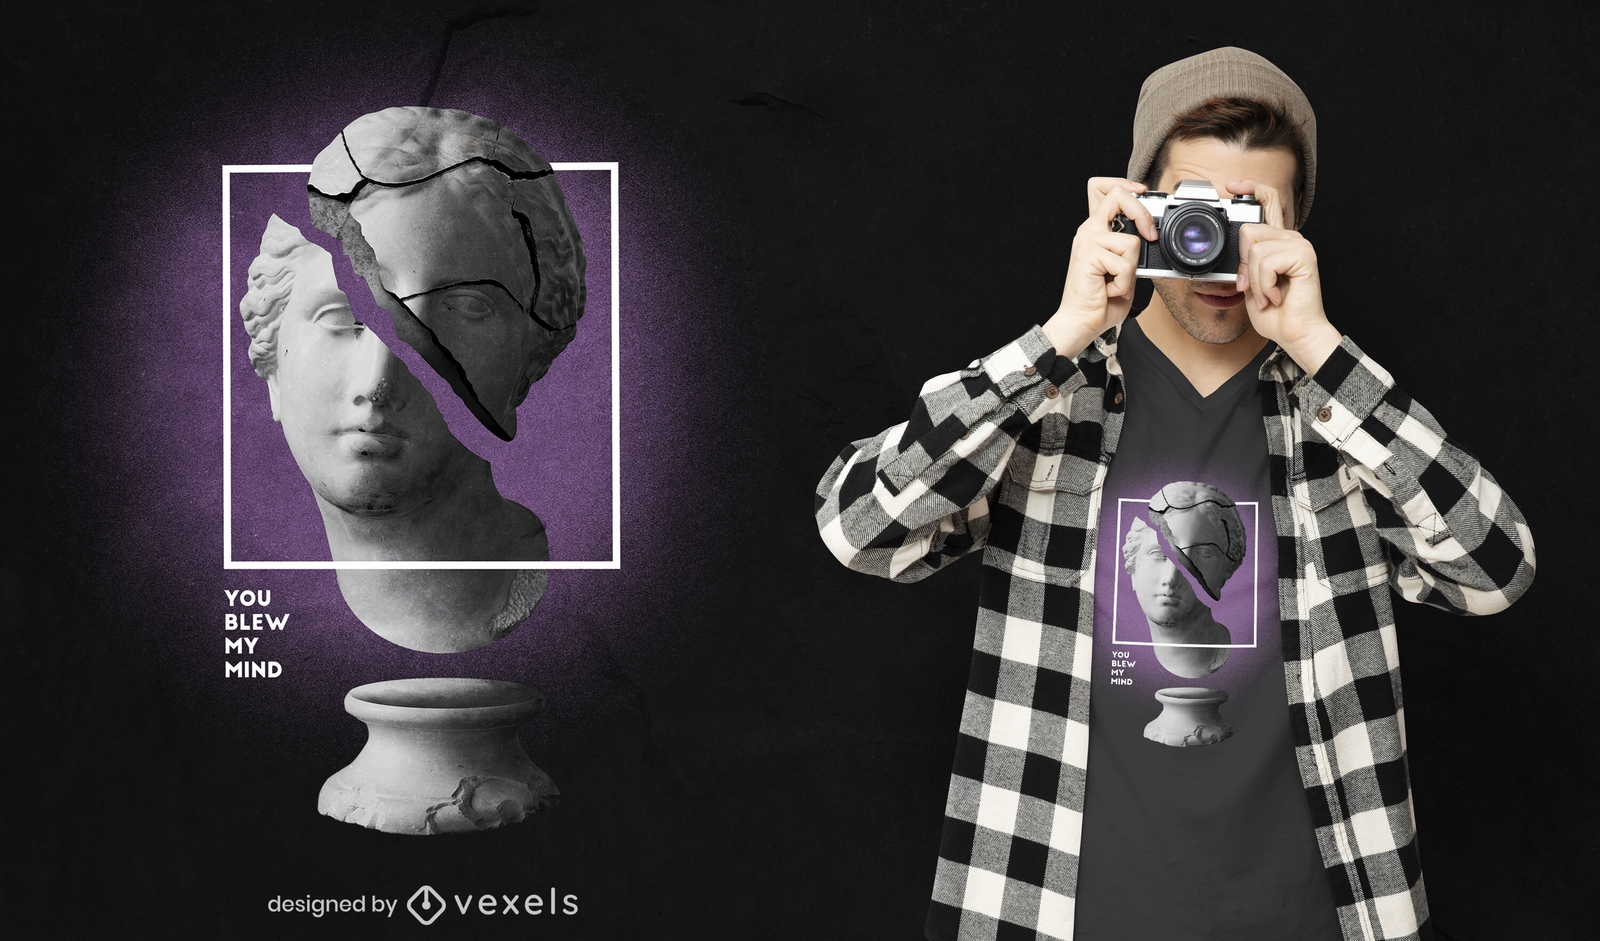
Glitch estátua citação PSD T-shirt design
Escolha uma pasta
Todos os favoritos
Criar novo
Salvar
Glitch estátua citação PSD T-shirt design
Camiseta PSD escalável
para Merch
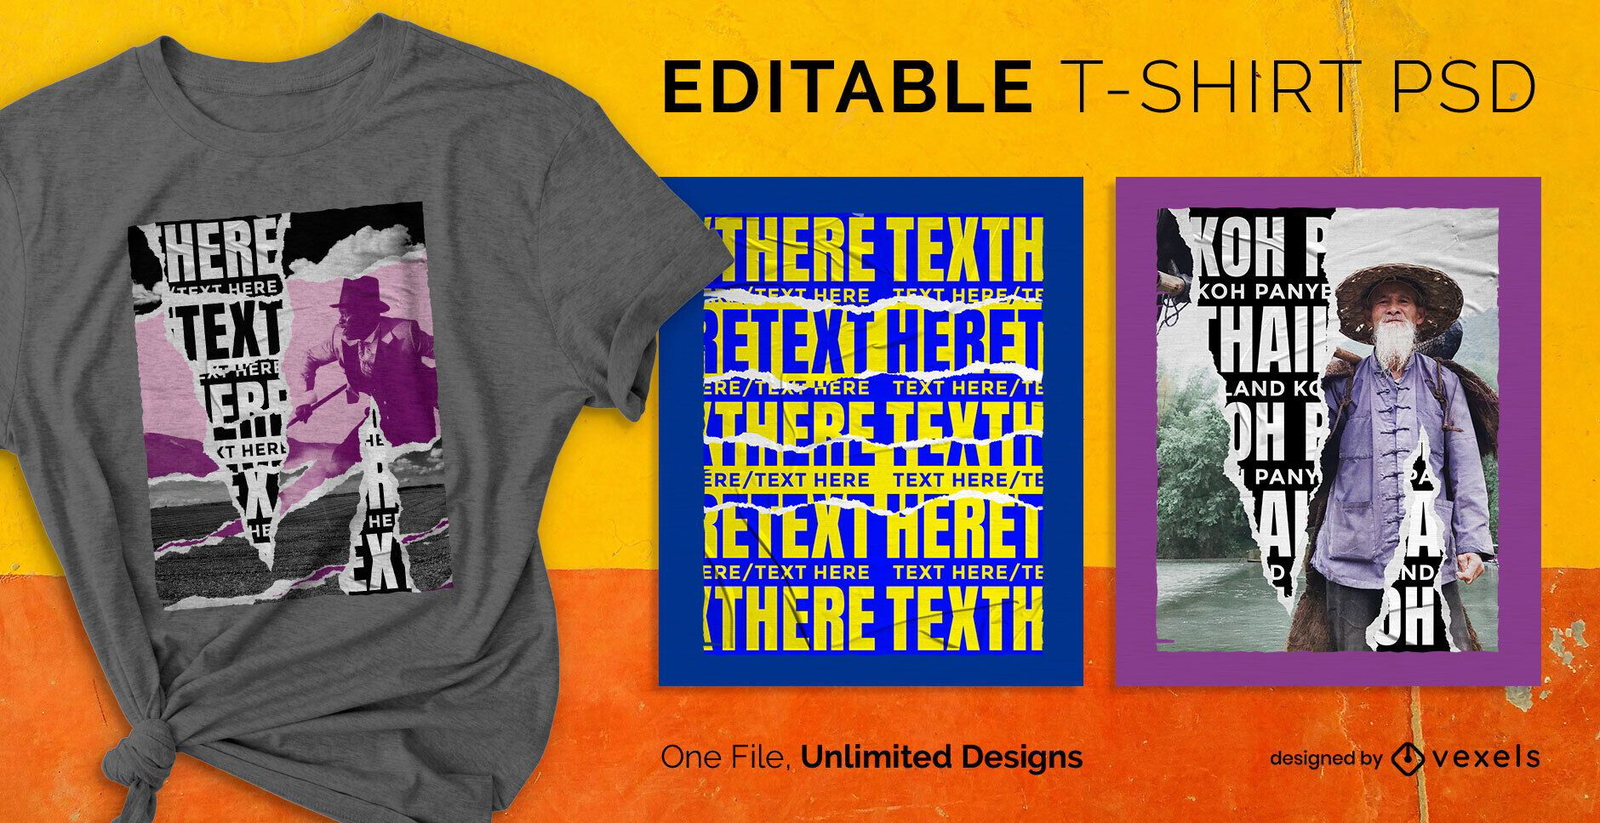
Camiseta escalável com colagem de rua rasgada psd
Escolha uma pasta
Todos os favoritos
Criar novo
Salvar
Camiseta escalável com colagem de rua rasgada psd
Camiseta PSD escalável
para Merch
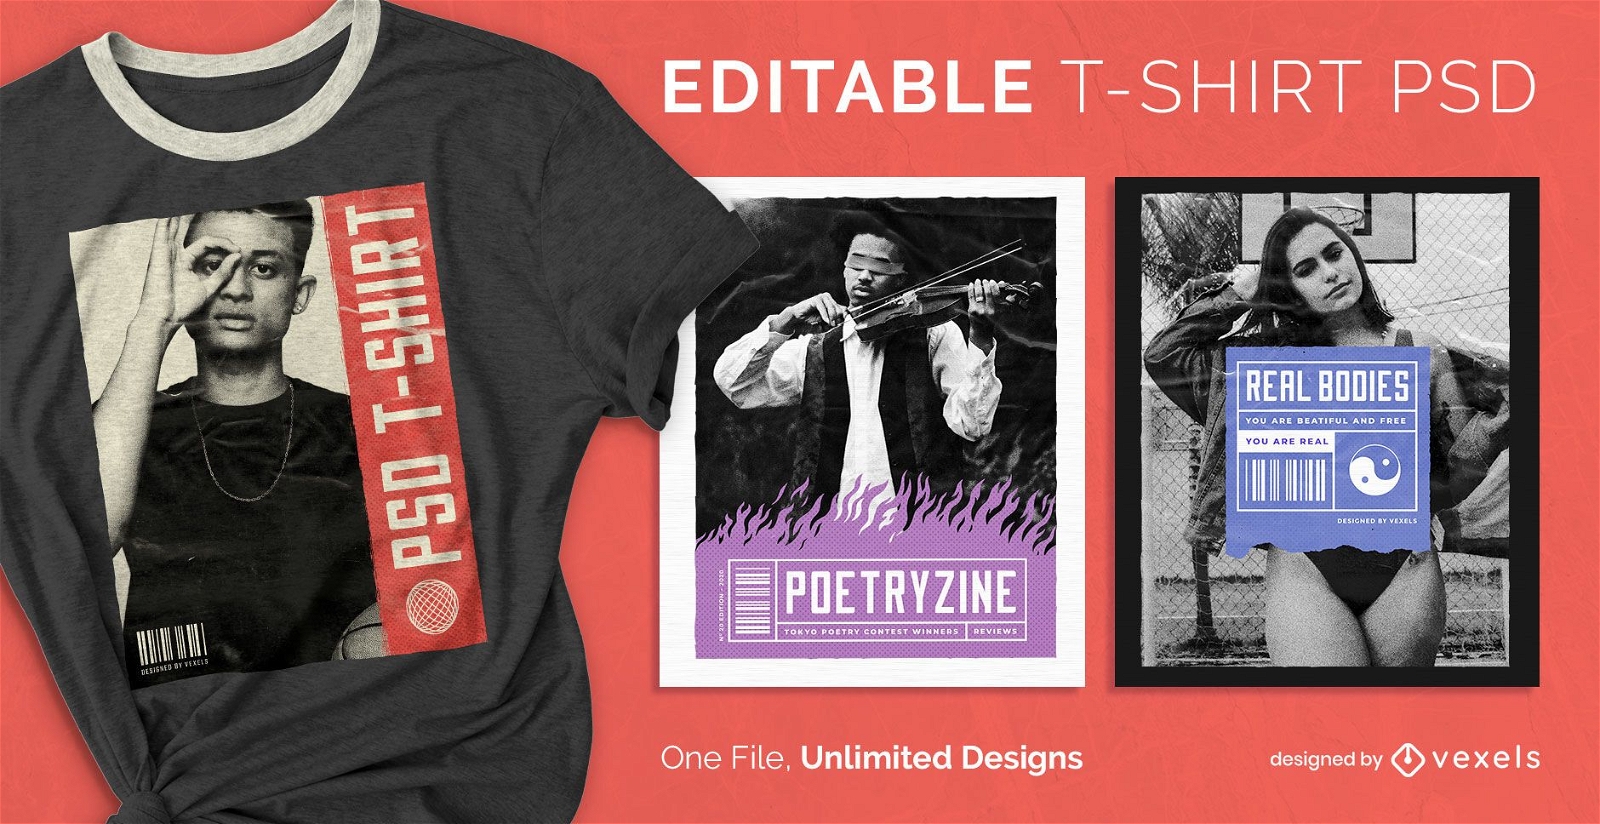
T-shirt escalável capa de revista psd
Escolha uma pasta
Todos os favoritos
Criar novo
Salvar
T-shirt escalável capa de revista psd
Camiseta PSD escalável
para Merch
Cor Sombra Texto Design PSD
Escolha uma pasta
Todos os favoritos
Criar novo
Salvar
Cor Sombra Texto Design PSD
texto editável
Pronto para imprimir
para Merch
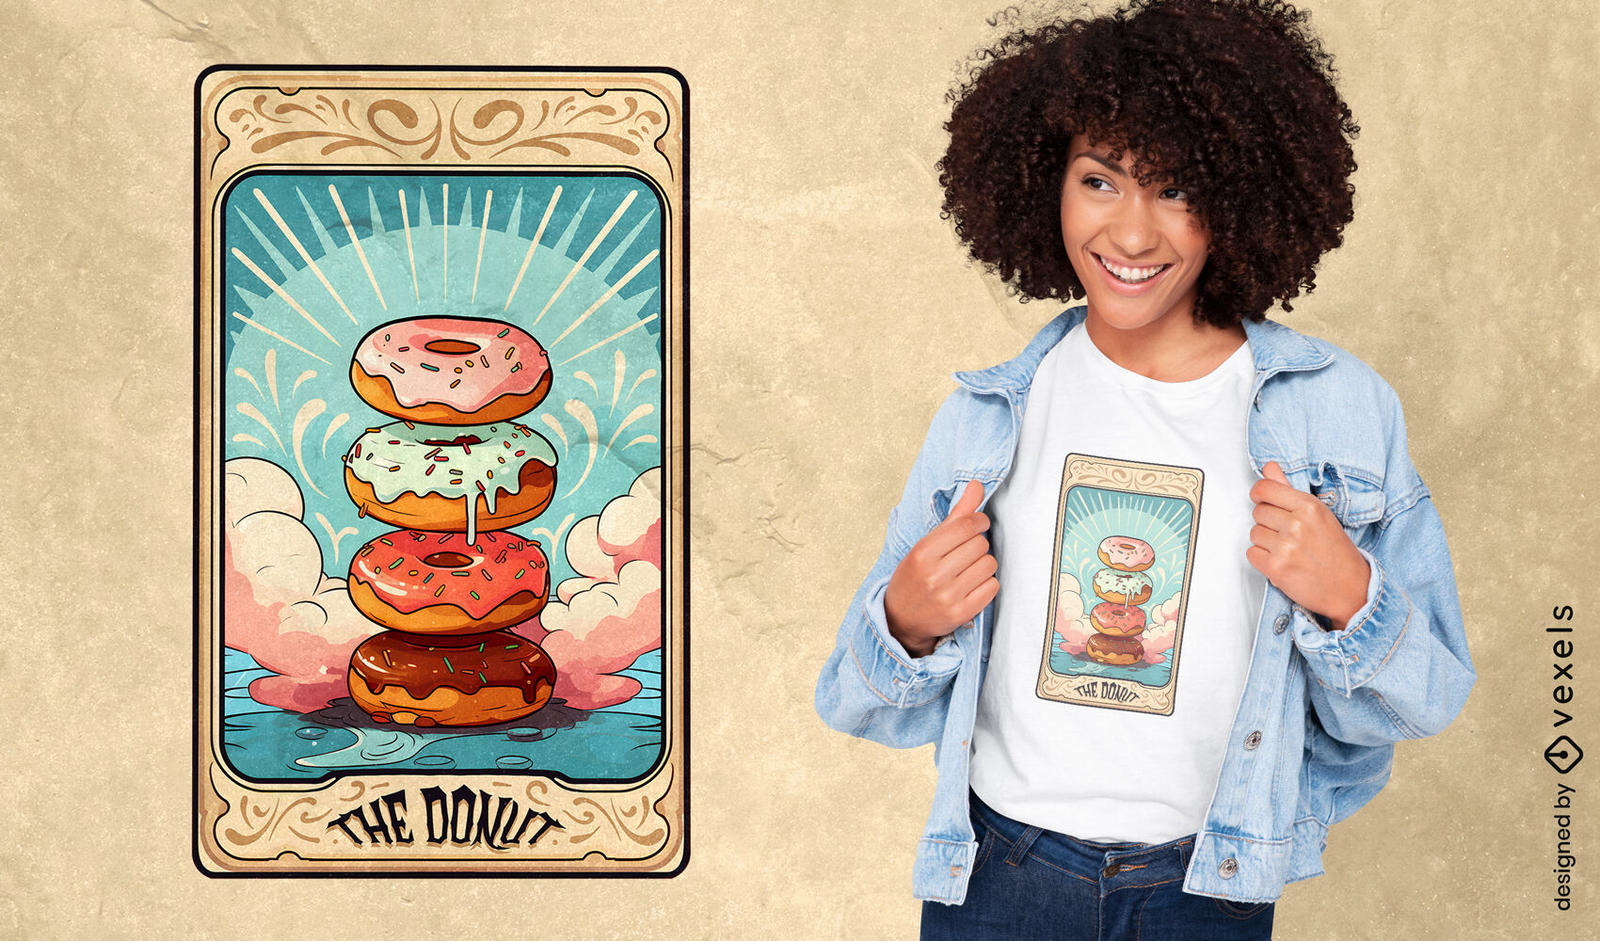
Design de camiseta de cartão de tarô Donuts
Escolha uma pasta
Todos os favoritos
Criar novo
Salvar
Design de camiseta de cartão de tarô Donuts
texto editável
Pronto para imprimir
para Merch
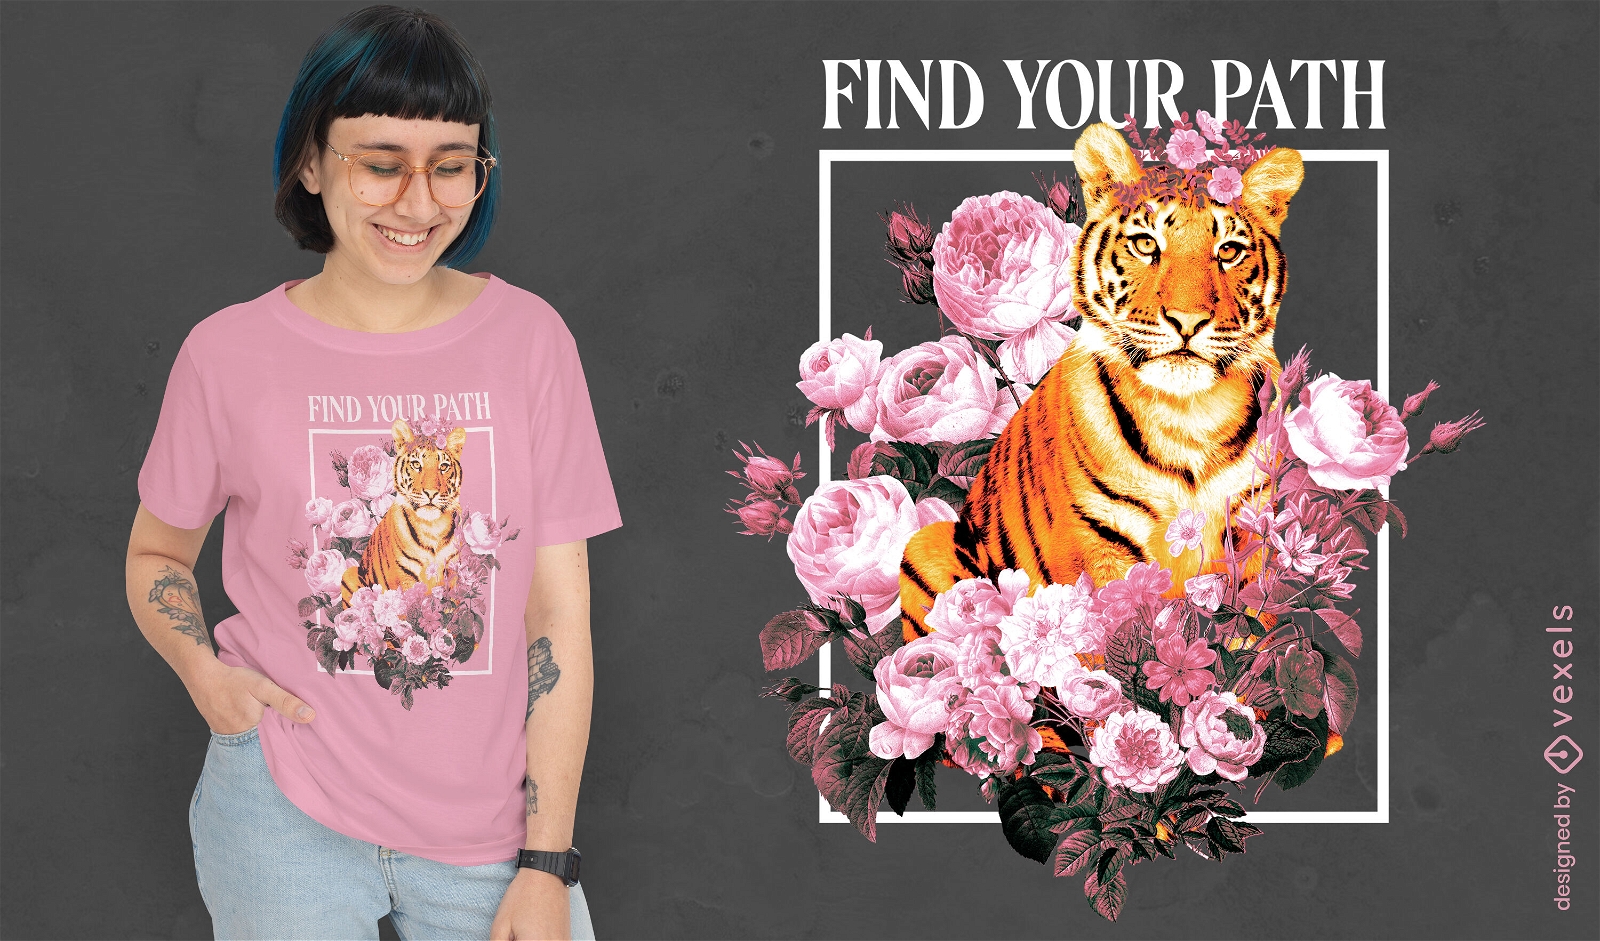
Animal selvagem tigre com t-shirt de flores psd
Escolha uma pasta
Todos os favoritos
Criar novo
Salvar
Animal selvagem tigre com t-shirt de flores psd
Pronto para imprimir
para Merch
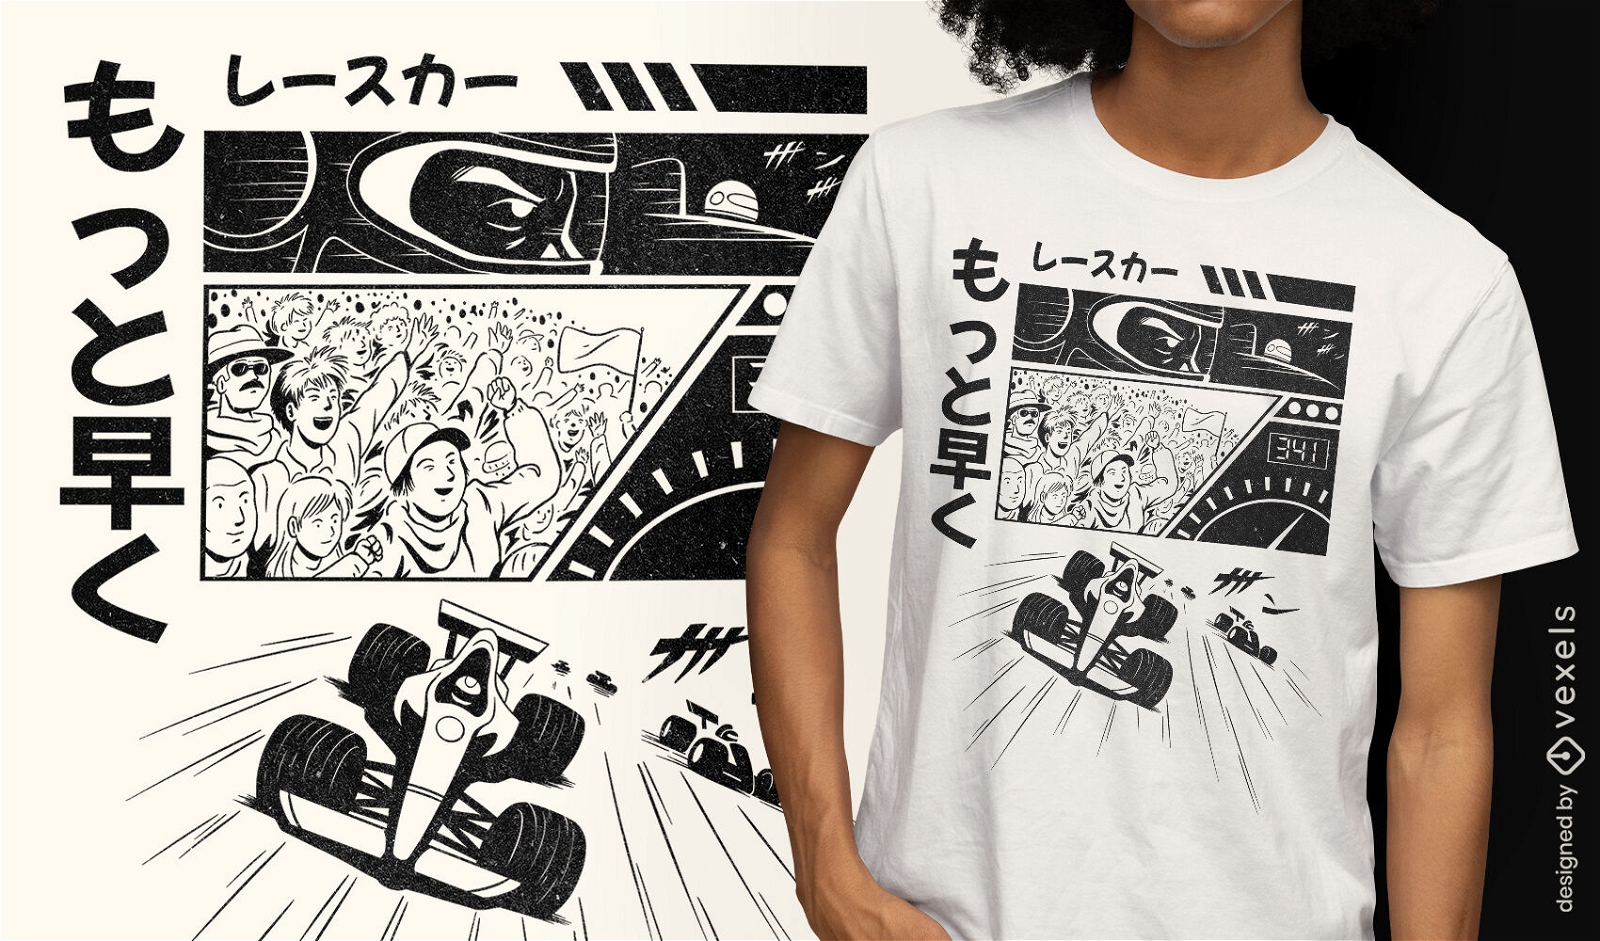
Camiseta de quadrinhos de carros de corrida de anime psd
Escolha uma pasta
Todos os favoritos
Criar novo
Salvar
Camiseta de quadrinhos de carros de corrida de anime psd
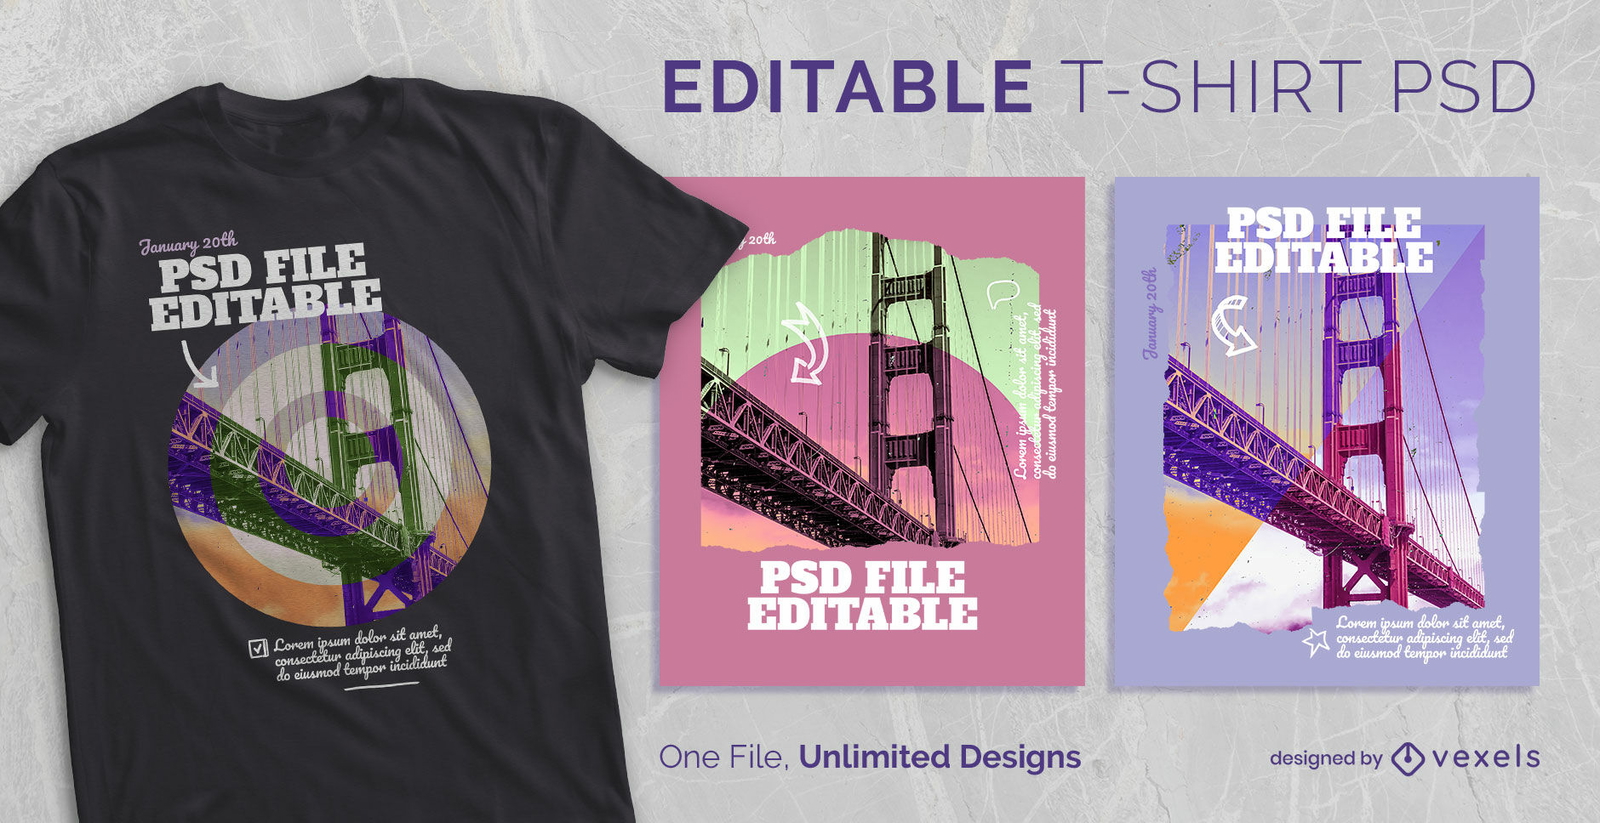
texto editável
para Merch
T-shirt escalável de imagem de doodle de dois tons psd
Escolha uma pasta
Todos os favoritos
Criar novo
Salvar
T-shirt escalável de imagem de doodle de dois tons psd
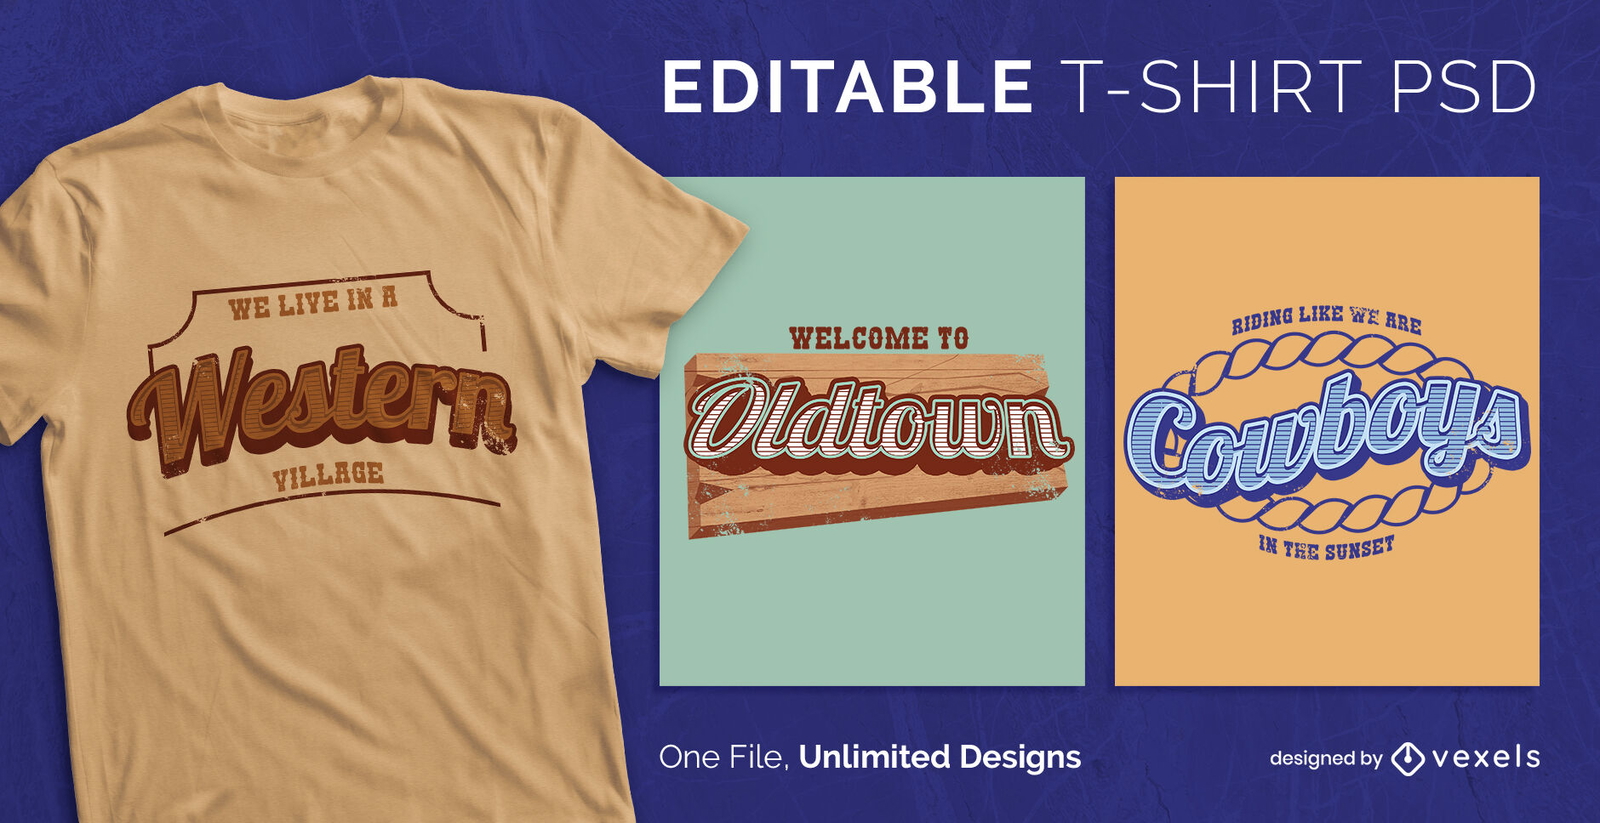
texto editável
para Merch
T-shirt escalável de arte de verão em aquarela psd
Escolha uma pasta
Todos os favoritos
Criar novo
Salvar
T-shirt escalável de arte de verão em aquarela psd
texto editável
para Merch
Camiseta PSD escalável de cowboy ocidental
Escolha uma pasta
Todos os favoritos
Criar novo
Salvar
Camiseta PSD escalável de cowboy ocidental
Pronto para imprimir
para Merch
T-shirt psd trippy com riffs de guitarra
Escolha uma pasta
Todos os favoritos
Criar novo
Salvar
T-shirt psd trippy com riffs de guitarra
Pronto para imprimir
para Merch
Vaporwave coração futurista psd camiseta psd
Escolha uma pasta
Todos os favoritos
Criar novo
Salvar
Vaporwave coração futurista psd camiseta psd
Pronto para imprimir
para Merch
Camiseta escura colagem fotográfica psd
Escolha uma pasta
Todos os favoritos
Criar novo
Salvar
Camiseta escura colagem fotográfica psd
Pronto para imprimir
para Merch
Man and road double exposure PSD t-shirt design
Escolha uma pasta
Todos os favoritos
Criar novo
Salvar
Man and road double exposure PSD t-shirt design
Camiseta PSD escalável
para Merch
T-shirt escalável Duotone dupla exposição psd
Escolha uma pasta
Todos os favoritos
Criar novo
Salvar
T-shirt escalável Duotone dupla exposição psd
Pronto para imprimir
para Merch
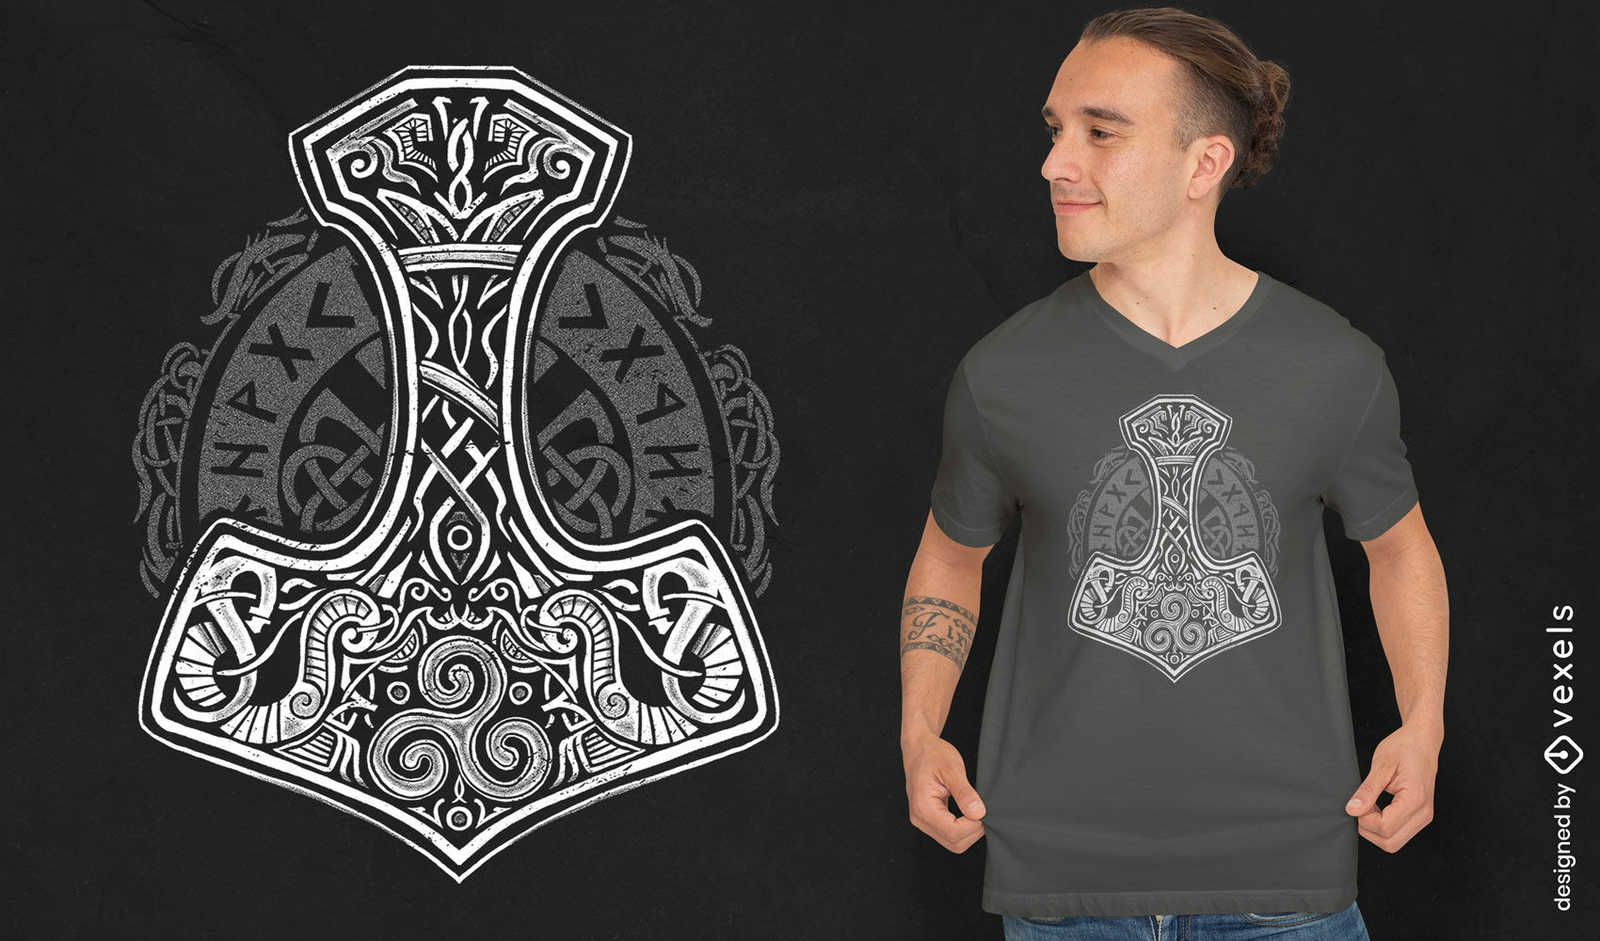
Design de camiseta tribal de martelo nórdico
Escolha uma pasta
Todos os favoritos
Criar novo
Salvar
Design de camiseta tribal de martelo nórdico
Pronto para imprimir
para Merch
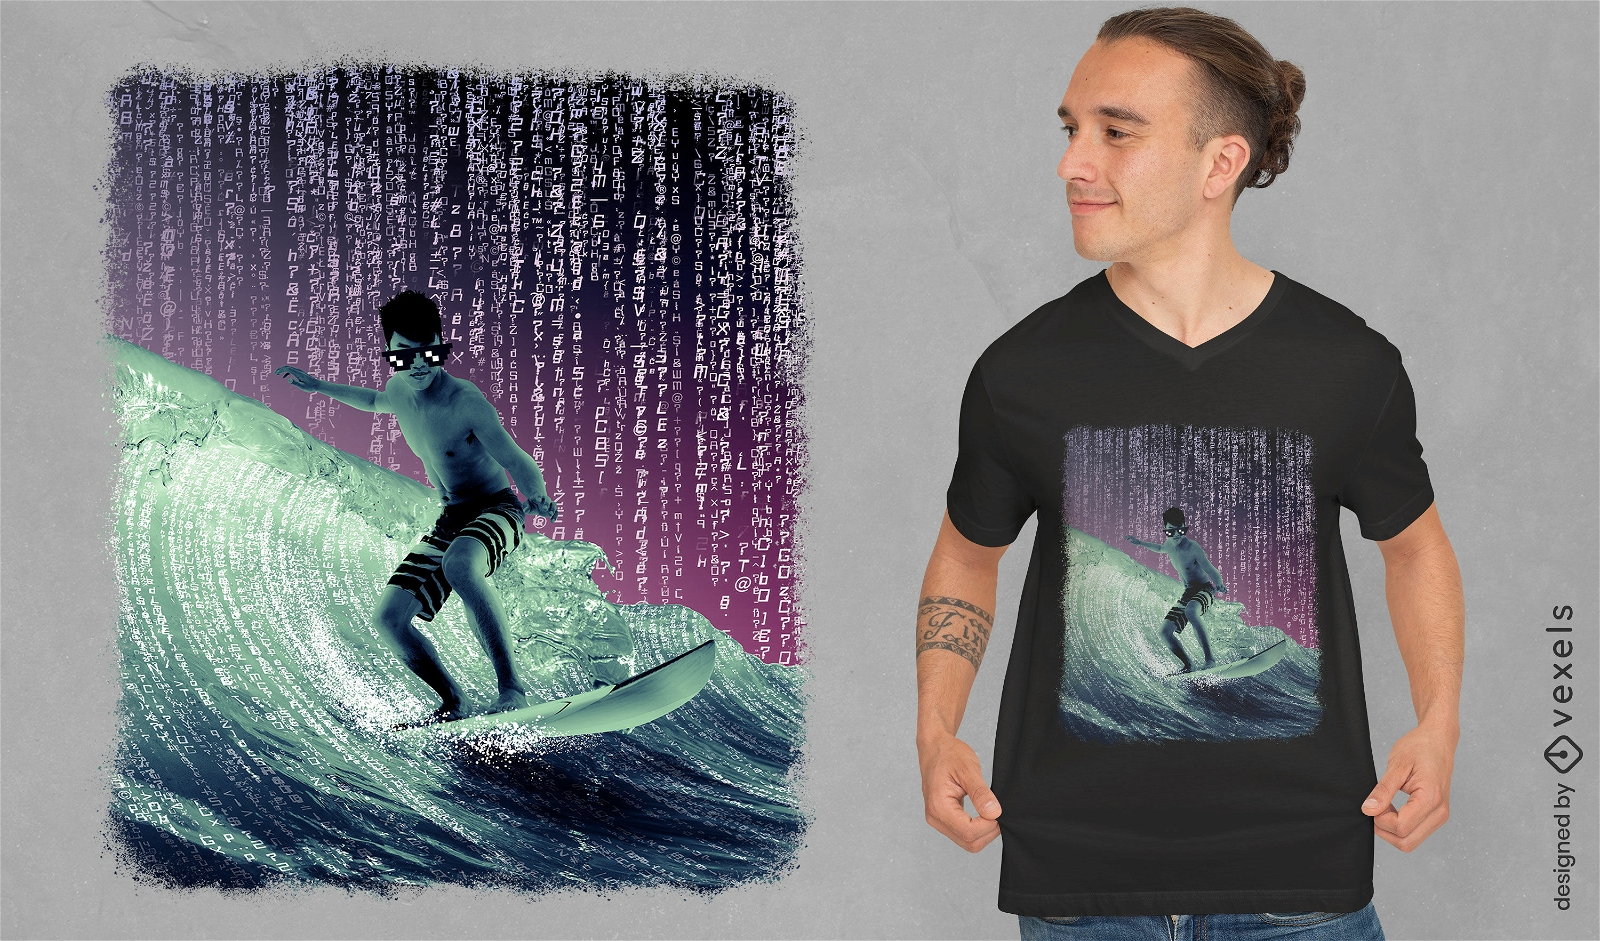
Codificando design de camiseta PSD de surfista
Escolha uma pasta
Todos os favoritos
Criar novo
Salvar
Codificando design de camiseta PSD de surfista
Pronto para imprimir
para Merch
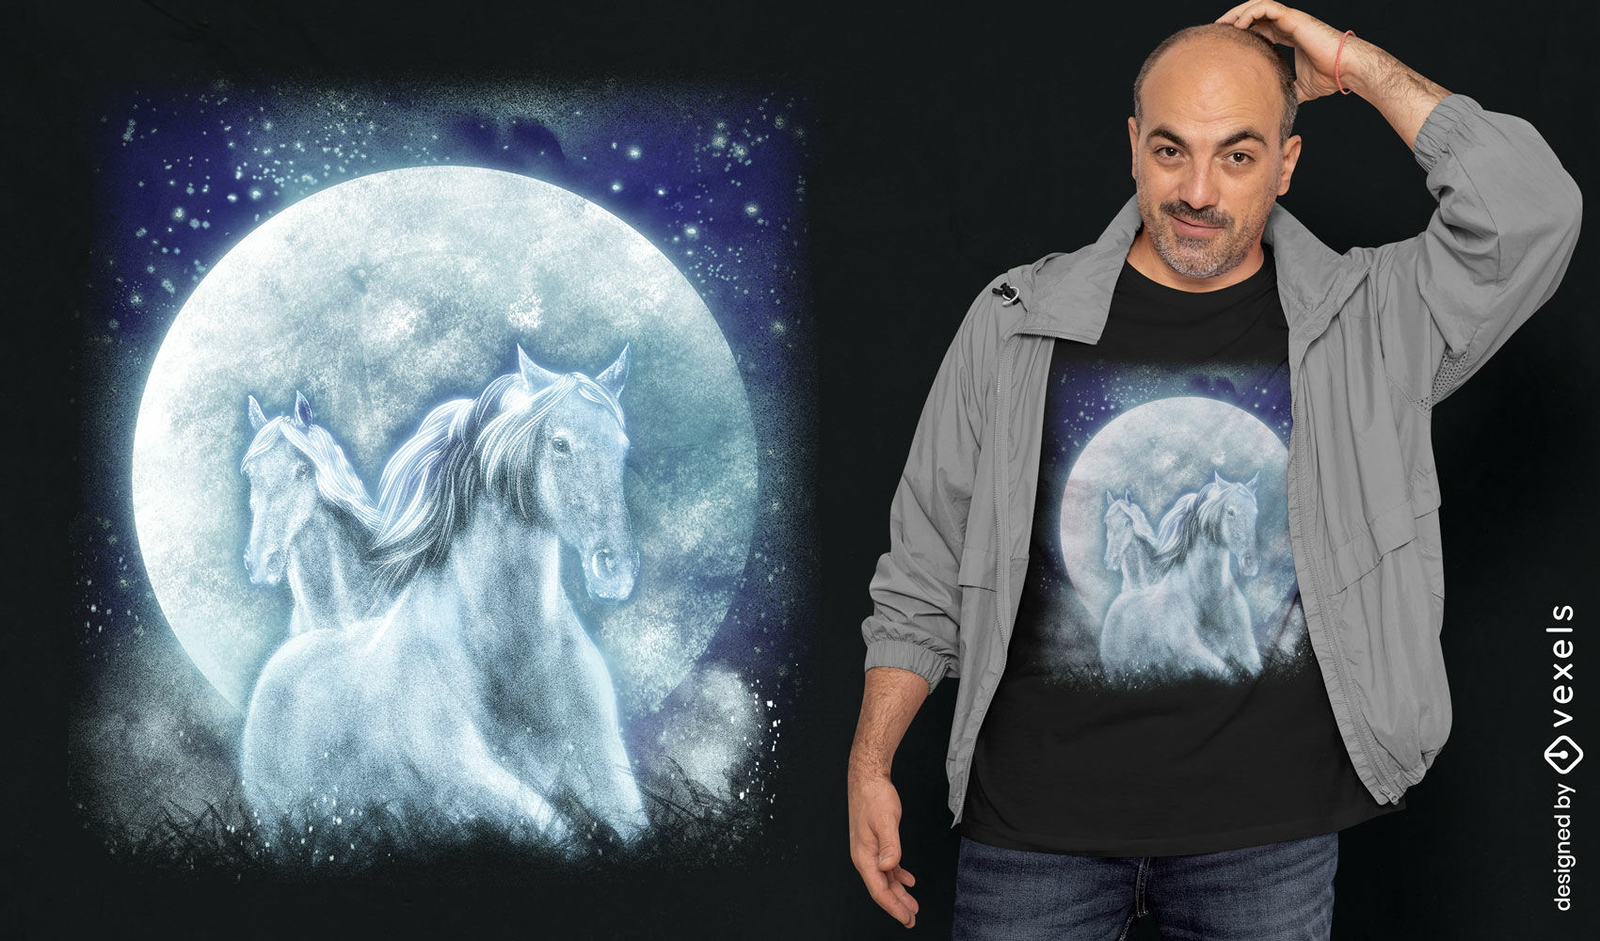
Design de camiseta de lua cheia de cavalos místicos
Escolha uma pasta
Todos os favoritos
Criar novo
Salvar
Design de camiseta de lua cheia de cavalos místicos
Pronto para imprimir
para Merch
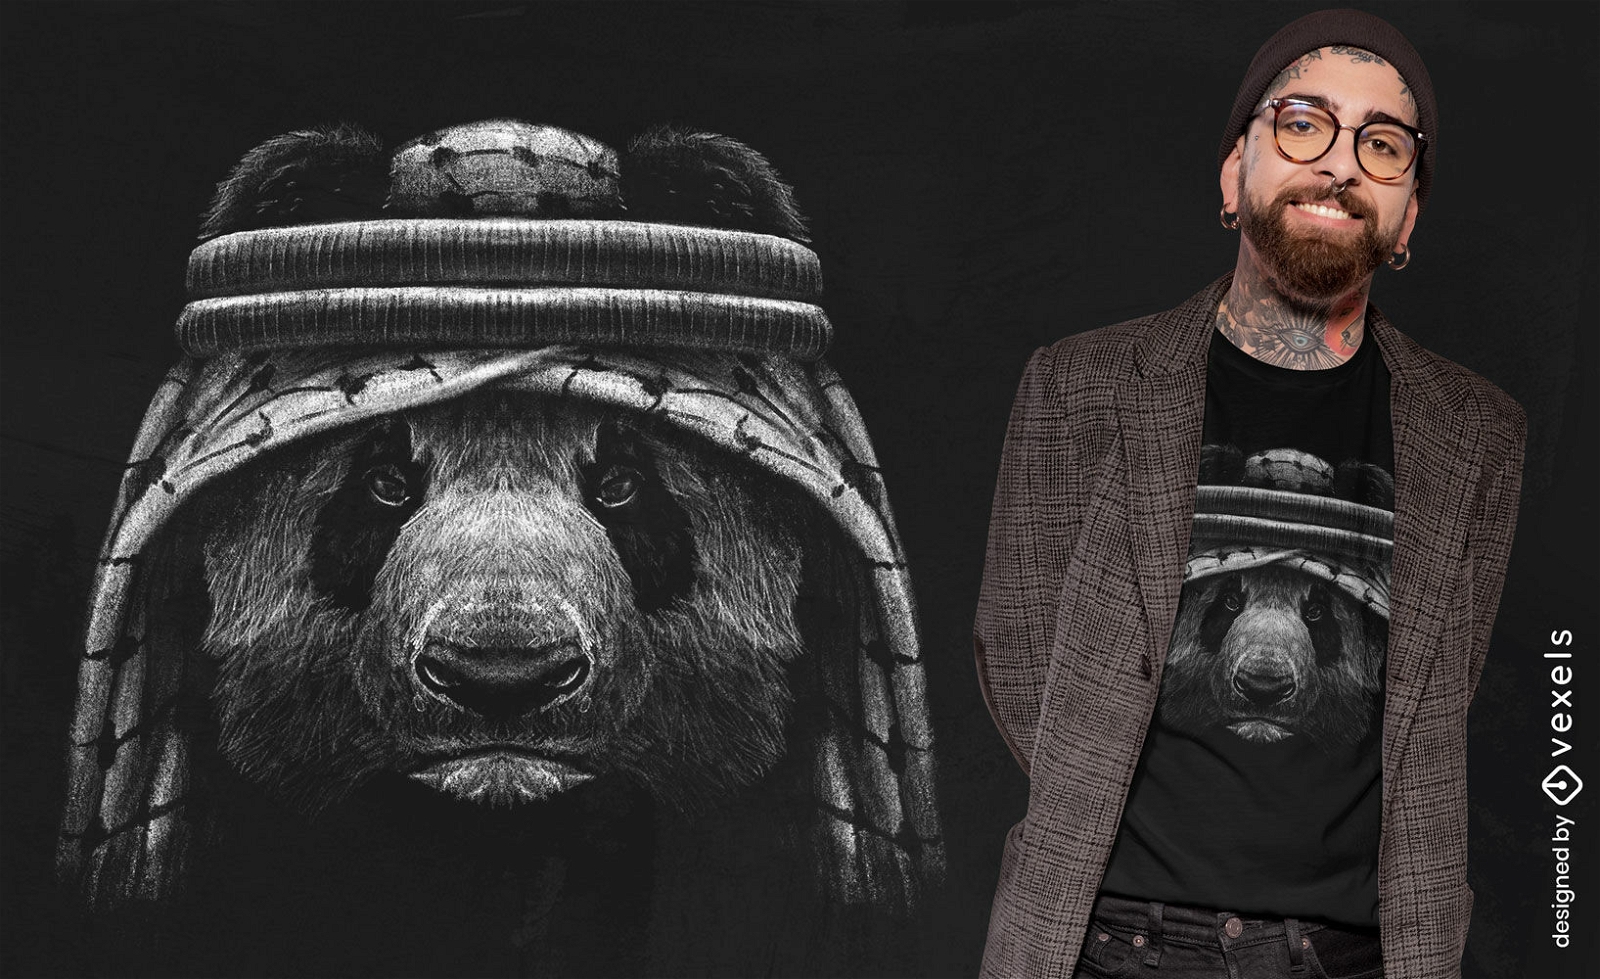
Design de camiseta Panda Keffiyeh
Escolha uma pasta
Todos os favoritos
Criar novo
Salvar
Design de camiseta Panda Keffiyeh
texto editável
Pronto para imprimir
para Merch
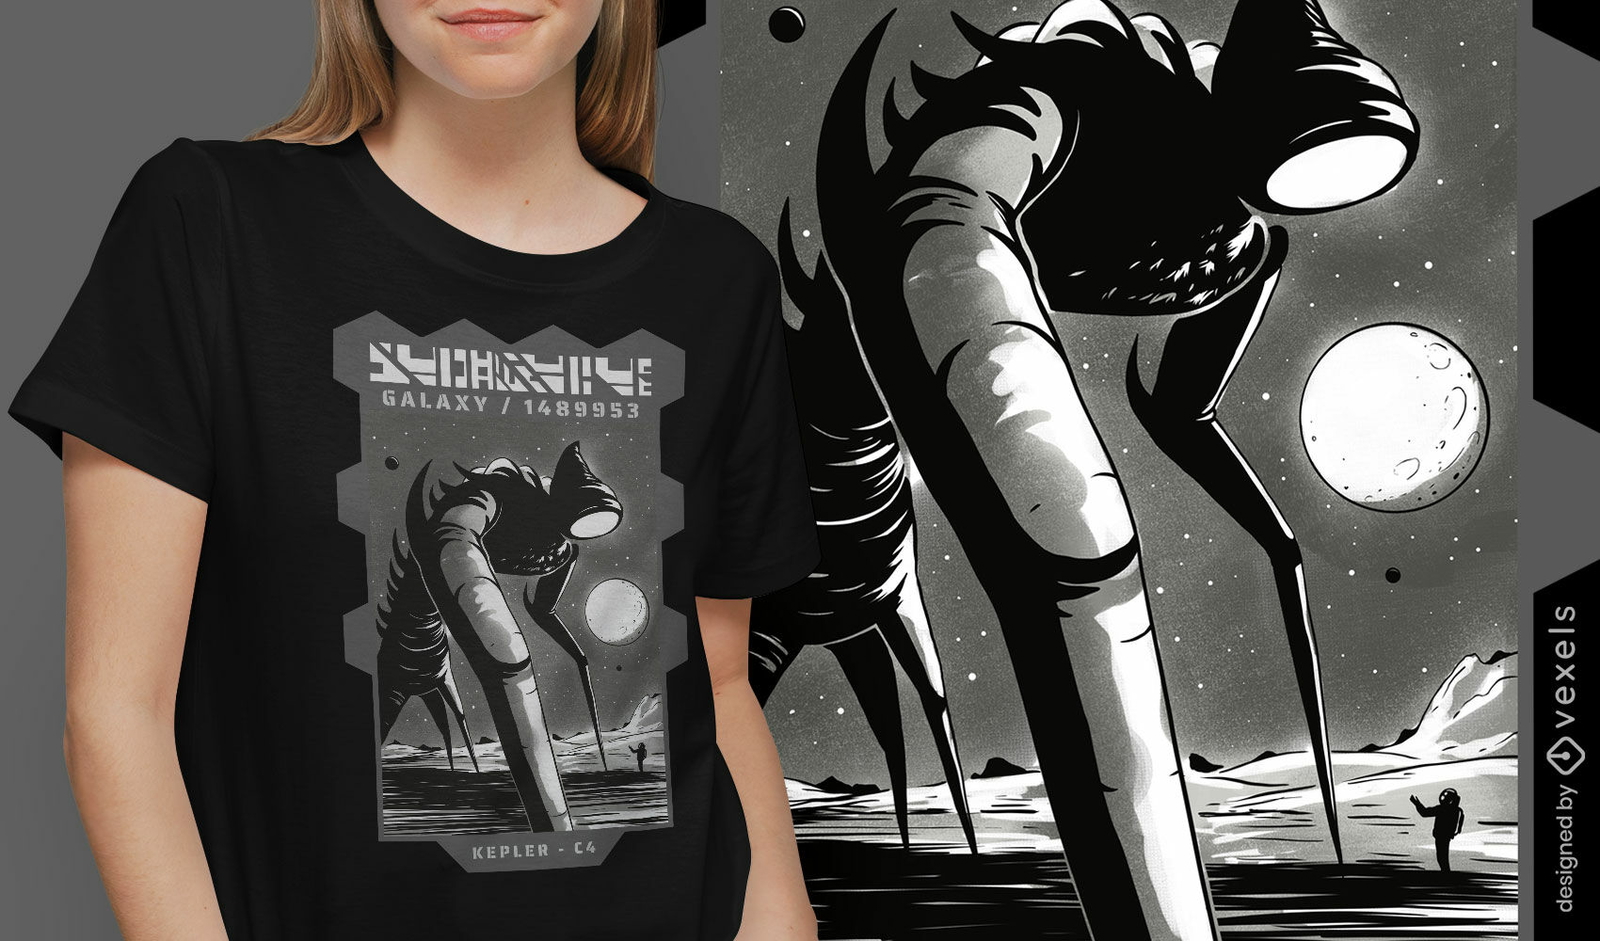
Design de camiseta de monstro alienígena gigante
Escolha uma pasta
Todos os favoritos
Criar novo
Salvar
Design de camiseta de monstro alienígena gigante
Pronto para imprimir
para Merch
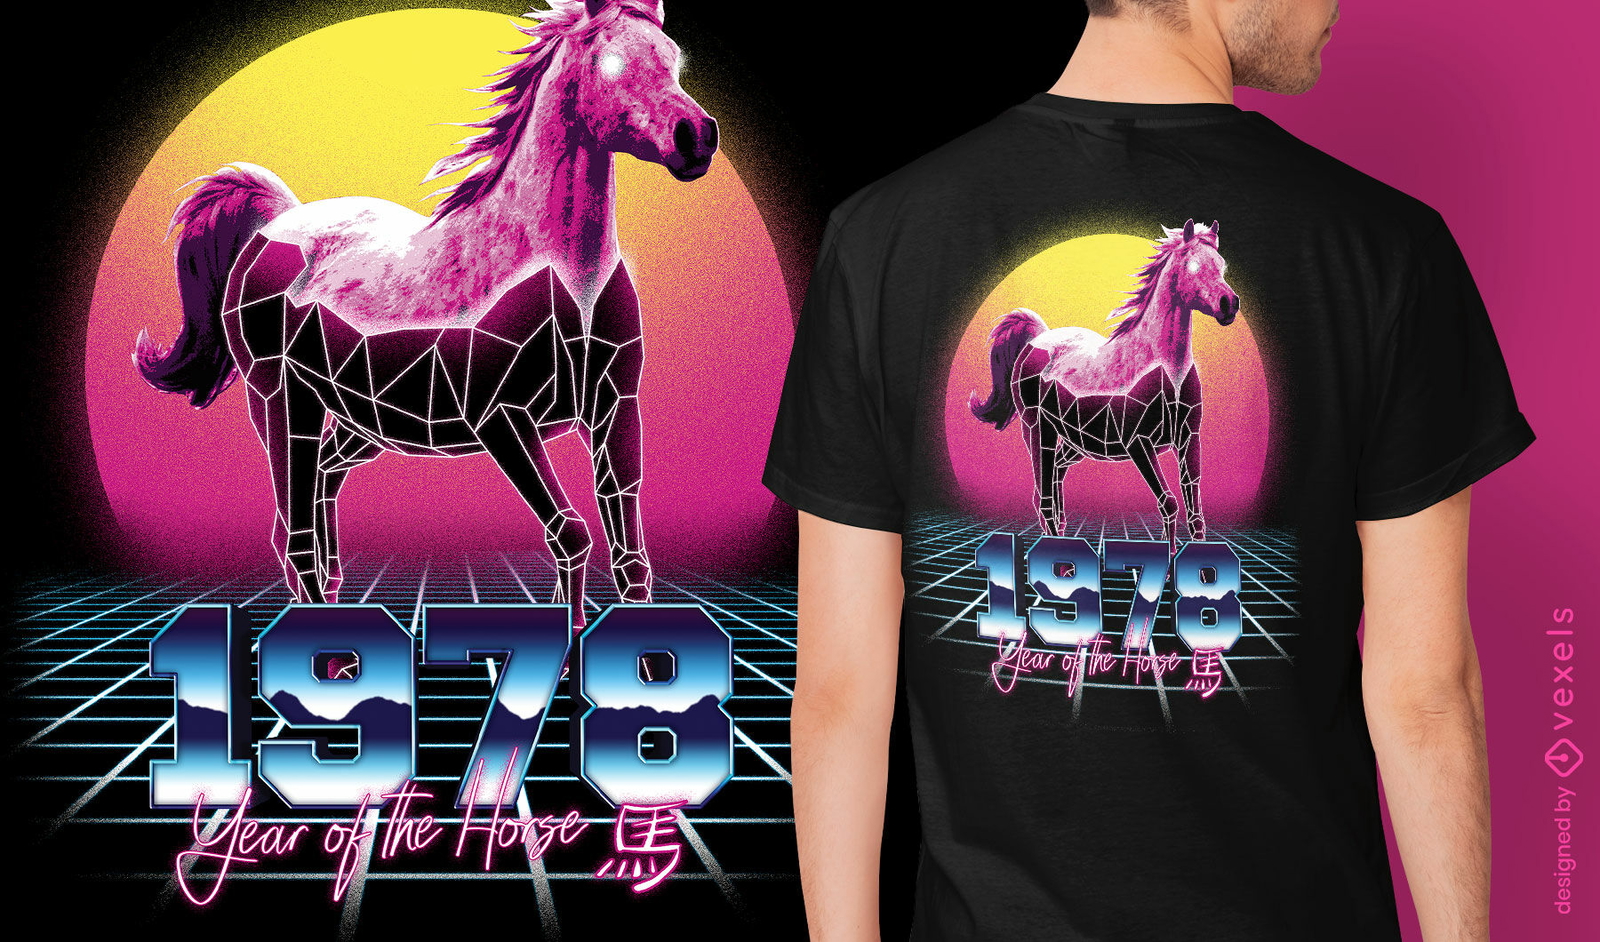
T-shirt do Zodíaco Chinês Cavalo Retrowave PSD
Escolha uma pasta
Todos os favoritos
Criar novo
Salvar
T-shirt do Zodíaco Chinês Cavalo Retrowave PSD
Pronto para imprimir
para Merch
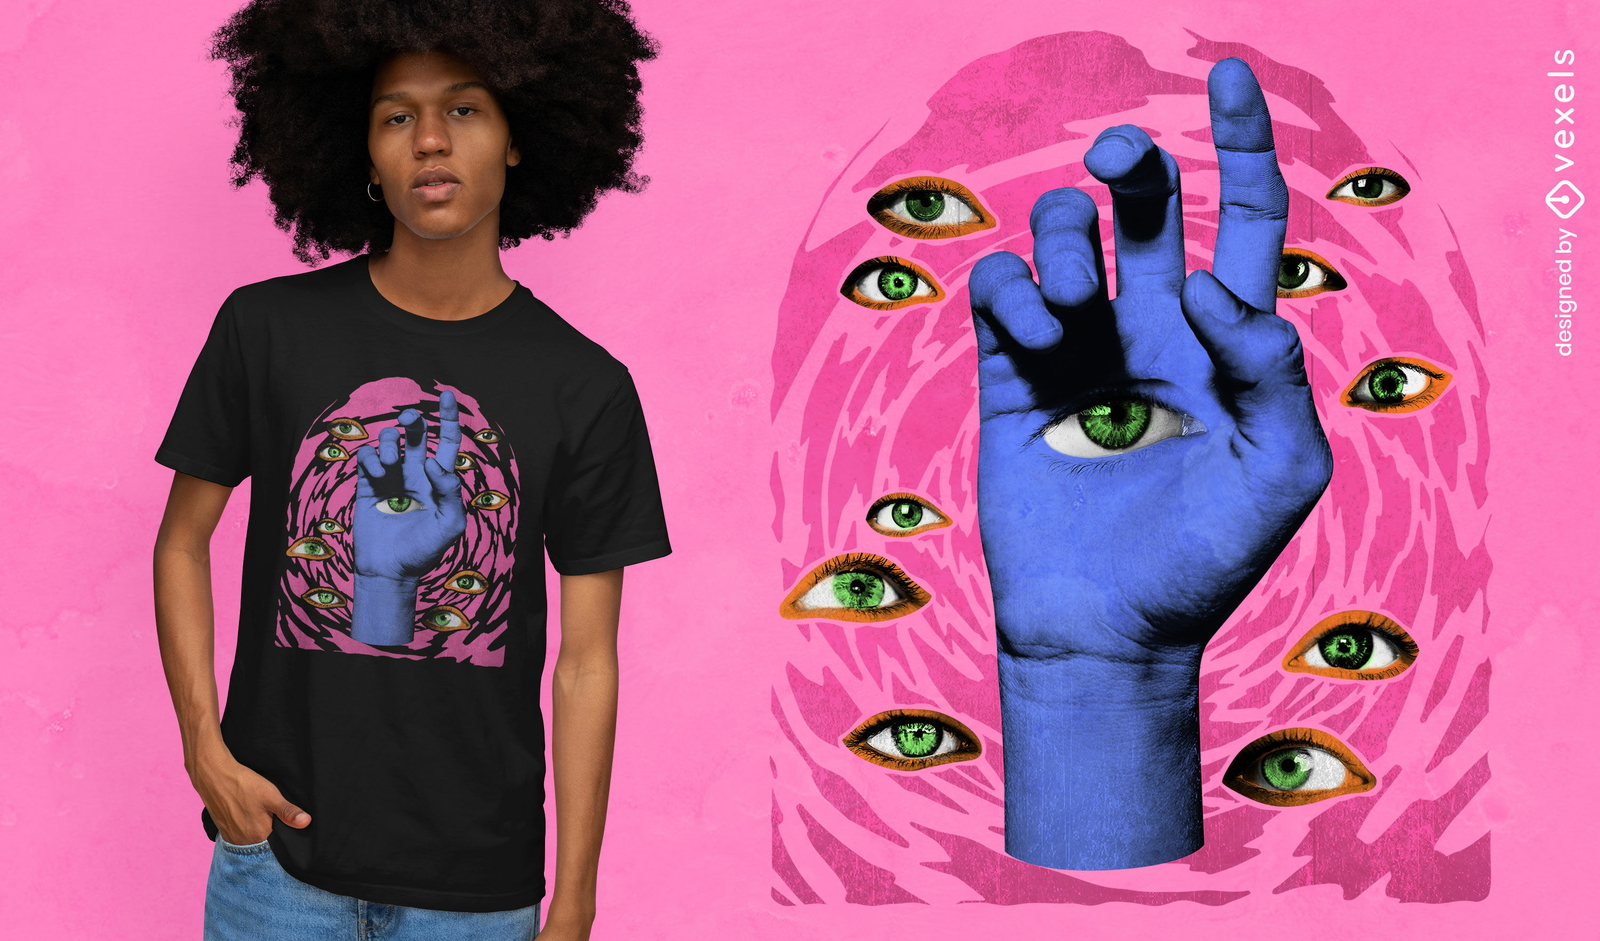
Design psicodélico de t-shirt psd para mãos e olhos
Escolha uma pasta
Todos os favoritos
Criar novo
Salvar
Design psicodélico de t-shirt psd para mãos e olhos
Pronto para imprimir
para Merch
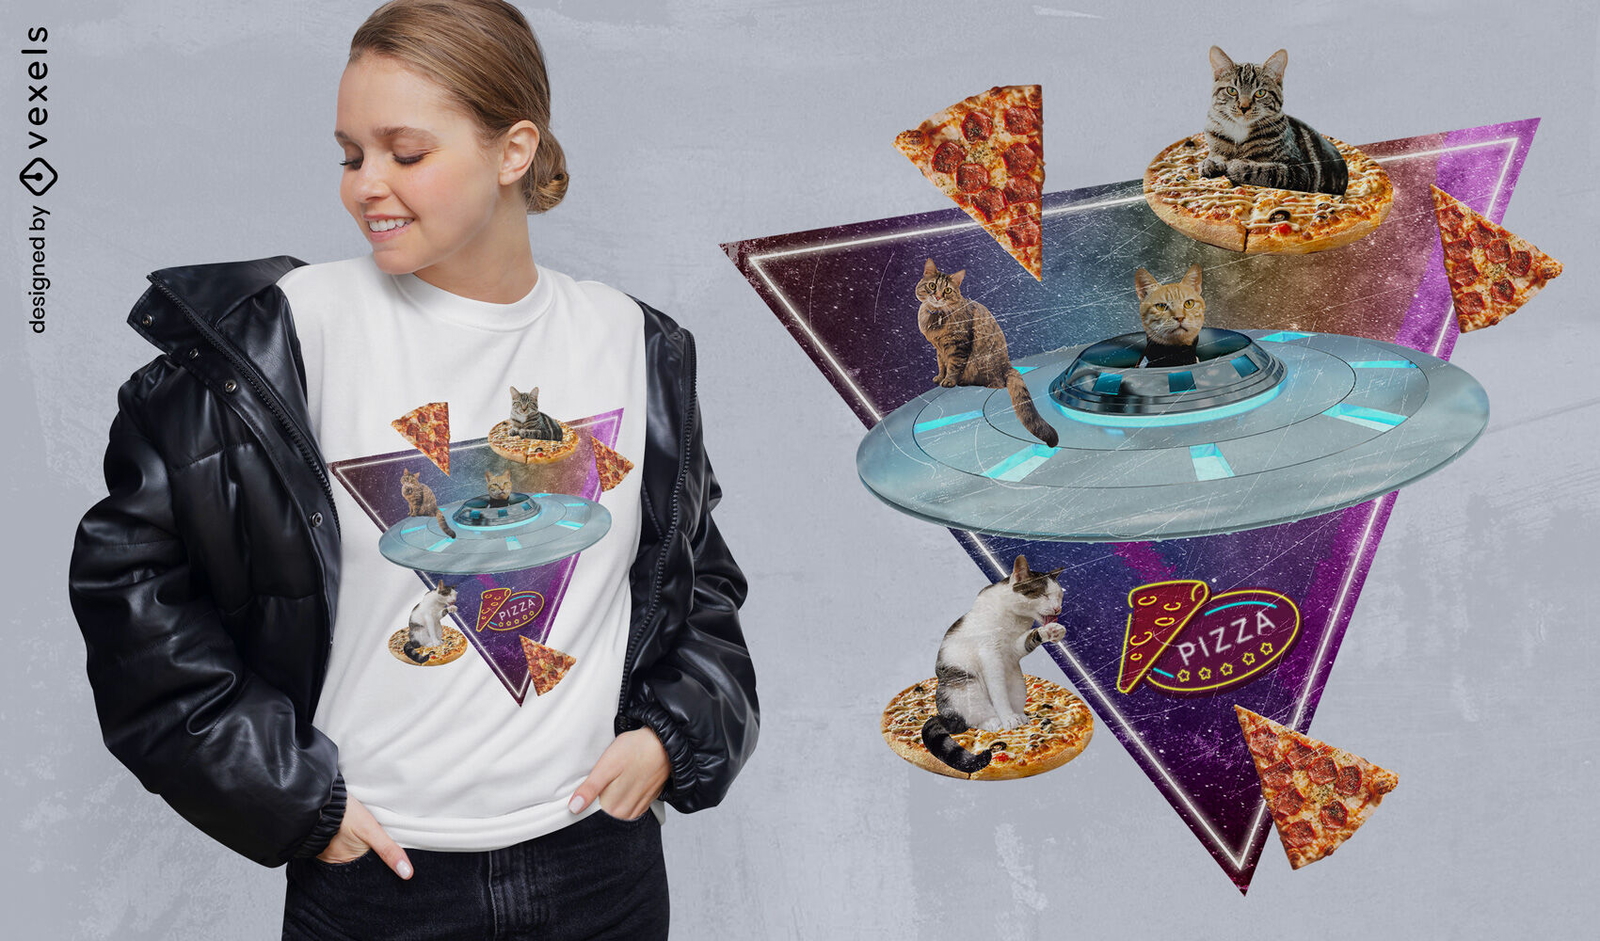
T-shirt da colagem fotográfica do carro da pizza do gato psd
Escolha uma pasta
Todos os favoritos
Criar novo
Salvar
T-shirt da colagem fotográfica do carro da pizza do gato psd
Pronto para imprimir
para Merch
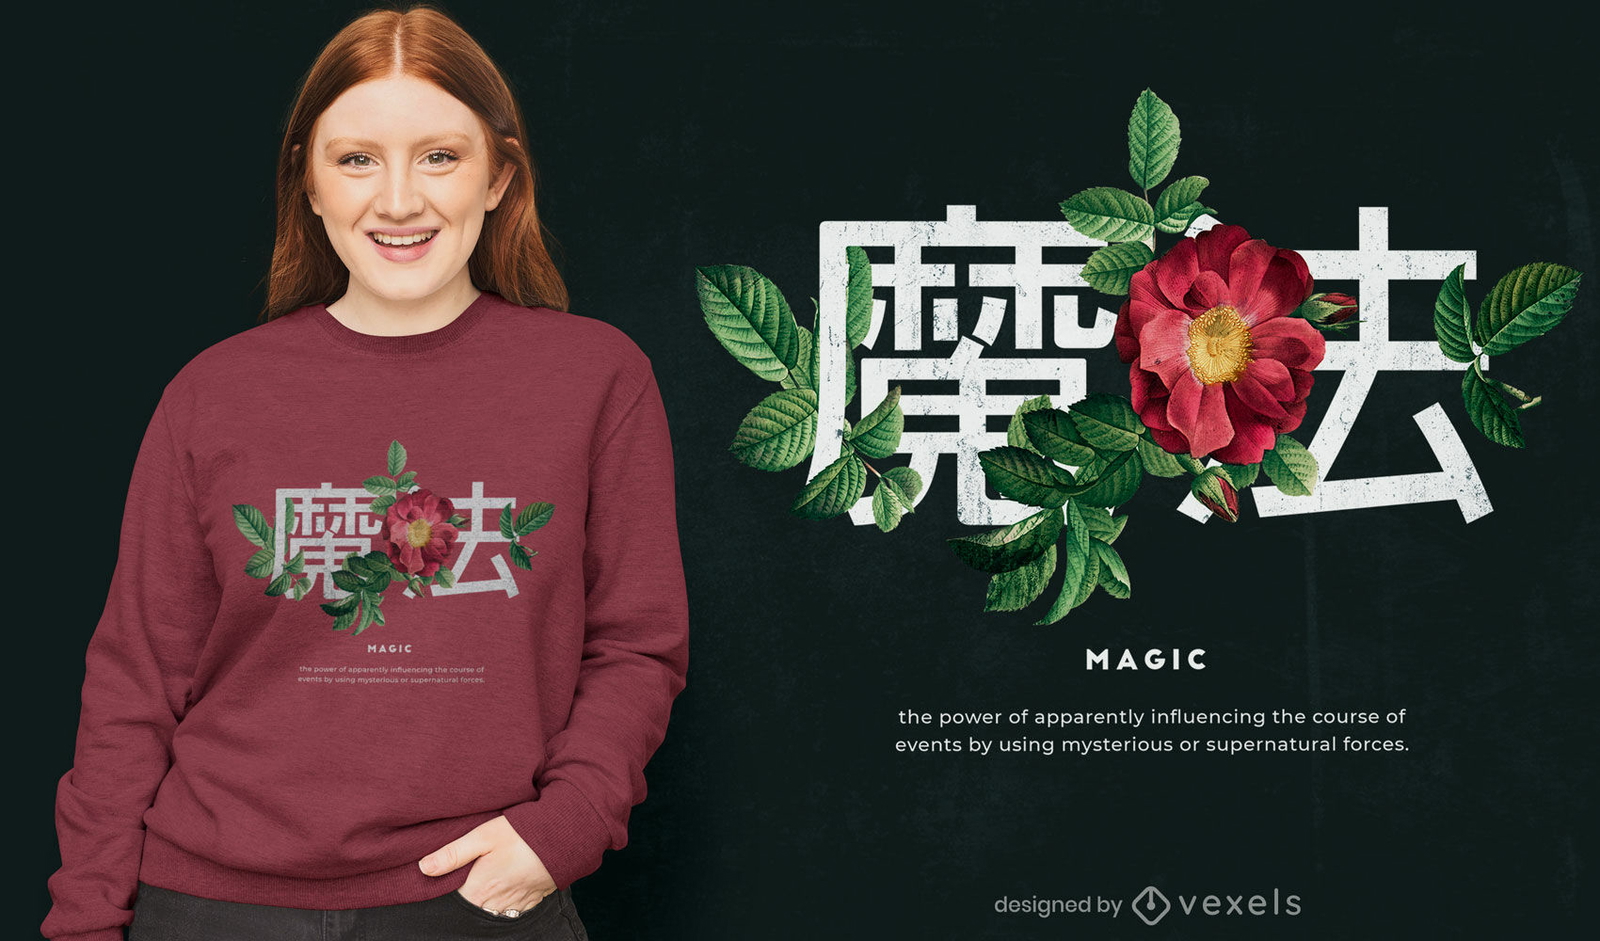
Citação japonesa com design de t-shirt de flores psd
Escolha uma pasta
Todos os favoritos
Criar novo
Salvar
Citação japonesa com design de t-shirt de flores psd
Camiseta PSD escalável
para Merch
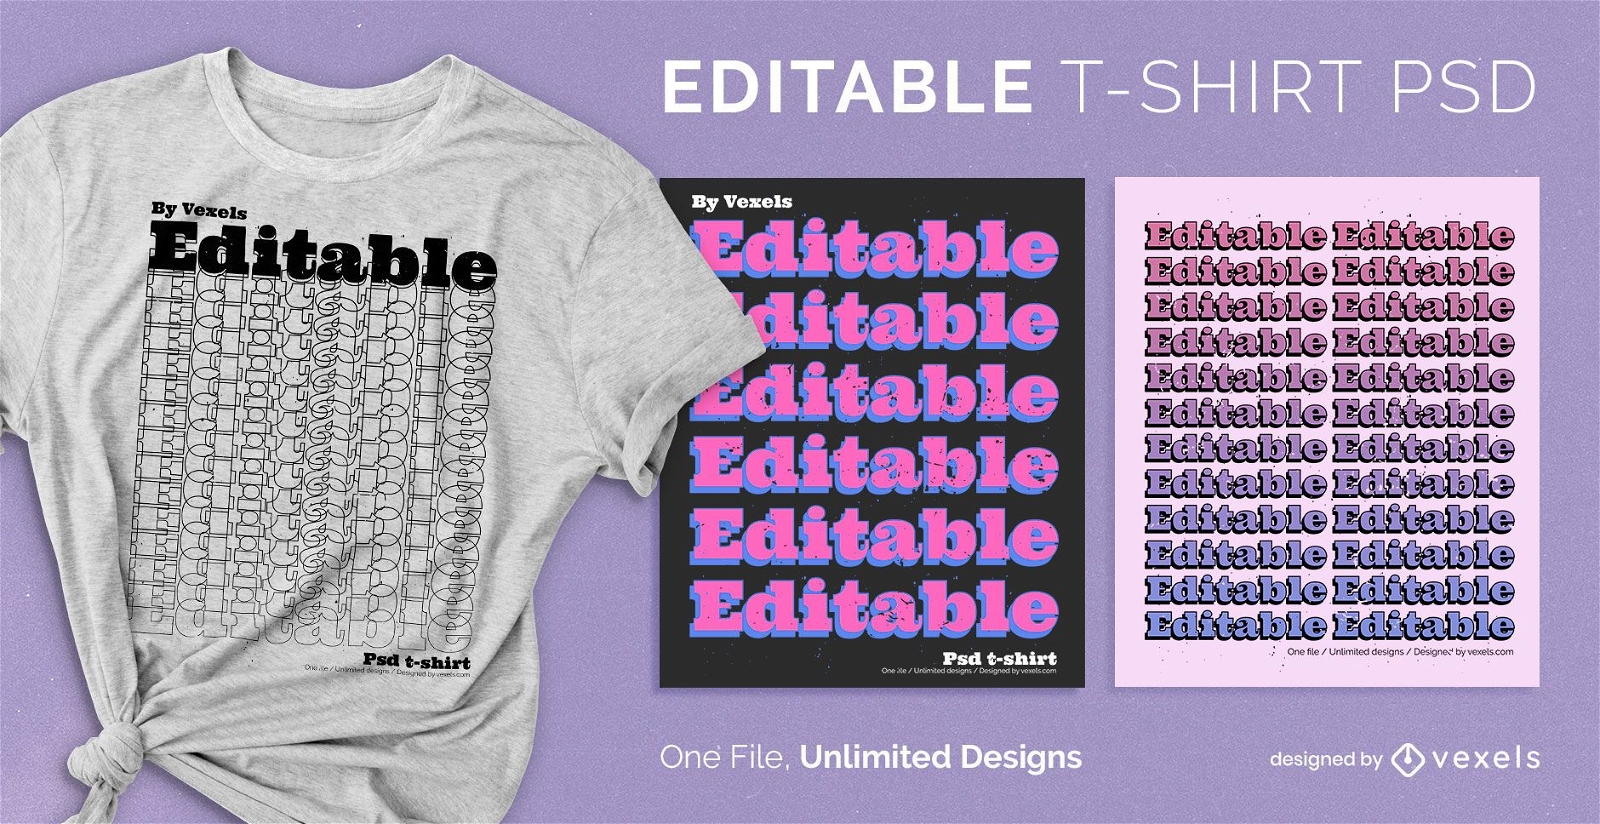
Texto de repetição t-shirt escalável psd
Escolha uma pasta
Todos os favoritos
Criar novo
Salvar
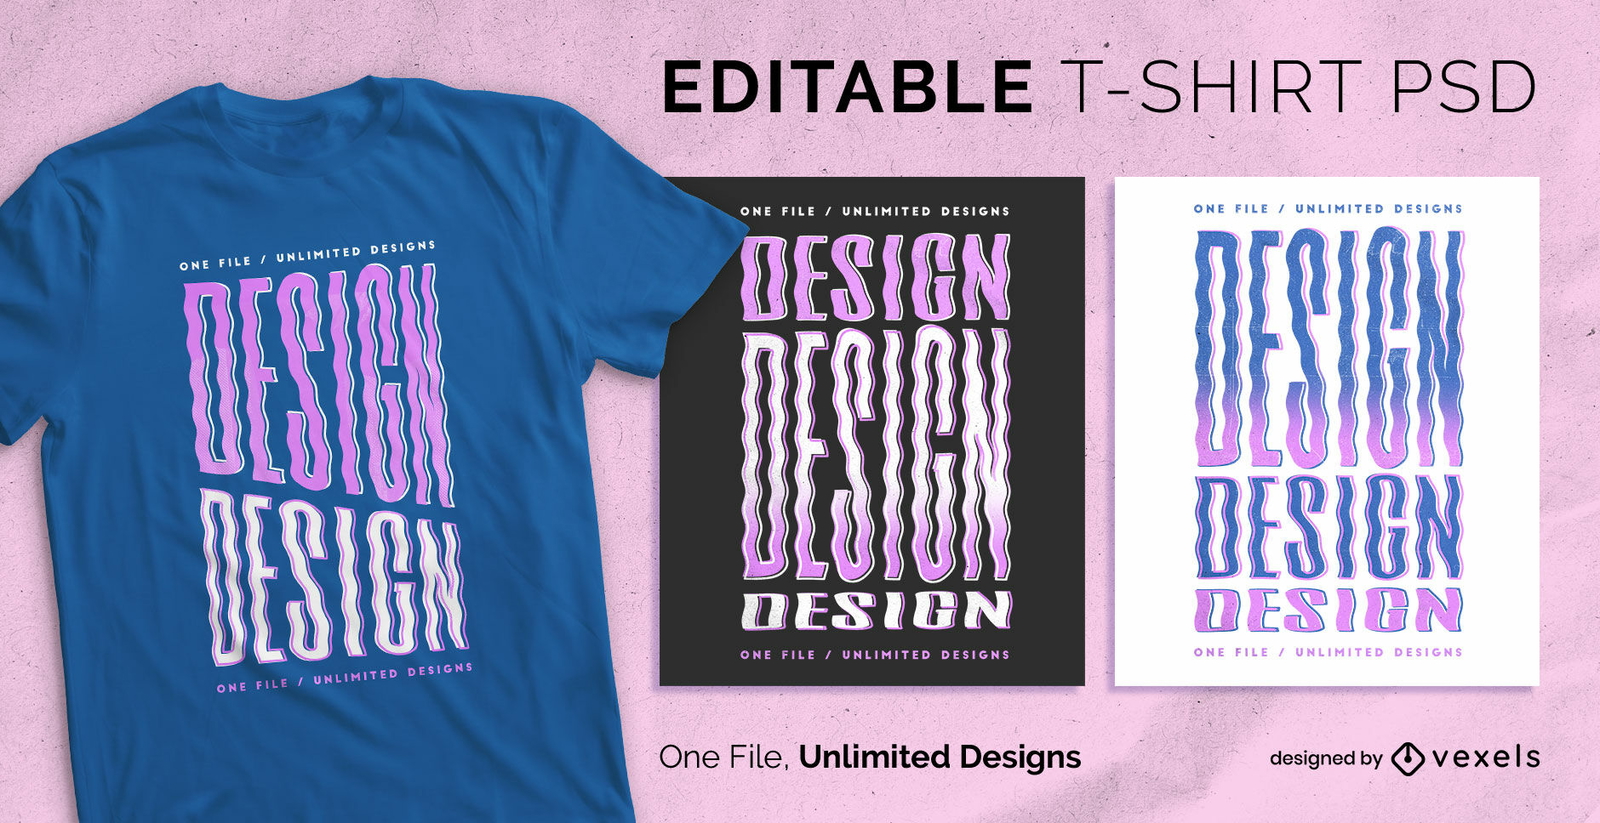
Texto de repetição t-shirt escalável psd
Camiseta PSD escalável
para Merch
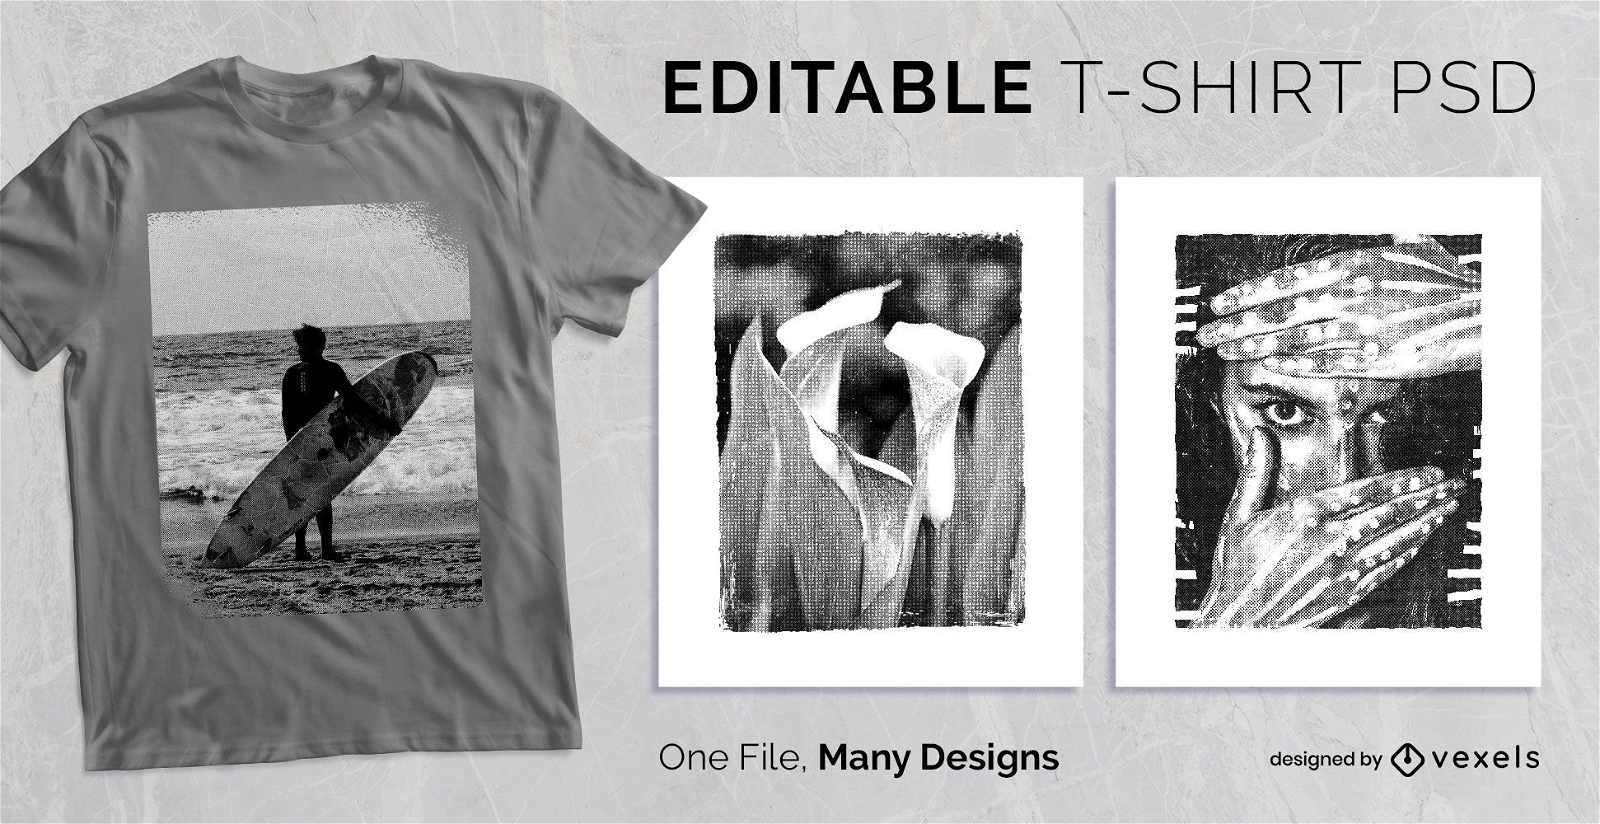
Design PSD com moldura texturizada
Escolha uma pasta
Todos os favoritos
Criar novo
Salvar
Design PSD com moldura texturizada
Pronto para imprimir
para Merch
Design de camiseta de quadrinhos de mangá multicolorido
Escolha uma pasta
Todos os favoritos
Criar novo
Salvar
Design de camiseta de quadrinhos de mangá multicolorido
texto editável
Pronto para imprimir
para Merch
Pássaro corvo steampunk com camiseta de chapéu psd
Escolha uma pasta
Todos os favoritos
Criar novo
Salvar
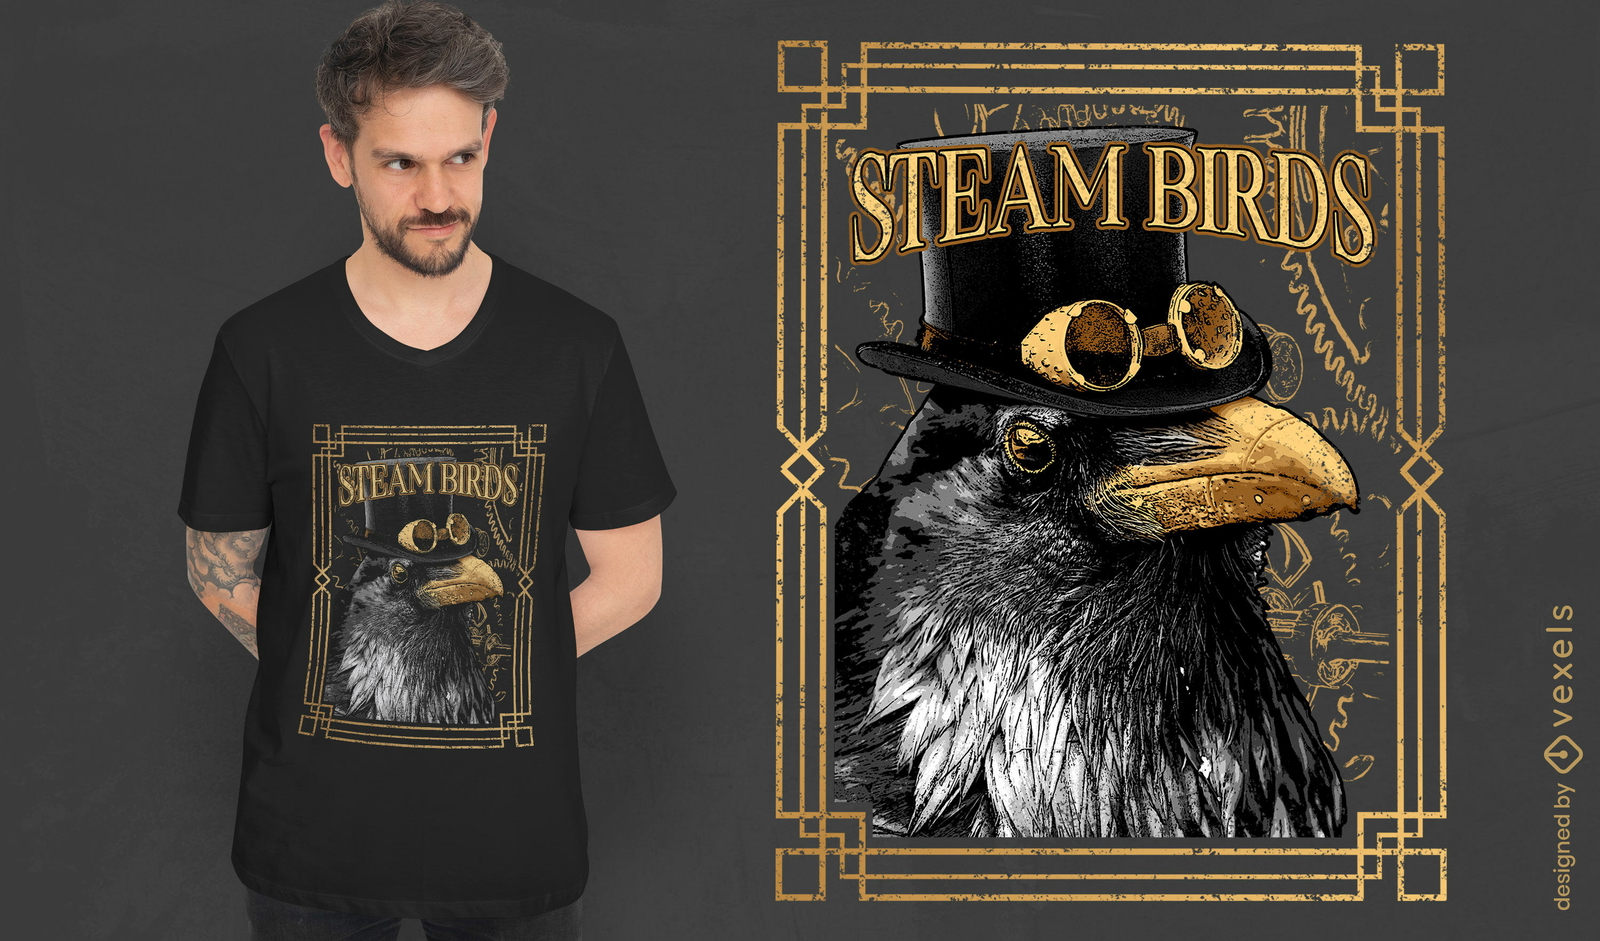
Pássaro corvo steampunk com camiseta de chapéu psd
texto editável
para Merch
T-shirt escalável com efeito gradiente Groovy psd
Escolha uma pasta
Todos os favoritos
Criar novo
Salvar
T-shirt escalável com efeito gradiente Groovy psd
texto editável
para Merch
Neon vaporwave assina camiseta escalável psd
Escolha uma pasta
Todos os favoritos
Criar novo
Salvar
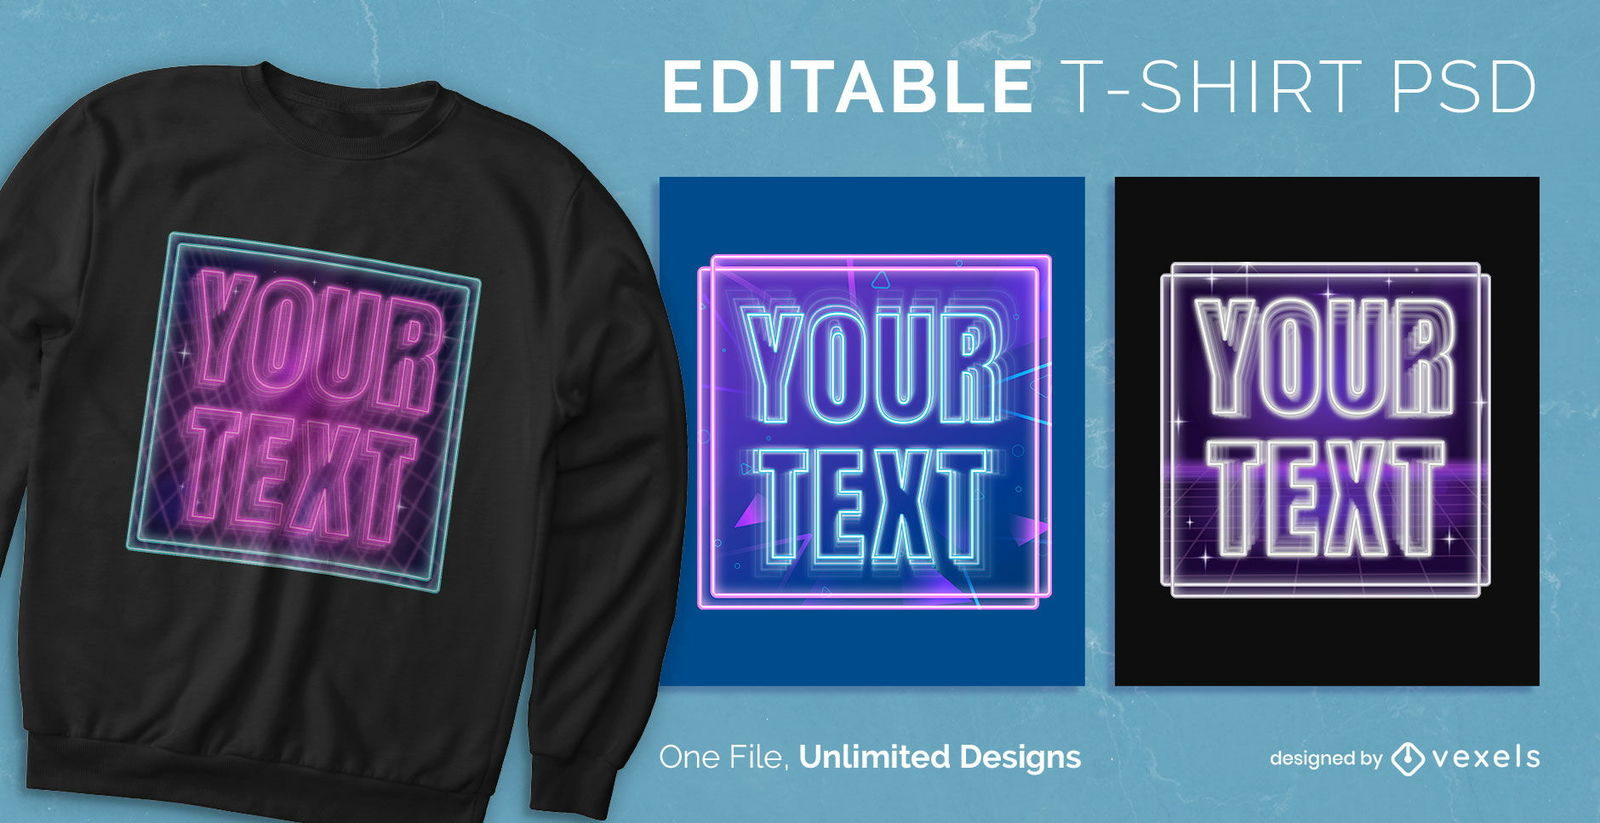
Neon vaporwave assina camiseta escalável psd
Pronto para imprimir
para Merch
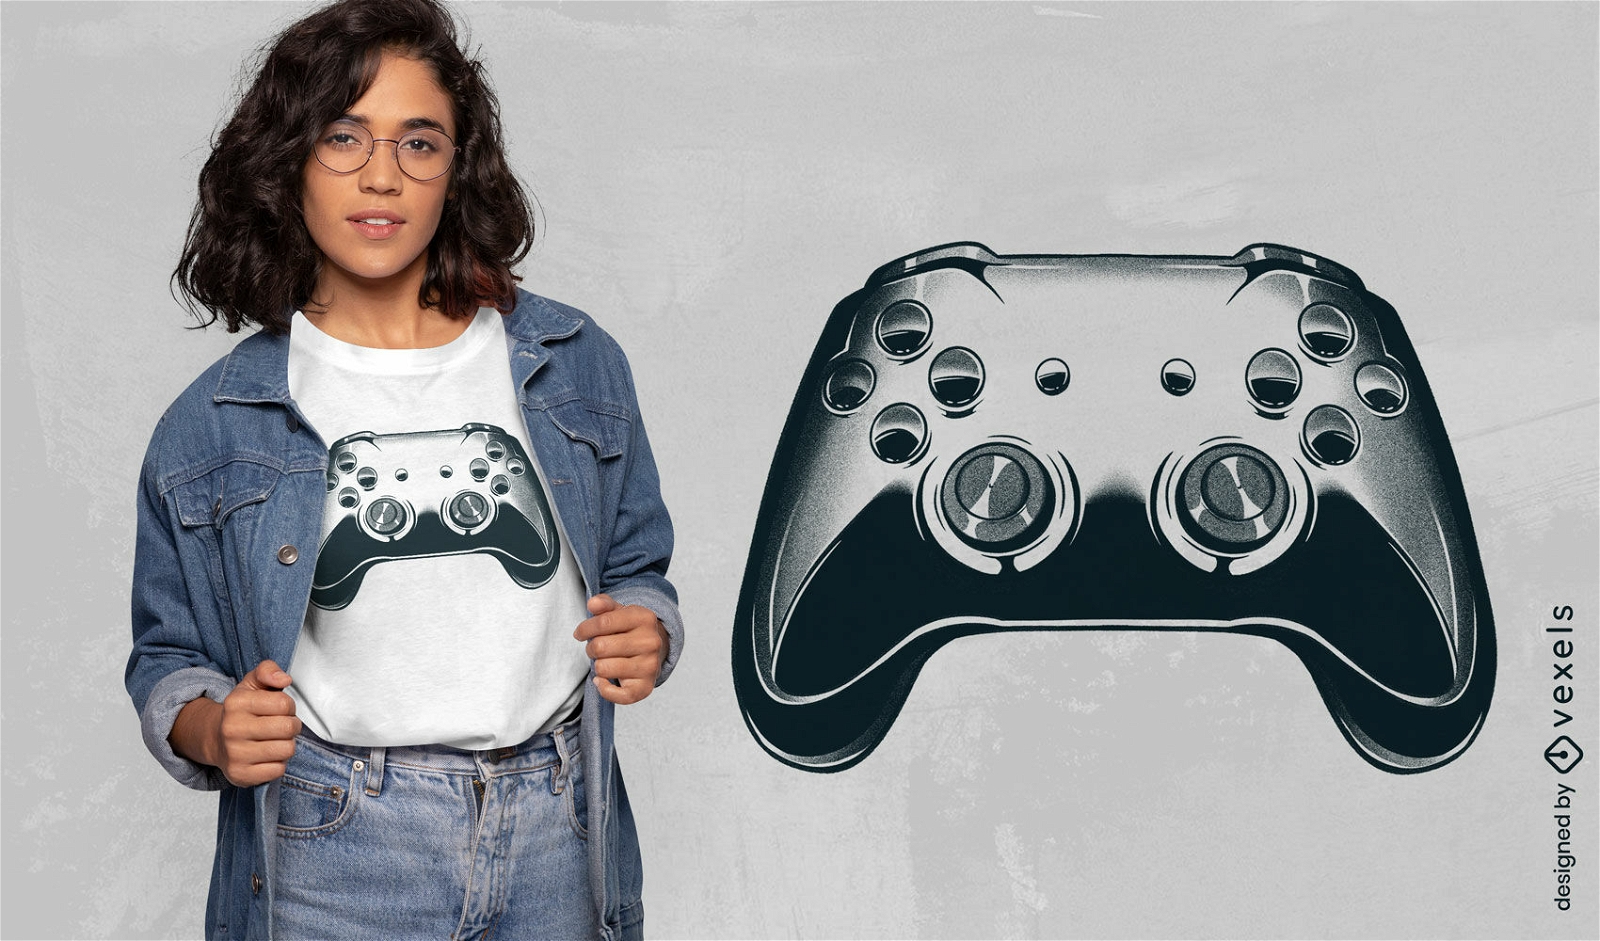
Joystick prateado para design de camisetas de jogos
Escolha uma pasta
Todos os favoritos
Criar novo
Salvar
Joystick prateado para design de camisetas de jogos
Pronto para imprimir
para Merch
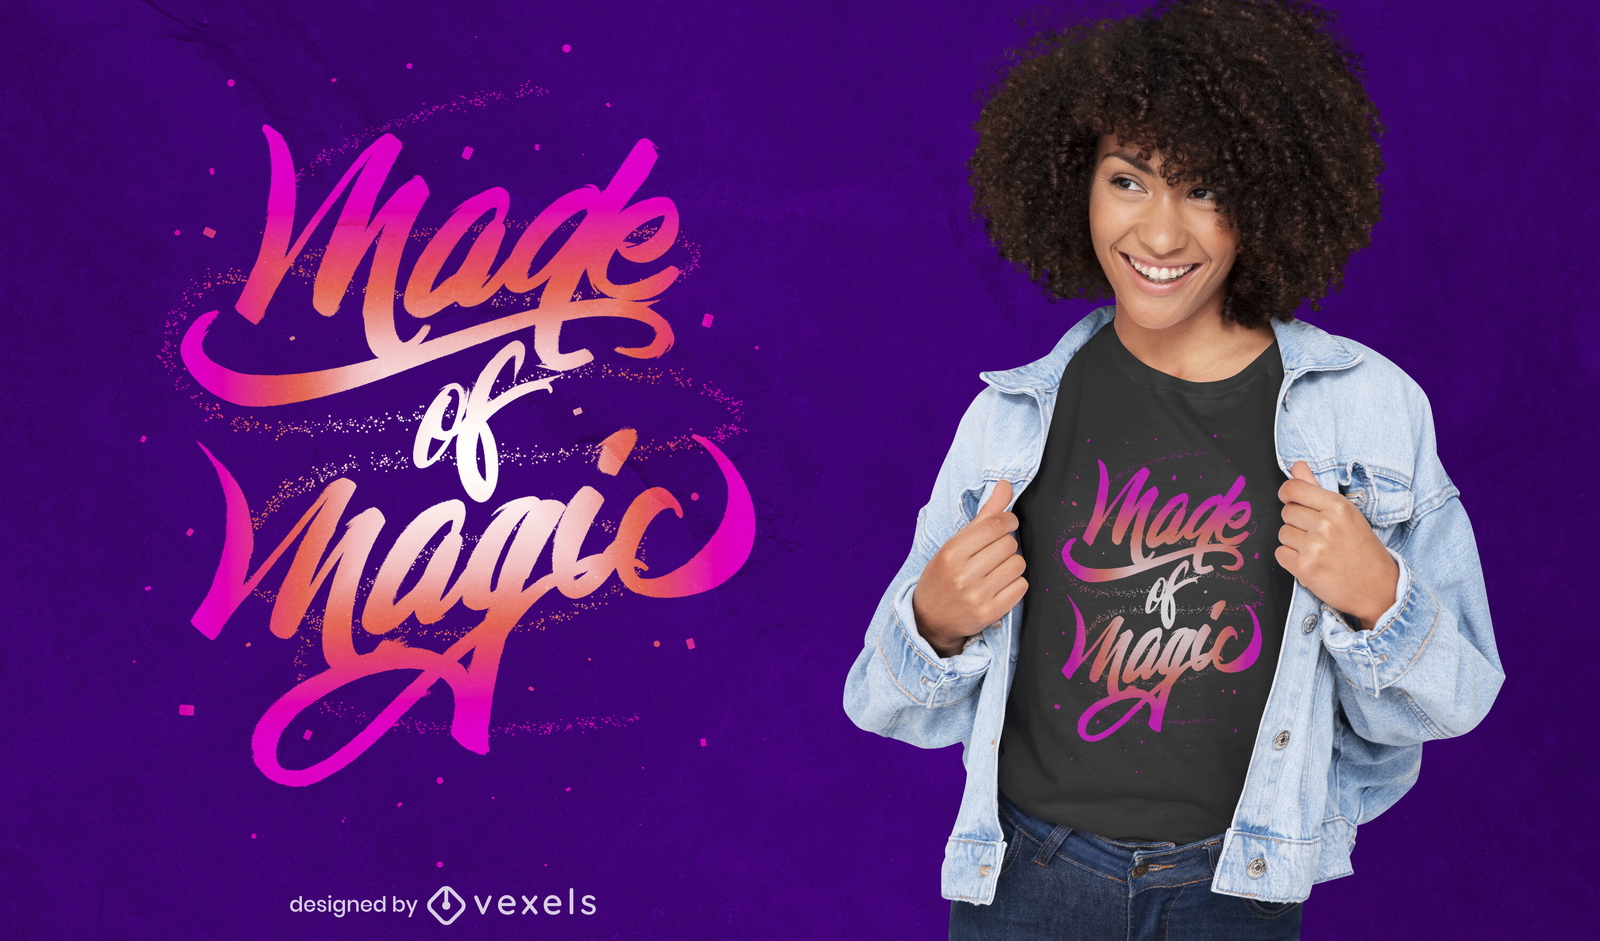
Feito de letras mágicas com design de camiseta psd
Escolha uma pasta
Todos os favoritos
Criar novo
Salvar
Feito de letras mágicas com design de camiseta psd
Pronto para imprimir
para Merch
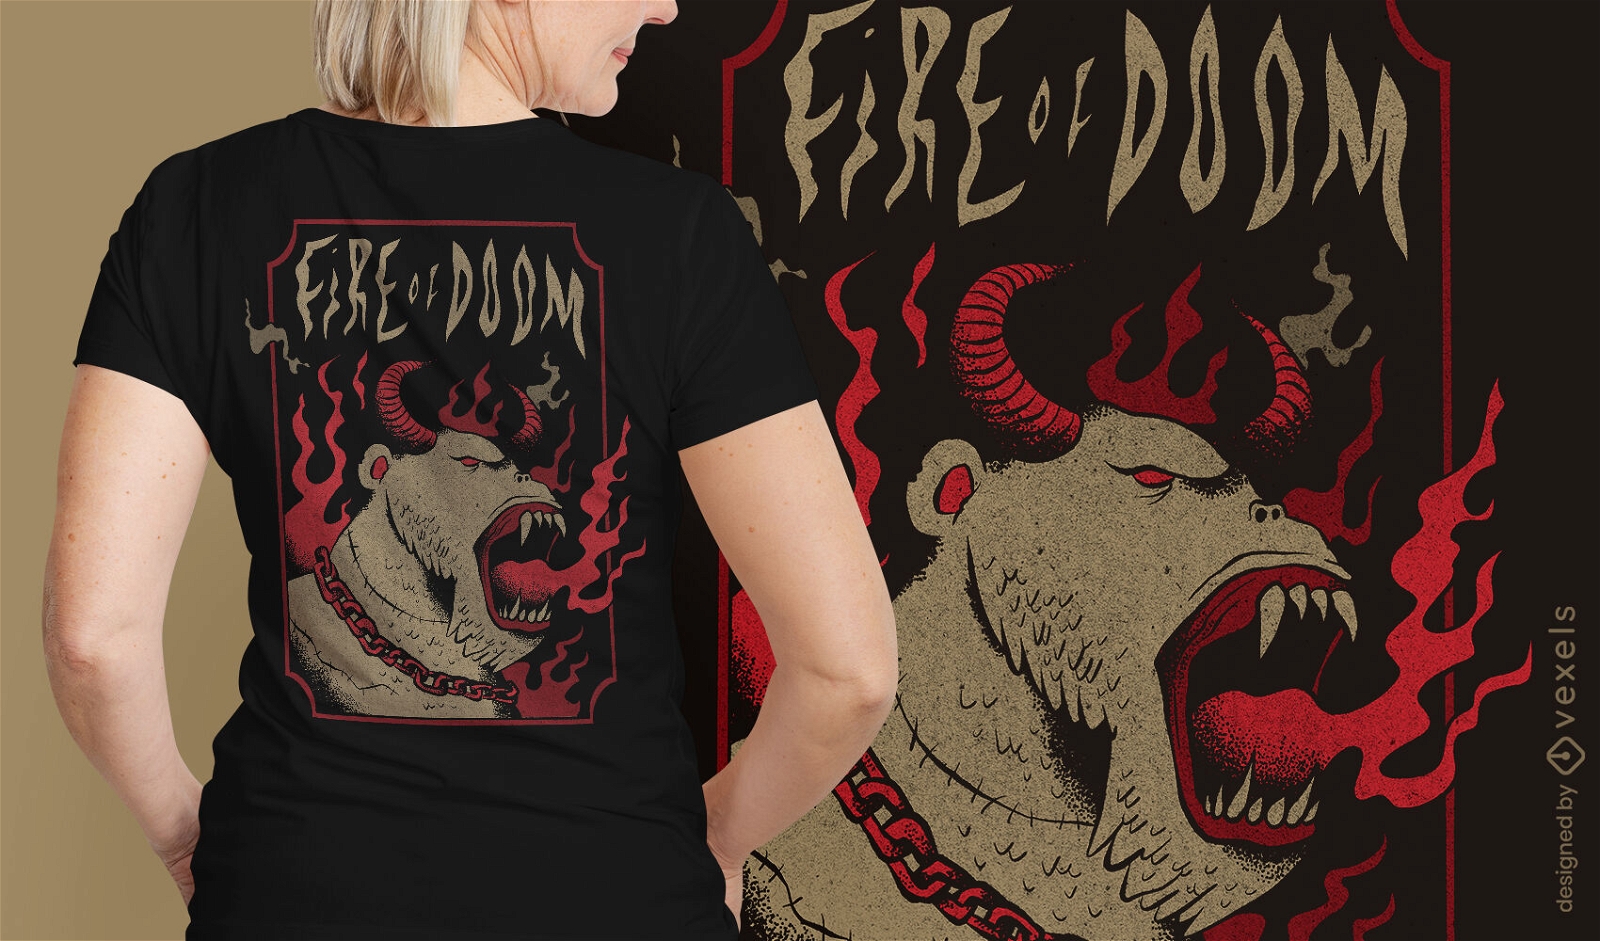
Camiseta criatura do inferno com chifres psd
Escolha uma pasta
Todos os favoritos
Criar novo
Salvar
Camiseta criatura do inferno com chifres psd
Impulsione seu negócio
Com a plataforma gráfica líder de mercado.
Ver planos
Próxima
do 67
prev page
next page