Biblioteca de design
Novos designs Merch
Camisetas
Vectores
Designs de Merch de Tendência
PNGs & SVGs
Mockups
Modelos de T-Shirt PSD
Explorar Desenhos
Designs KDP
Pôsteres
Canecas
Capas para celular
Sacos de compras
Almofadas
Ferramentas de desenho
Merch Designer
Novo!
Mockup Generator
Gerador de Design de AI
Vetorizador
Quote Generator
T-Shirt Maker (Antigo)
Ajuda
Merch Digest
Blog
Centro de Ajuda
Saiba mais sobre o Merch
Feedback
Soluções Corporativas
Empresa
Acesso à API
Estúdio de Design
Design em Lote
Preços
Carregando...
Inscrever-se
Conecte-se
PSD Templates
graficos
Biblioteca de design
Novos designs Merch
Camisetas
Vectores
Designs de Merch de Tendência
PNGs & SVGs
Mockups
Modelos de T-Shirt PSD
Explorar Desenhos
Designs KDP
Pôsteres
Canecas
Capas para celular
Sacos de compras
Almofadas
Ferramentas de desenho
Merch Designer
Novo!
Mockup Generator
Gerador de Design de AI
Vetorizador
Quote Generator
T-Shirt Maker (Antigo)
Ajuda
Merch Digest
Blog
Centro de Ajuda
Saiba mais sobre o Merch
Feedback
Soluções Corporativas
Empresa
Acesso à API
Estúdio de Design
Design em Lote
PLANOS
PSD Templates
graficos
3308 Designs de Camisetas e Mockups PSD de graficos
Baixar designs de camisetas ou mockups PSD editáveis de graficos
Relacionado:
graficos vetoriais
,
desenhos graficos de ações
,
graficos tridimensionais
Ordenar por
Mais relevante
Resultados patrocinados da
Ganhe 15% de desconto com o código: VEXELS15
veja mais detalhes
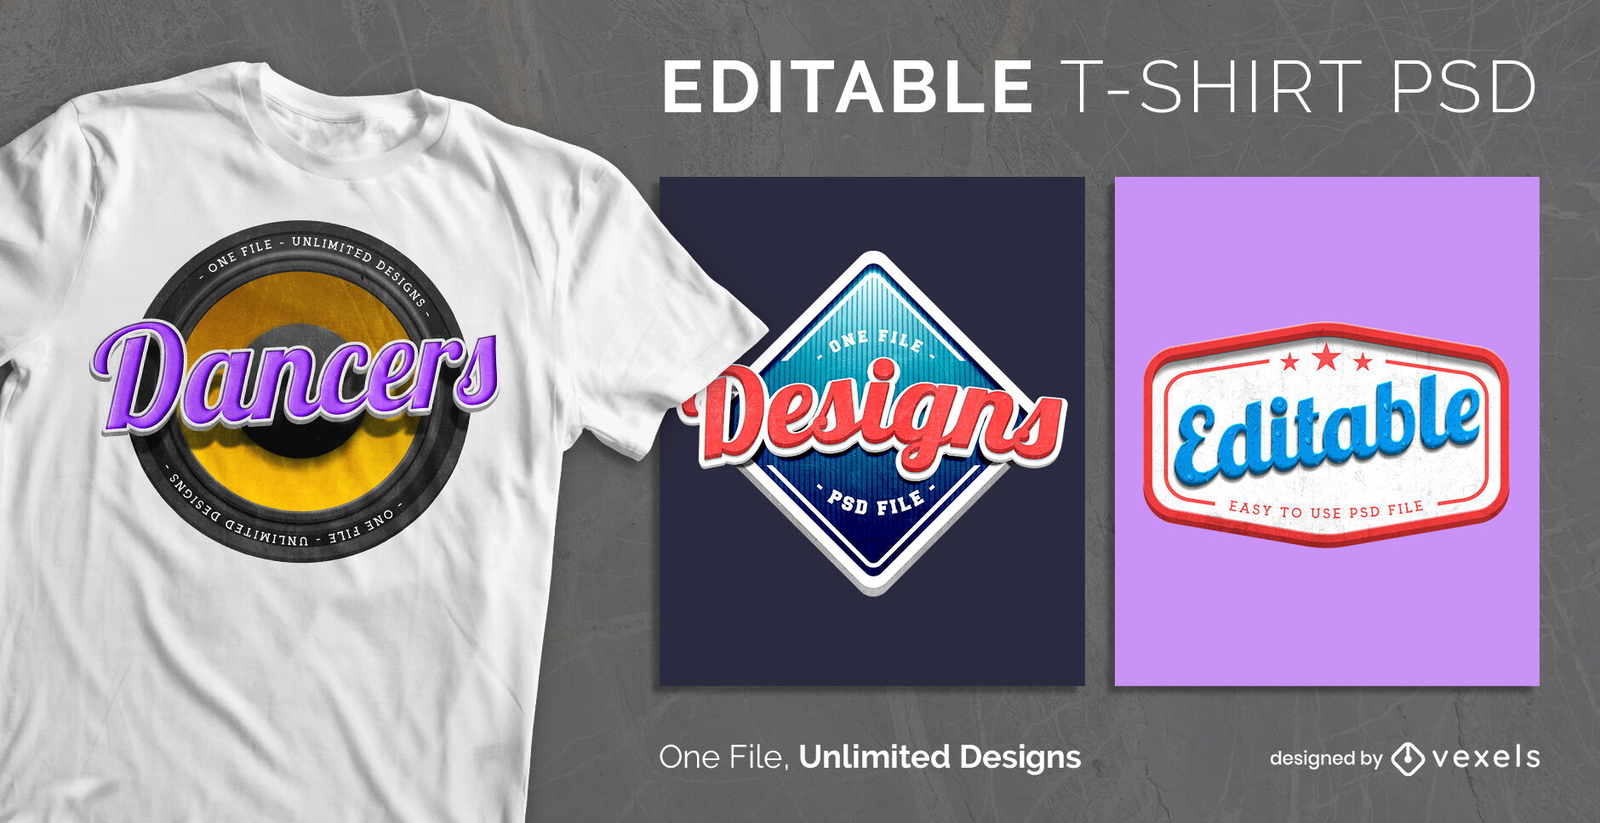
PSD Camisetas
para Merch
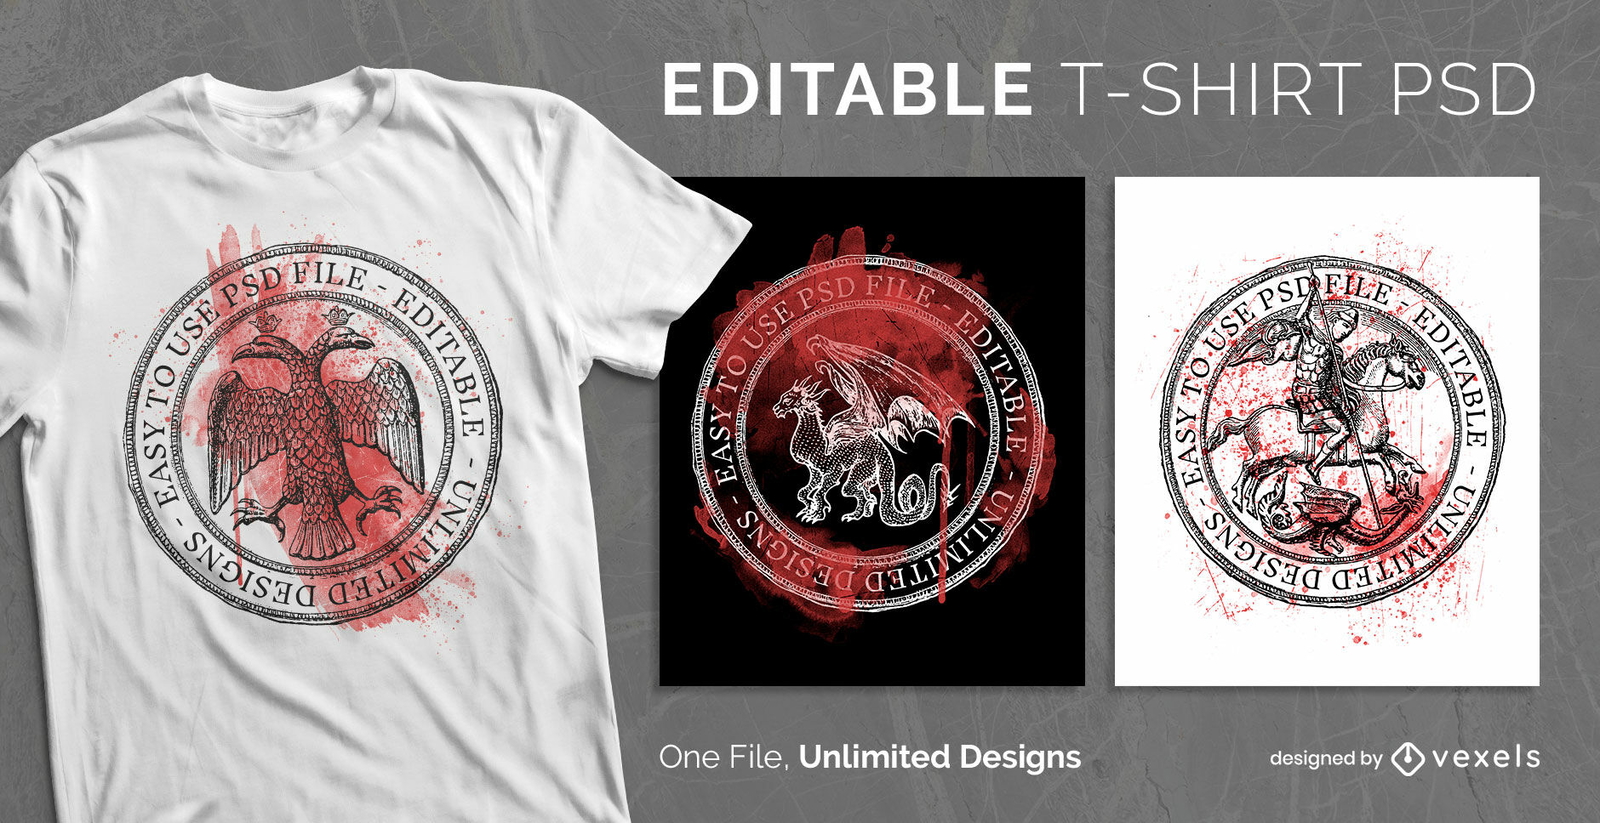
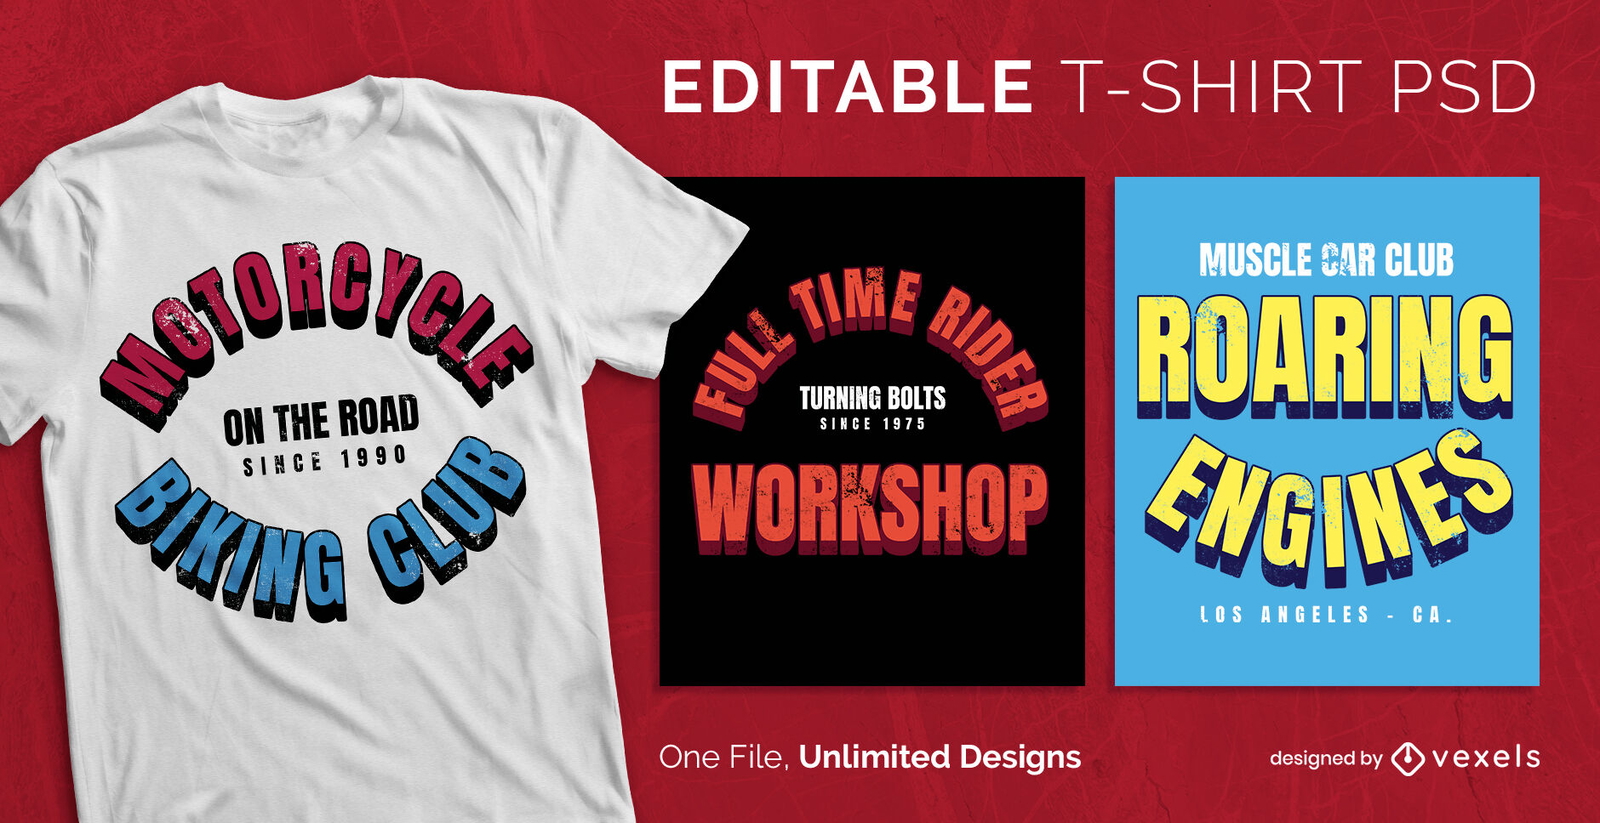
T-shirt com logotipo retro distintivo escalável psd
Escolha uma pasta
Todos os favoritos
Criar novo
Salvar
T-shirt com logotipo retro distintivo escalável psd
Pronto para imprimir
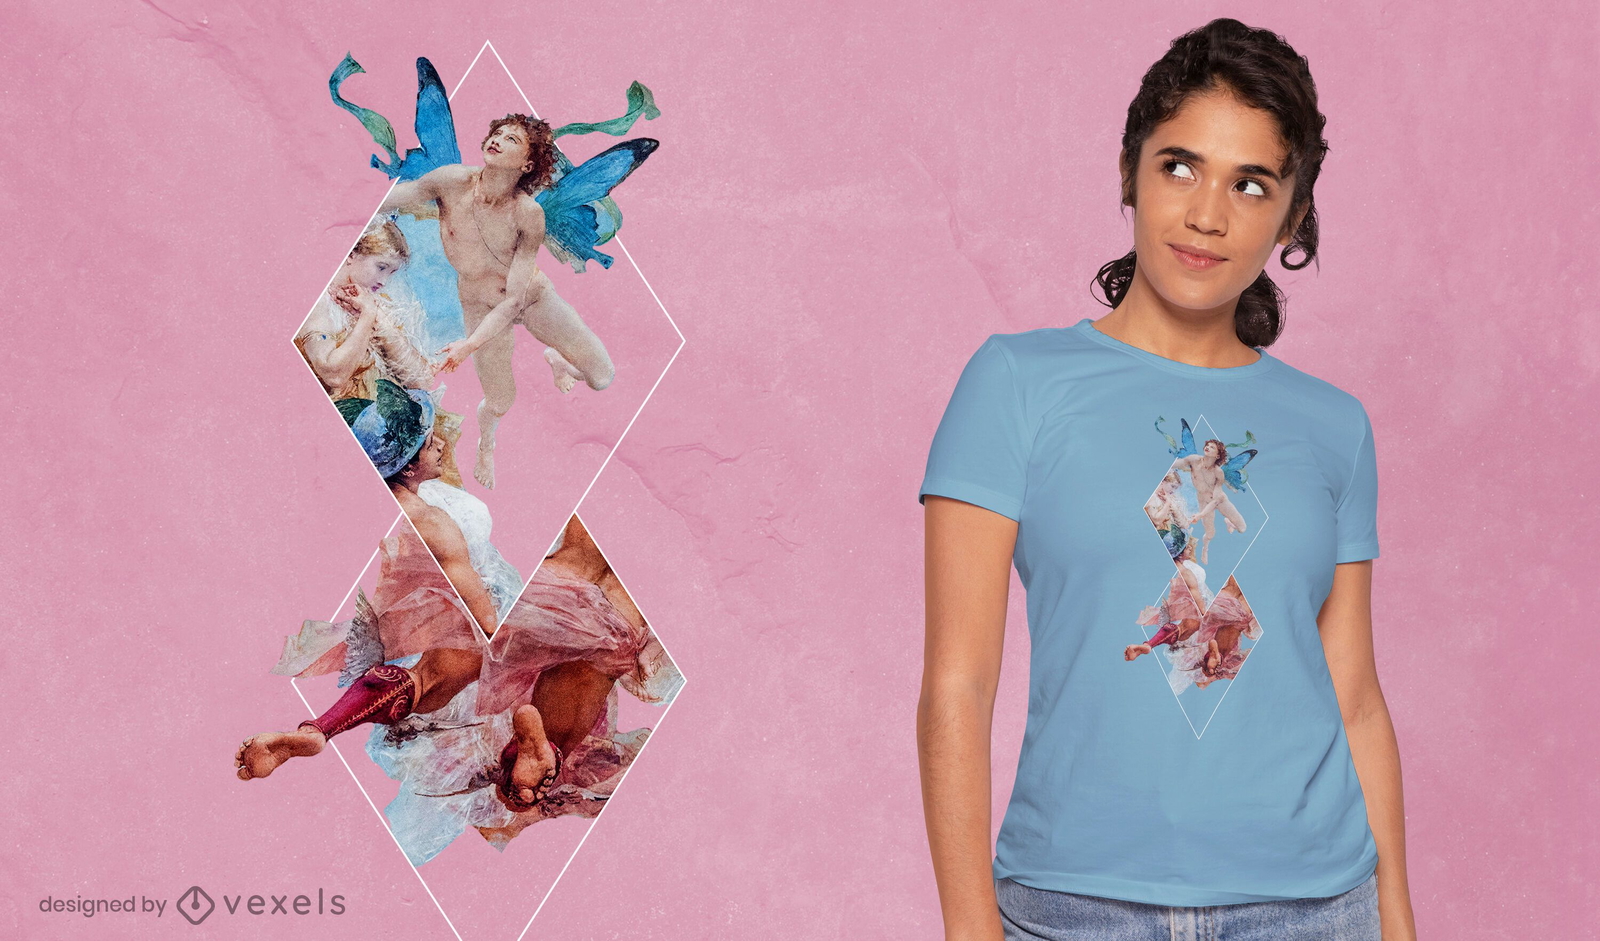
para Merch
Geometric angels PSD t-shirt design
Escolha uma pasta
Todos os favoritos
Criar novo
Salvar
Geometric angels PSD t-shirt design
Camiseta PSD escalável
para Merch
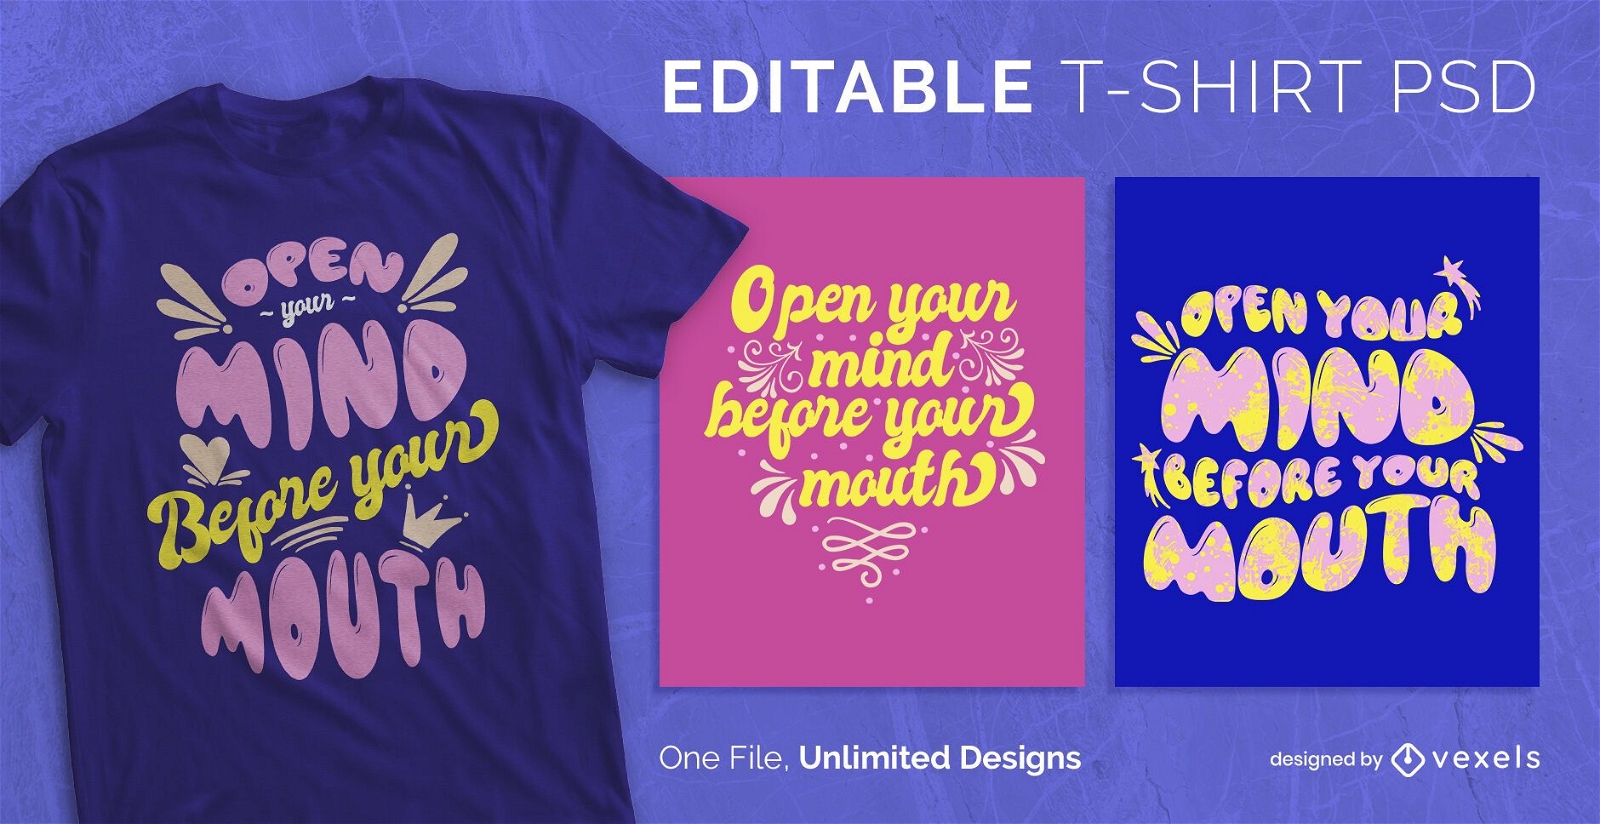
Letras ornamentos redimensionáveis t-shirt psd
Escolha uma pasta
Todos os favoritos
Criar novo
Salvar
Letras ornamentos redimensionáveis t-shirt psd
Camiseta PSD escalável
para Merch
T-shirt escalável Eco psd
Escolha uma pasta
Todos os favoritos
Criar novo
Salvar
T-shirt escalável Eco psd
Camiseta PSD escalável
para Merch
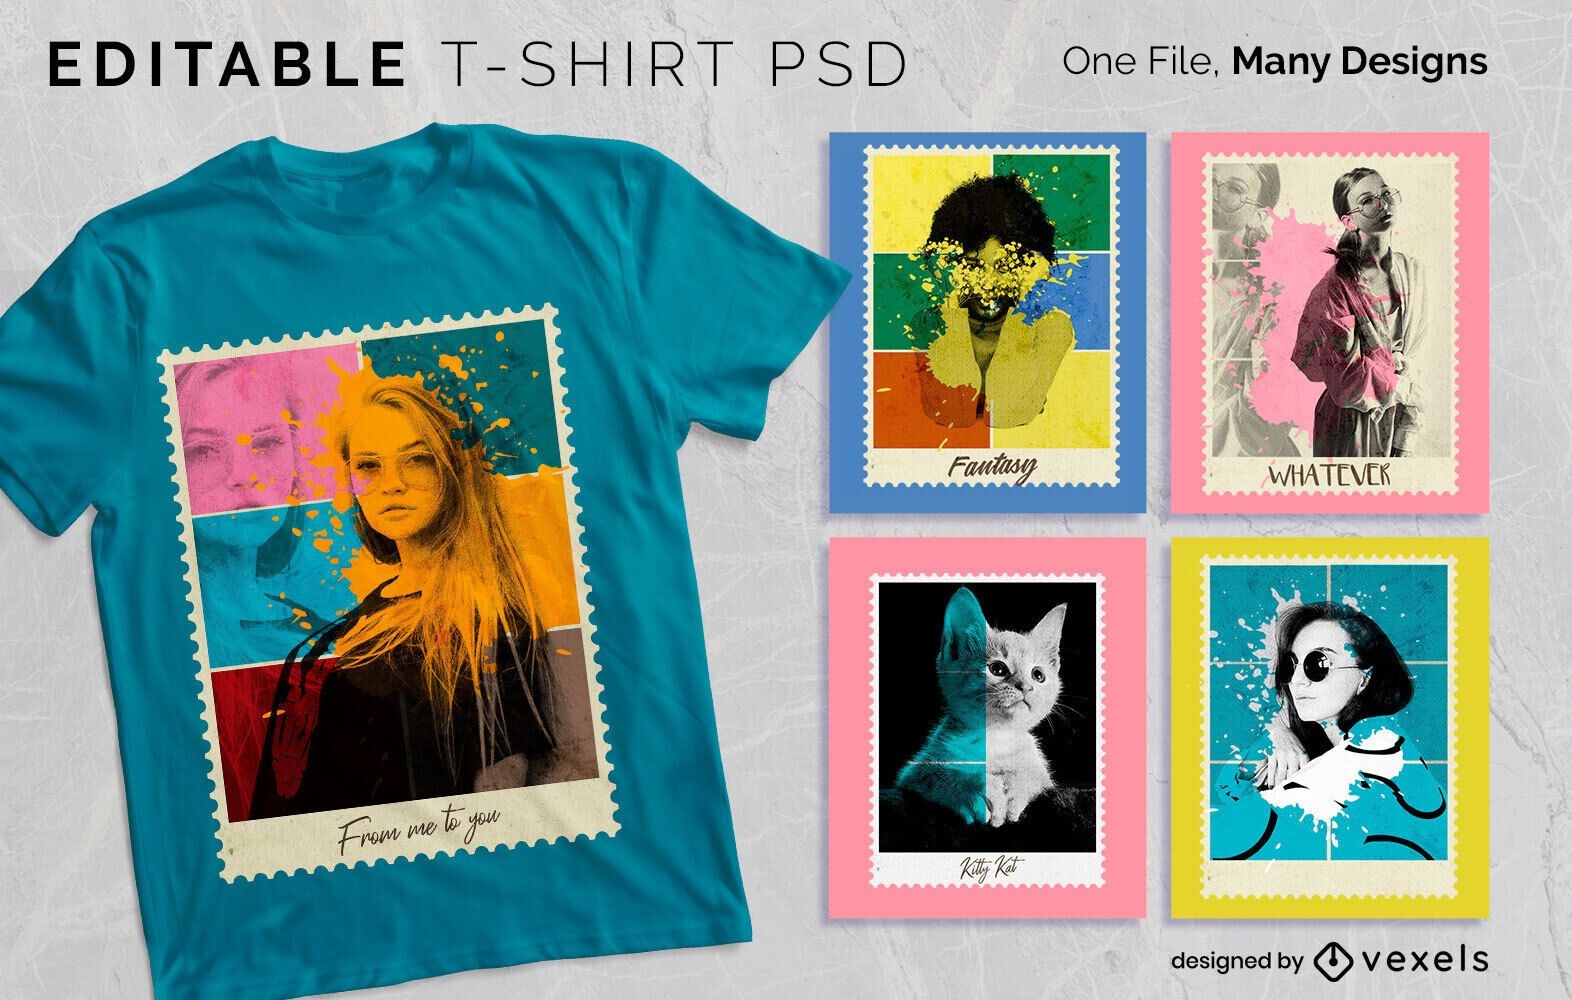
Postal Photo T-shirt Design PSD
Escolha uma pasta
Todos os favoritos
Criar novo
Salvar
Postal Photo T-shirt Design PSD
Pronto para imprimir
para Merch
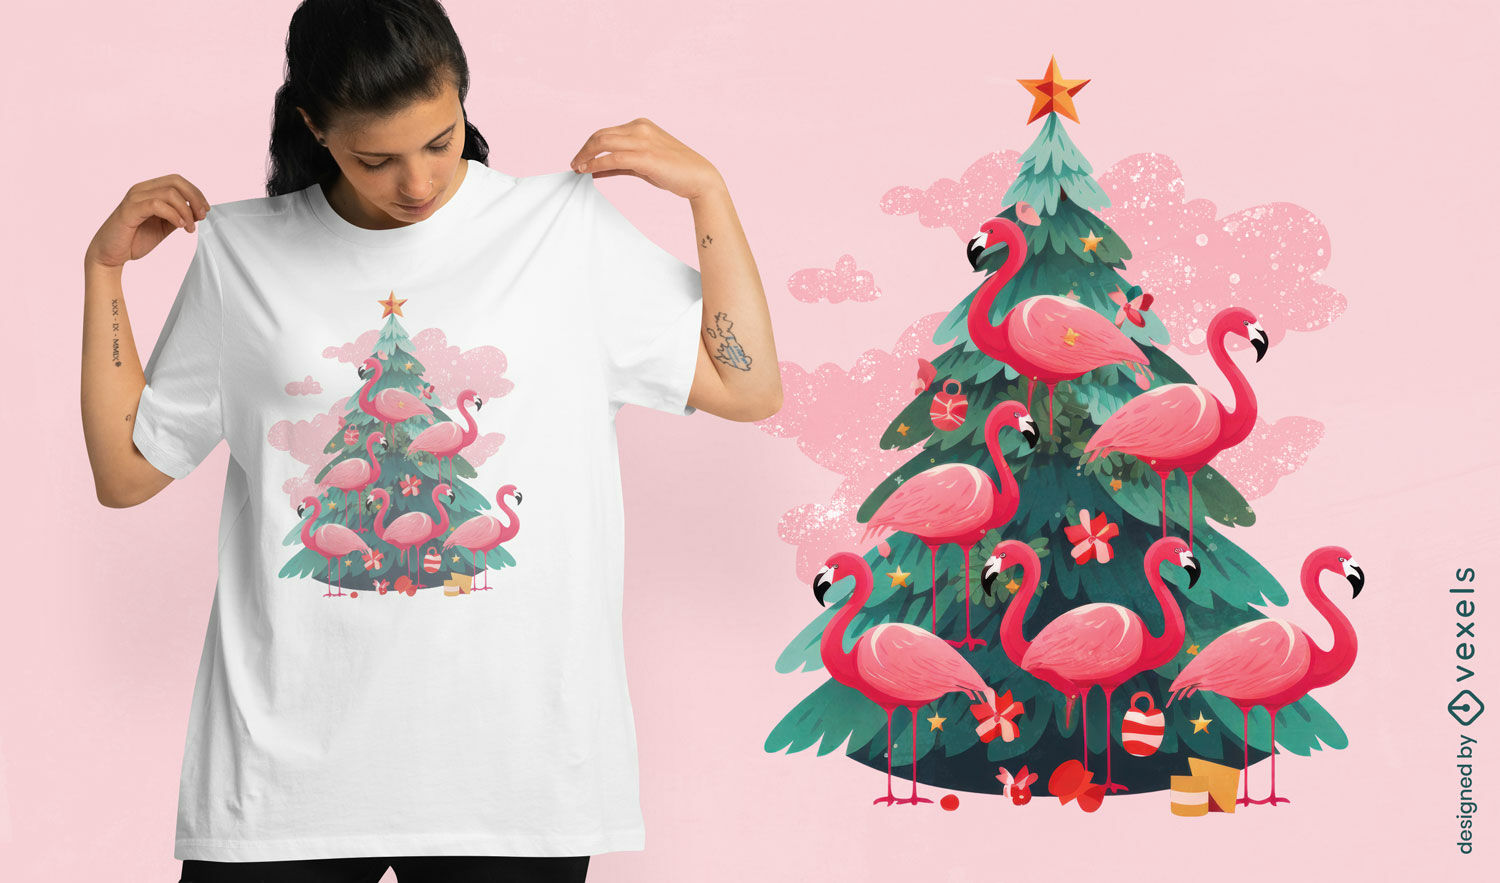
Design de camiseta de árvore de natal de flamingos rosa
Escolha uma pasta
Todos os favoritos
Criar novo
Salvar
Design de camiseta de árvore de natal de flamingos rosa
texto editável
Pronto para imprimir
para Merch
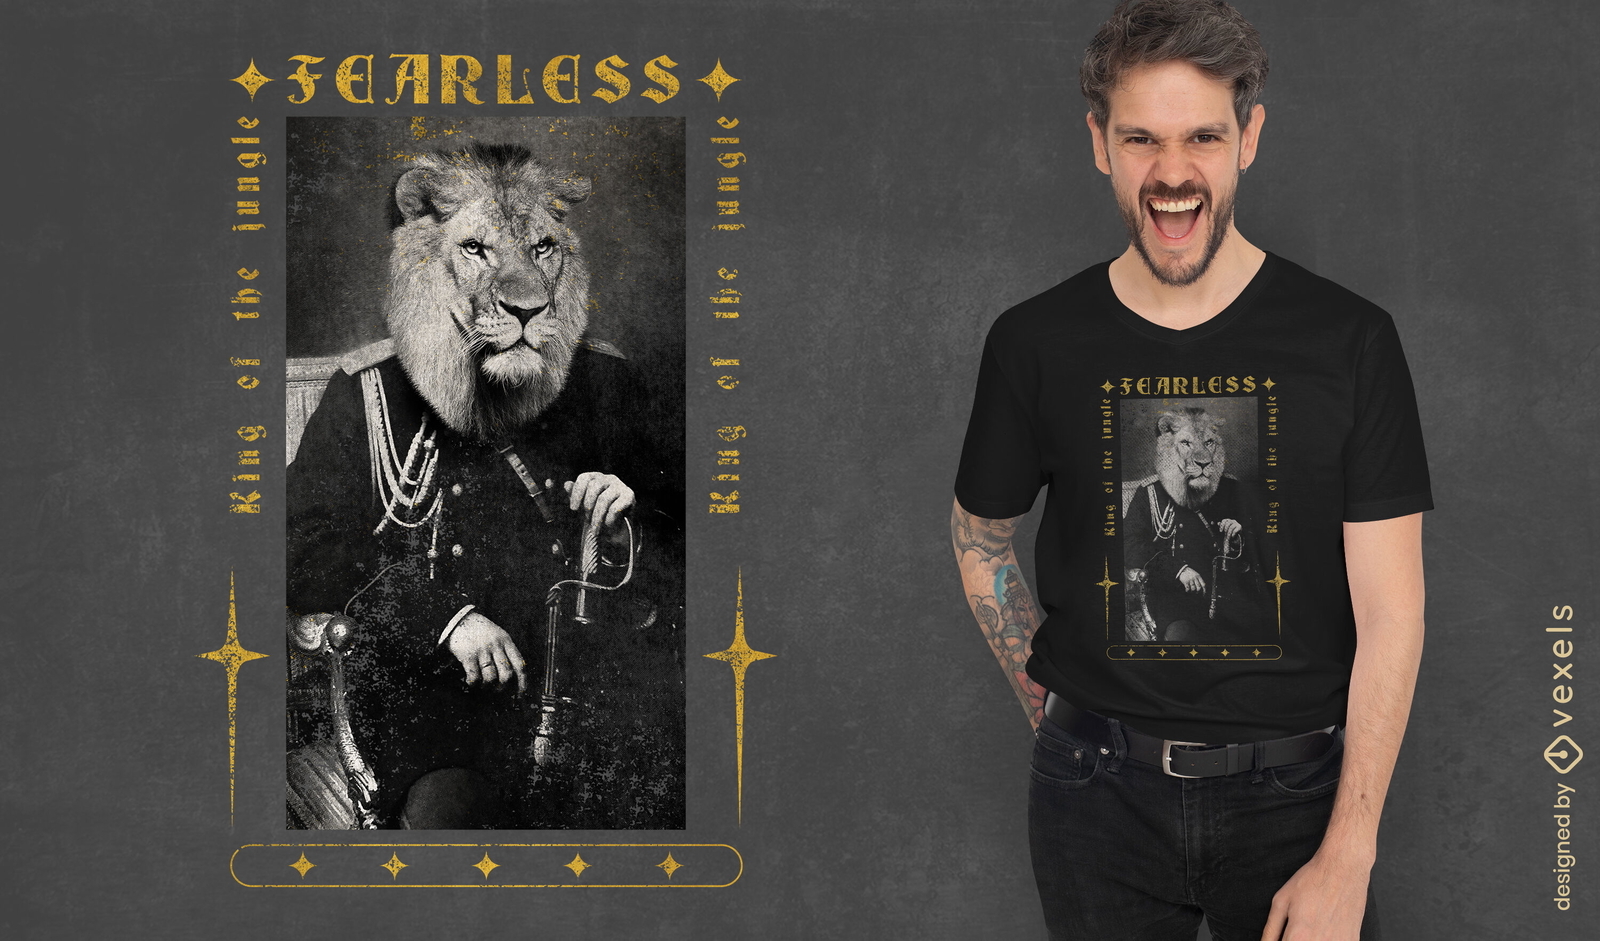
Design de camiseta psd de retrato de rei leão
Escolha uma pasta
Todos os favoritos
Criar novo
Salvar
Design de camiseta psd de retrato de rei leão
texto editável
para Merch
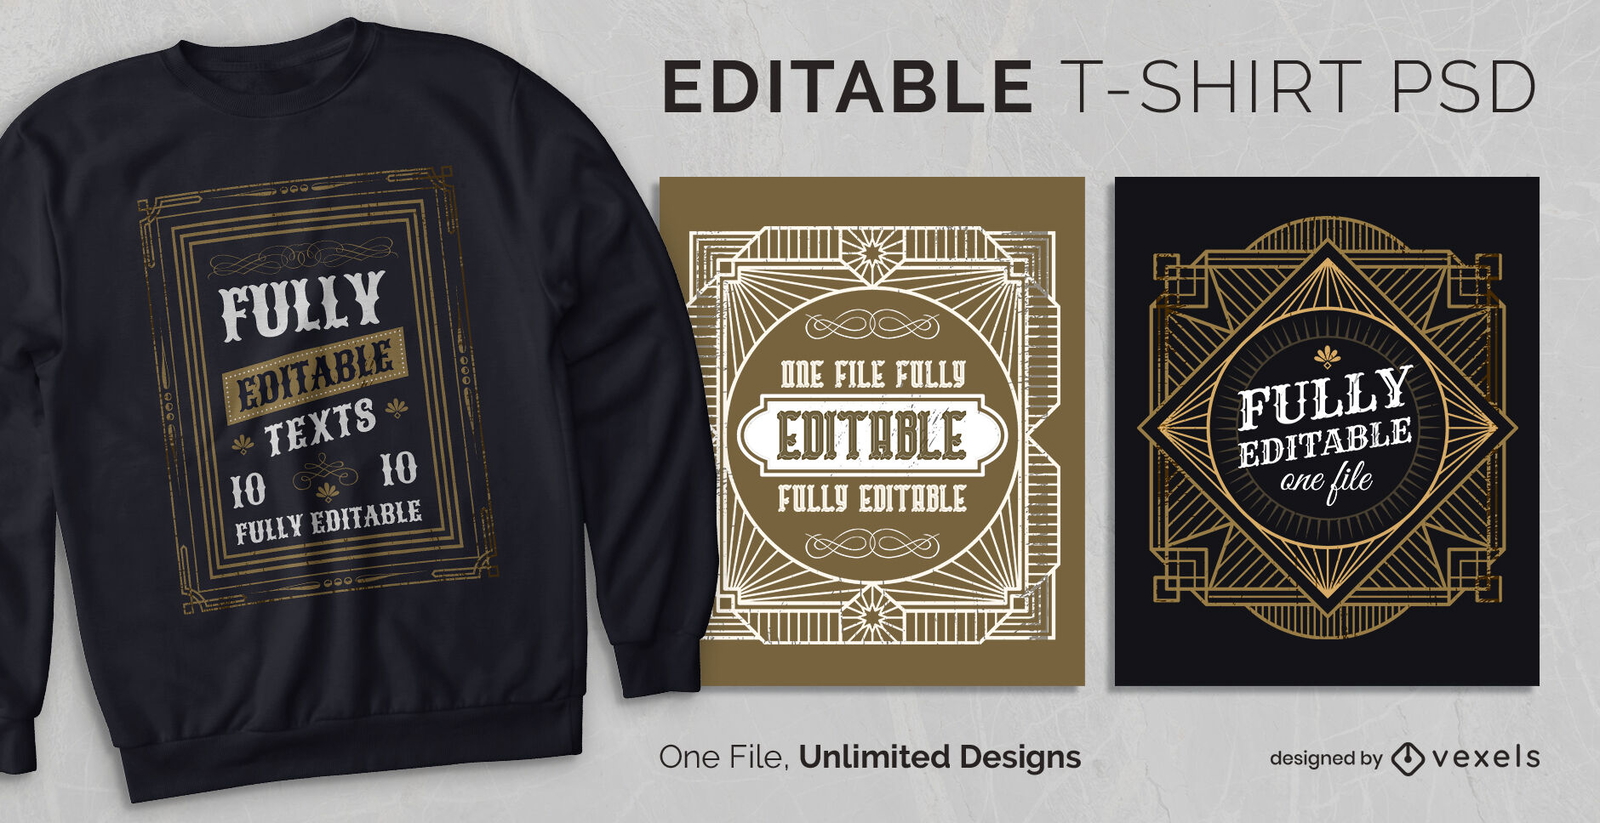
T-shirt escalável vintage art nouveau psd
Escolha uma pasta
Todos os favoritos
Criar novo
Salvar
T-shirt escalável vintage art nouveau psd
texto editável
Pronto para imprimir
para Merch
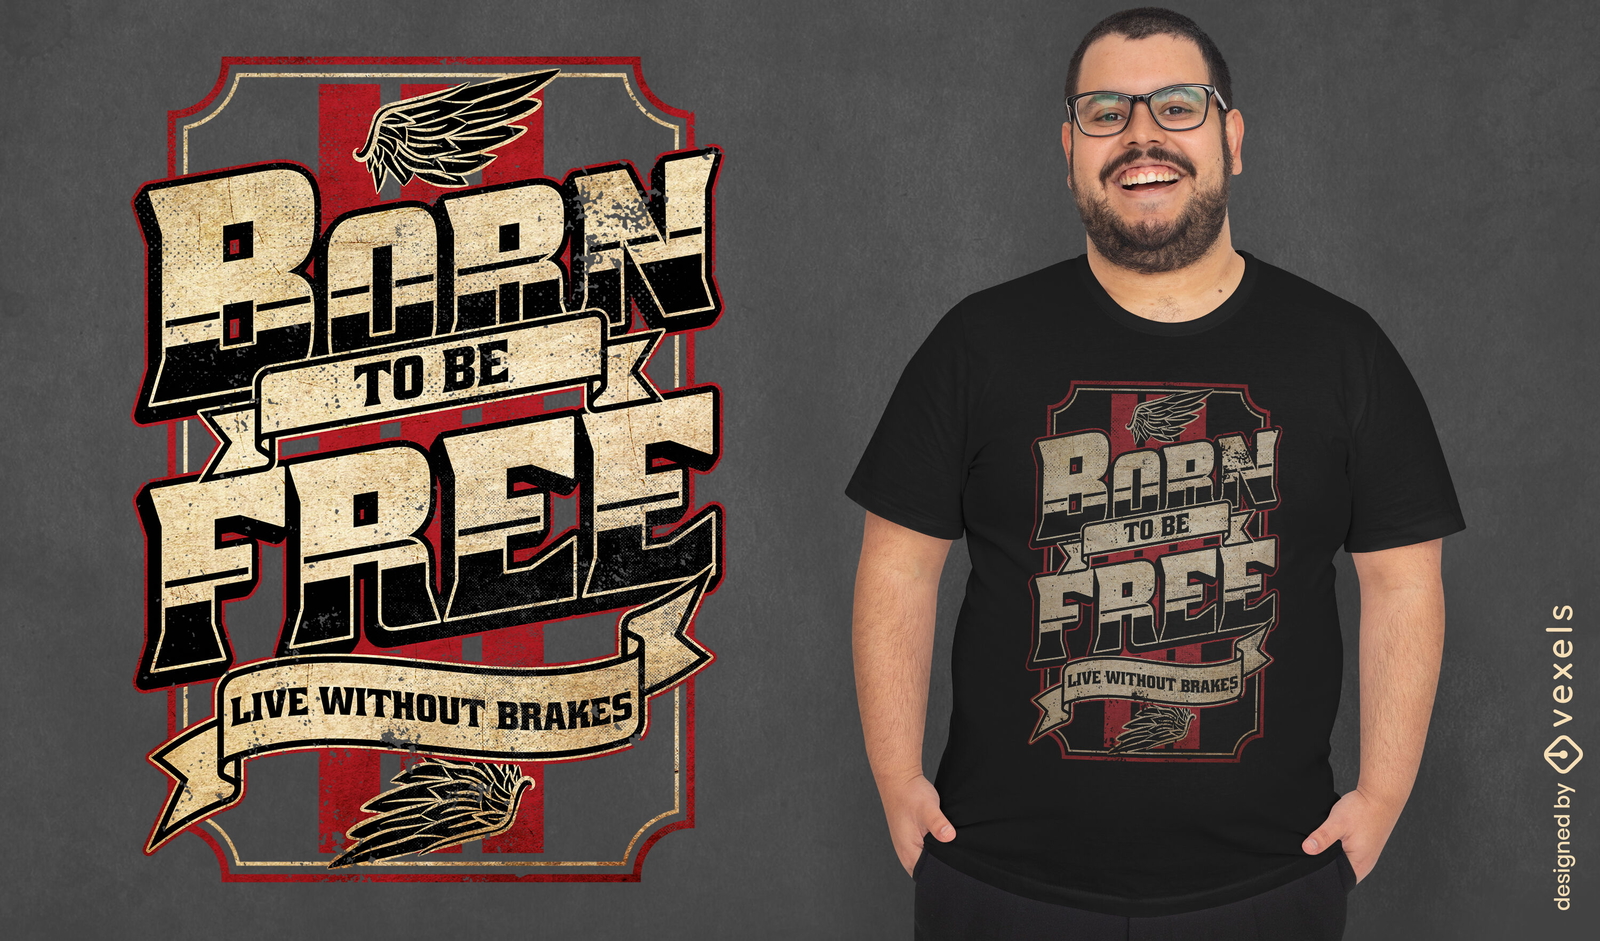
Nascido para ser design de camiseta psd grátis
Escolha uma pasta
Todos os favoritos
Criar novo
Salvar
Nascido para ser design de camiseta psd grátis
texto editável
Pronto para imprimir
para Merch
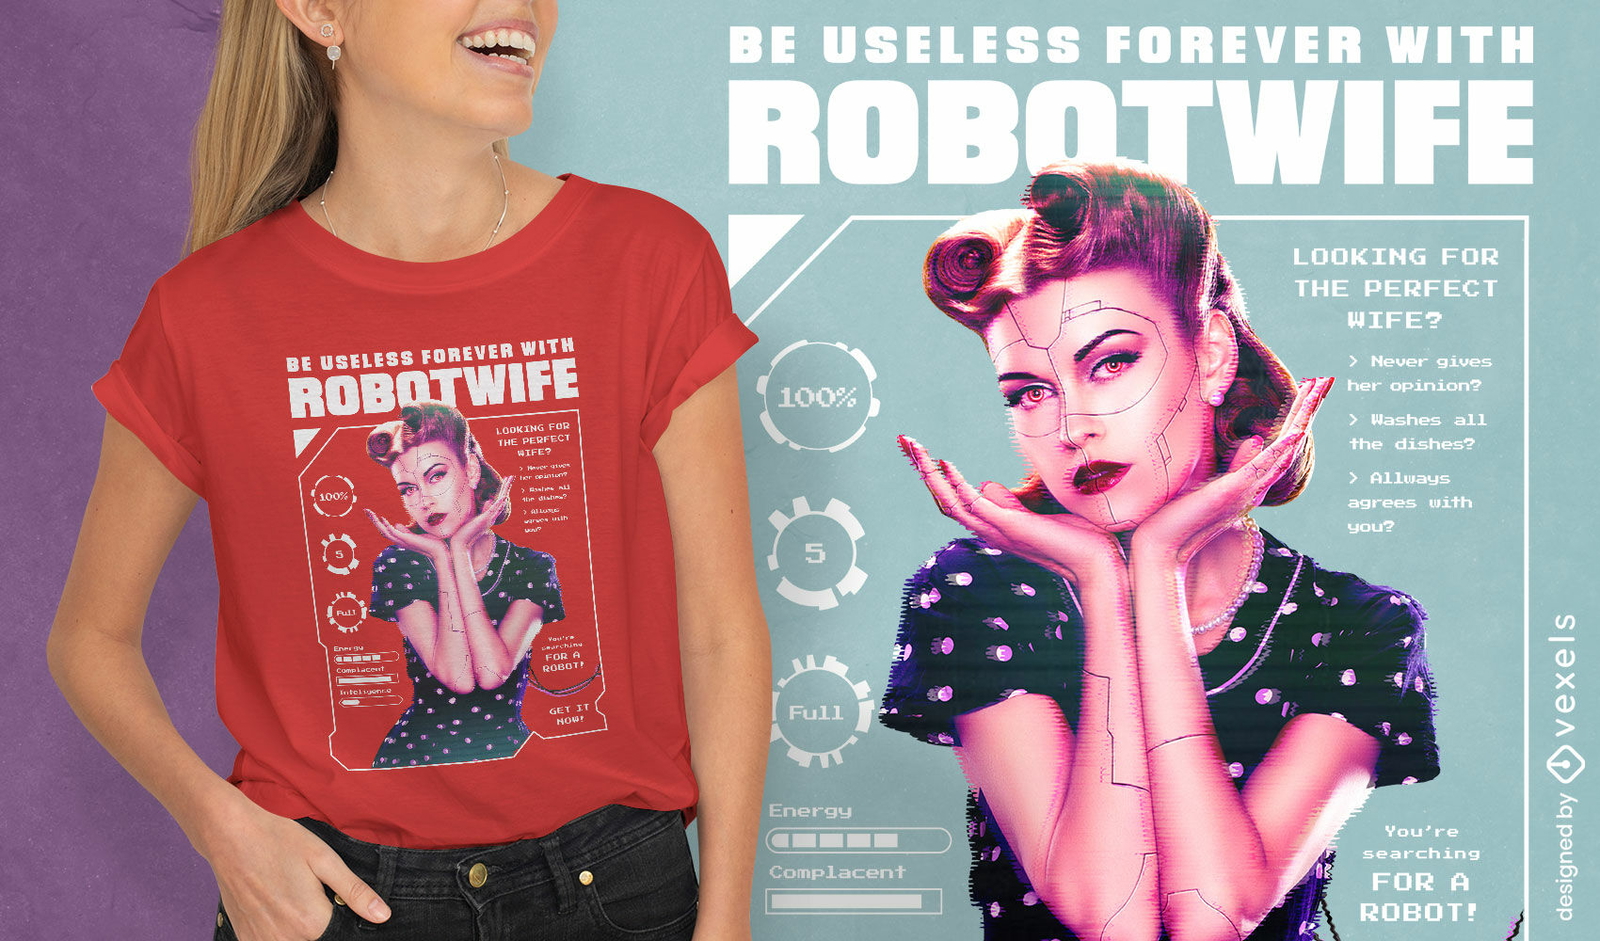
Design de camiseta futurista retrô de esposa robô
Escolha uma pasta
Todos os favoritos
Criar novo
Salvar
Design de camiseta futurista retrô de esposa robô
texto editável
Pronto para imprimir
para Merch
Design de camiseta com citações de relâmpagos
Escolha uma pasta
Todos os favoritos
Criar novo
Salvar
Design de camiseta com citações de relâmpagos
Camiseta PSD escalável
para Merch
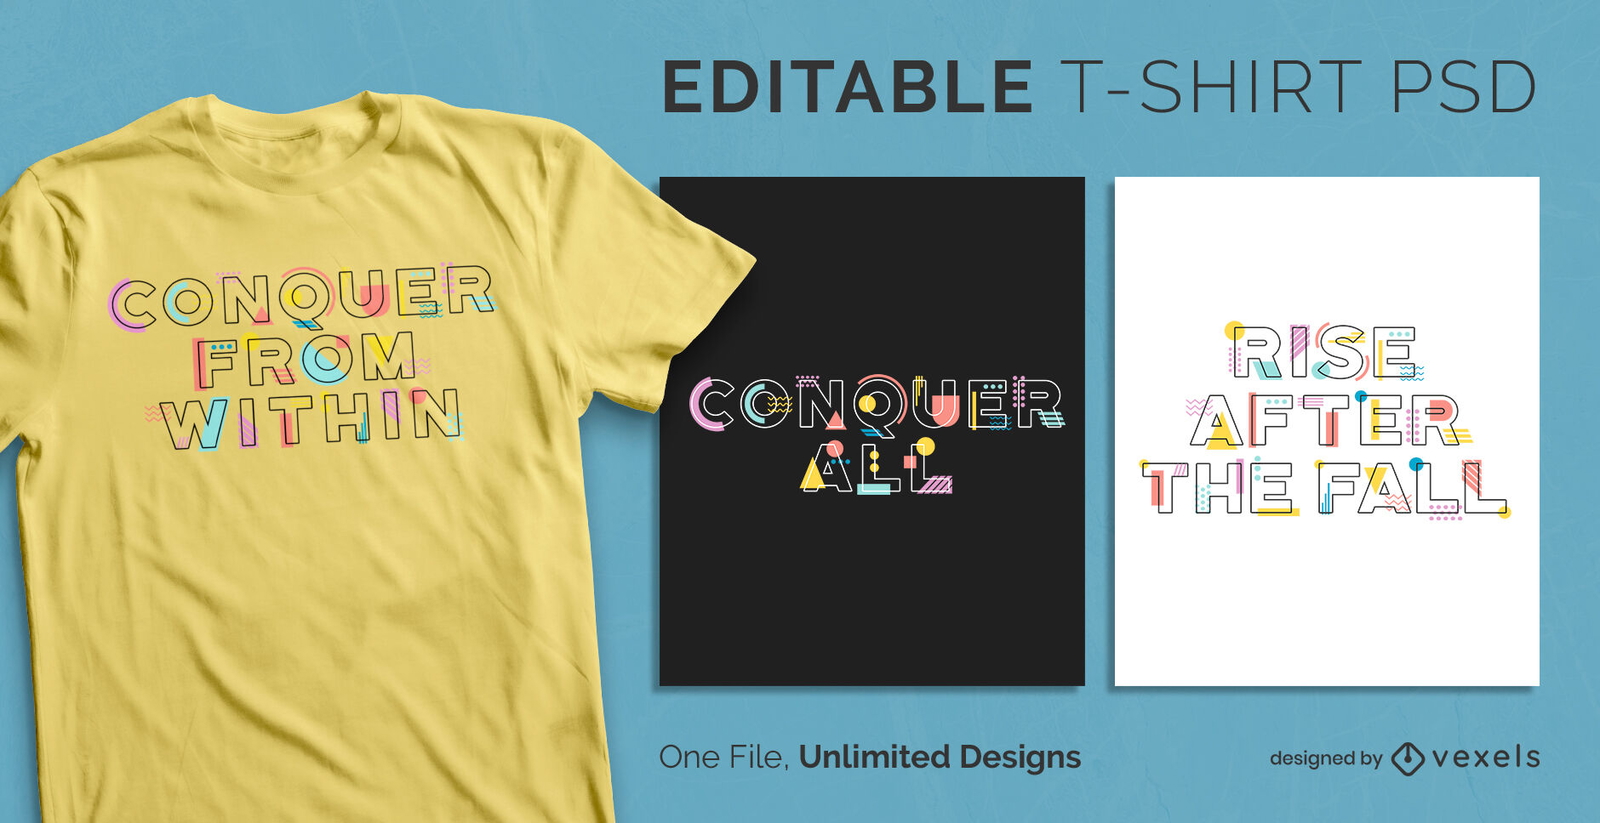
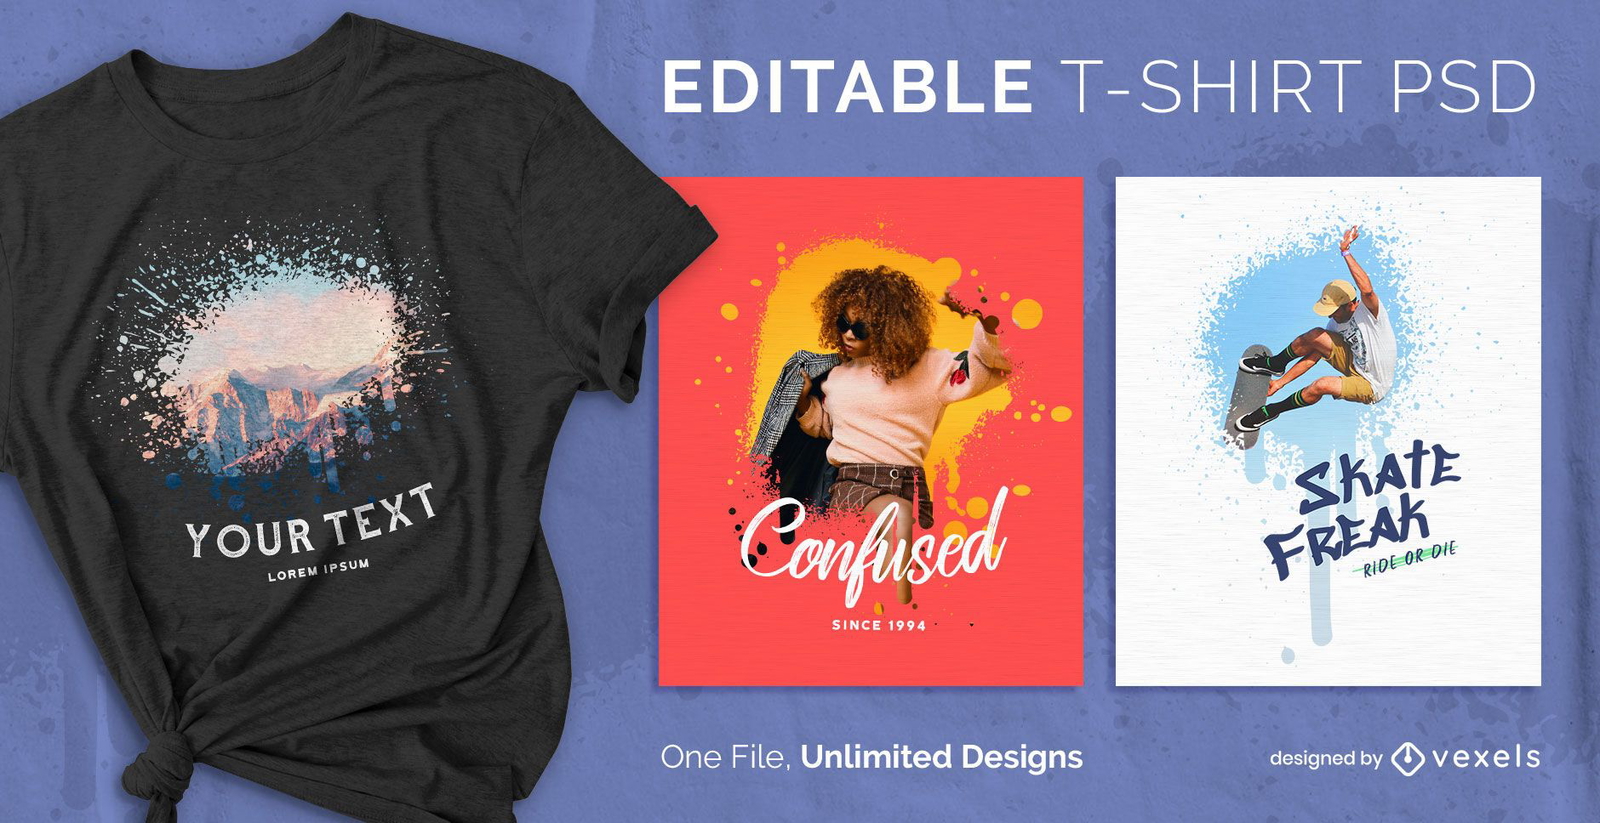
Modelo de design de t-shirt psd escalonável de texto de formas abstratas
Escolha uma pasta
Todos os favoritos
Criar novo
Salvar
Modelo de design de t-shirt psd escalonável de texto de formas abstratas
Pronto para imprimir
para Merch
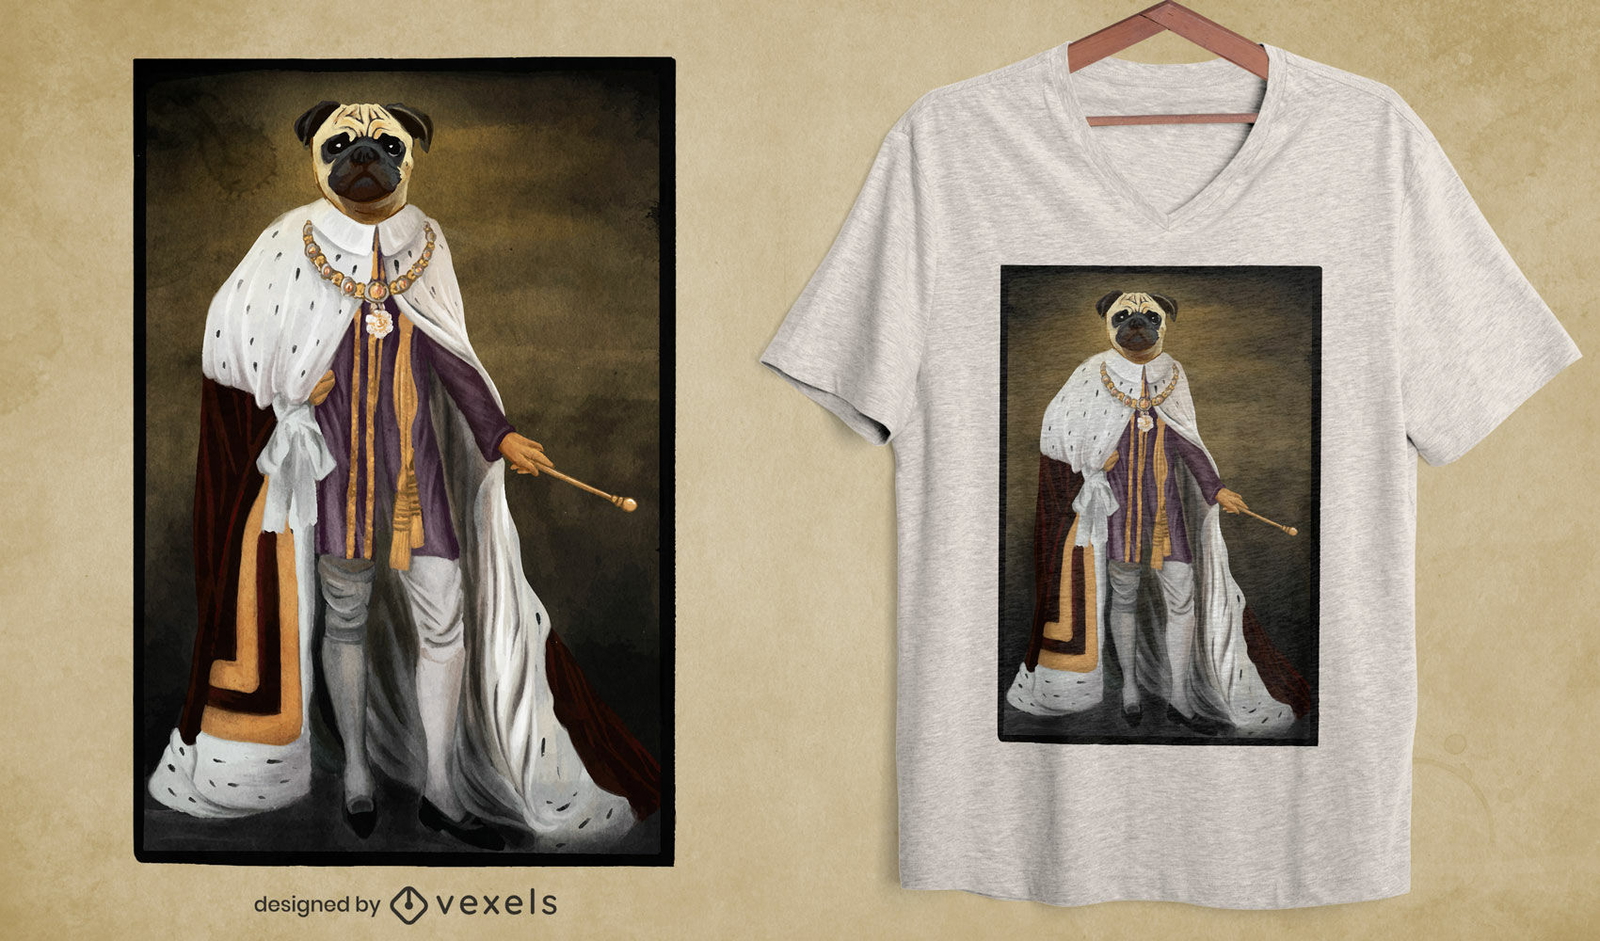
Design de t-shirt psd de cão pug royalty
Escolha uma pasta
Todos os favoritos
Criar novo
Salvar
Design de t-shirt psd de cão pug royalty
Pronto para imprimir
para Merch
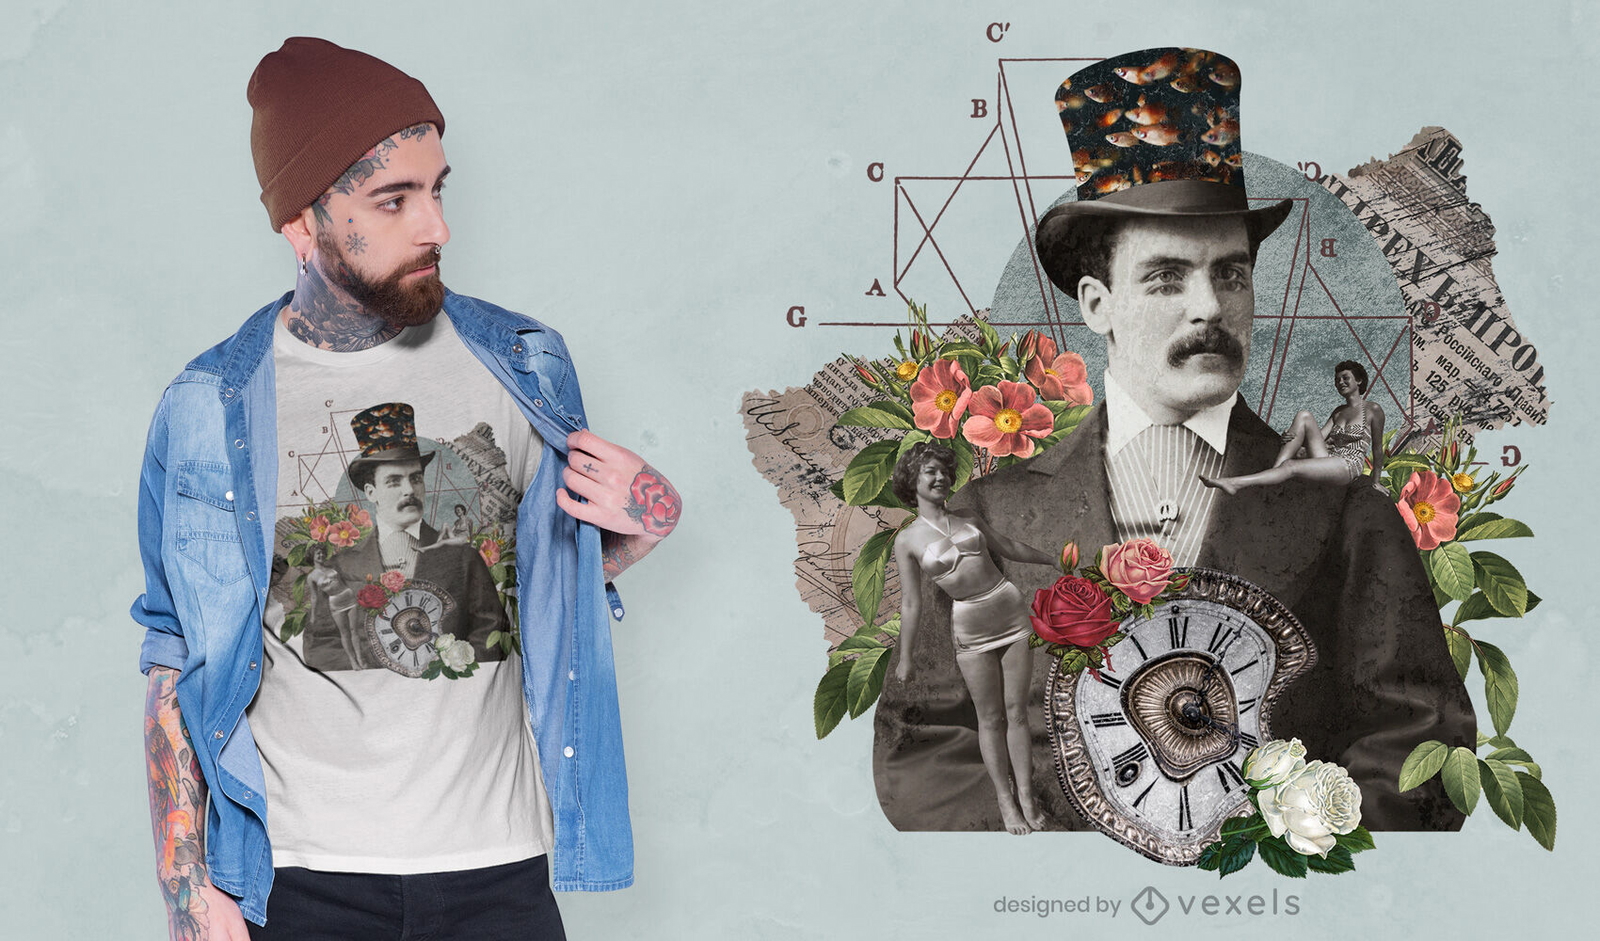
Design de camiseta psd de homem de colagem vintage gótico
Escolha uma pasta
Todos os favoritos
Criar novo
Salvar
Design de camiseta psd de homem de colagem vintage gótico
Camiseta PSD escalável
para Merch
Graffiti escalável t-shirt psd
Escolha uma pasta
Todos os favoritos
Criar novo
Salvar
Graffiti escalável t-shirt psd
Camiseta PSD escalável
para Merch
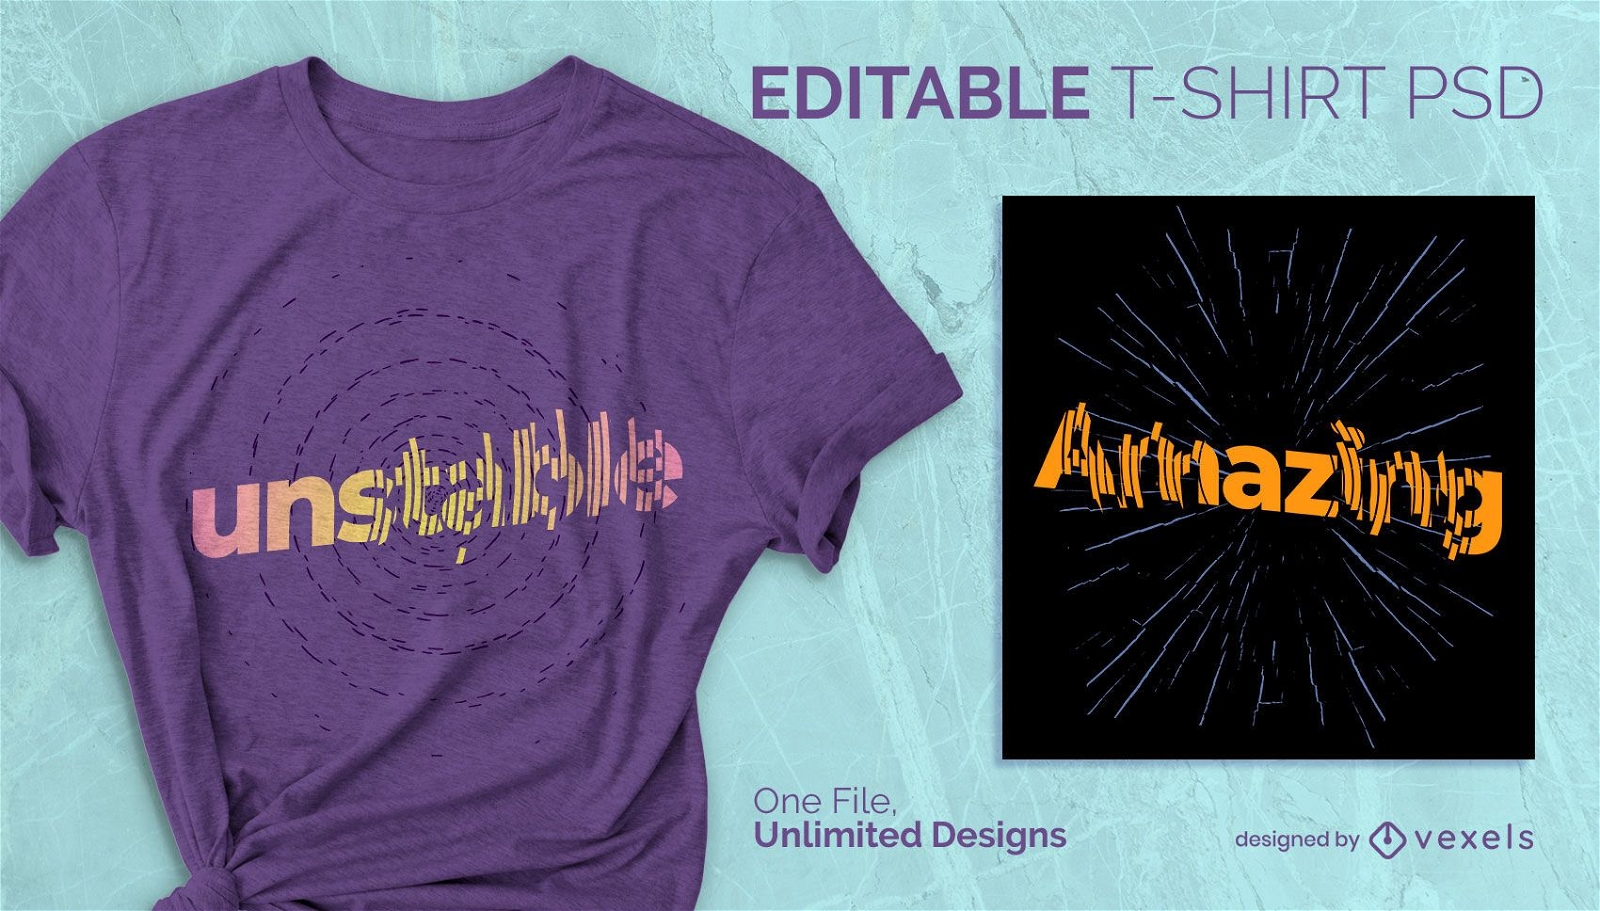
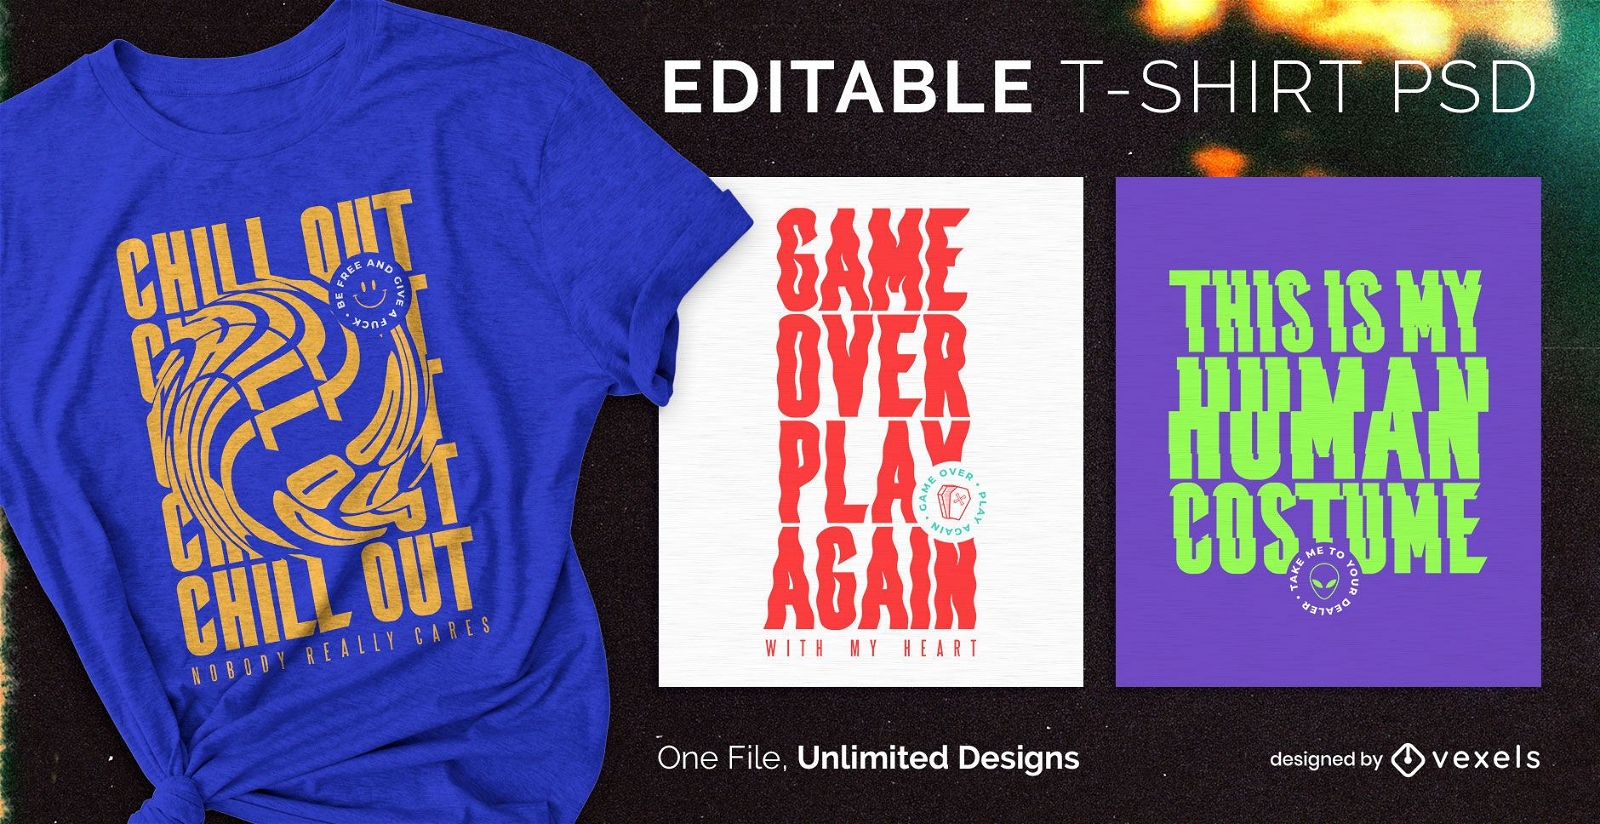
T-shirt escalável com texto trippy psd
Escolha uma pasta
Todos os favoritos
Criar novo
Salvar
T-shirt escalável com texto trippy psd
Pronto para imprimir
para Merch
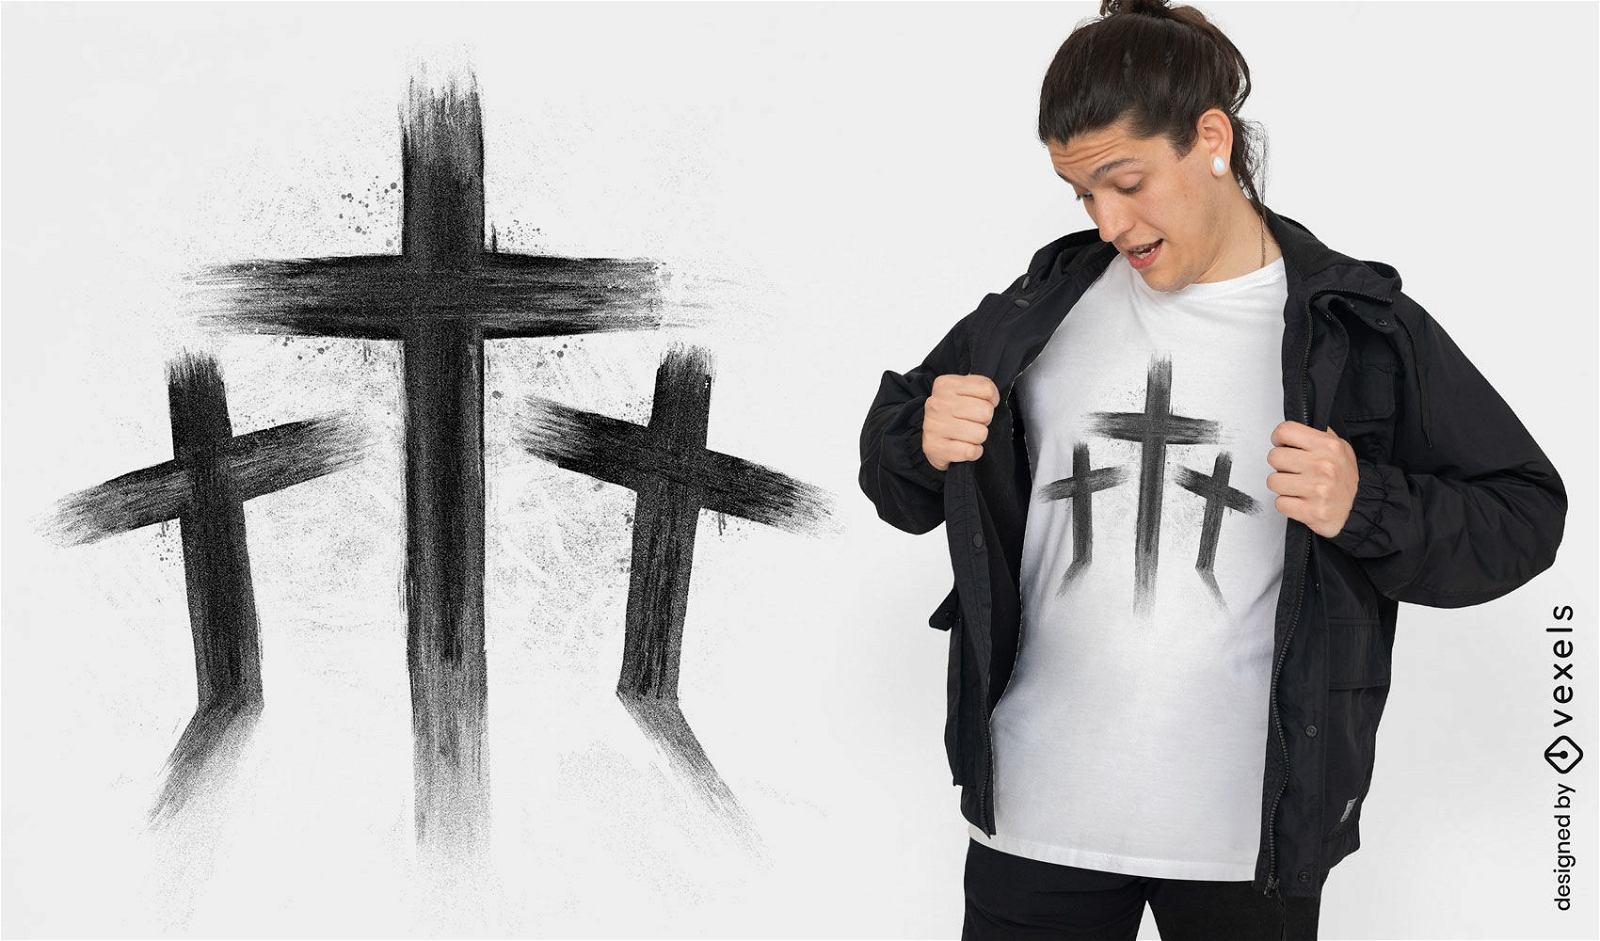
Grunge cruza o design da camiseta
Escolha uma pasta
Todos os favoritos
Criar novo
Salvar
Grunge cruza o design da camiseta
texto editável
Pronto para imprimir
para Merch
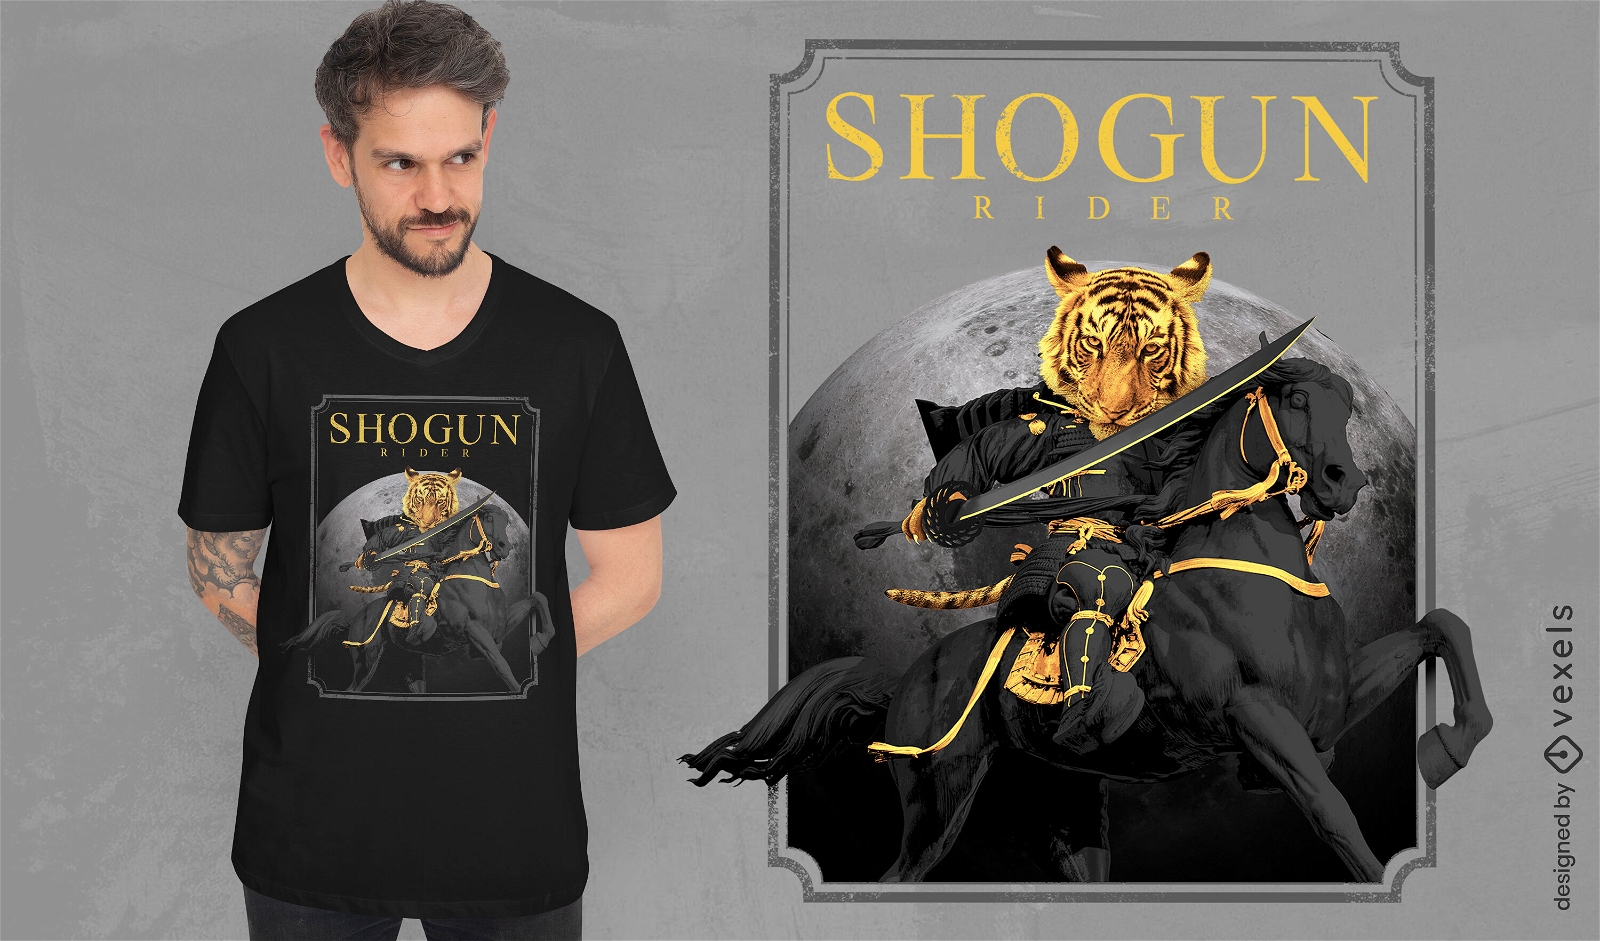
Design de camiseta de cavaleiro tigre
Escolha uma pasta
Todos os favoritos
Criar novo
Salvar
Design de camiseta de cavaleiro tigre
Pronto para imprimir
para Merch
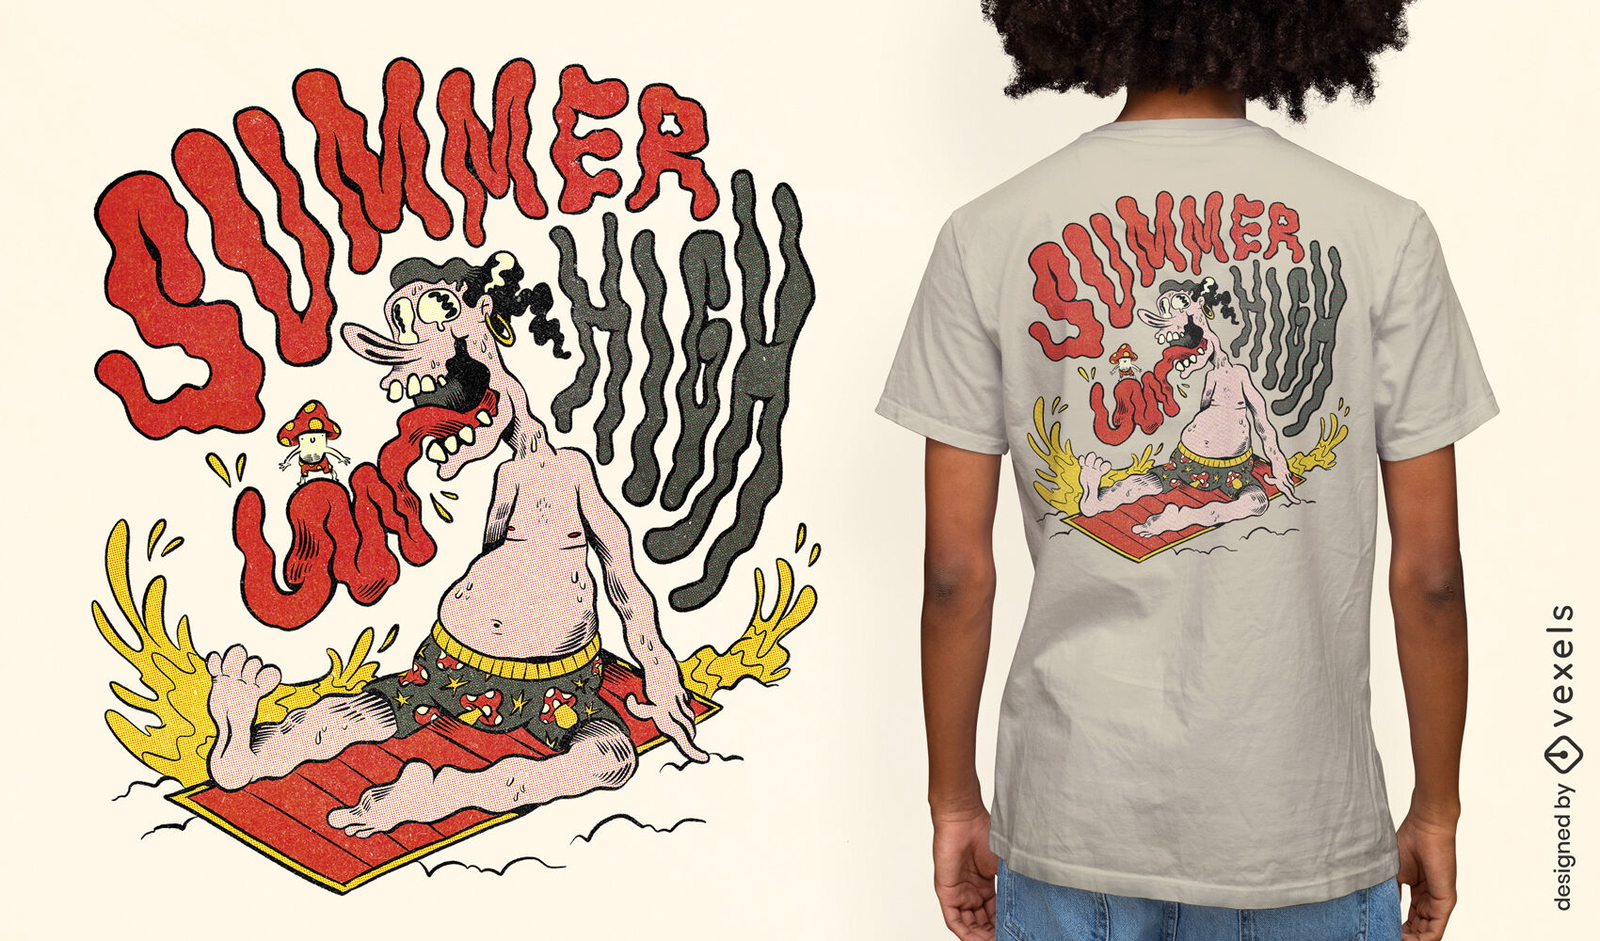
Homem em t-shirt de férias de verão psd
Escolha uma pasta
Todos os favoritos
Criar novo
Salvar
Homem em t-shirt de férias de verão psd
Pronto para imprimir
para Merch
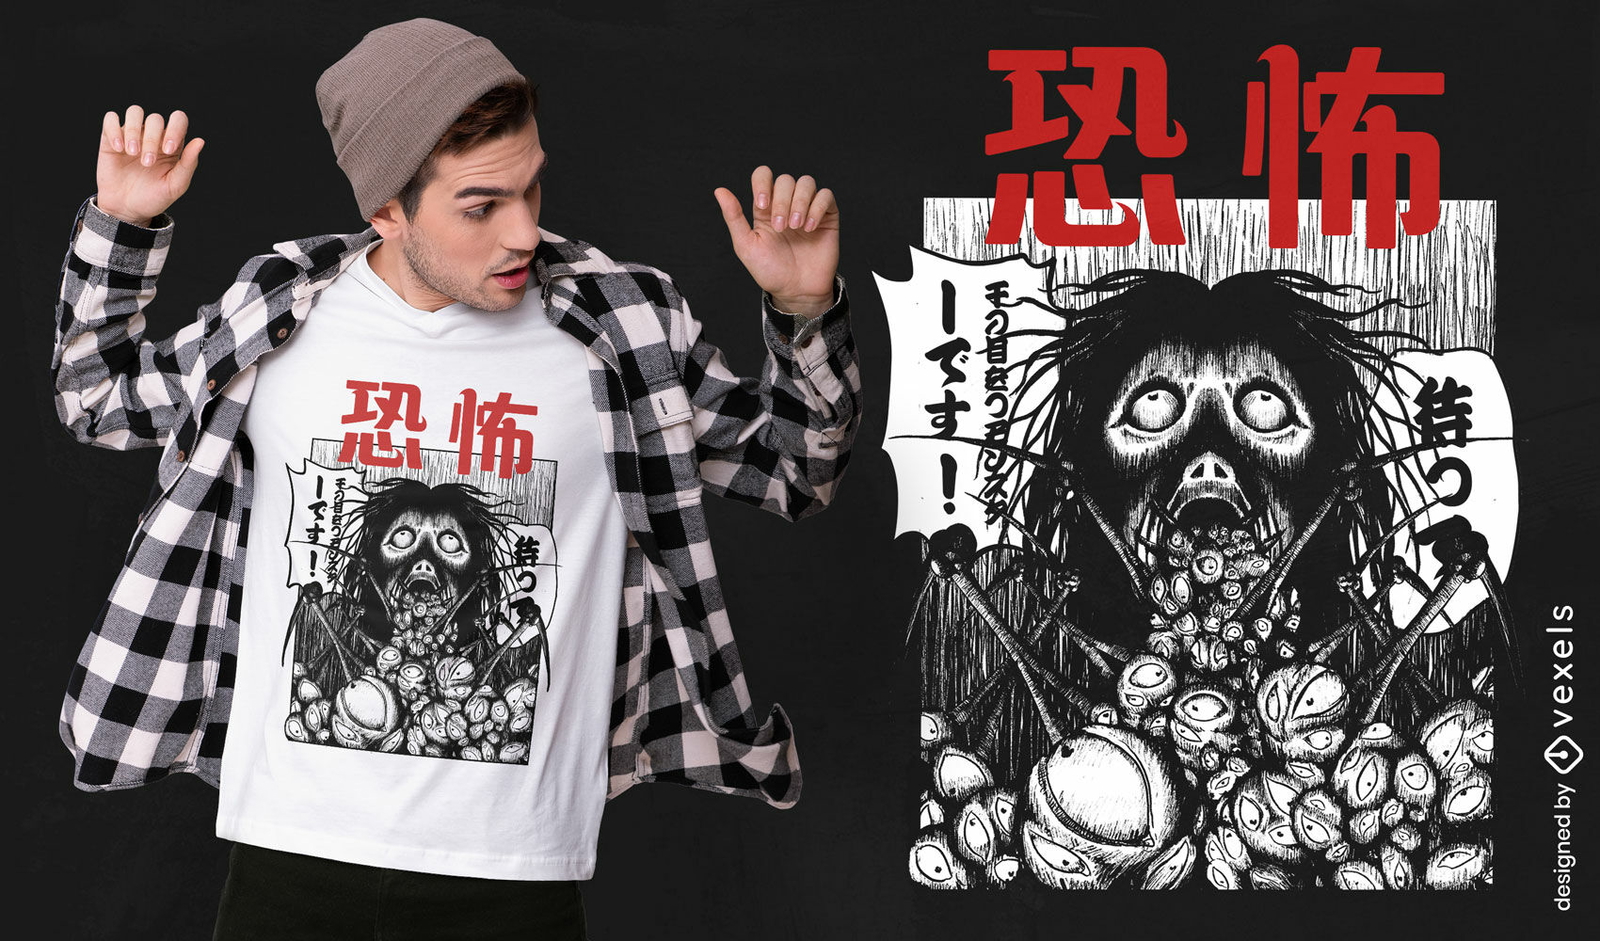
Design de camiseta de criatura de mangá de terror
Escolha uma pasta
Todos os favoritos
Criar novo
Salvar
Design de camiseta de criatura de mangá de terror
Pronto para imprimir
para Merch
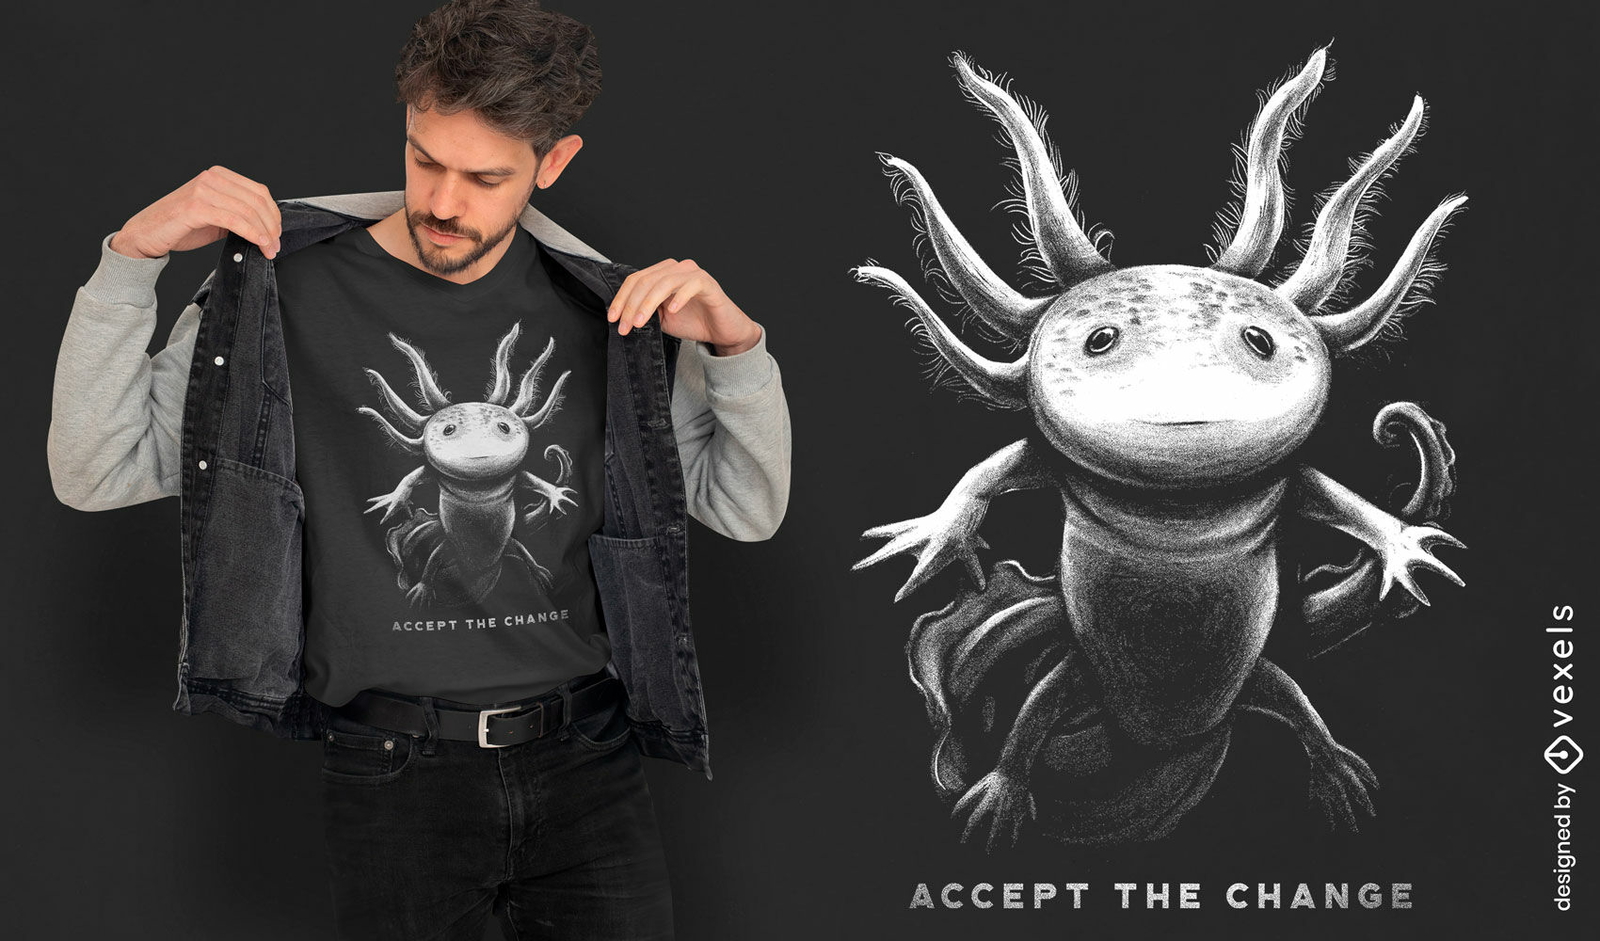
Design de camiseta axolotl desenhado à mão realista
Escolha uma pasta
Todos os favoritos
Criar novo
Salvar
Design de camiseta axolotl desenhado à mão realista
texto editável
para Merch
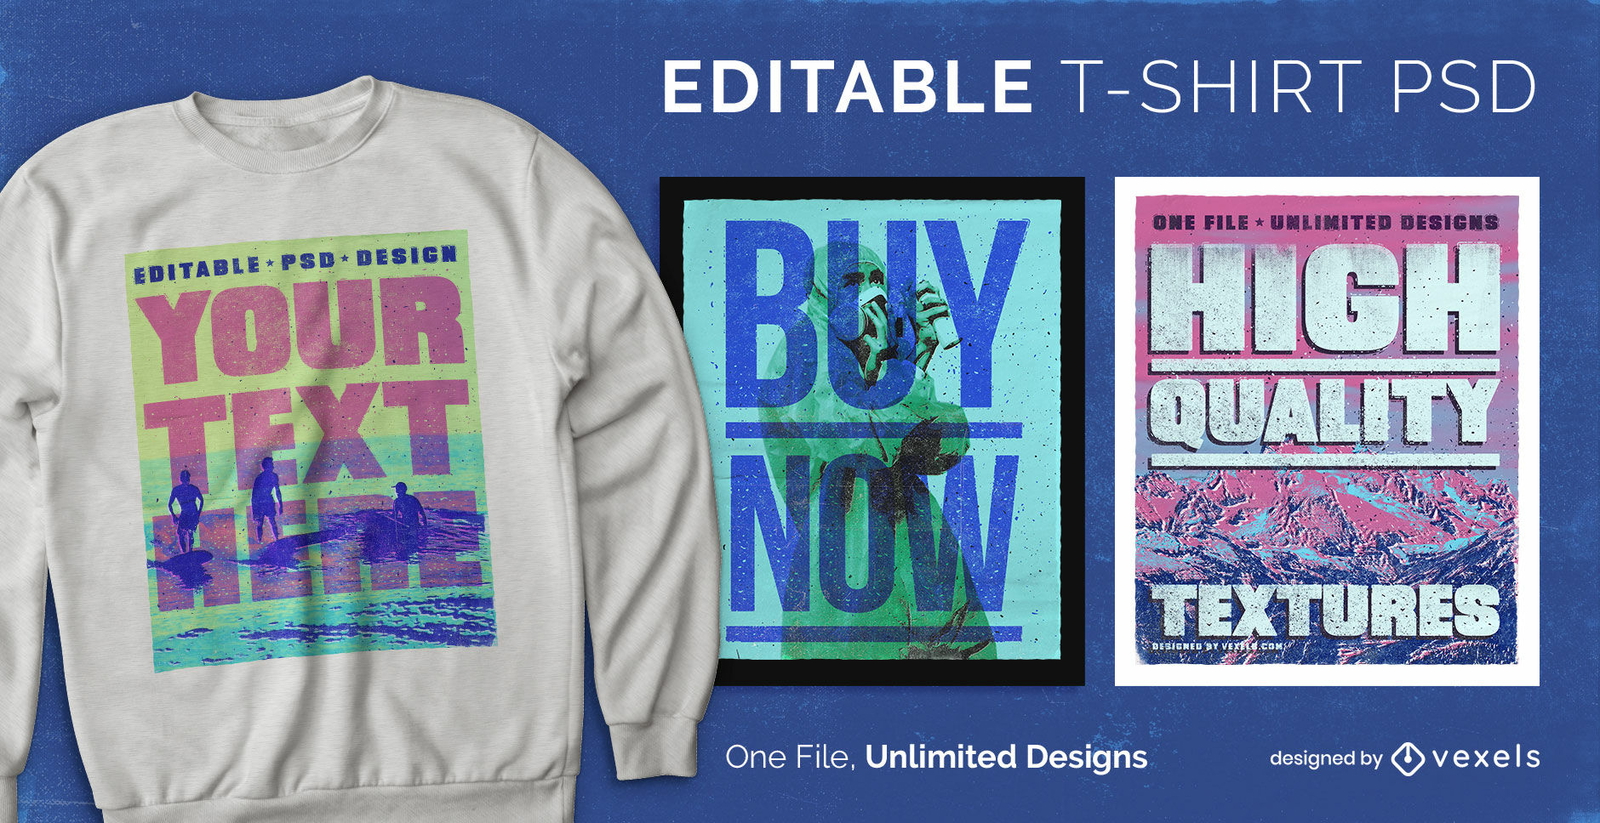
T-shirt escalável de textos e imagens vintage psd
Escolha uma pasta
Todos os favoritos
Criar novo
Salvar
T-shirt escalável de textos e imagens vintage psd
Pronto para imprimir
para Merch
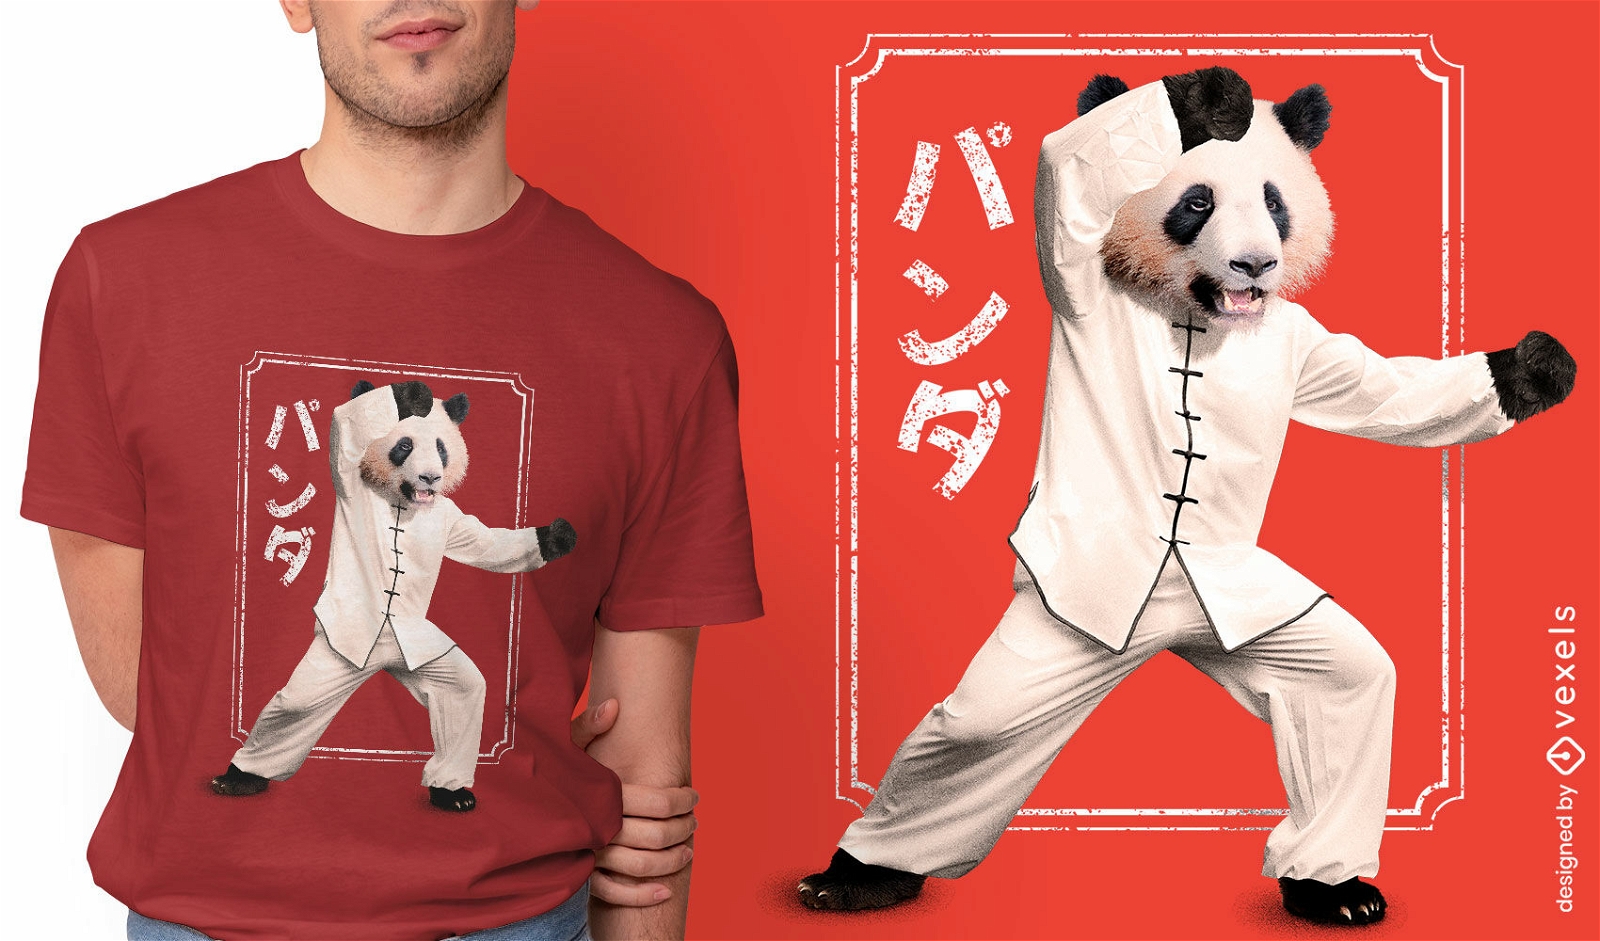
Design de camiseta de artes marciais de animais de urso panda
Escolha uma pasta
Todos os favoritos
Criar novo
Salvar
Design de camiseta de artes marciais de animais de urso panda
Pronto para imprimir
para Merch
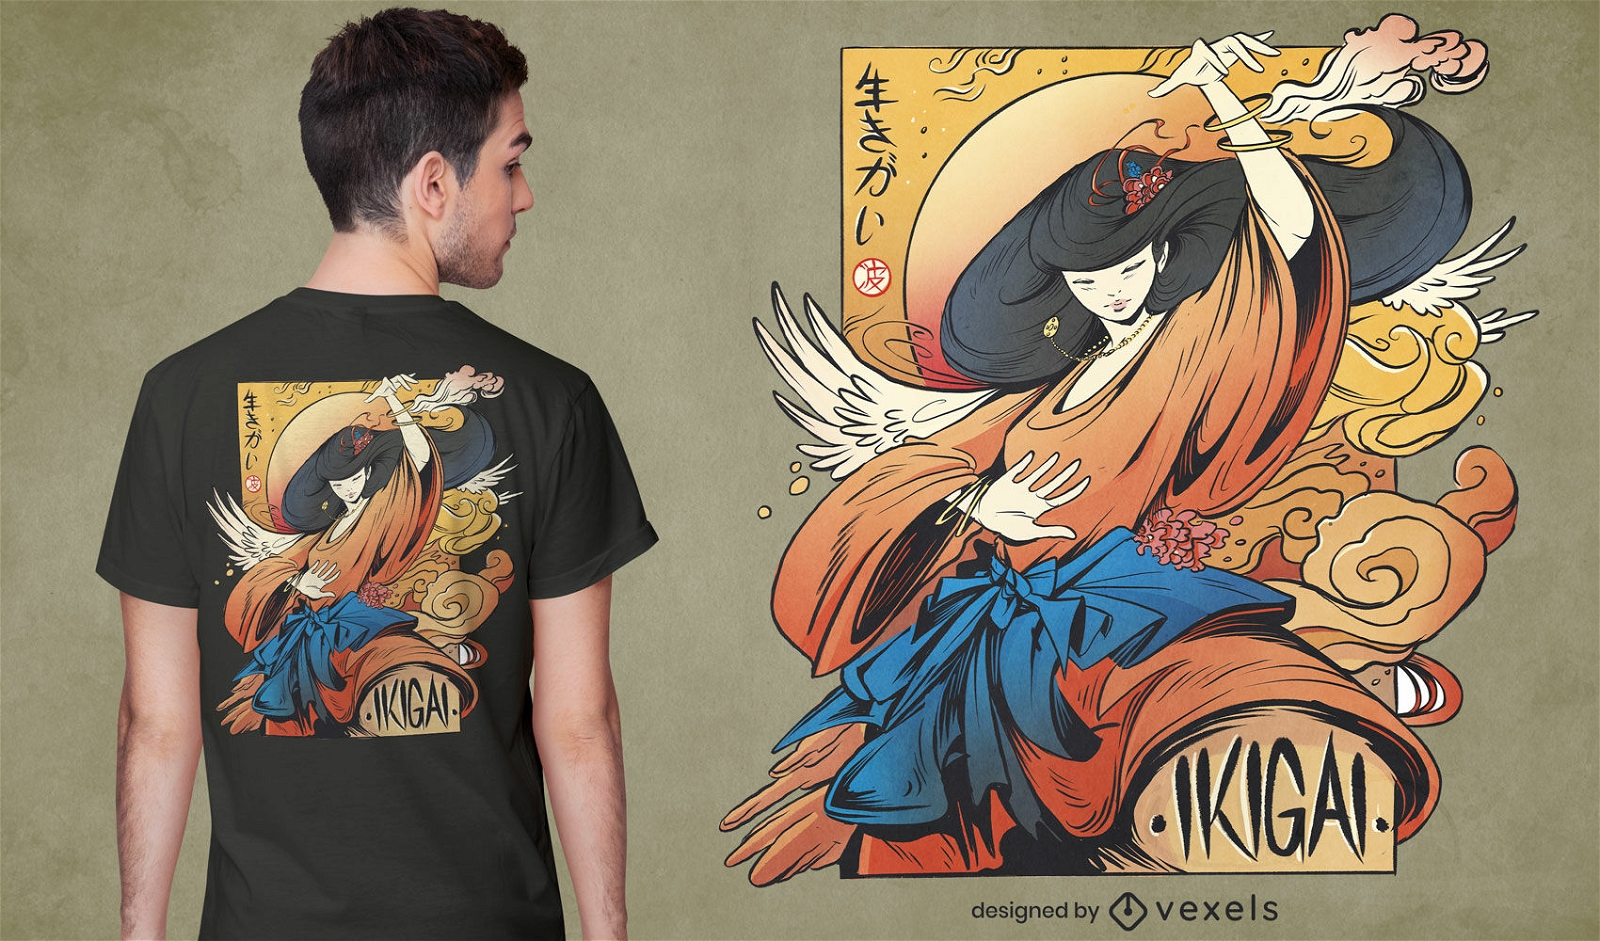
Camiseta de menina espiritual japonesa psd
Escolha uma pasta
Todos os favoritos
Criar novo
Salvar
Camiseta de menina espiritual japonesa psd
texto editável
para Merch
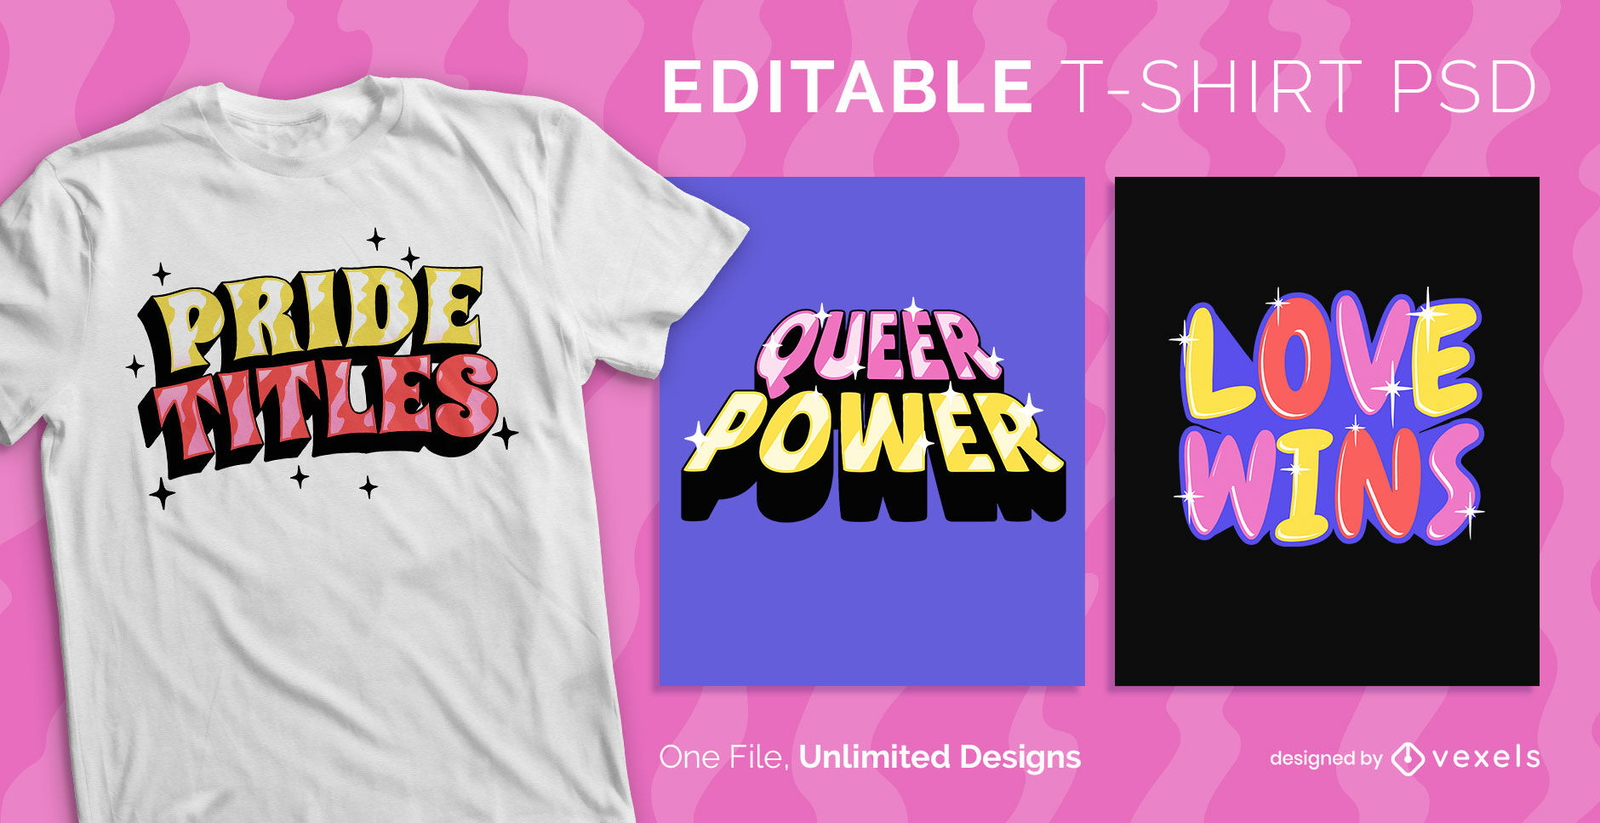
Design de camiseta PSD escalável e brilhante com letras do orgulho
Escolha uma pasta
Todos os favoritos
Criar novo
Salvar
Design de camiseta PSD escalável e brilhante com letras do orgulho
Camiseta PSD escalável
para Merch
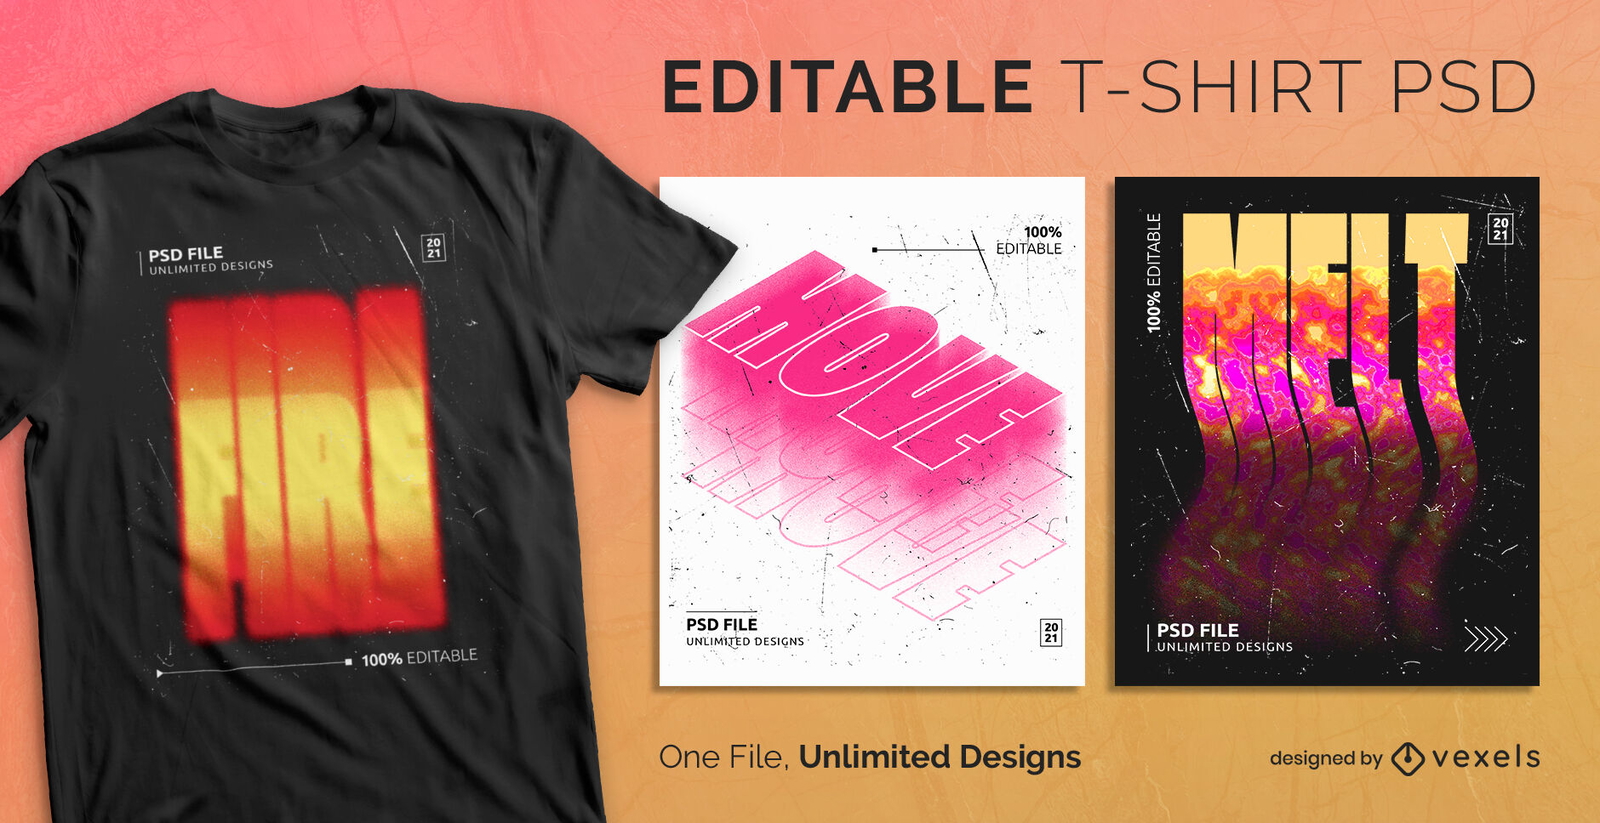
Design escalonável de t-shirt psd gradiente ardente
Escolha uma pasta
Todos os favoritos
Criar novo
Salvar
Design escalonável de t-shirt psd gradiente ardente
Pronto para imprimir
para Merch
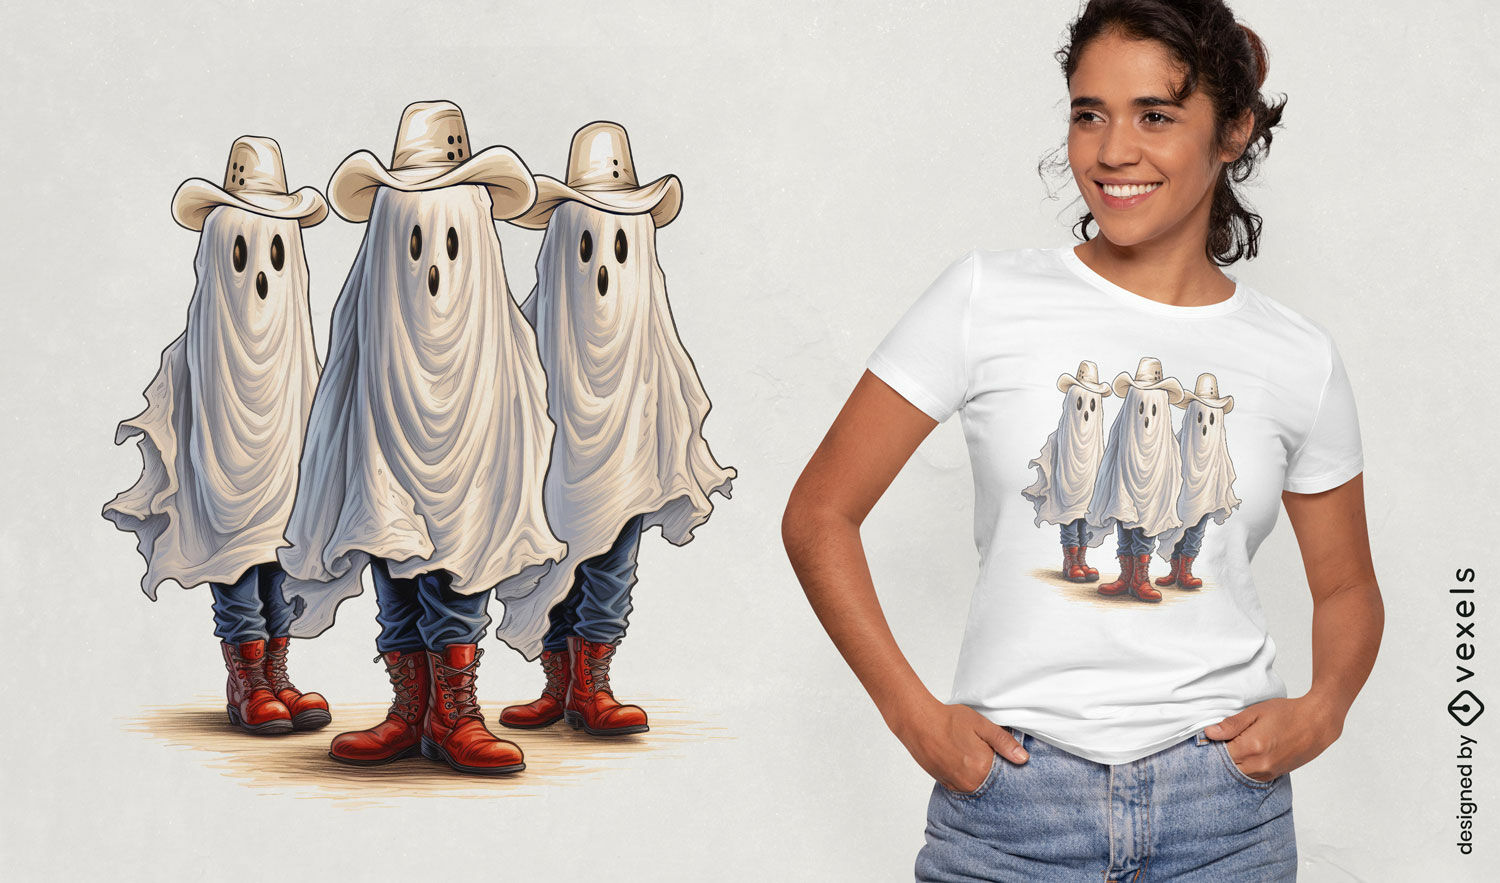
Design de camiseta com tr?s fantasmas de cowboy
Escolha uma pasta
Todos os favoritos
Criar novo
Salvar
Design de camiseta com tr?s fantasmas de cowboy
texto editável
para Merch
Camiseta psd escalonável do dragão sangrento
Escolha uma pasta
Todos os favoritos
Criar novo
Salvar
Camiseta psd escalonável do dragão sangrento
texto editável
Pronto para imprimir
para Merch
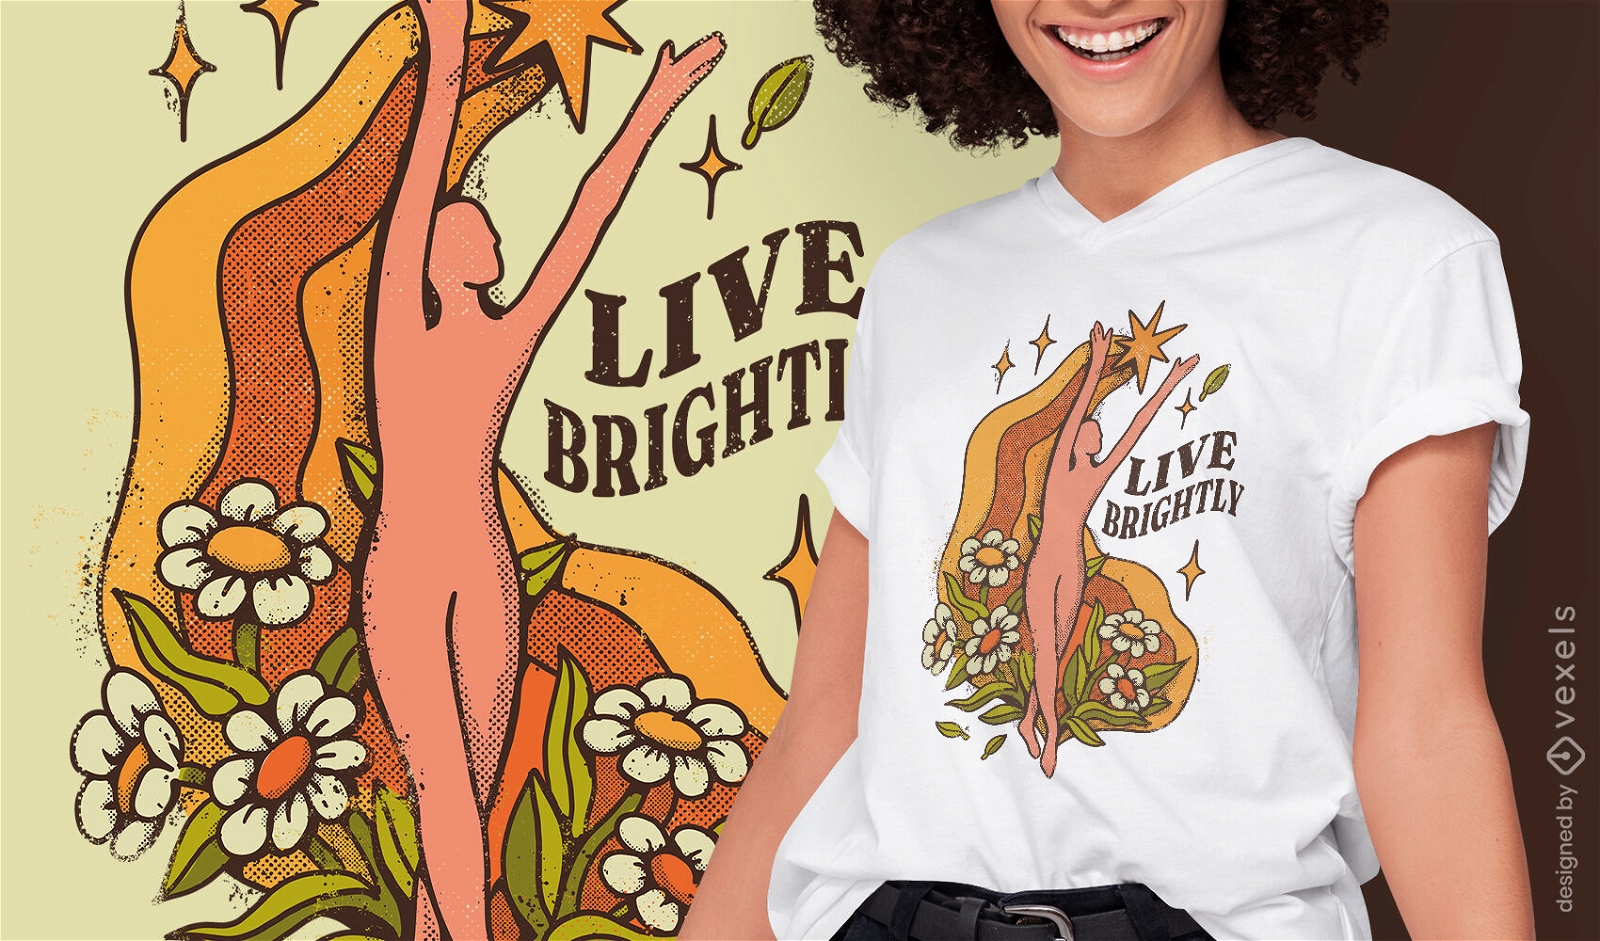
Viva design de camiseta brilhantemente motivacional
Escolha uma pasta
Todos os favoritos
Criar novo
Salvar
Viva design de camiseta brilhantemente motivacional
Pronto para imprimir
para Merch
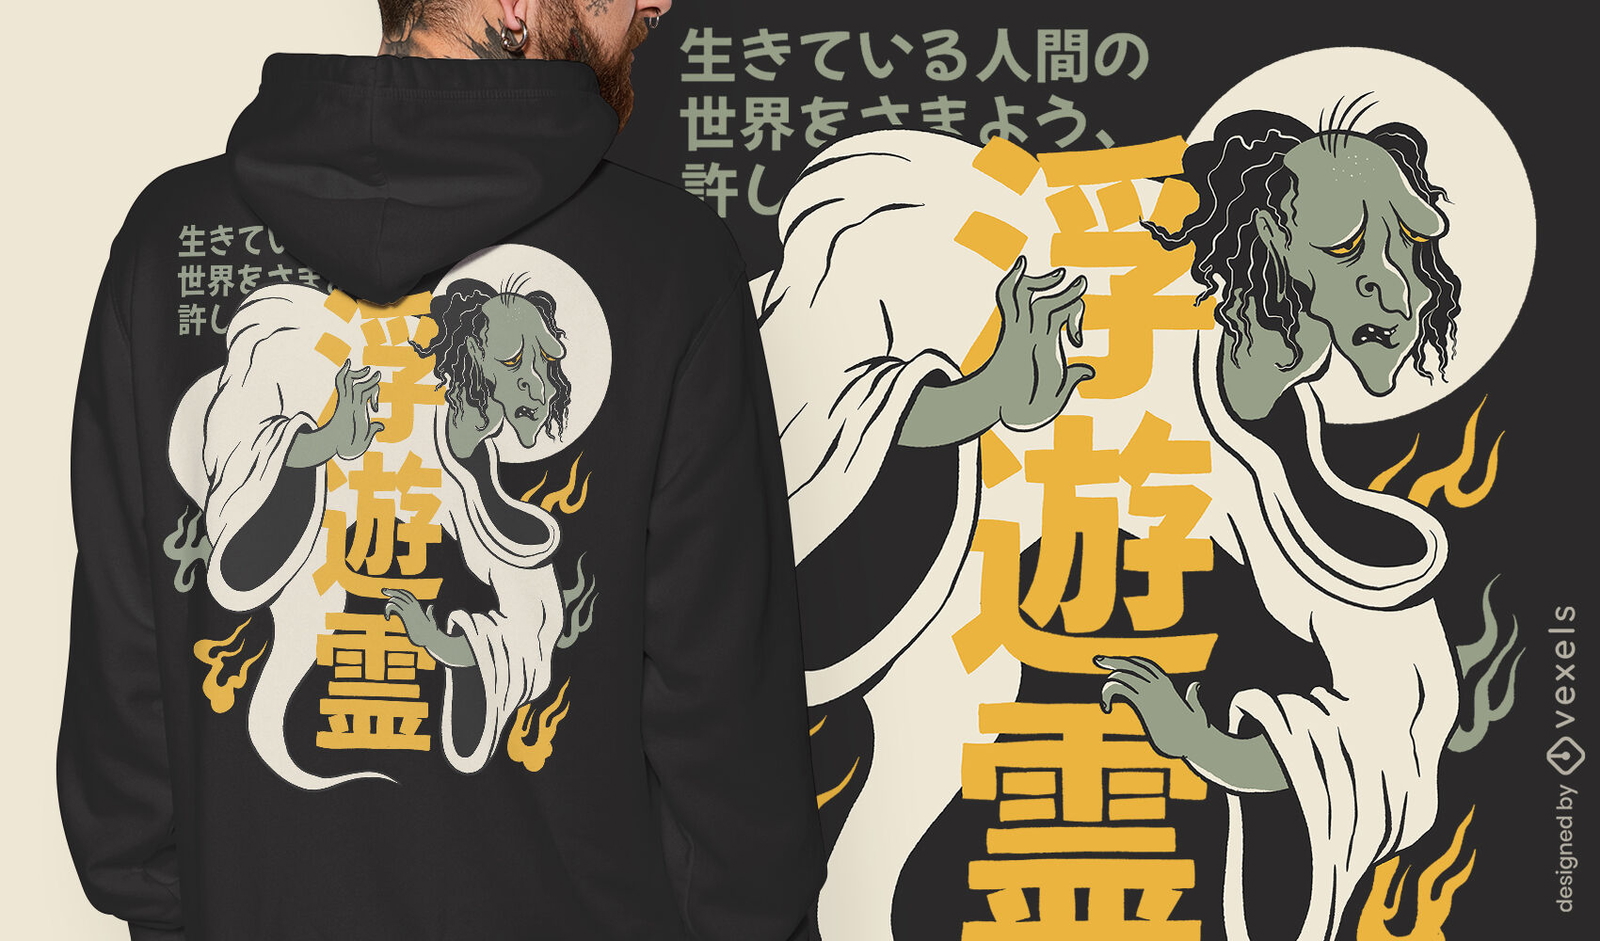
Design de camiseta assustadora de fantasma japonês
Escolha uma pasta
Todos os favoritos
Criar novo
Salvar
Design de camiseta assustadora de fantasma japonês
texto editável
Pronto para imprimir
para Merch
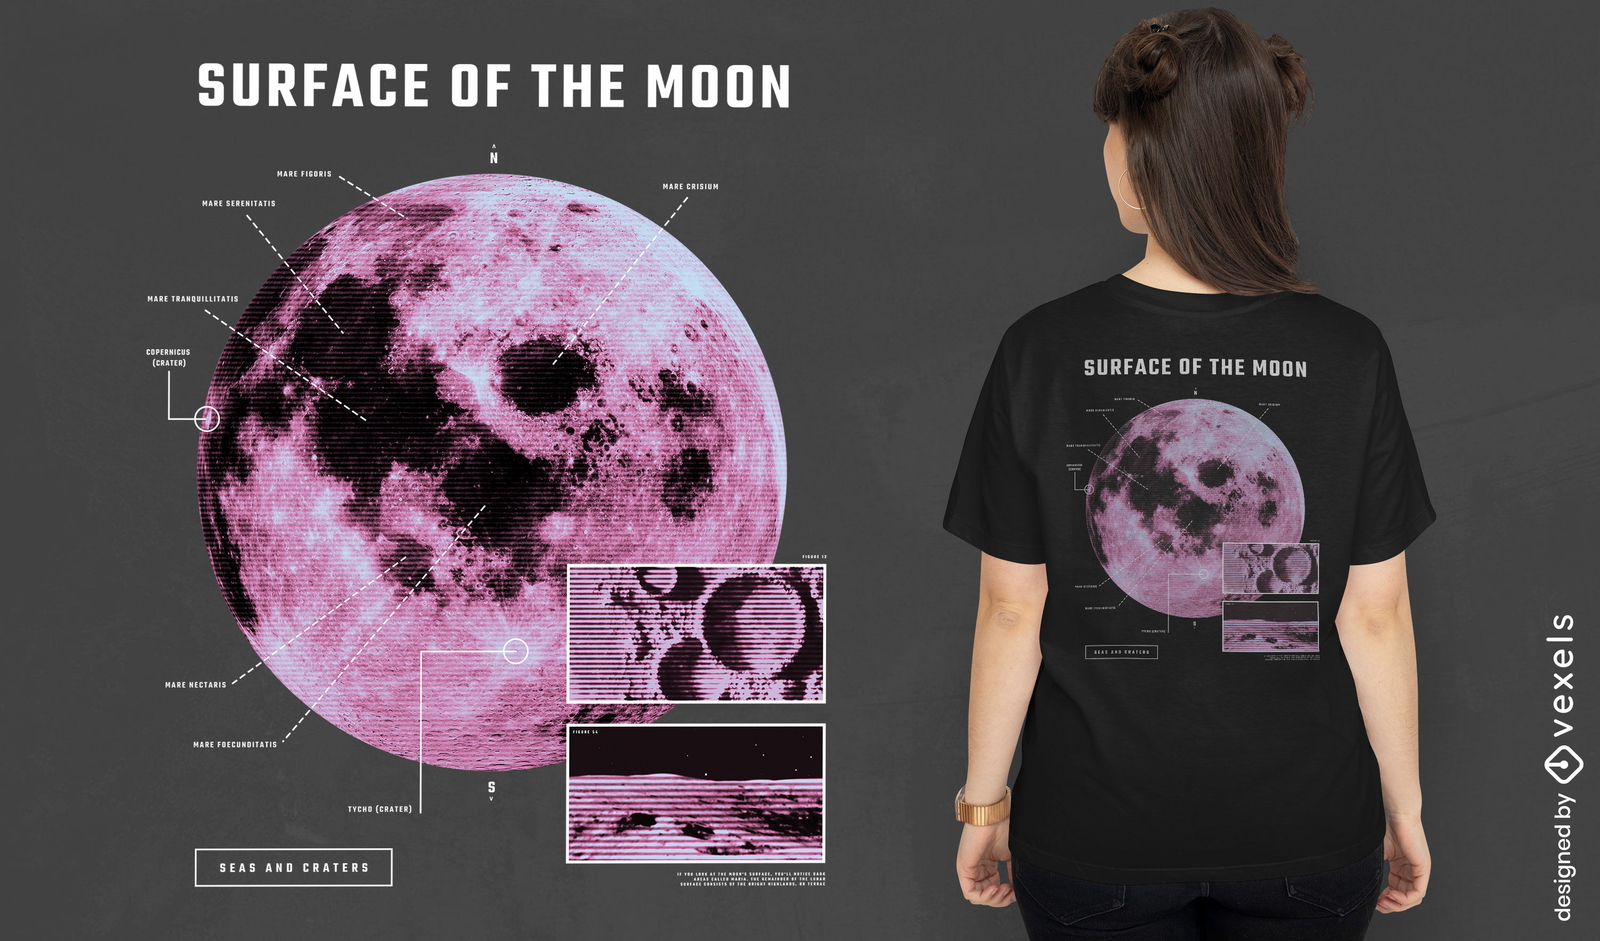
Lua no espaço com explicações design de camiseta PSD
Escolha uma pasta
Todos os favoritos
Criar novo
Salvar
Lua no espaço com explicações design de camiseta PSD
texto editável
Pronto para imprimir
para Merch
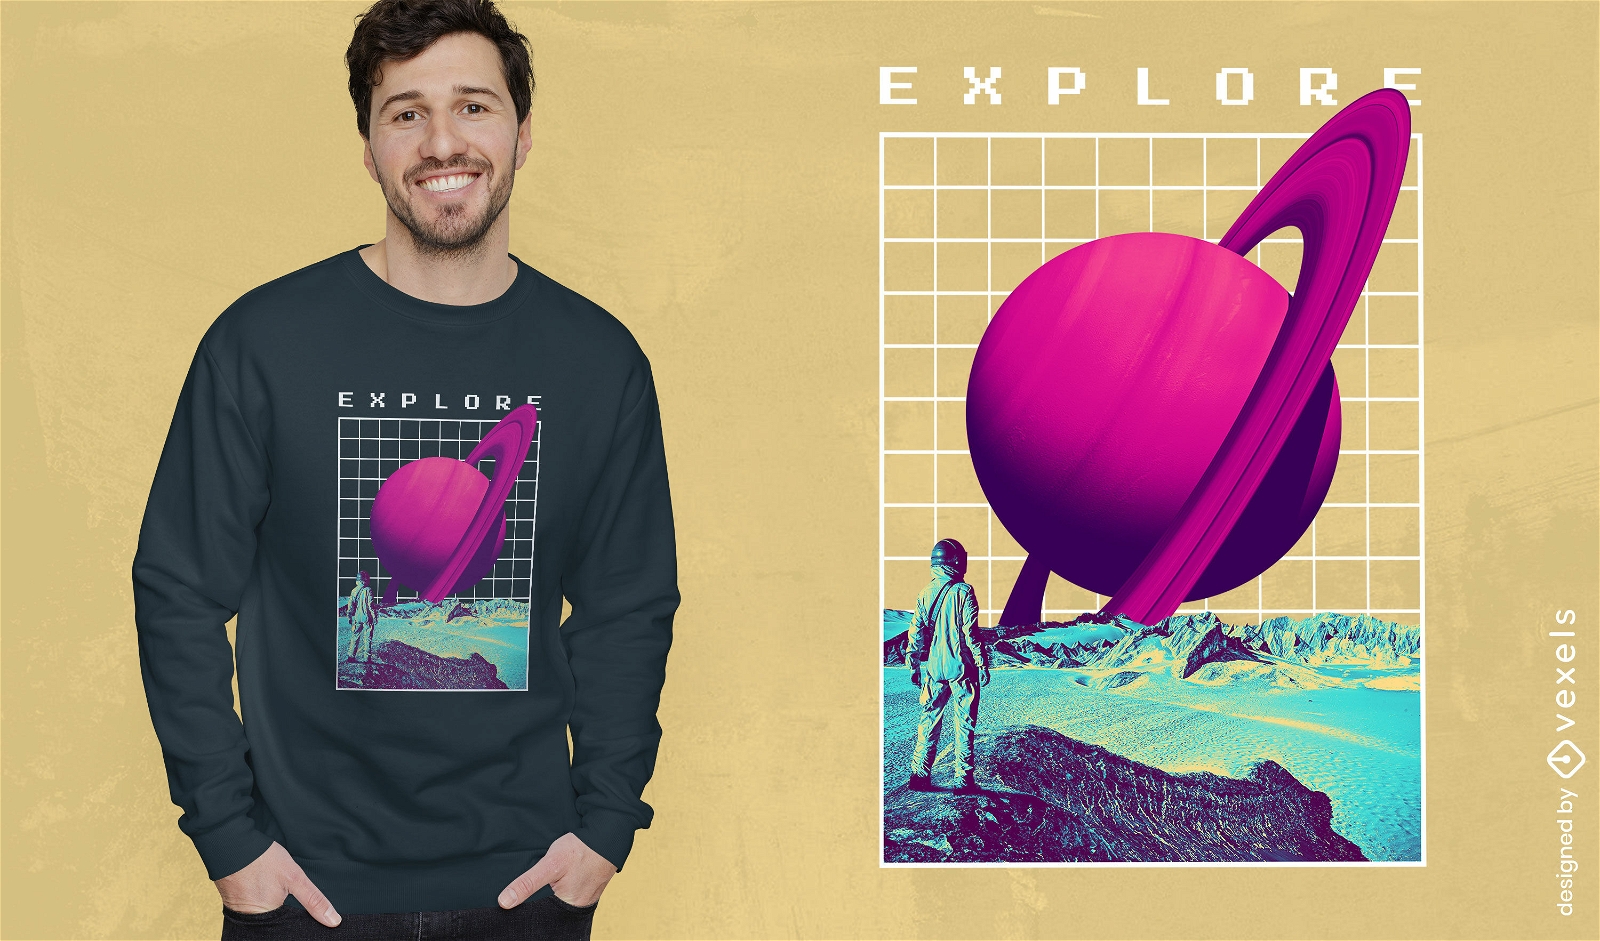
Design de camiseta de vaporwave do planeta Saturno
Escolha uma pasta
Todos os favoritos
Criar novo
Salvar
Design de camiseta de vaporwave do planeta Saturno
Pronto para imprimir
para Merch
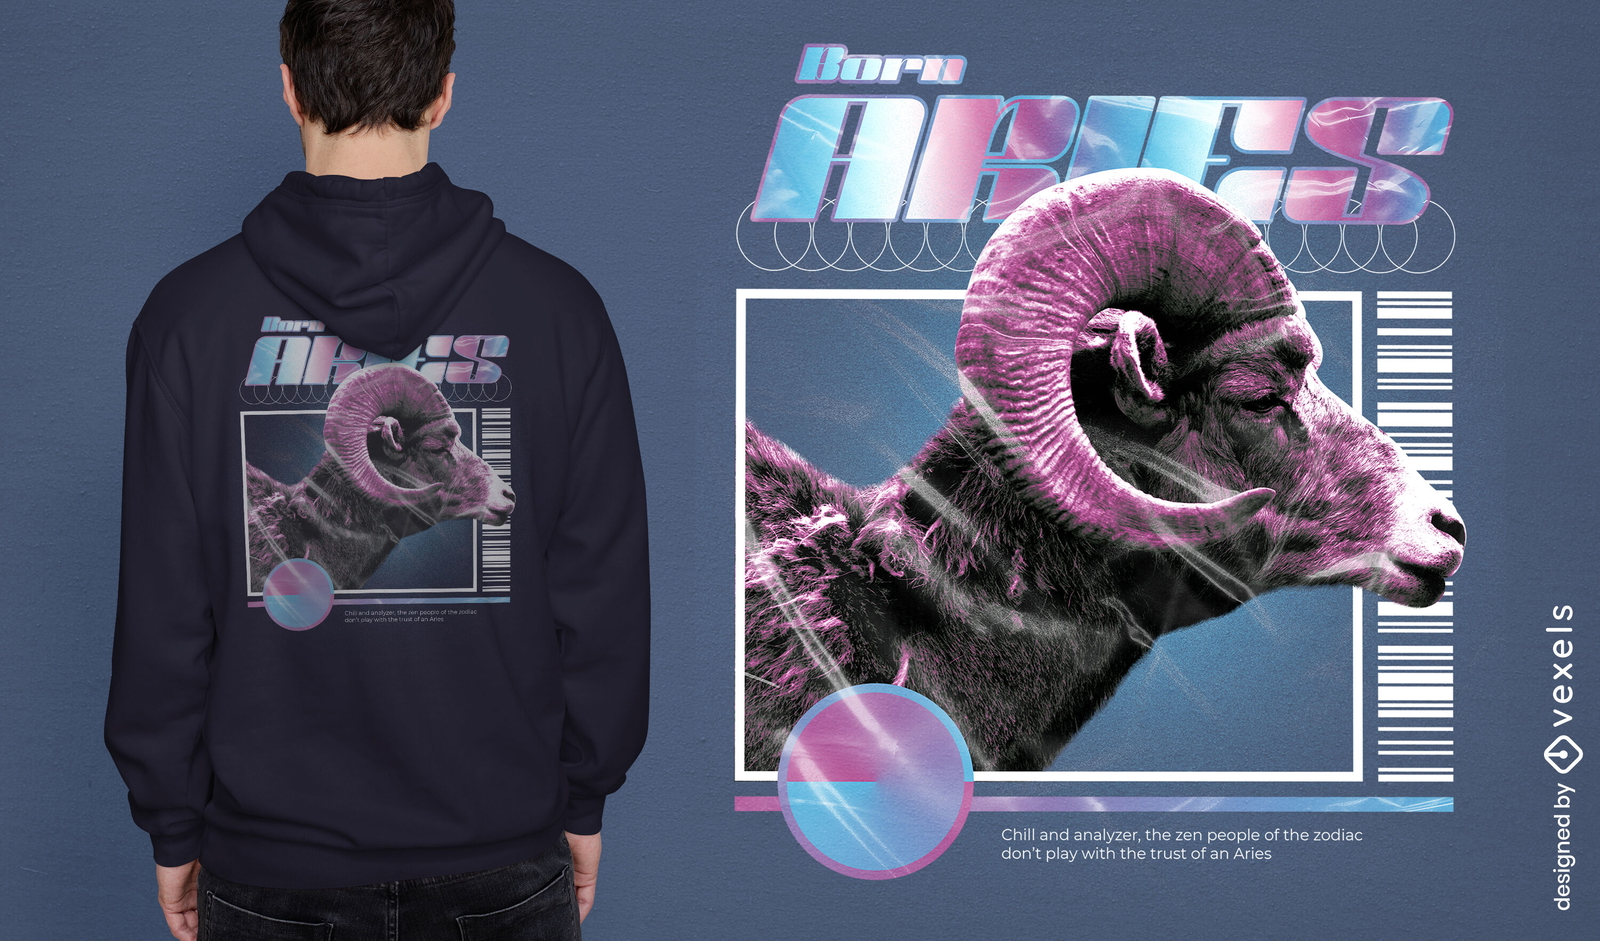
T-shirt de animal de cabra horóscopo de Áries psd
Escolha uma pasta
Todos os favoritos
Criar novo
Salvar
T-shirt de animal de cabra horóscopo de Áries psd
Pronto para imprimir
para Merch
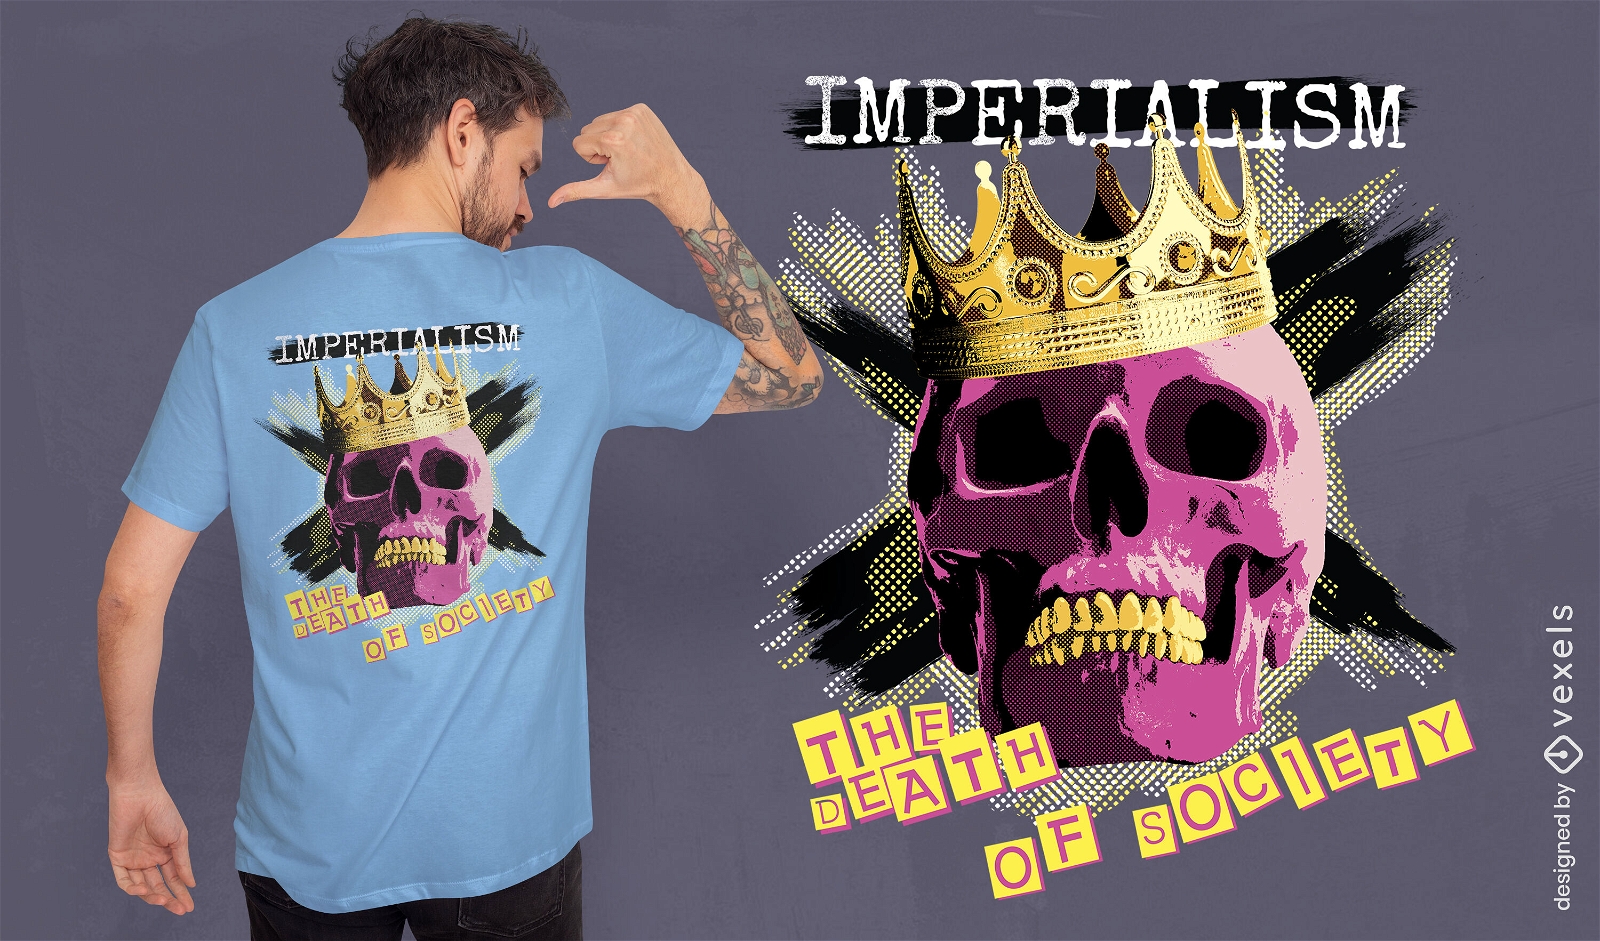
Design de camiseta de caveira do imperialismo
Escolha uma pasta
Todos os favoritos
Criar novo
Salvar
Design de camiseta de caveira do imperialismo
Camiseta PSD escalável
para Merch
T-shirt psd escalável com citações de textura vintage
Escolha uma pasta
Todos os favoritos
Criar novo
Salvar
T-shirt psd escalável com citações de textura vintage
Pronto para imprimir
para Merch
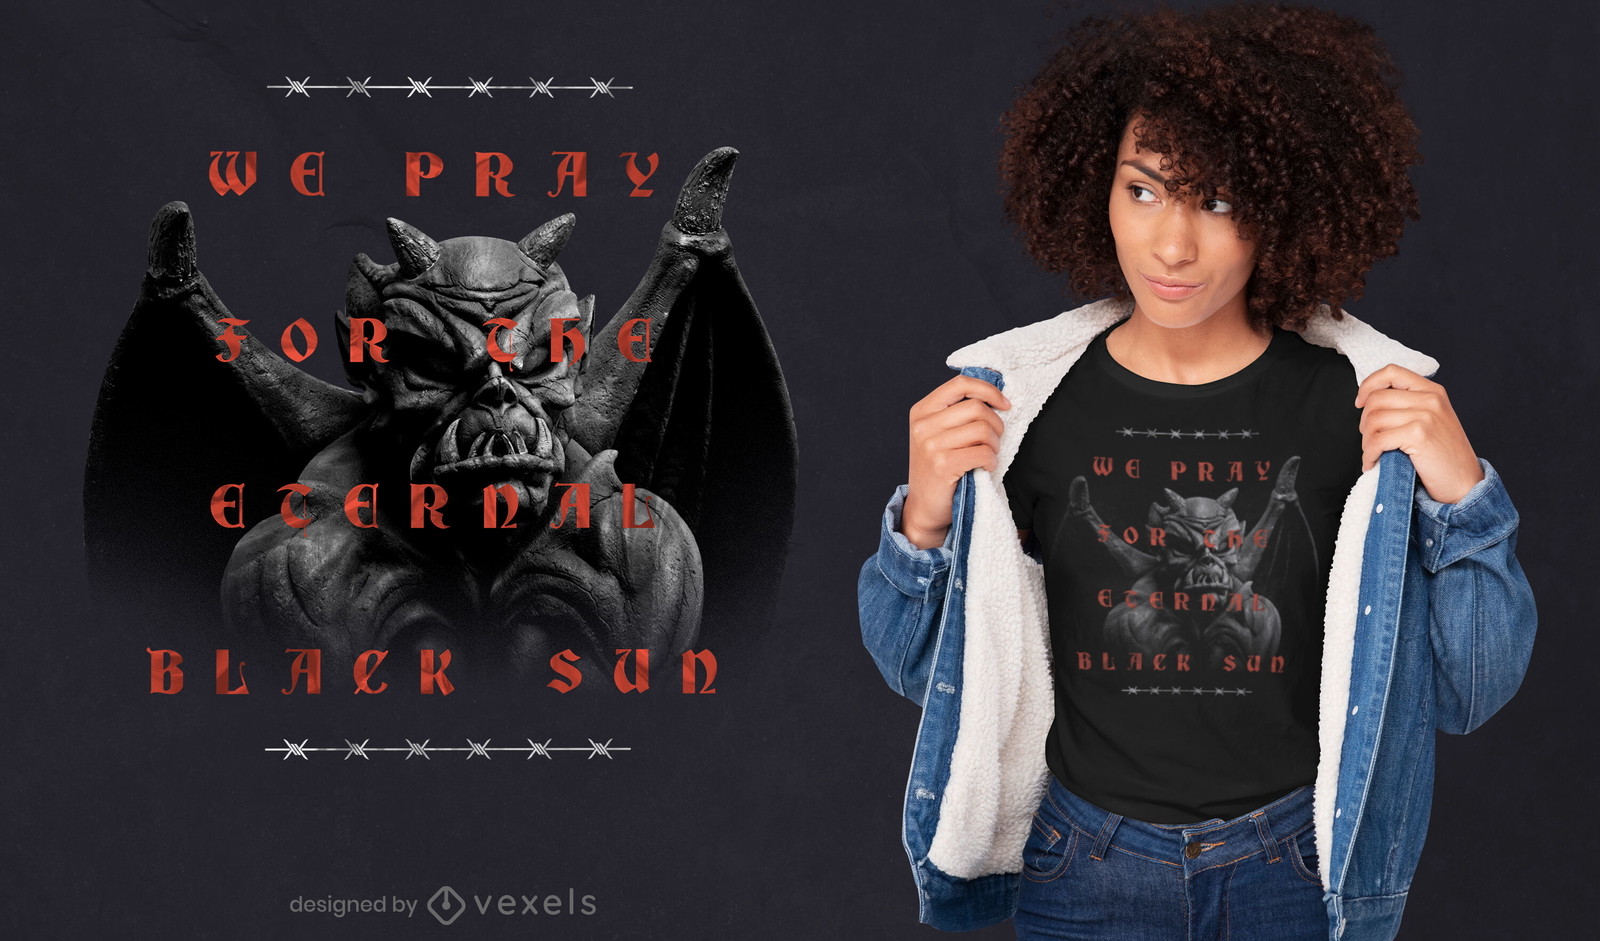
Gárgula citação trap psd t-shirt design
Escolha uma pasta
Todos os favoritos
Criar novo
Salvar
Gárgula citação trap psd t-shirt design
Pronto para imprimir
para Merch
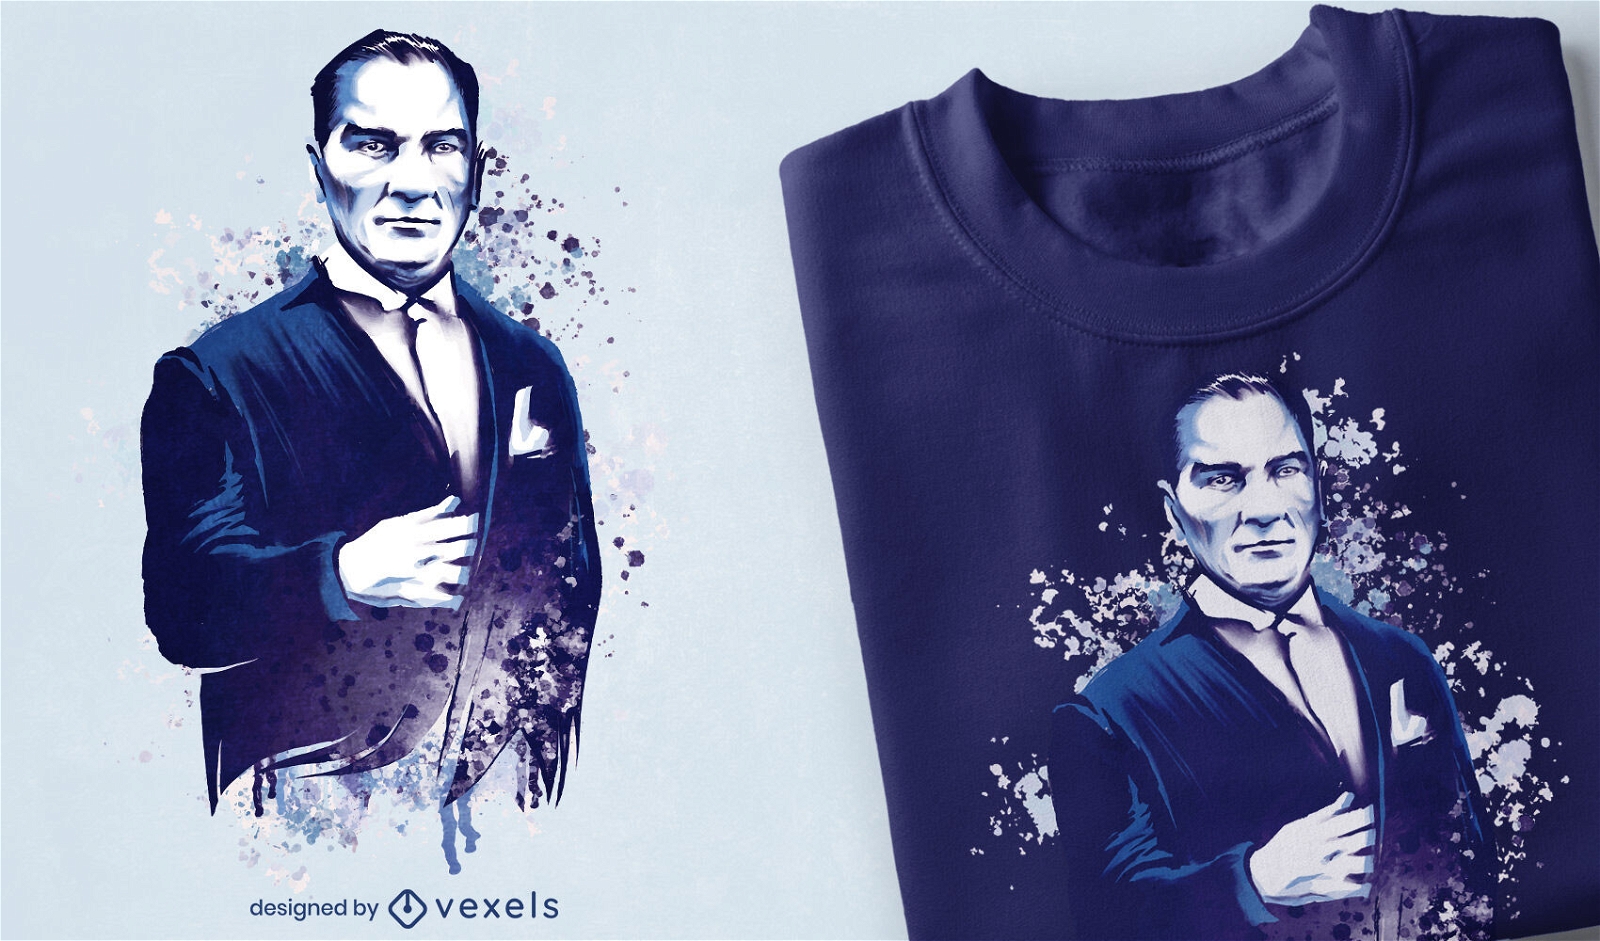
Design de t-shirt Ataturk portrait psd
Escolha uma pasta
Todos os favoritos
Criar novo
Salvar
Design de t-shirt Ataturk portrait psd
Camiseta PSD escalável
para Merch
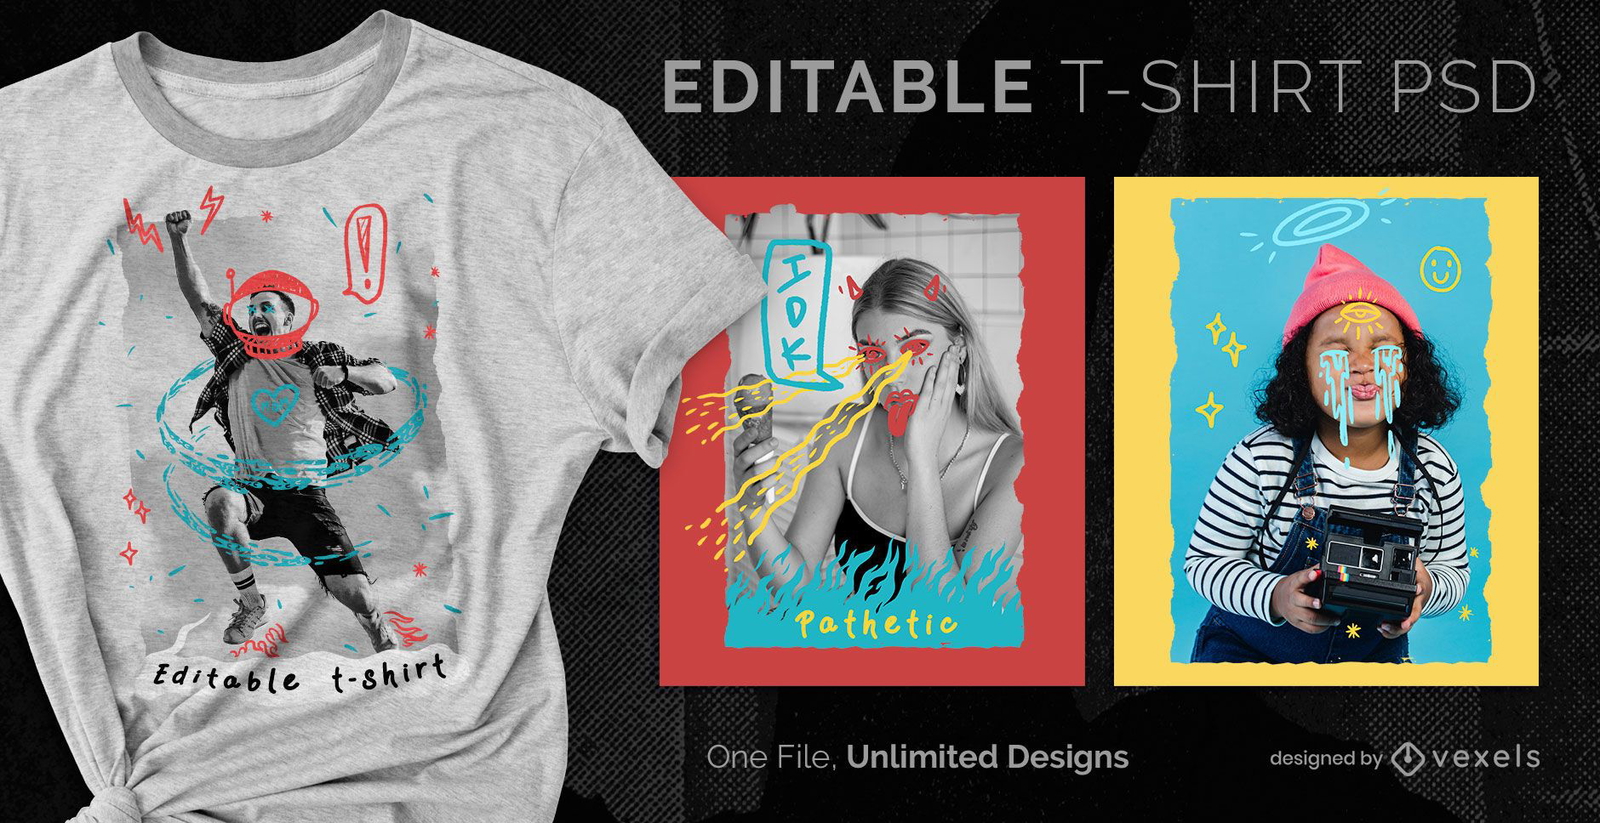
Photograpy doodle t-shirt escalável psd
Escolha uma pasta
Todos os favoritos
Criar novo
Salvar
Photograpy doodle t-shirt escalável psd
Camiseta PSD escalável
para Merch
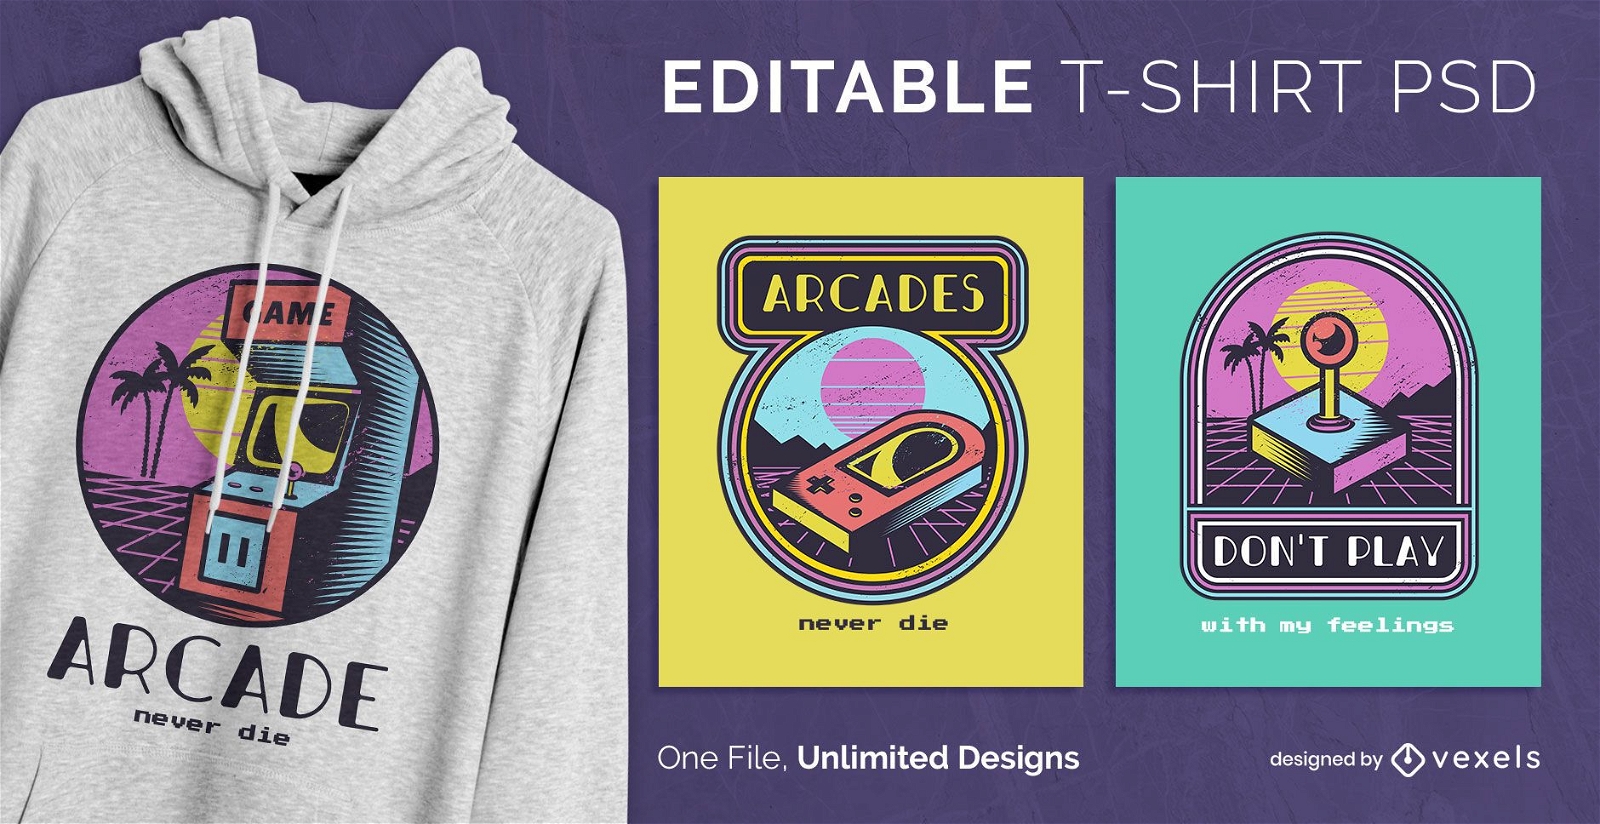
T-shirt retro escalonável psd
Escolha uma pasta
Todos os favoritos
Criar novo
Salvar
T-shirt retro escalonável psd
Camiseta PSD escalável
para Merch
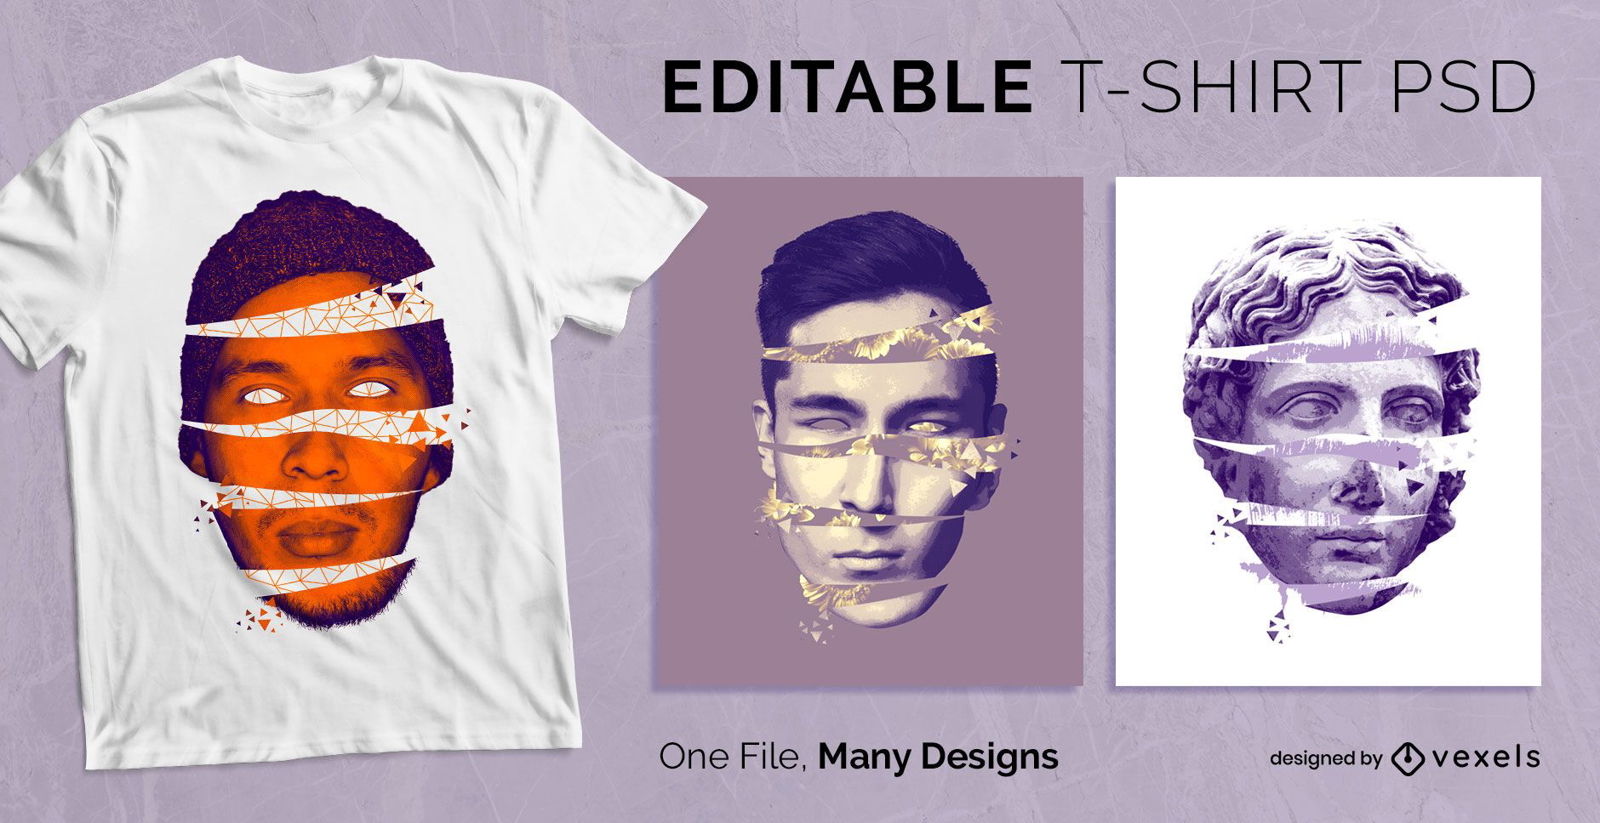
Camiseta Open Head Creative PSD
Escolha uma pasta
Todos os favoritos
Criar novo
Salvar
Camiseta Open Head Creative PSD
texto editável
Pronto para imprimir
para Merch
Design de camiseta de livro de professor de primeira série
Escolha uma pasta
Todos os favoritos
Criar novo
Salvar
Design de camiseta de livro de professor de primeira série
texto editável
para Merch
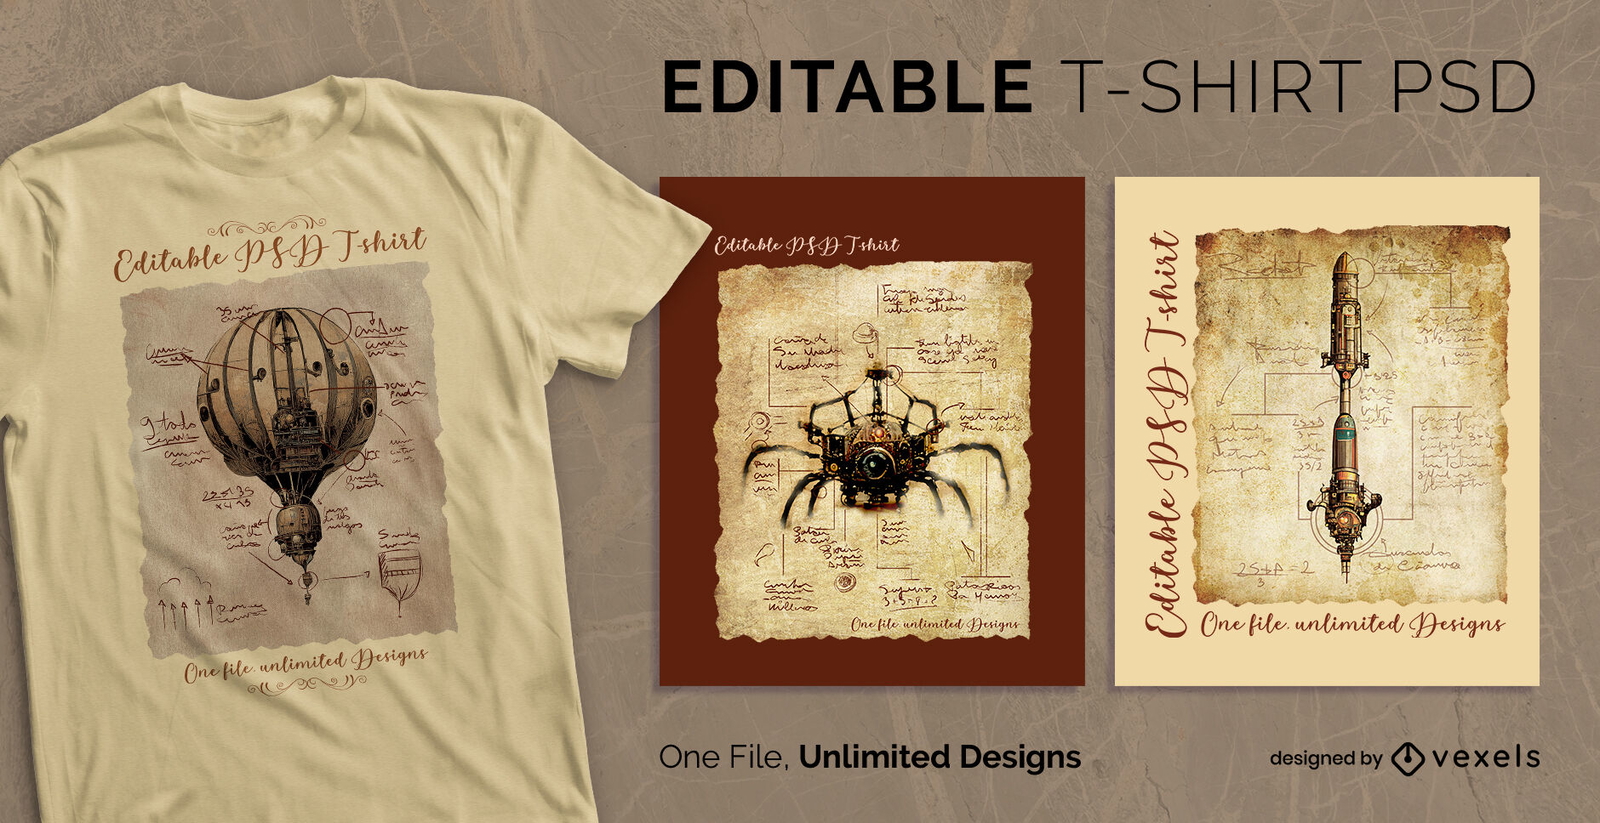
T-shirt escalável realista de elementos Steampunk psd
Escolha uma pasta
Todos os favoritos
Criar novo
Salvar
T-shirt escalável realista de elementos Steampunk psd
texto editável
para Merch
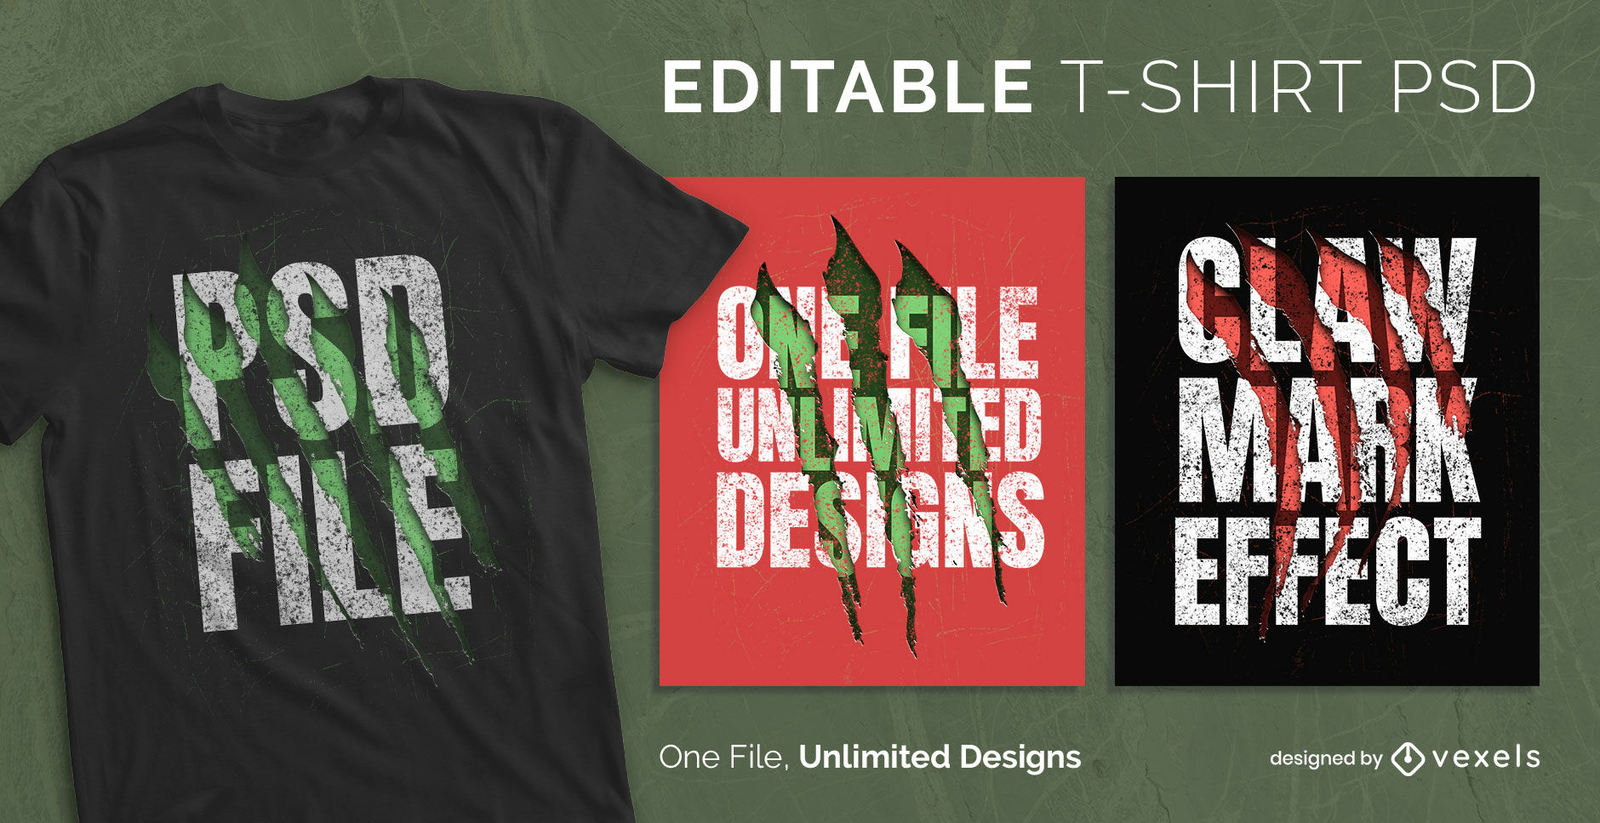
Garra animal marca camiseta escalável psd
Escolha uma pasta
Todos os favoritos
Criar novo
Salvar
Garra animal marca camiseta escalável psd
Pronto para imprimir
para Merch
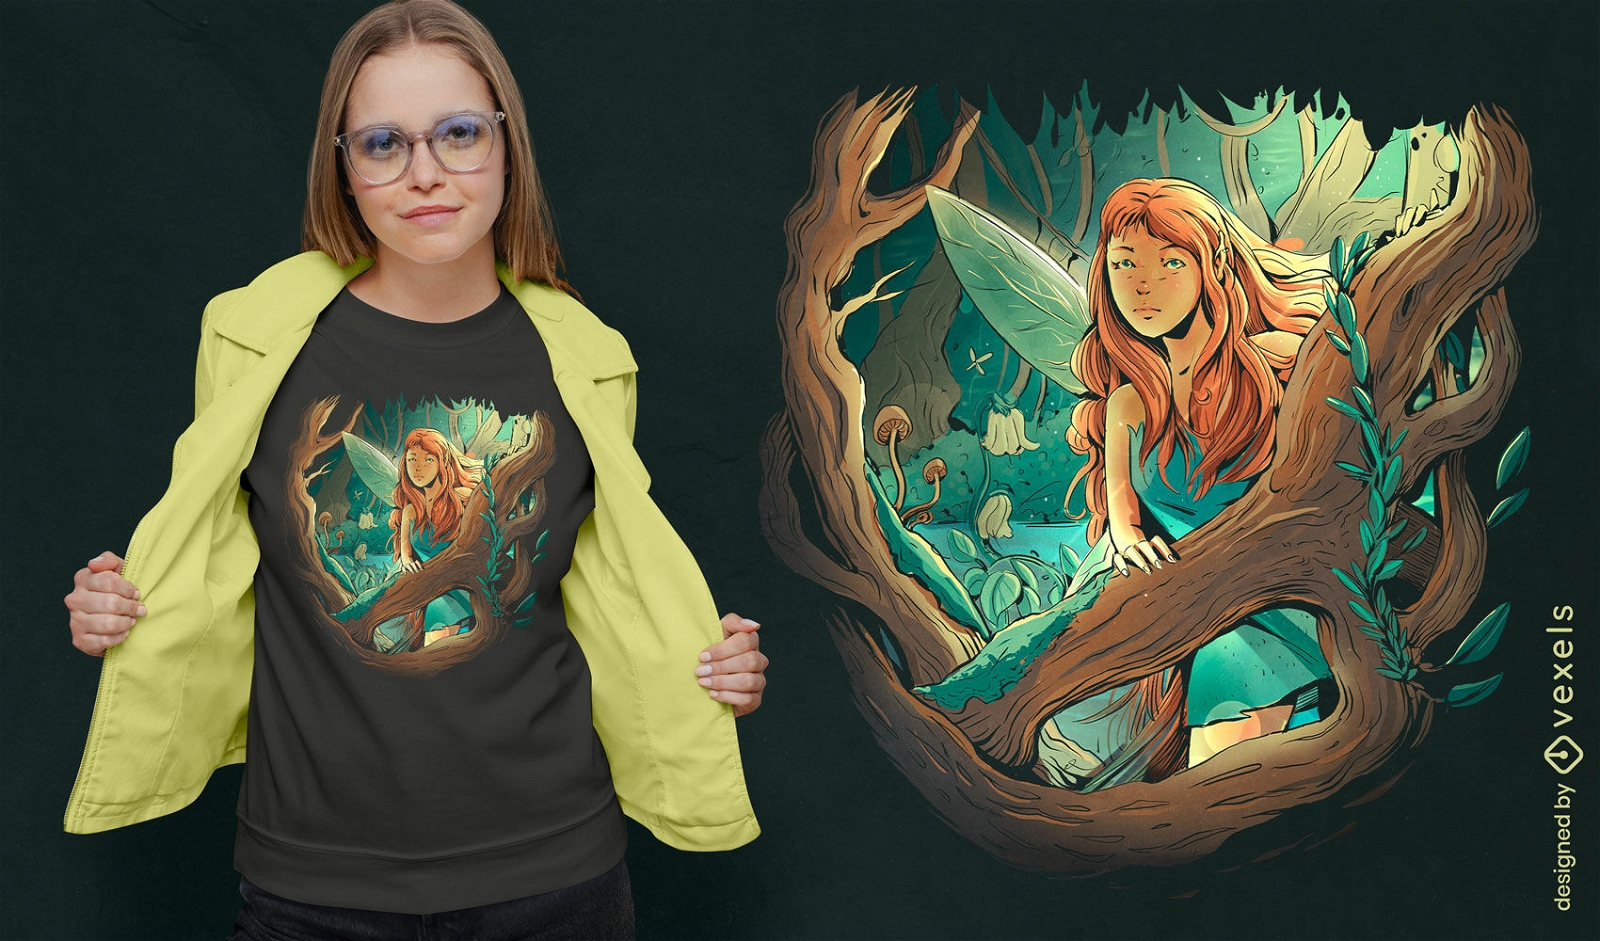
Design de camiseta de floresta de fadas
Escolha uma pasta
Todos os favoritos
Criar novo
Salvar
Design de camiseta de floresta de fadas
Pronto para imprimir
para Merch
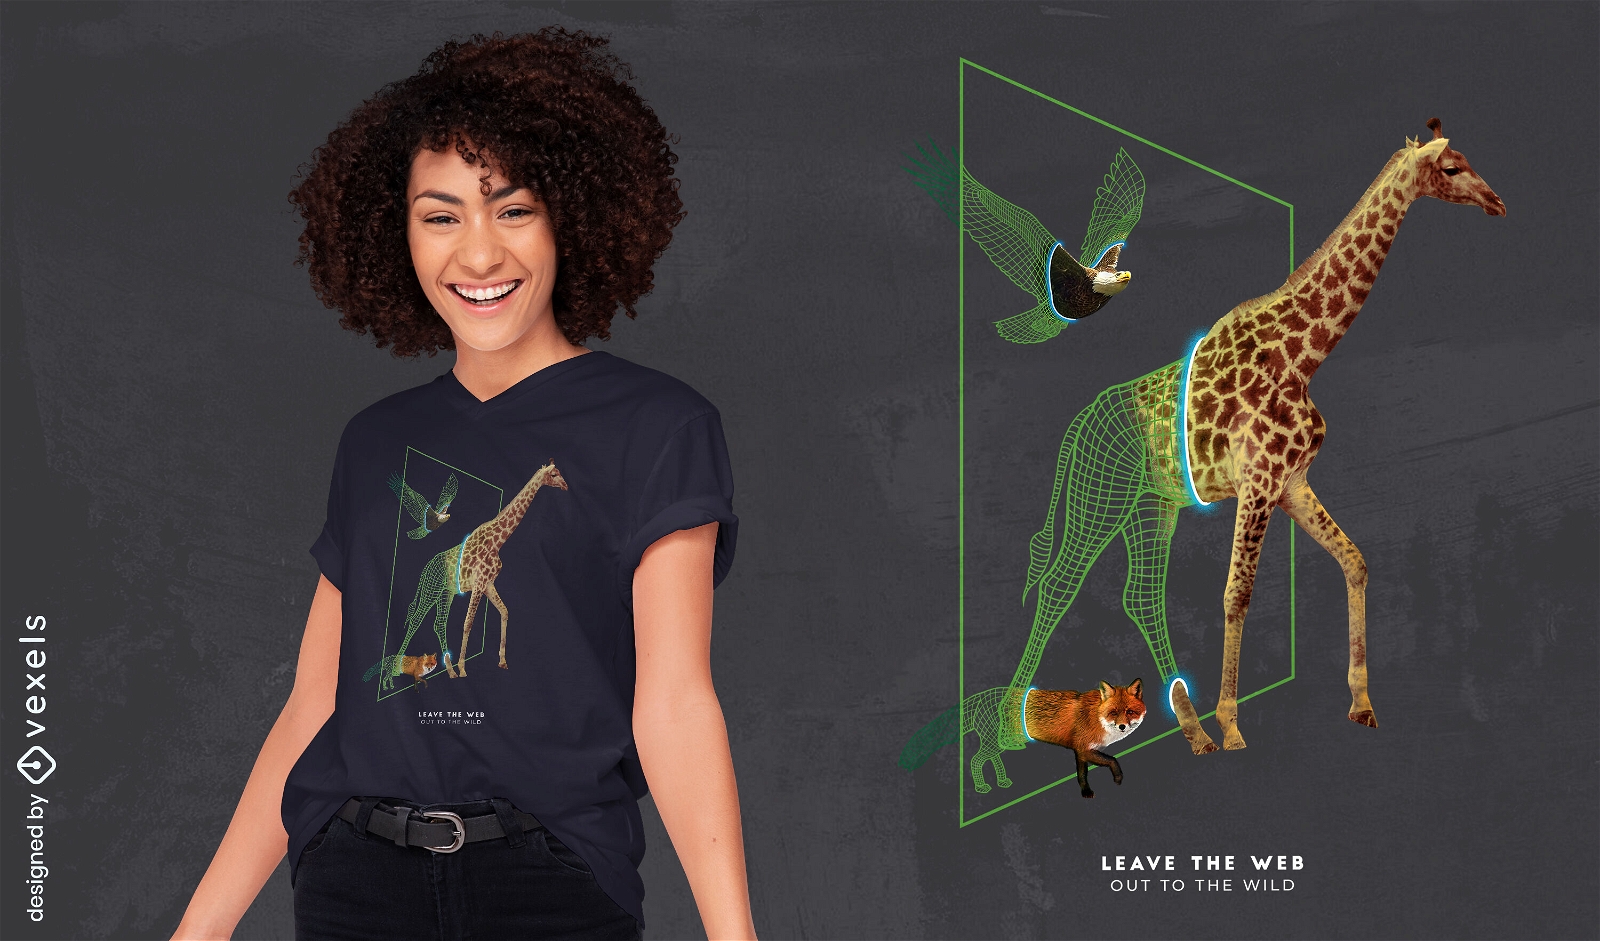
Animais selvagens caminham pelo portal t-shirt psd
Escolha uma pasta
Todos os favoritos
Criar novo
Salvar
Animais selvagens caminham pelo portal t-shirt psd
Pronto para imprimir
para Merch
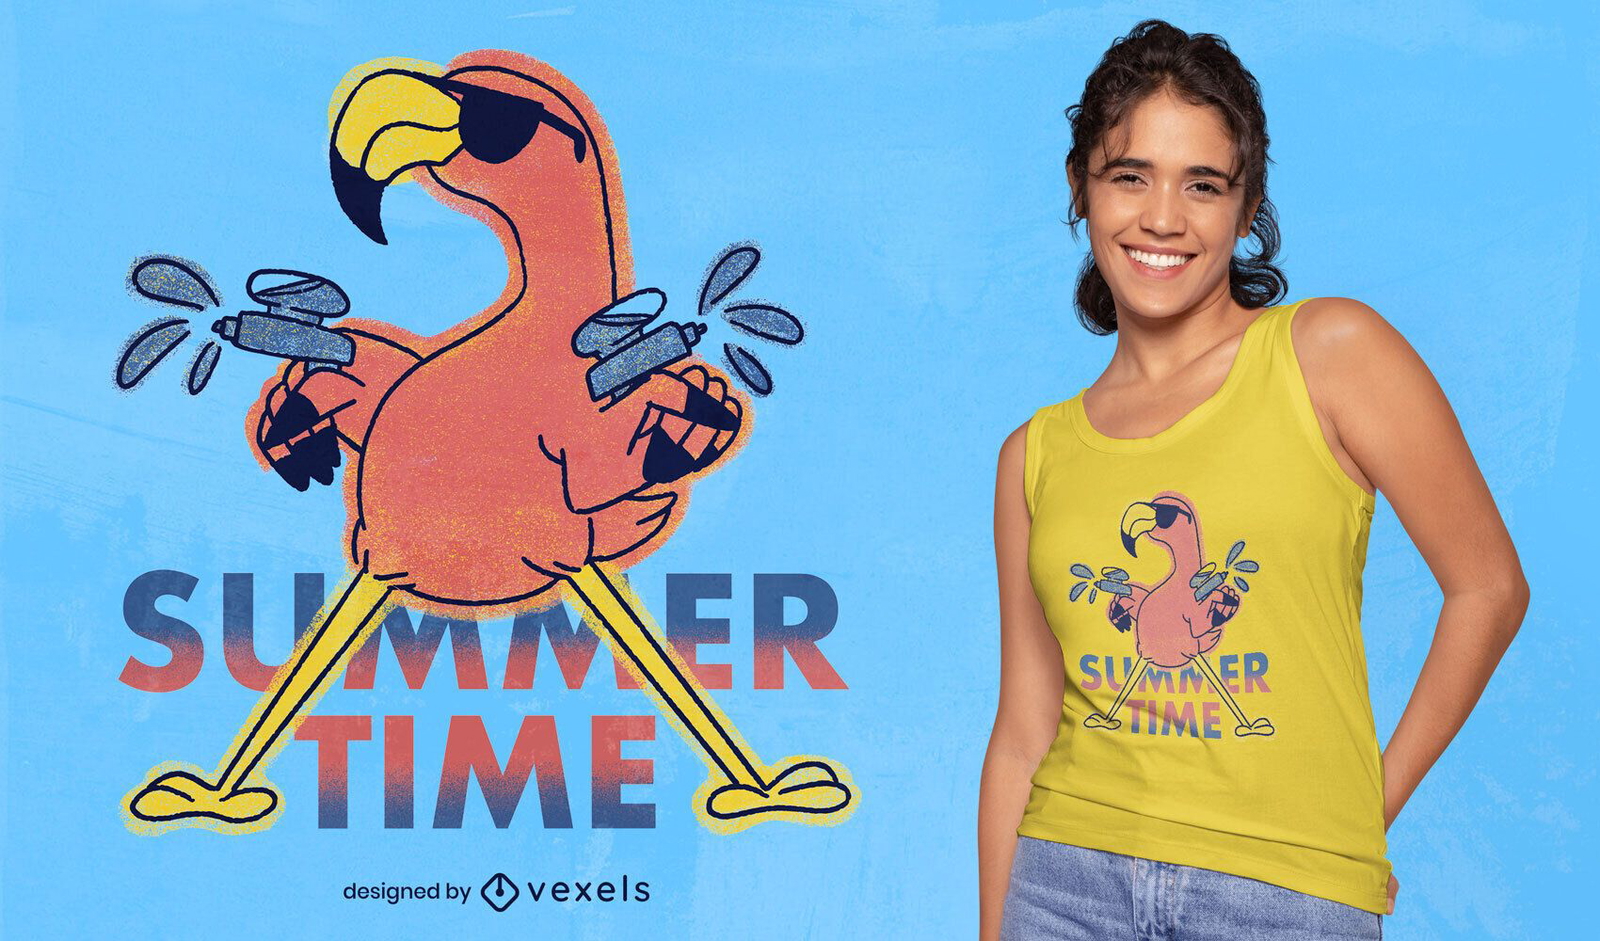
Camiseta de flamingo doodle psd para o verão
Escolha uma pasta
Todos os favoritos
Criar novo
Salvar
Camiseta de flamingo doodle psd para o verão
Camiseta PSD escalável
para Merch
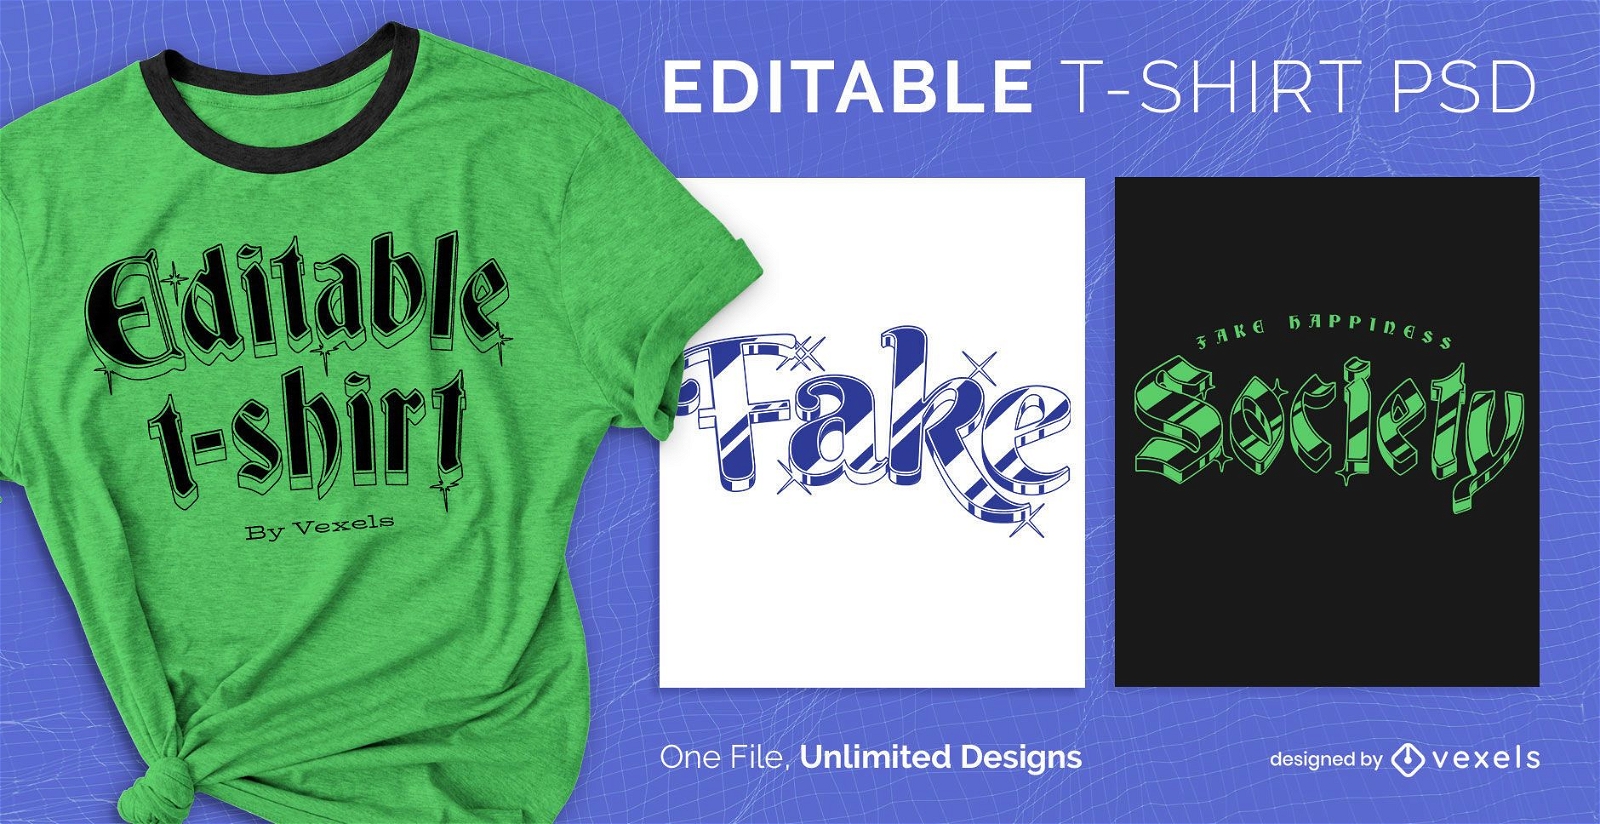
T-shirt PSD escalável com texto 3D brilhante
Escolha uma pasta
Todos os favoritos
Criar novo
Salvar
T-shirt PSD escalável com texto 3D brilhante
Pronto para imprimir
para Merch
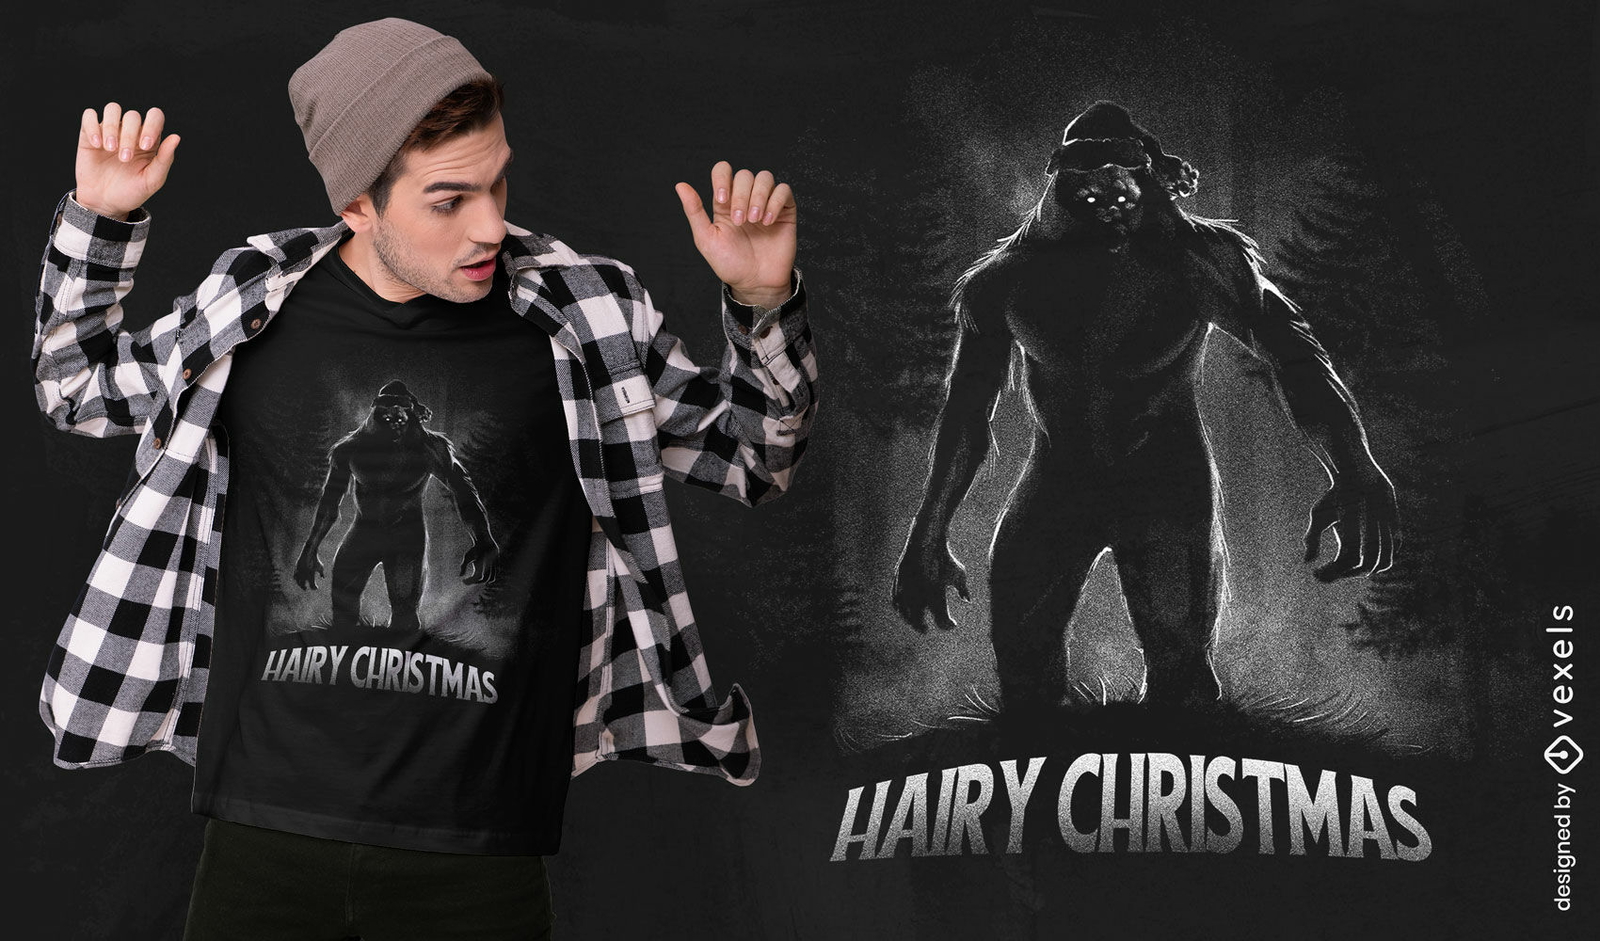
Camiseta assustadora do monstro do pé grande psd
Escolha uma pasta
Todos os favoritos
Criar novo
Salvar
Camiseta assustadora do monstro do pé grande psd
texto editável
Pronto para imprimir
para Merch
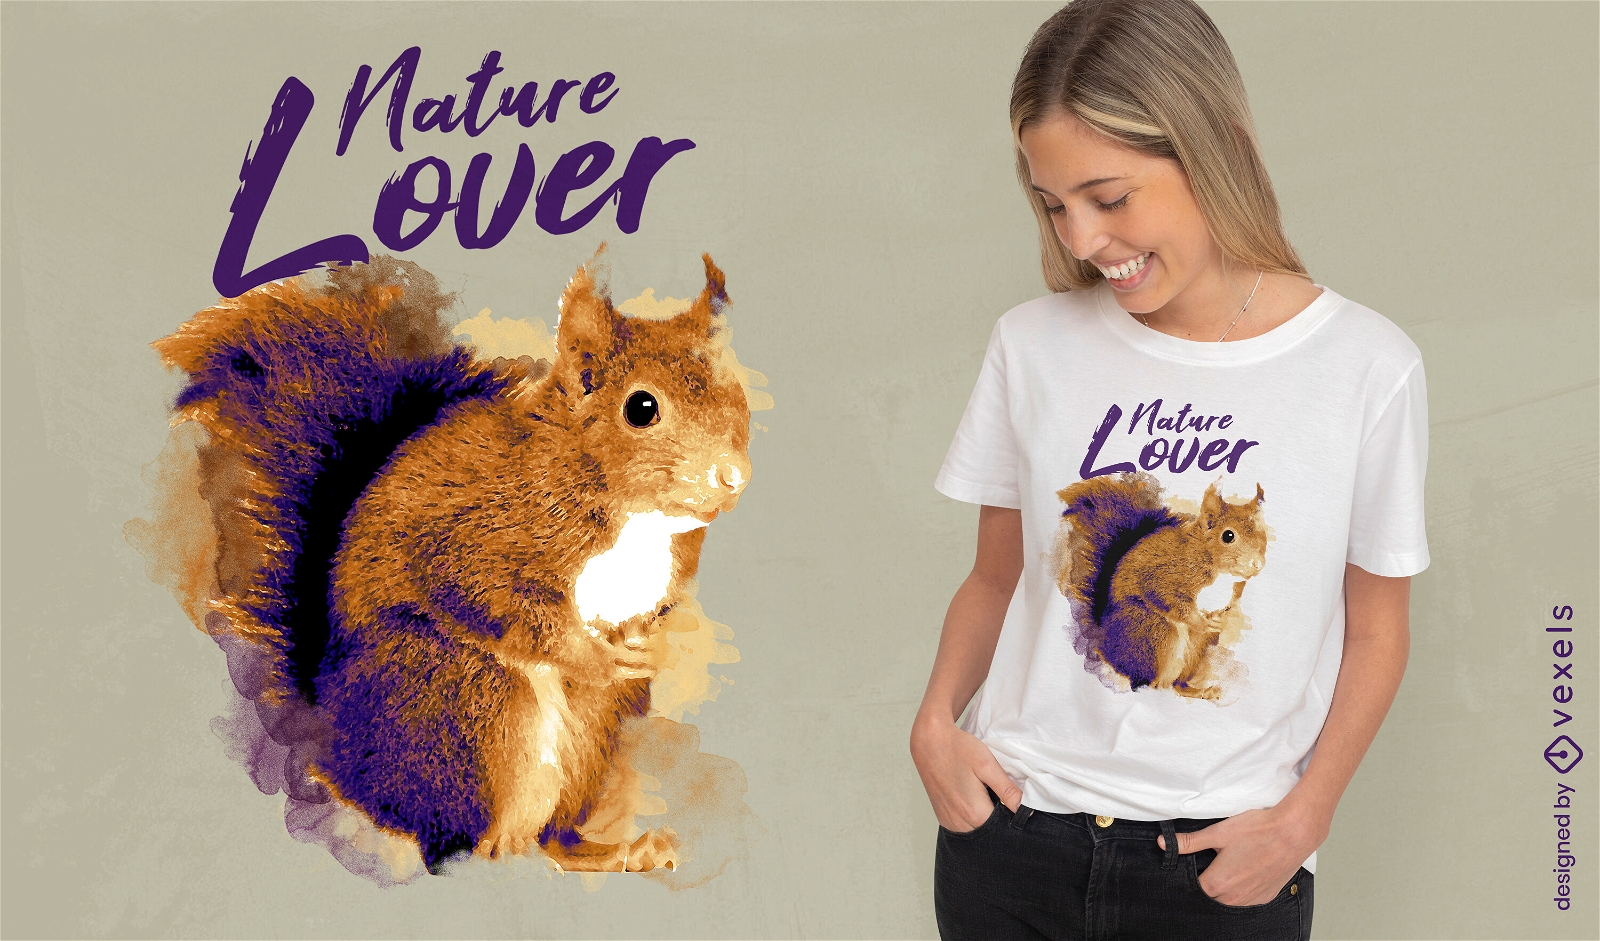
T-shirt aquarela animal esquilo psd
Escolha uma pasta
Todos os favoritos
Criar novo
Salvar
T-shirt aquarela animal esquilo psd
texto editável
Pronto para imprimir
para Merch
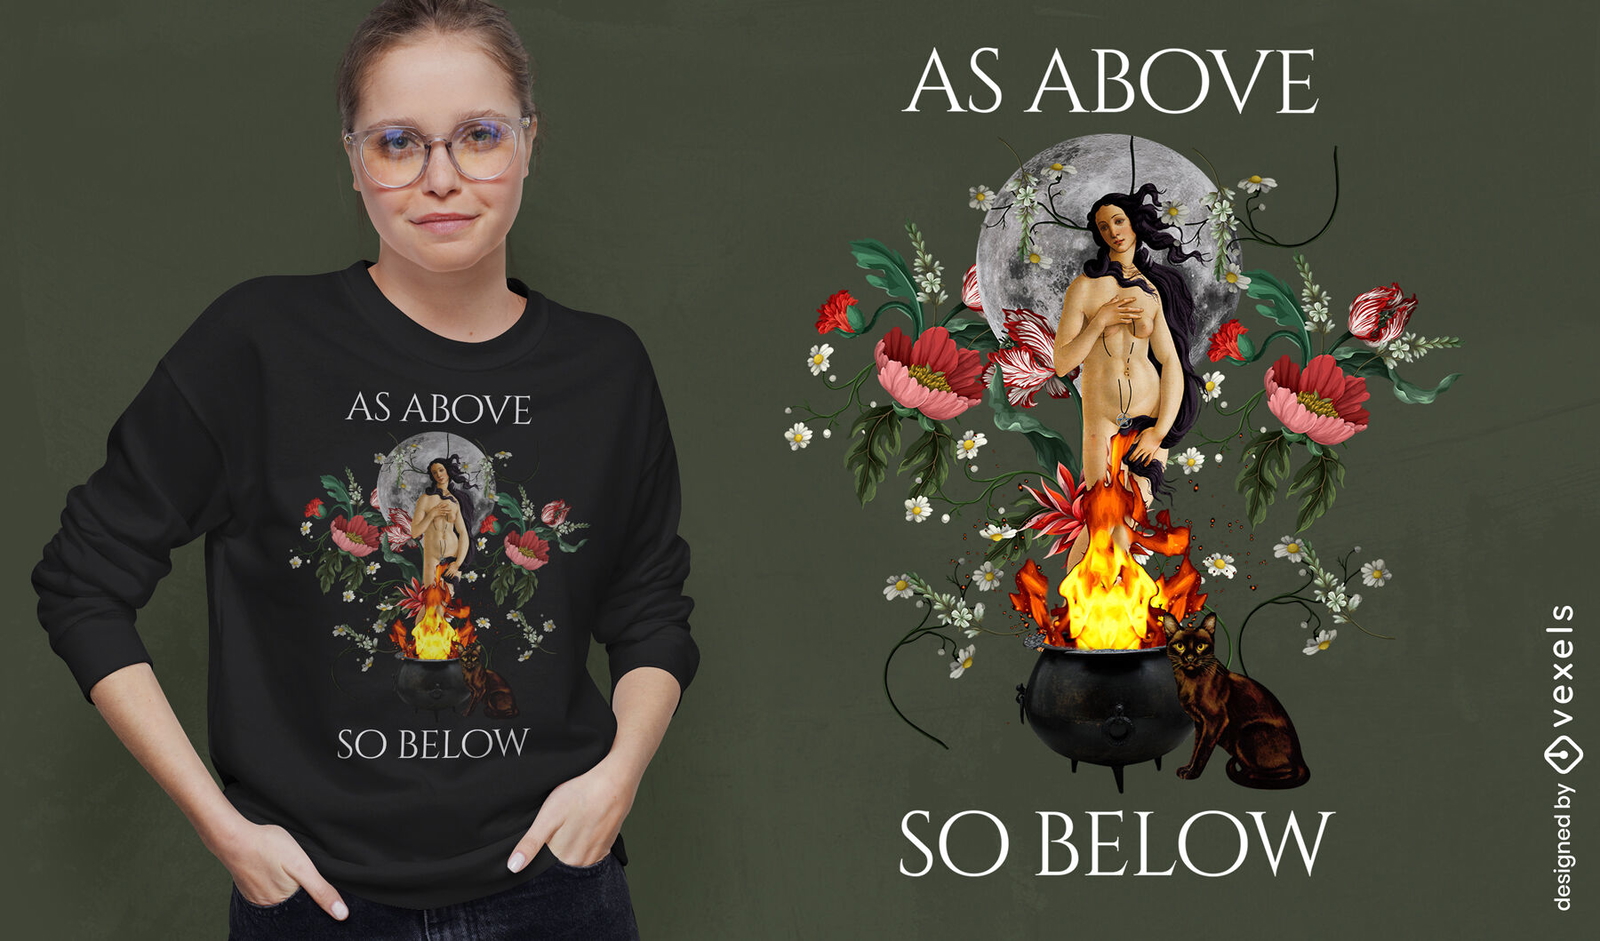
Vênus bruxa natureza PSD design de camiseta
Escolha uma pasta
Todos os favoritos
Criar novo
Salvar
Vênus bruxa natureza PSD design de camiseta
Impulsione seu negócio
Com a plataforma gráfica líder de mercado.
Ver planos
Próxima
do 67
prev page
next page