Biblioteca de design
Novos designs Merch
Camisetas
Vectores
Designs de Merch de Tendência
PNGs & SVGs
Mockups
Modelos de T-Shirt PSD
Explorar Desenhos
Designs KDP
Pôsteres
Canecas
Capas para celular
Sacos de compras
Almofadas
Ferramentas de desenho
Merch Designer
Novo!
Mockup Generator
Gerador de Design de AI
Vetorizador
Quote Generator
T-Shirt Maker (Antigo)
Ajuda
Merch Digest
Blog
Centro de Ajuda
Saiba mais sobre o Merch
Feedback
Soluções Corporativas
Empresa
Acesso à API
Estúdio de Design
Design em Lote
Preços
Carregando...
Inscrever-se
Conecte-se
PSD Templates
graficos
Biblioteca de design
Novos designs Merch
Camisetas
Vectores
Designs de Merch de Tendência
PNGs & SVGs
Mockups
Modelos de T-Shirt PSD
Explorar Desenhos
Designs KDP
Pôsteres
Canecas
Capas para celular
Sacos de compras
Almofadas
Ferramentas de desenho
Merch Designer
Novo!
Mockup Generator
Gerador de Design de AI
Vetorizador
Quote Generator
T-Shirt Maker (Antigo)
Ajuda
Merch Digest
Blog
Centro de Ajuda
Saiba mais sobre o Merch
Feedback
Soluções Corporativas
Empresa
Acesso à API
Estúdio de Design
Design em Lote
PLANOS
PSD Templates
graficos
3311 Designs de Camisetas e Mockups PSD de graficos
Baixar designs de camisetas ou mockups PSD editáveis de graficos
Relacionado:
graficos vetoriais
,
desenhos graficos de ações
,
graficos tridimensionais
Ordenar por
Mais relevante
Resultados patrocinados da
Ganhe 15% de desconto com o código: VEXELS15
veja mais detalhes
Pronto para imprimir
para Merch
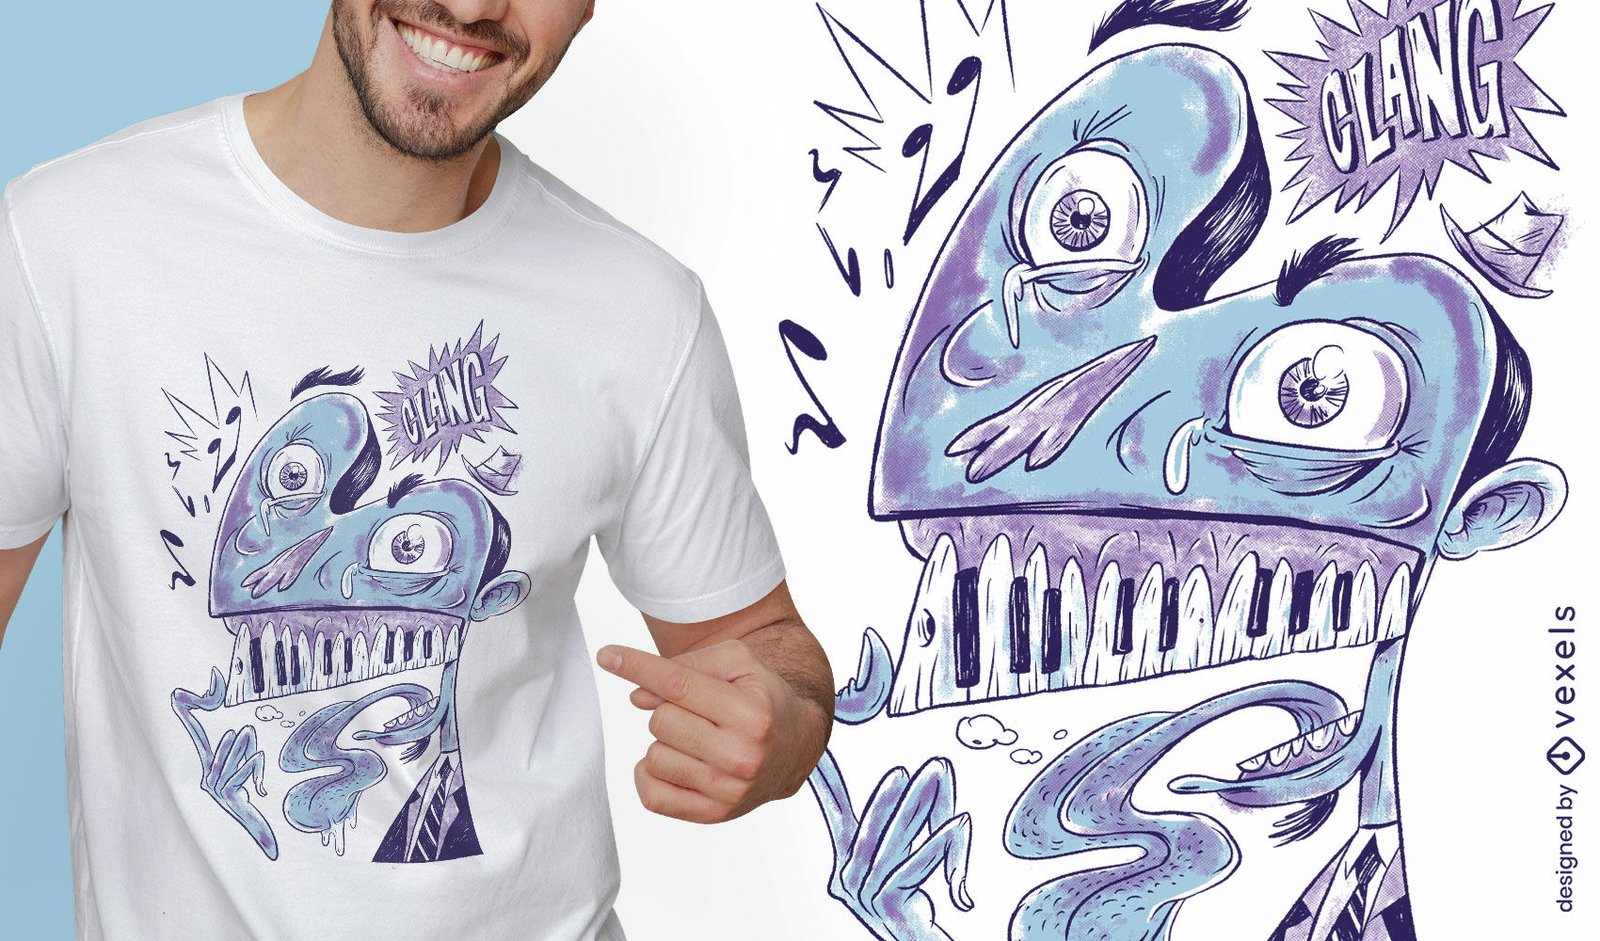
Design de t-shirt de músico de desenho animado de pianista
Escolha uma pasta
Todos os favoritos
Criar novo
Salvar
Design de t-shirt de músico de desenho animado de pianista
Pronto para imprimir
para Merch
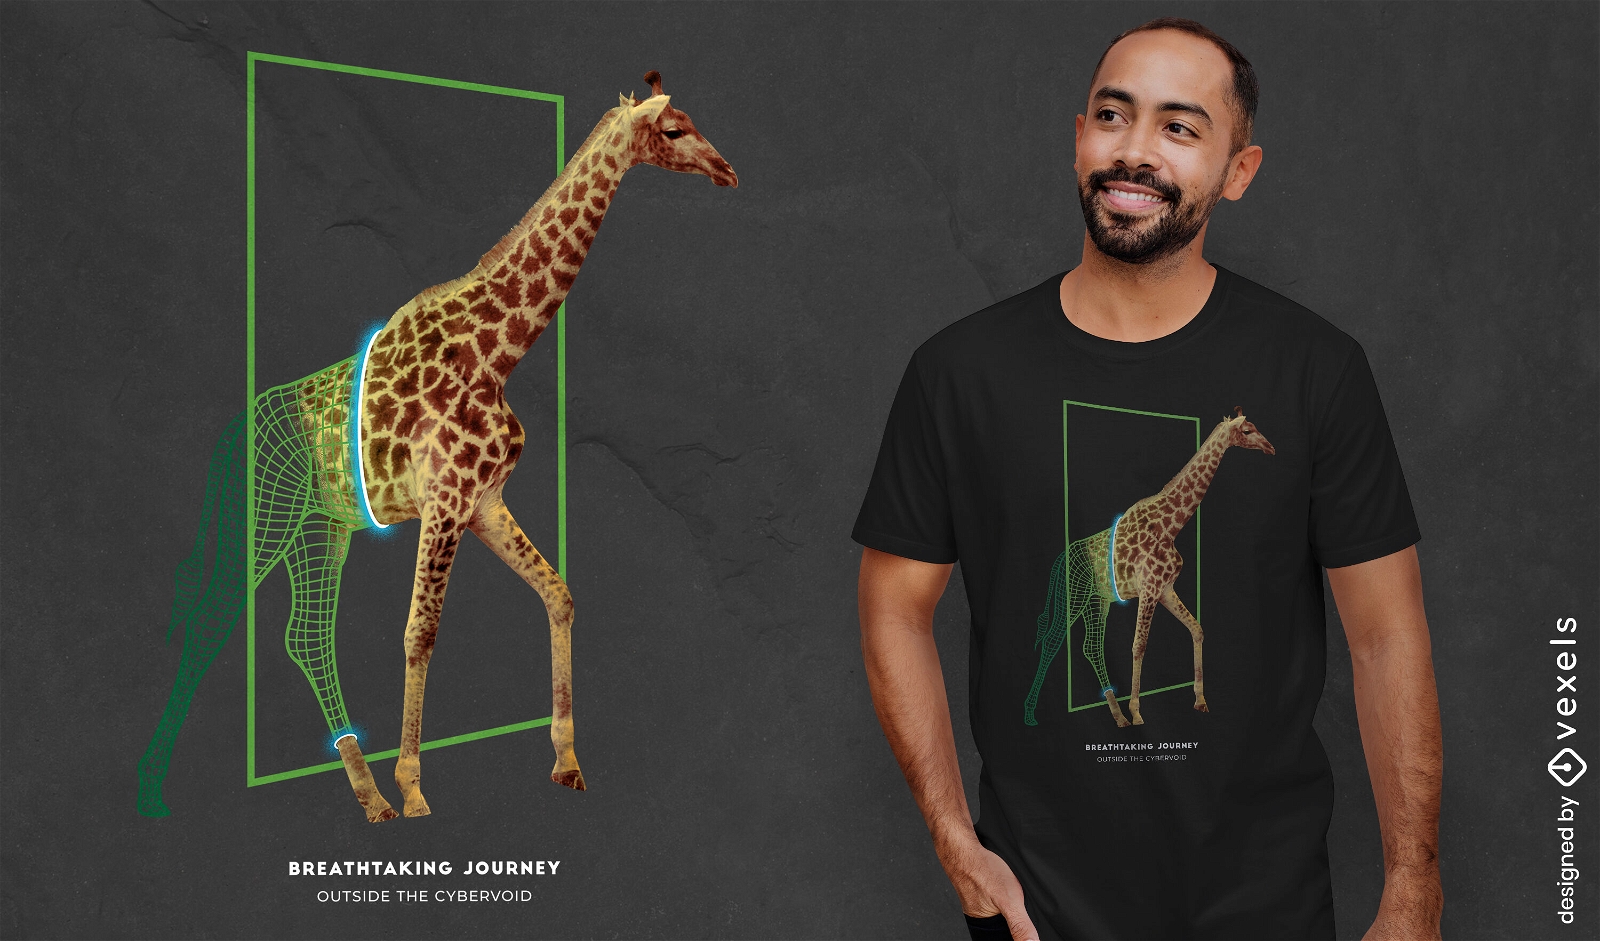
T-shirt portal do animal selvagem girafa psd
Escolha uma pasta
Todos os favoritos
Criar novo
Salvar
T-shirt portal do animal selvagem girafa psd
Pronto para imprimir
para Merch
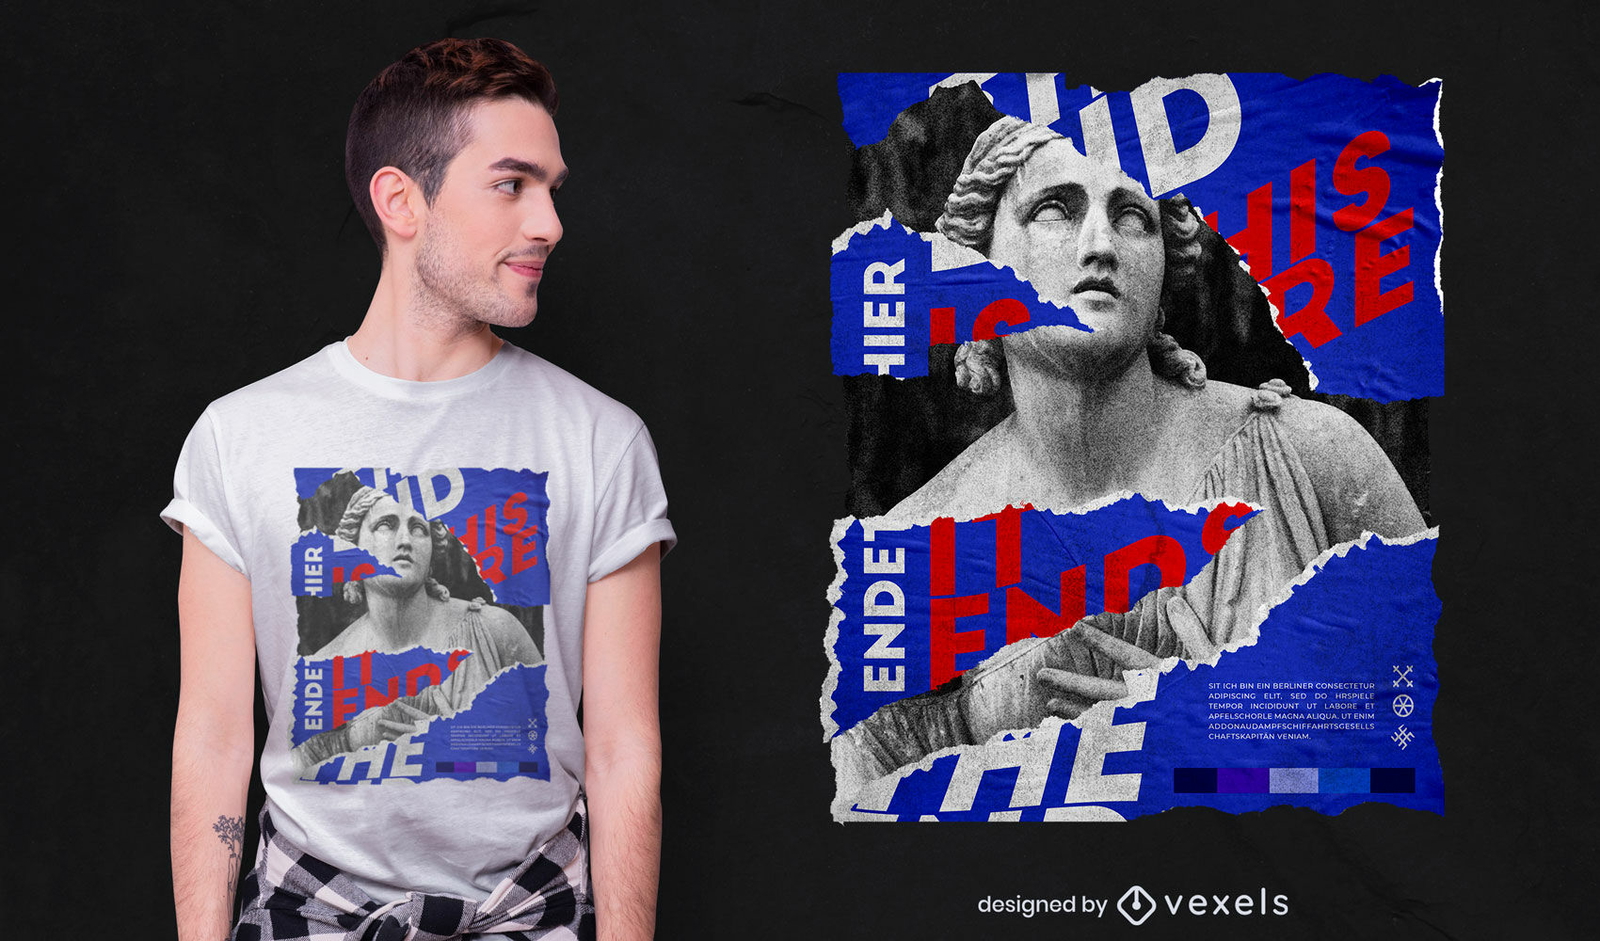
O design da t-shirt psd estátua final
Escolha uma pasta
Todos os favoritos
Criar novo
Salvar
O design da t-shirt psd estátua final
Camiseta PSD escalável
para Merch
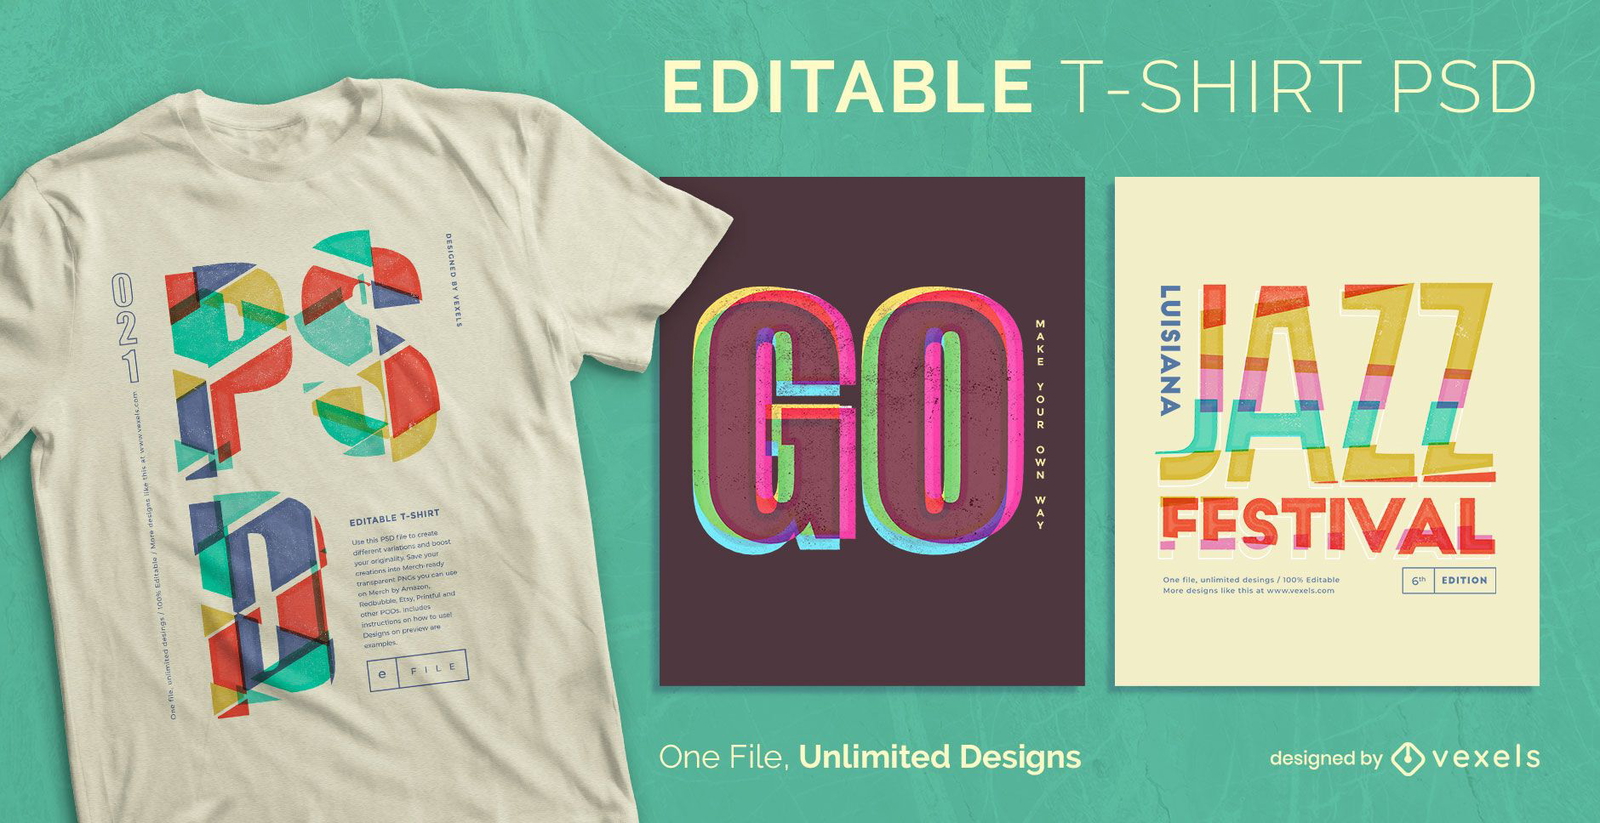
T-shirt escalável com citações transparentes psd
Escolha uma pasta
Todos os favoritos
Criar novo
Salvar
T-shirt escalável com citações transparentes psd
Camiseta PSD escalável
para Merch
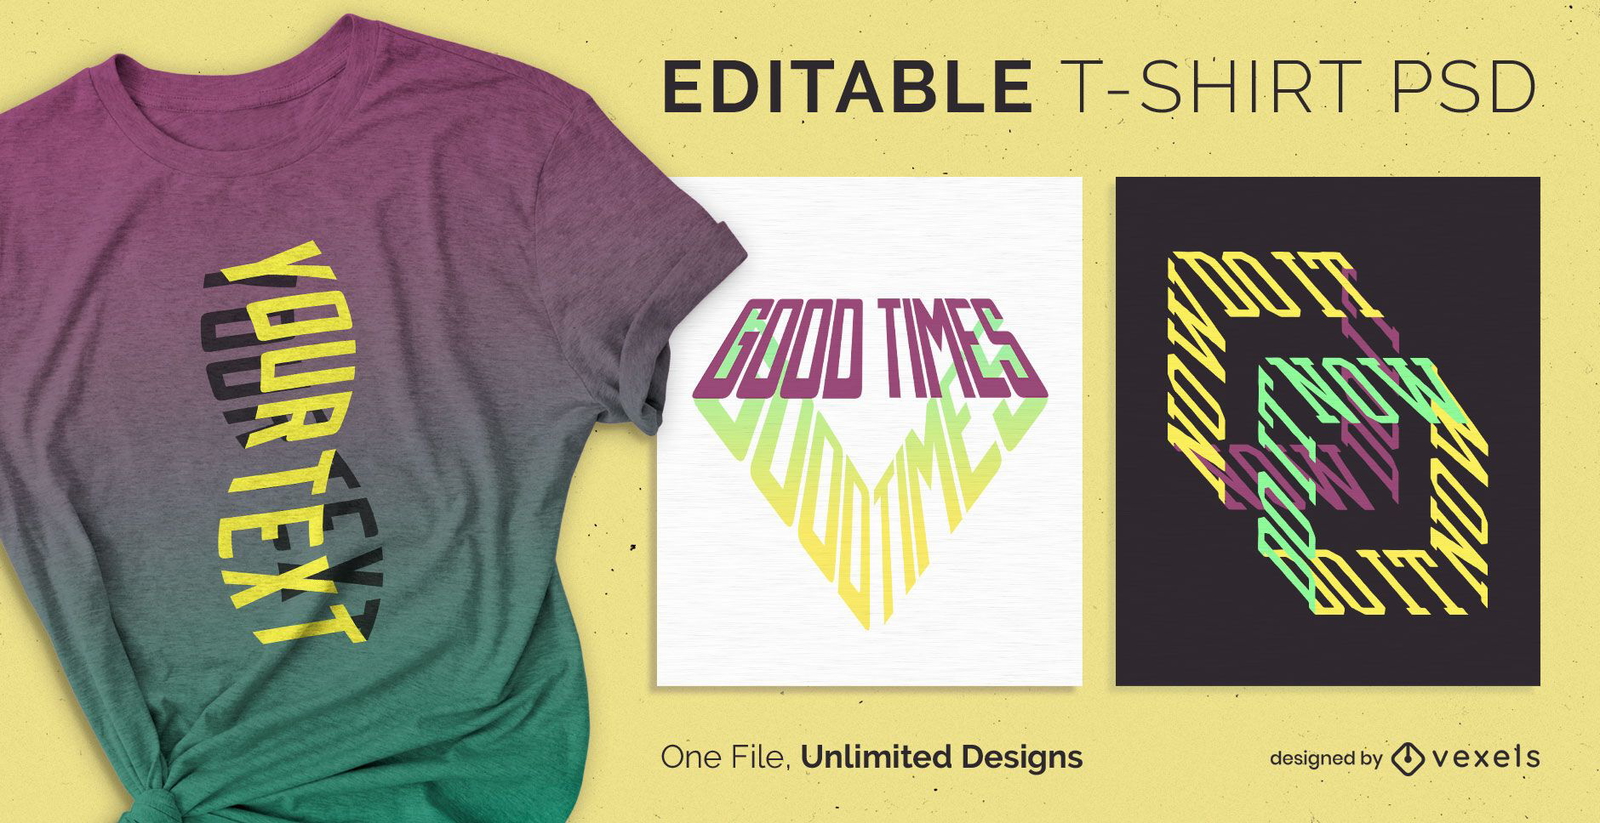
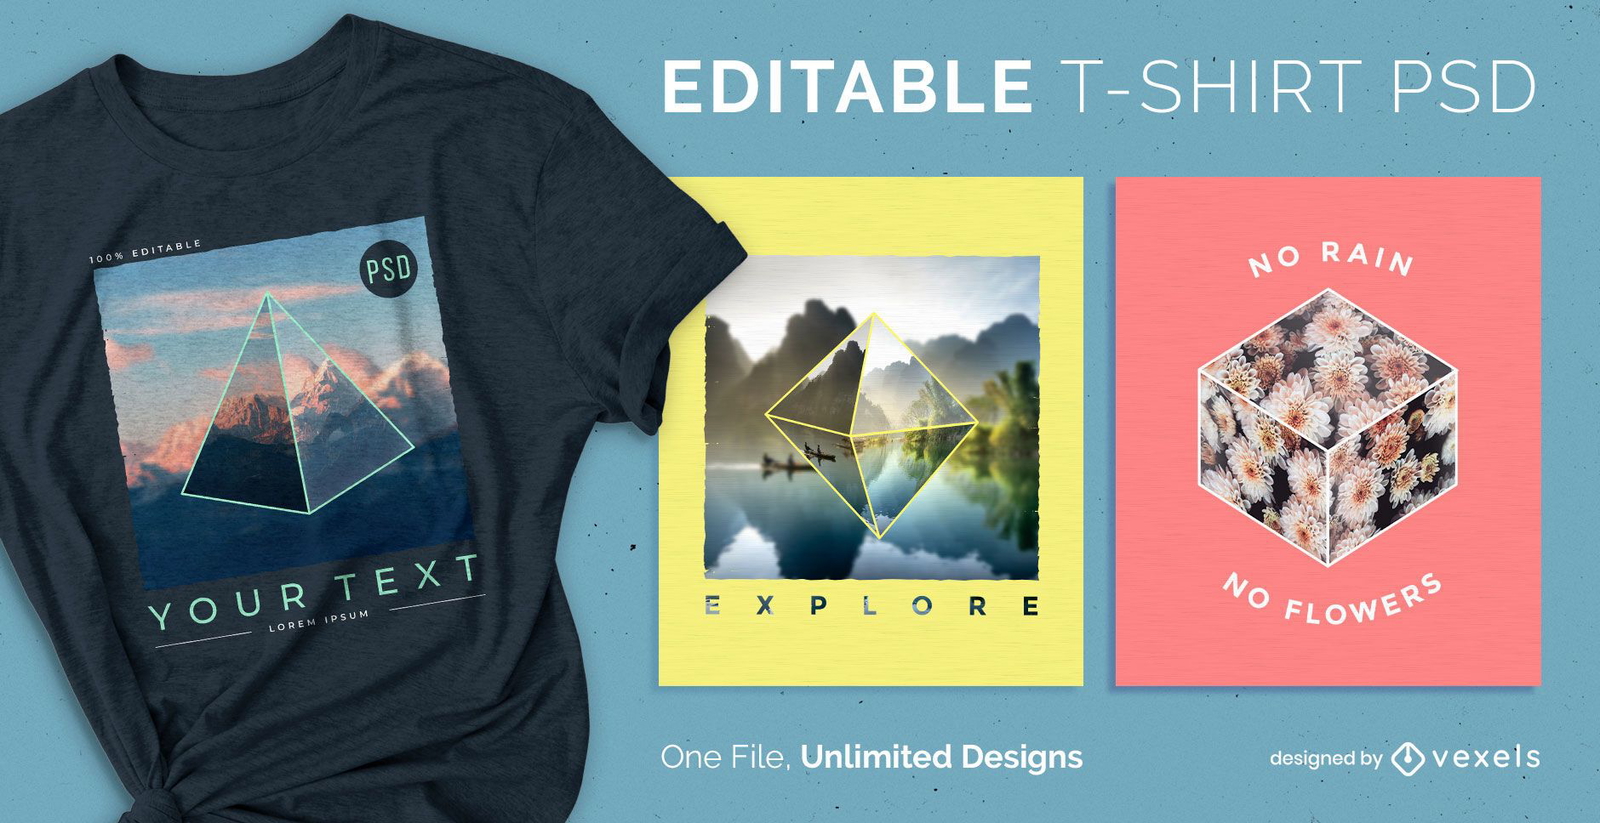
O texto molda a camiseta escalável psd
Escolha uma pasta
Todos os favoritos
Criar novo
Salvar
O texto molda a camiseta escalável psd
Camiseta PSD escalável
para Merch
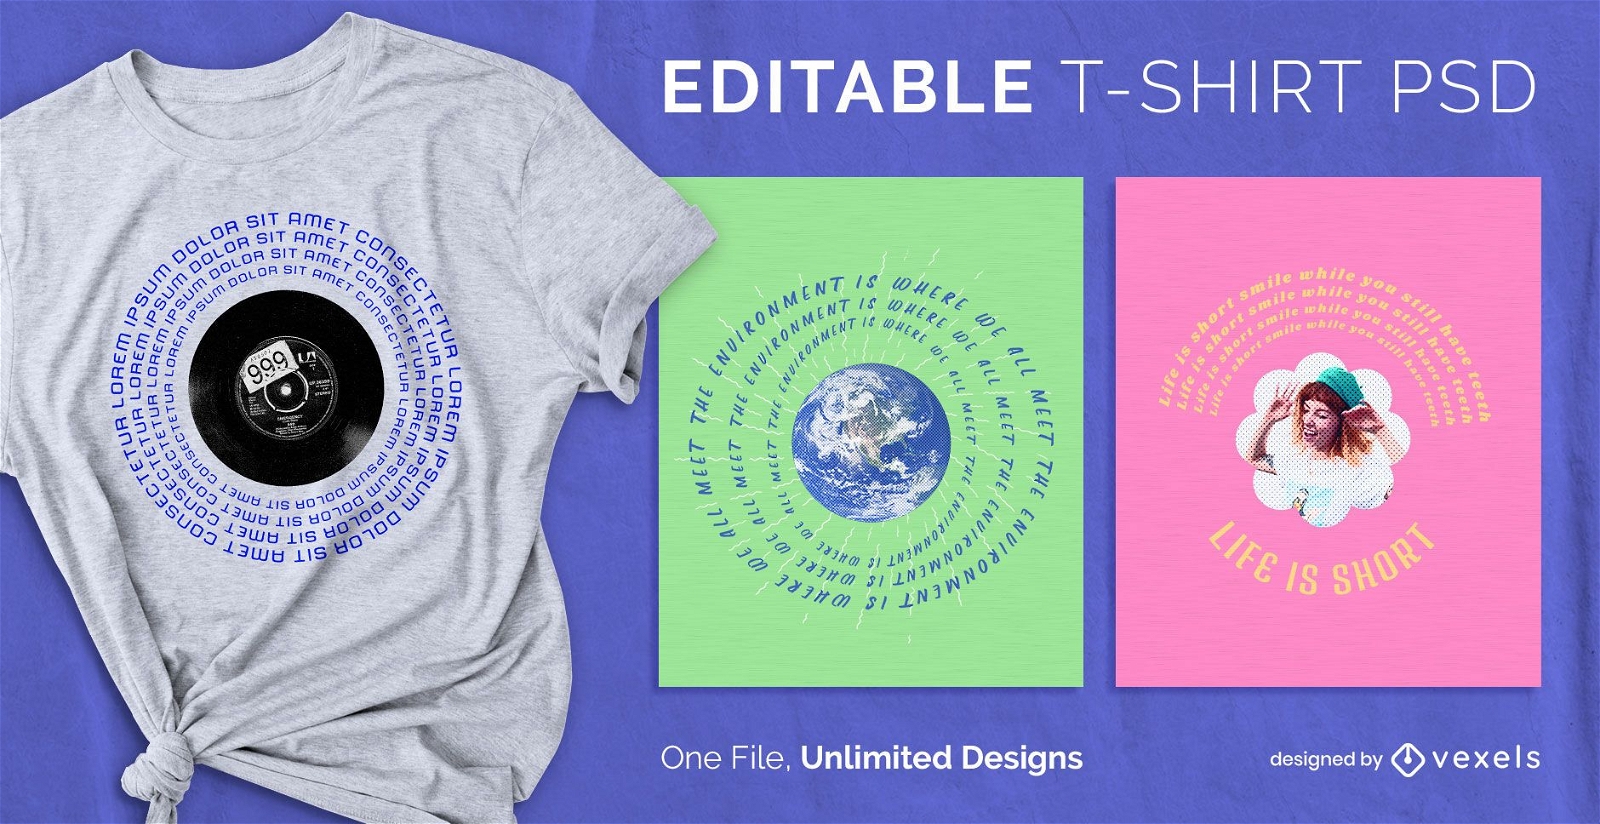
T-shirt escalável com texto circular psd
Escolha uma pasta
Todos os favoritos
Criar novo
Salvar
T-shirt escalável com texto circular psd
Gerado por IA, selecionado por nossos designers.
para Merch
Design de camiseta de guaxinim e gambá
Escolha uma pasta
Todos os favoritos
Criar novo
Salvar
Design de camiseta de guaxinim e gambá
Pronto para imprimir
para Merch
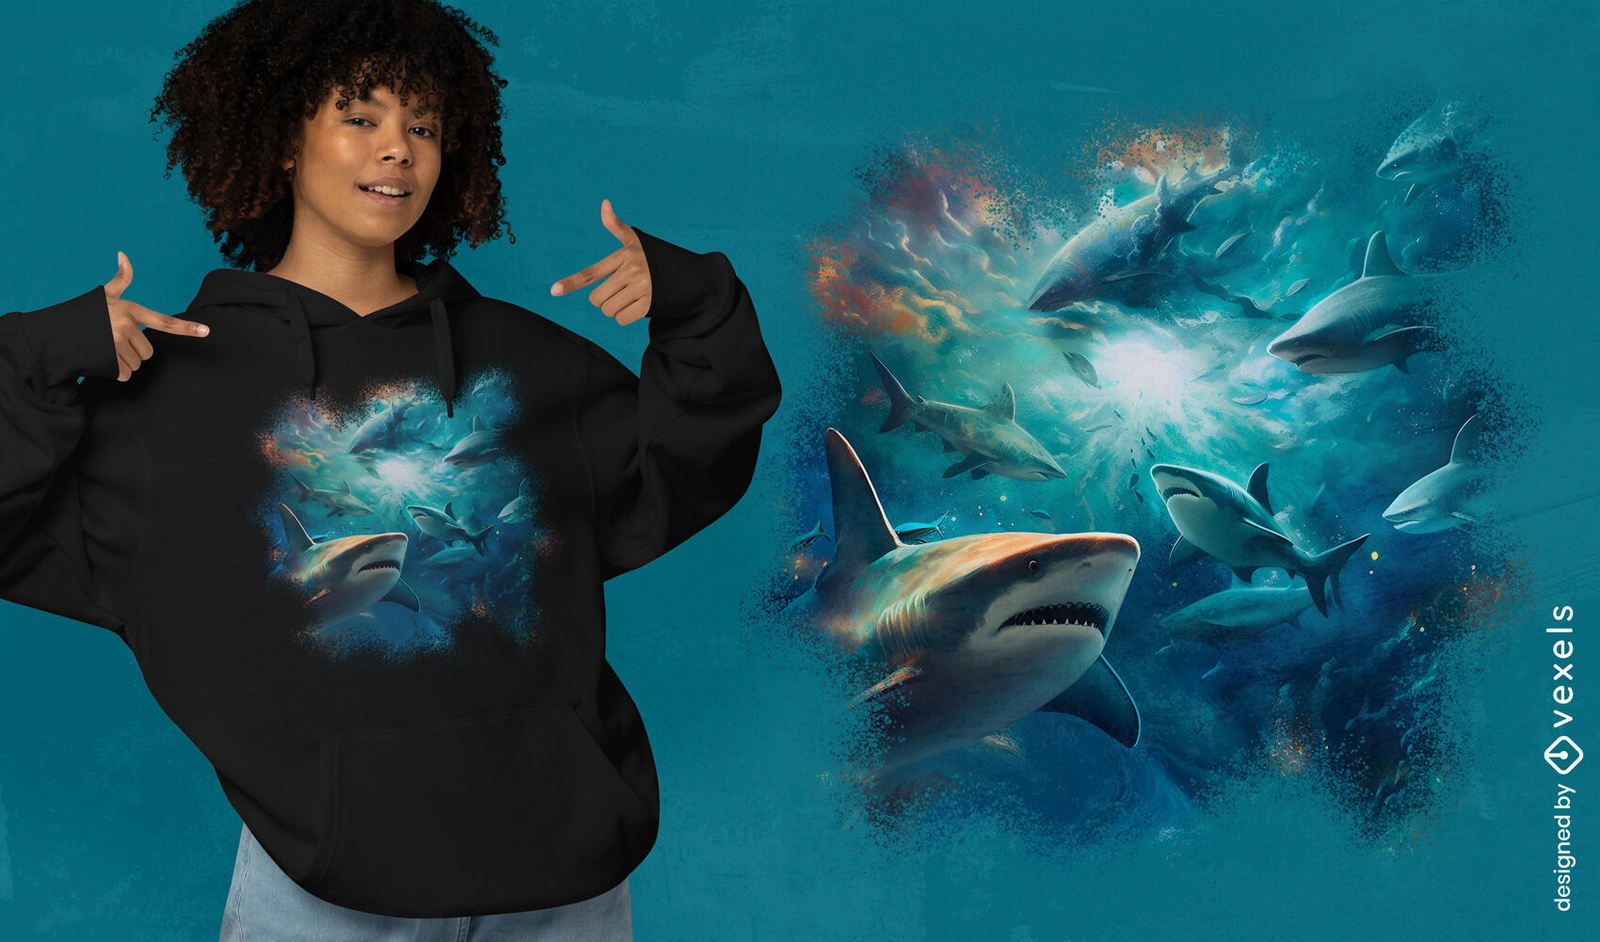
Design de camiseta de tubarões no oceano
Escolha uma pasta
Todos os favoritos
Criar novo
Salvar
Design de camiseta de tubarões no oceano
Pronto para imprimir
para Merch
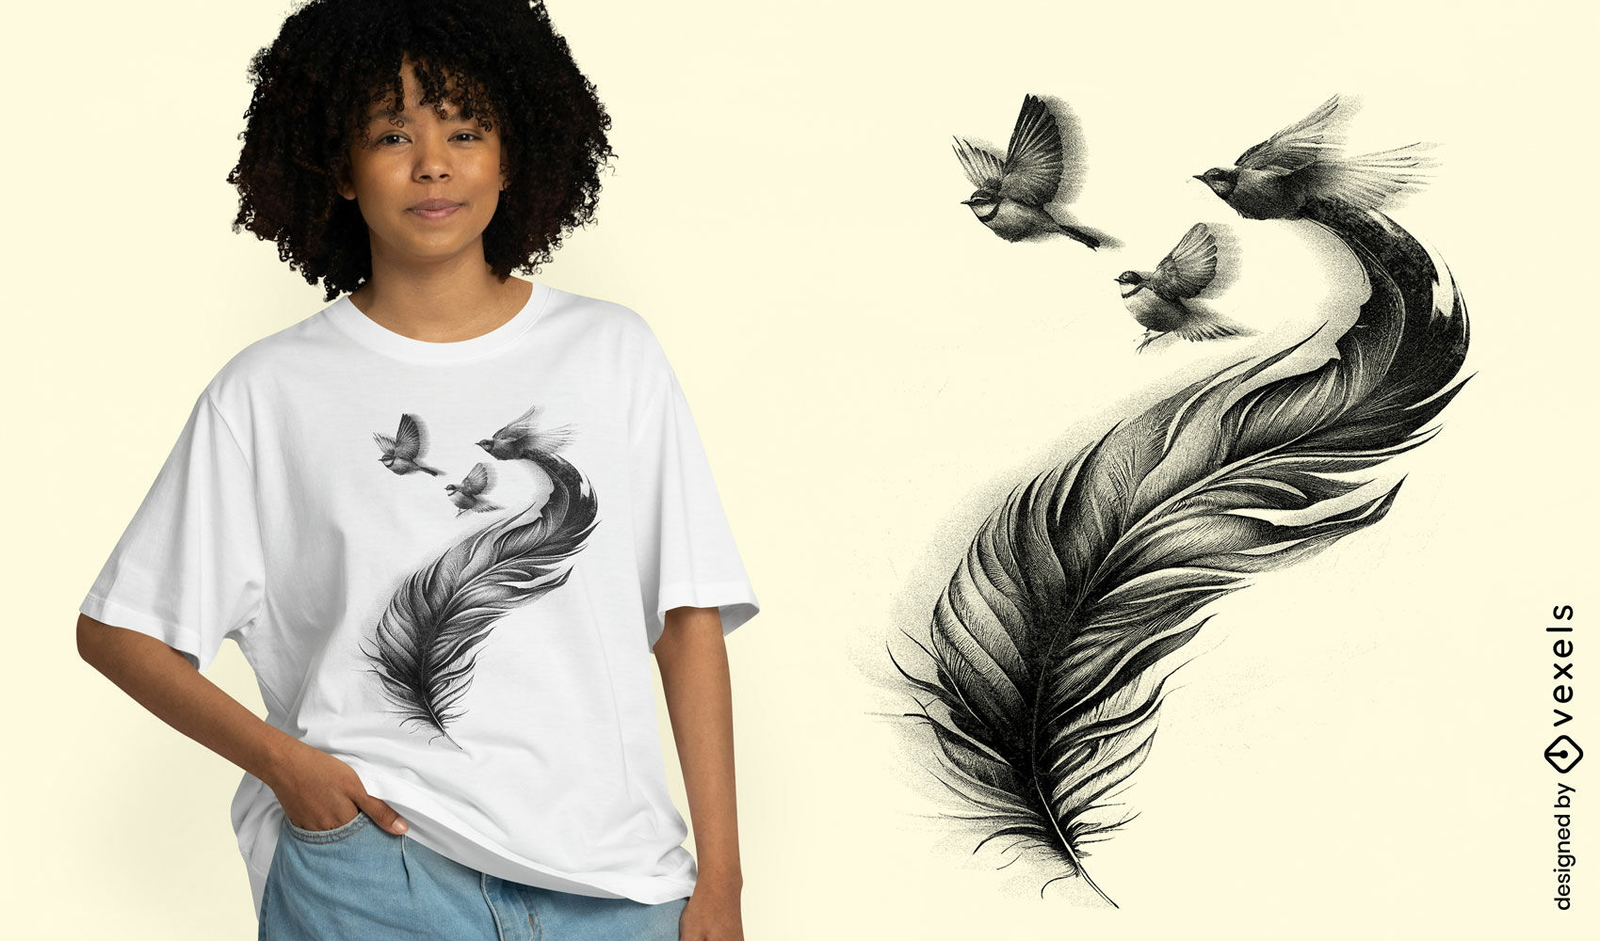
Pena com design de camiseta de pássaros
Escolha uma pasta
Todos os favoritos
Criar novo
Salvar
Pena com design de camiseta de pássaros
Pronto para imprimir
para Merch
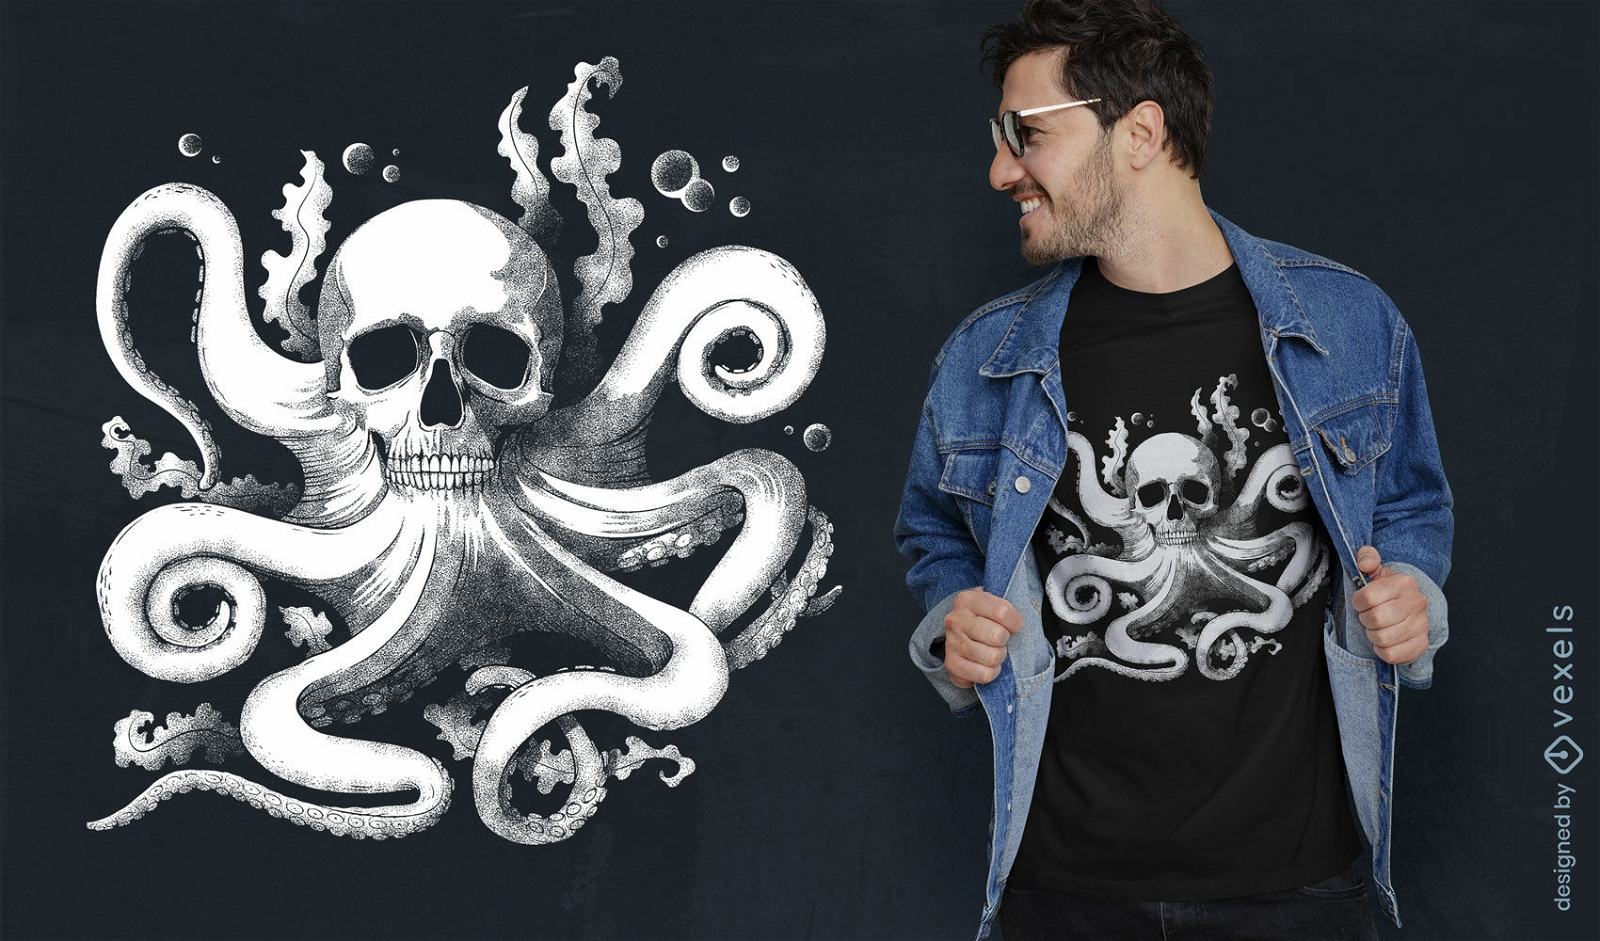
Design de camiseta de caveira de polvo
Escolha uma pasta
Todos os favoritos
Criar novo
Salvar
Design de camiseta de caveira de polvo
Pronto para imprimir
para Merch
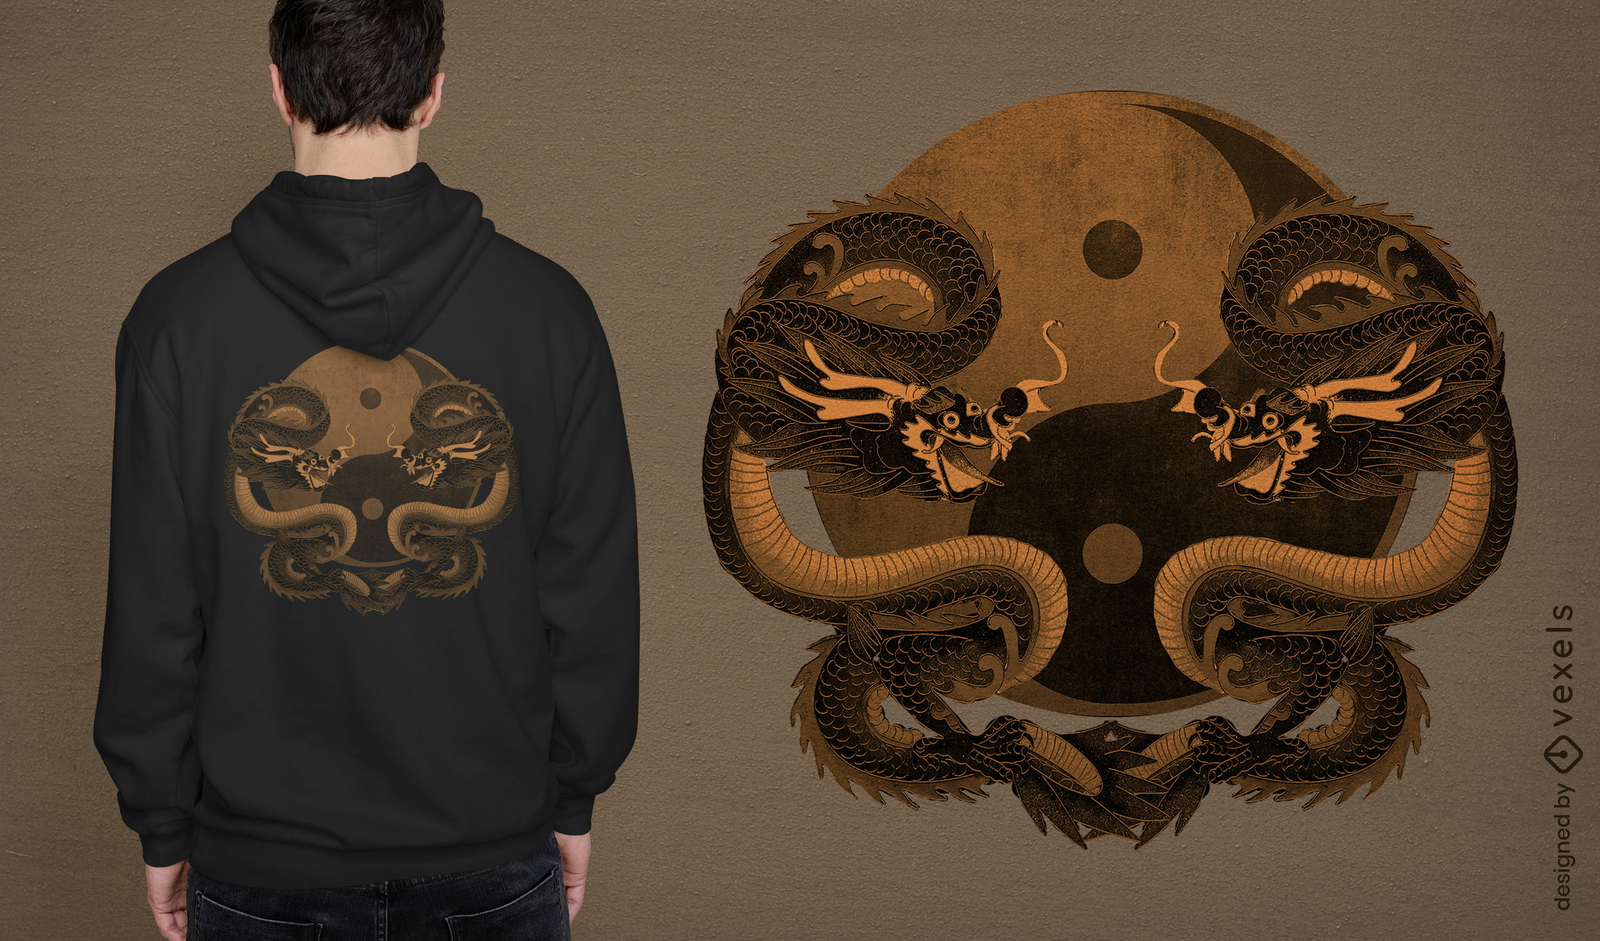
T-shirt de dragões antigos yin yang psd
Escolha uma pasta
Todos os favoritos
Criar novo
Salvar
T-shirt de dragões antigos yin yang psd
texto editável
Pronto para imprimir
para Merch
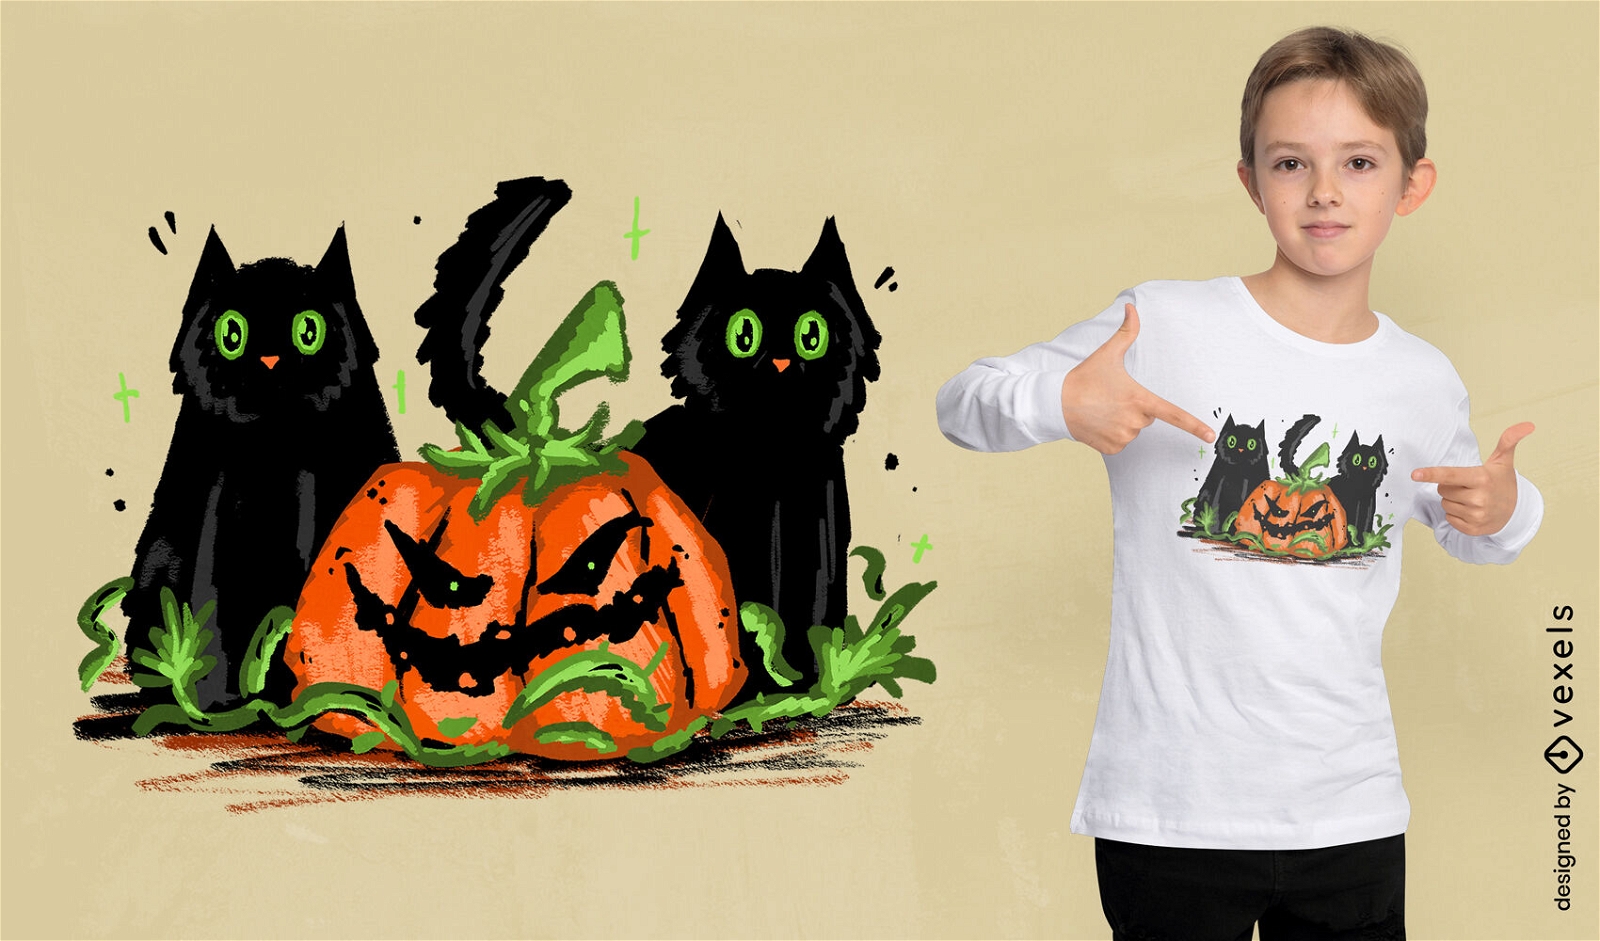
Design de camiseta fofa de halloween de gato preto
Escolha uma pasta
Todos os favoritos
Criar novo
Salvar
Design de camiseta fofa de halloween de gato preto
Pronto para imprimir
para Merch
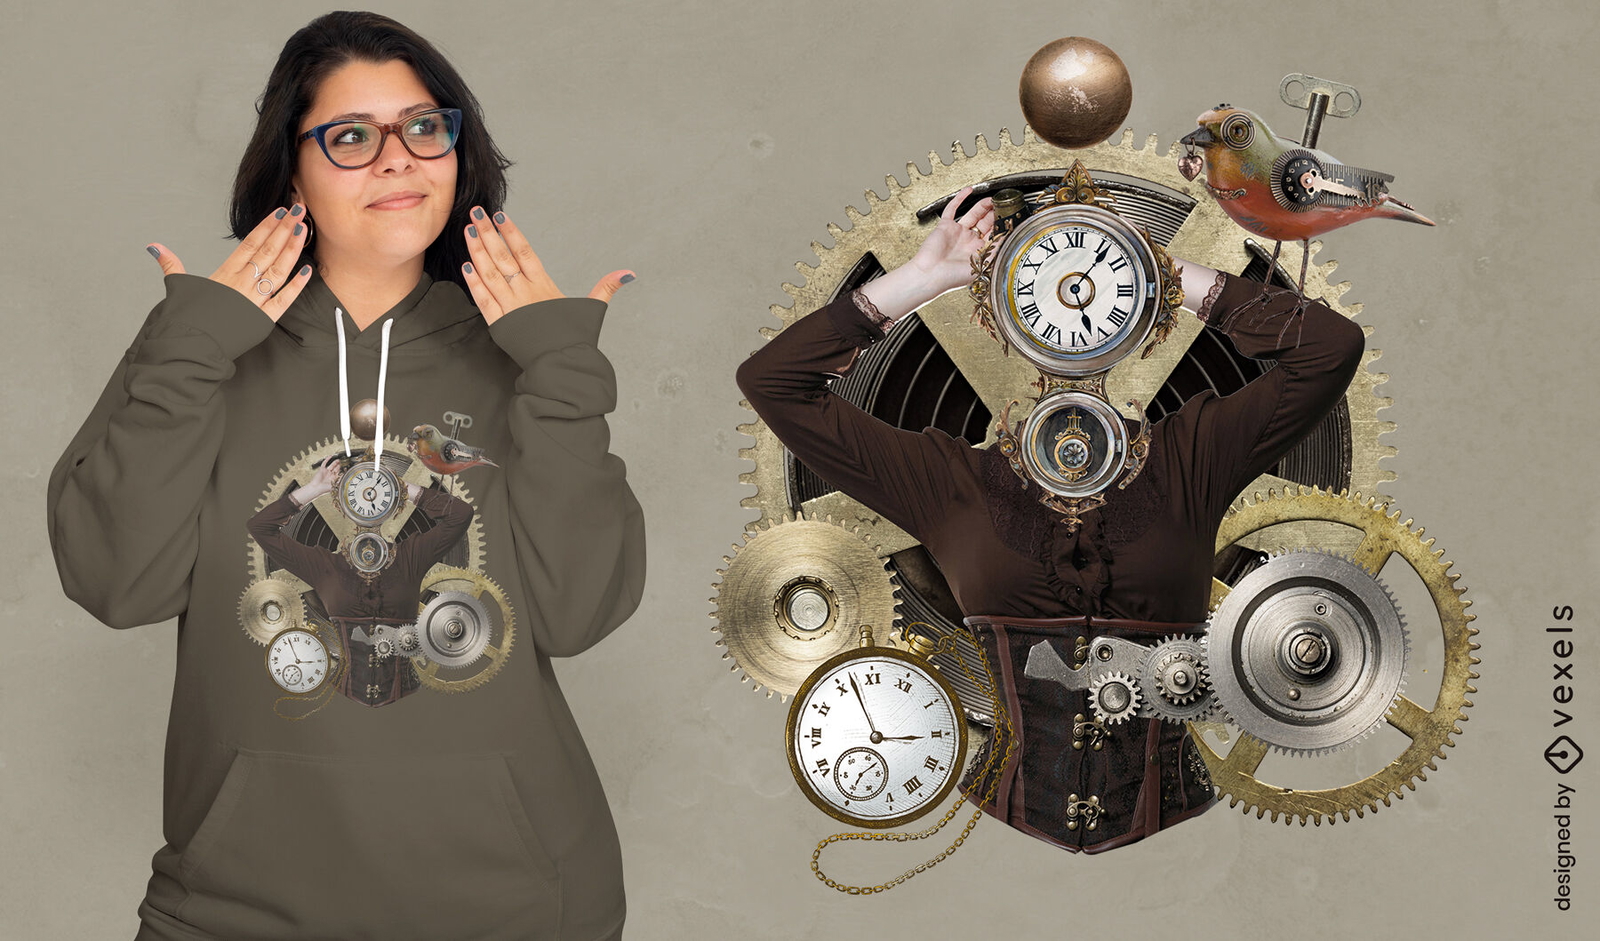
Relógios e engrenagens camiseta steampunk psd
Escolha uma pasta
Todos os favoritos
Criar novo
Salvar
Relógios e engrenagens camiseta steampunk psd
Pronto para imprimir
para Merch
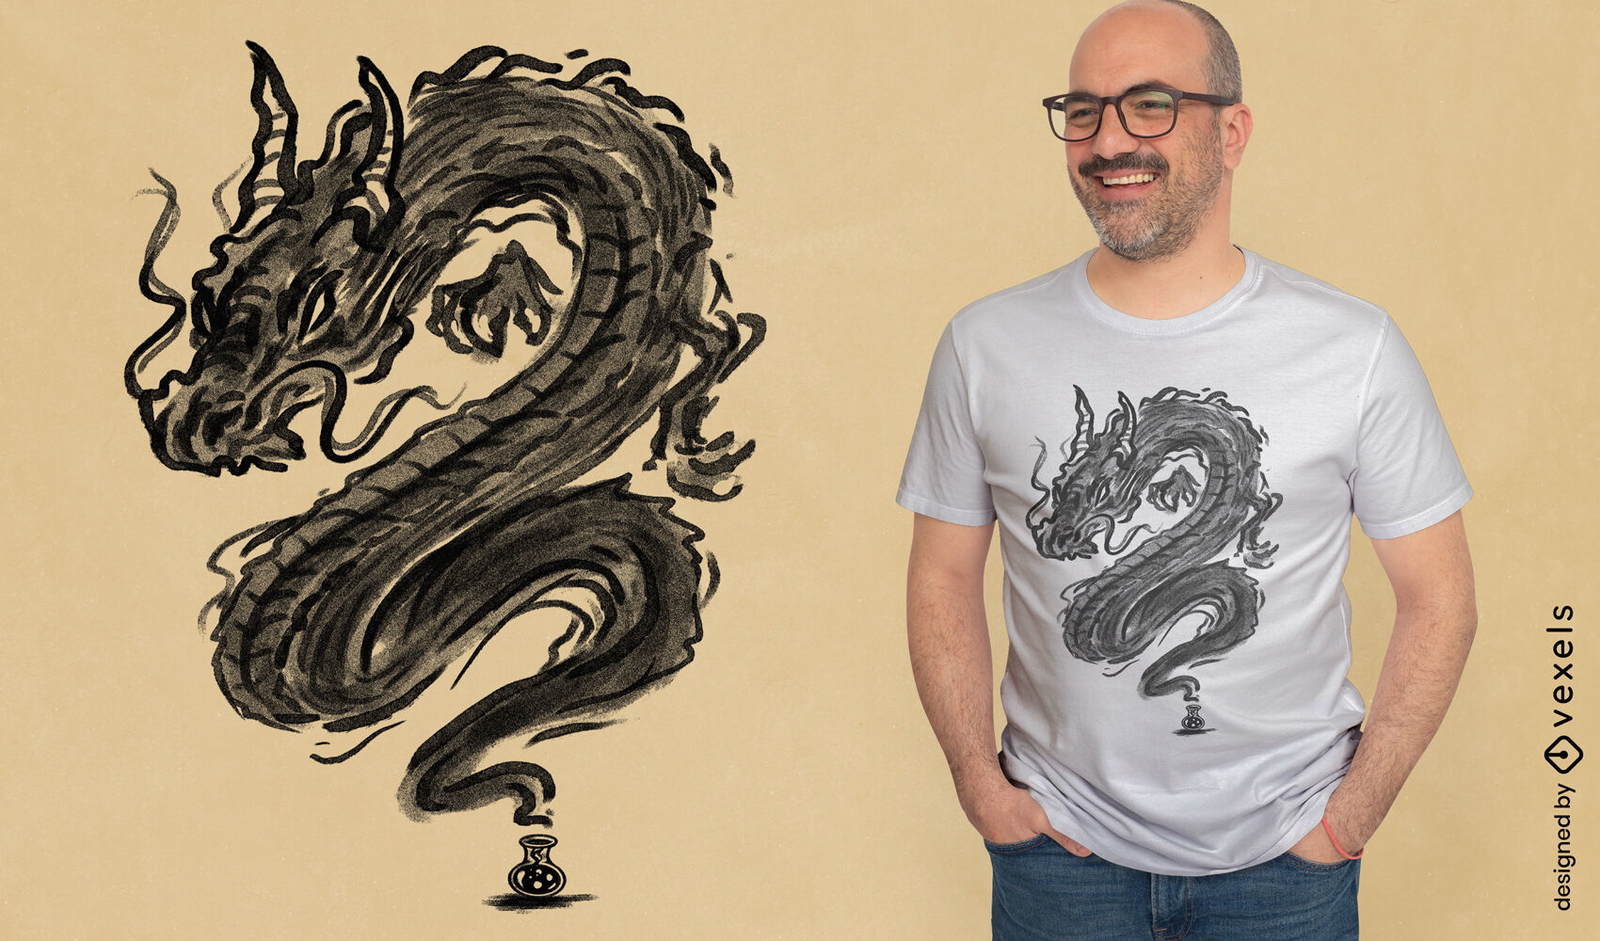
Design de camiseta de dragão de tinta de tatuagem
Escolha uma pasta
Todos os favoritos
Criar novo
Salvar
Design de camiseta de dragão de tinta de tatuagem
Pronto para imprimir
para Merch
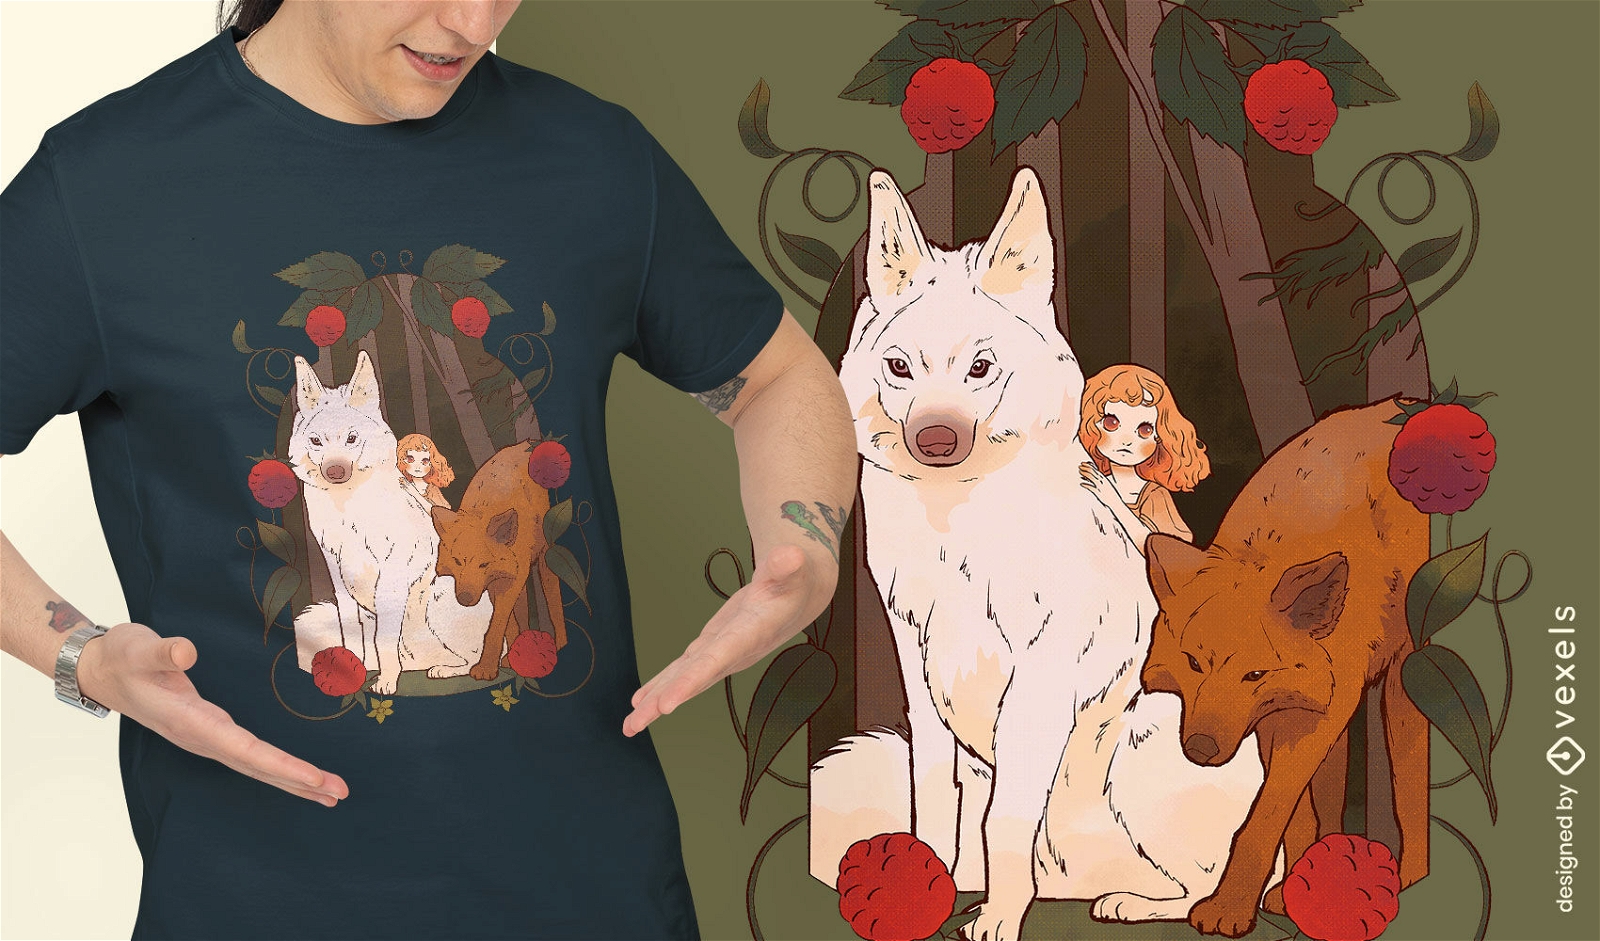
Design de t-shirt de conto de fadas de menina lobos
Escolha uma pasta
Todos os favoritos
Criar novo
Salvar
Design de t-shirt de conto de fadas de menina lobos
Pronto para imprimir
para Merch
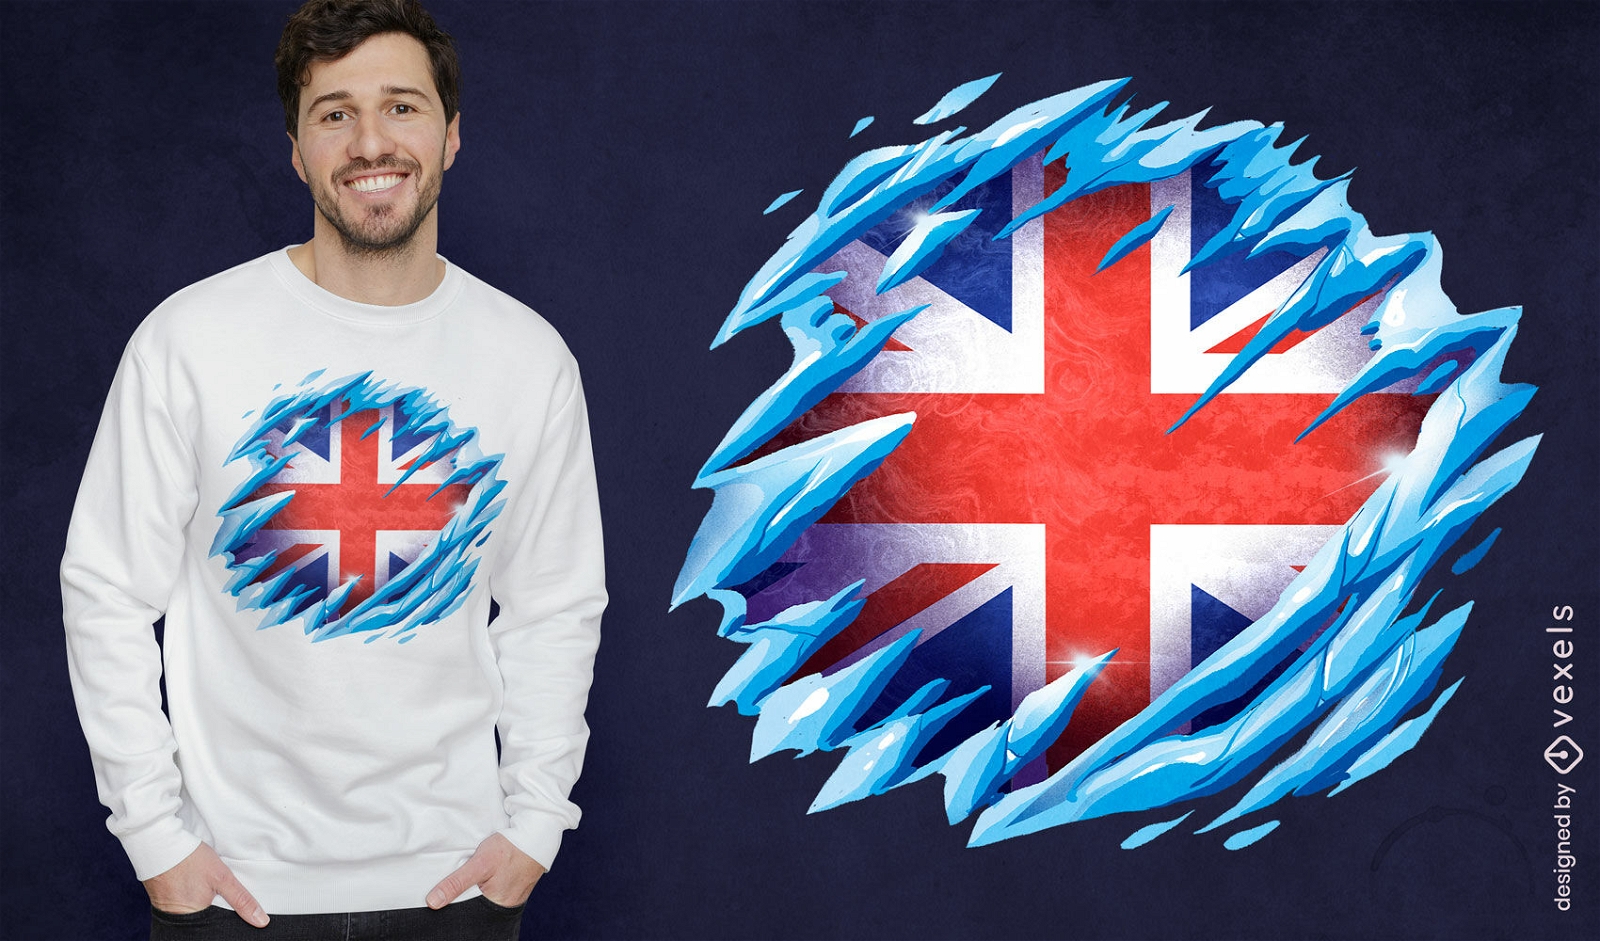
Design de t-shirt da bandeira Frozen Union Jack
Escolha uma pasta
Todos os favoritos
Criar novo
Salvar
Design de t-shirt da bandeira Frozen Union Jack
Pronto para imprimir
para Merch
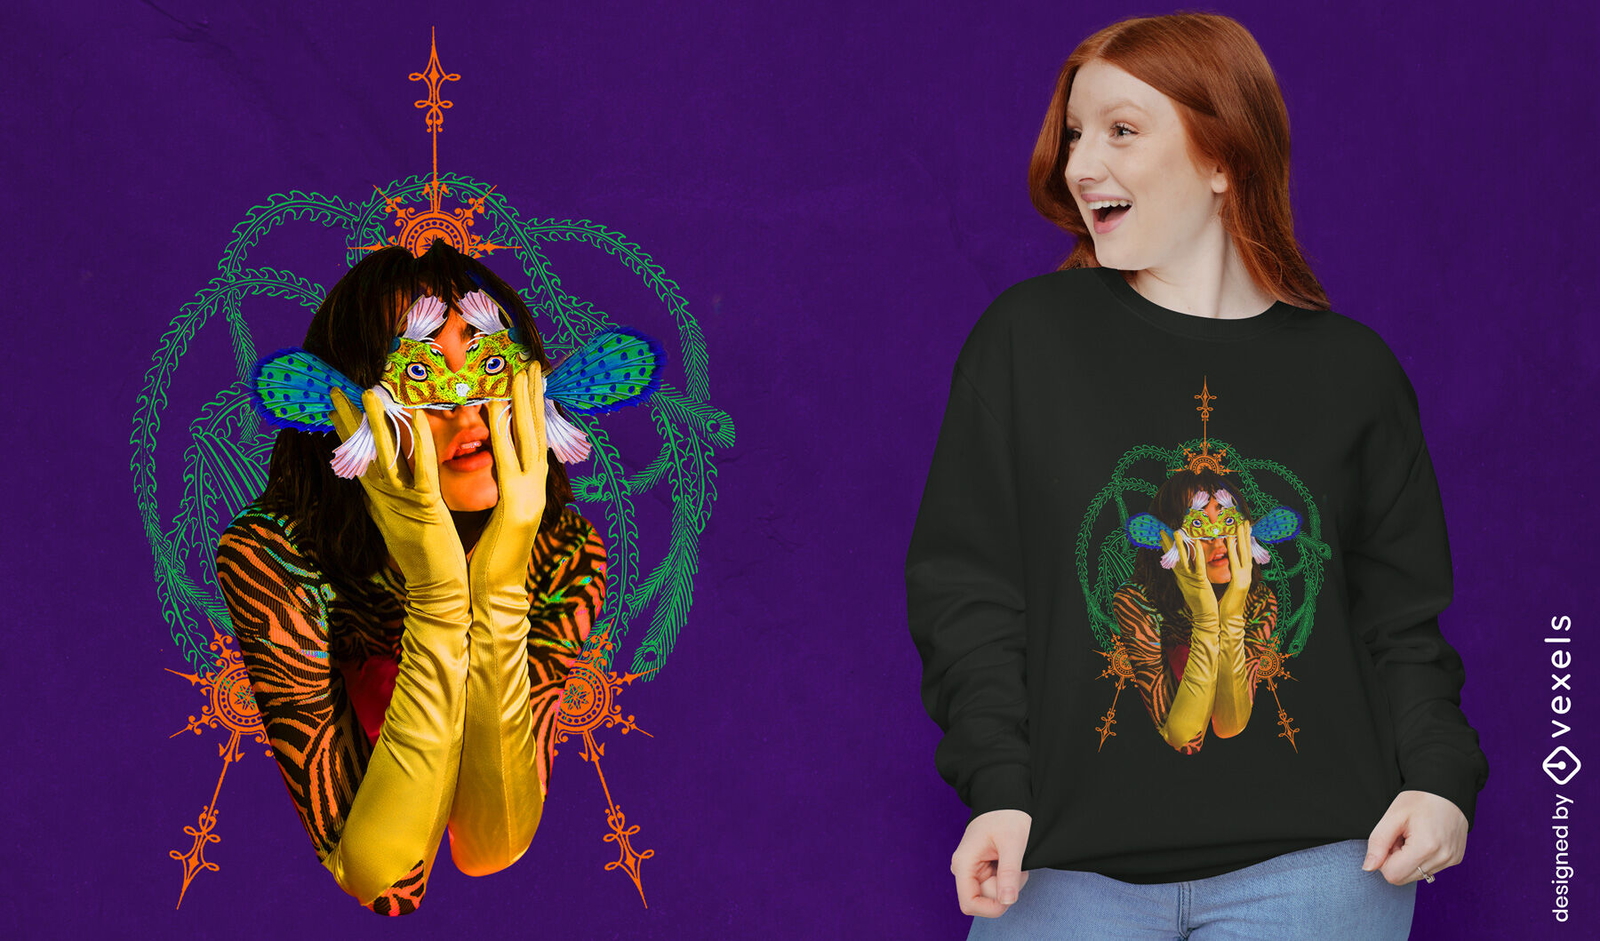
Design psd de camiseta de menina animal psicodélico
Escolha uma pasta
Todos os favoritos
Criar novo
Salvar
Design psd de camiseta de menina animal psicodélico
Pronto para imprimir
para Merch
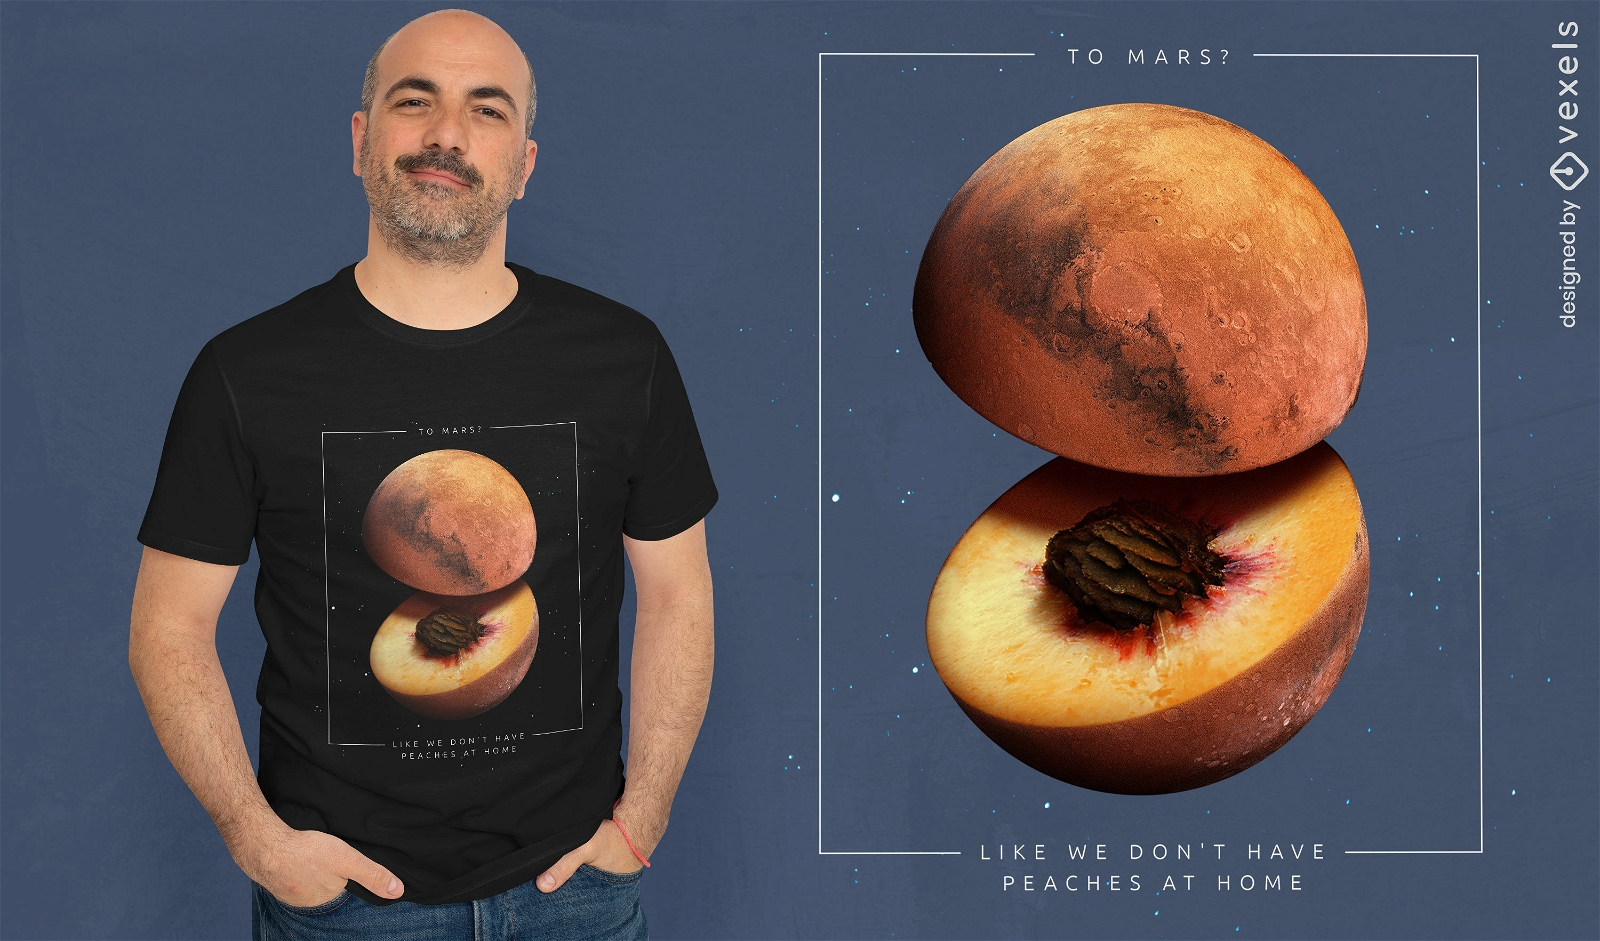
Design de camiseta Peach Mars psd
Escolha uma pasta
Todos os favoritos
Criar novo
Salvar
Design de camiseta Peach Mars psd
Pronto para imprimir
para Merch
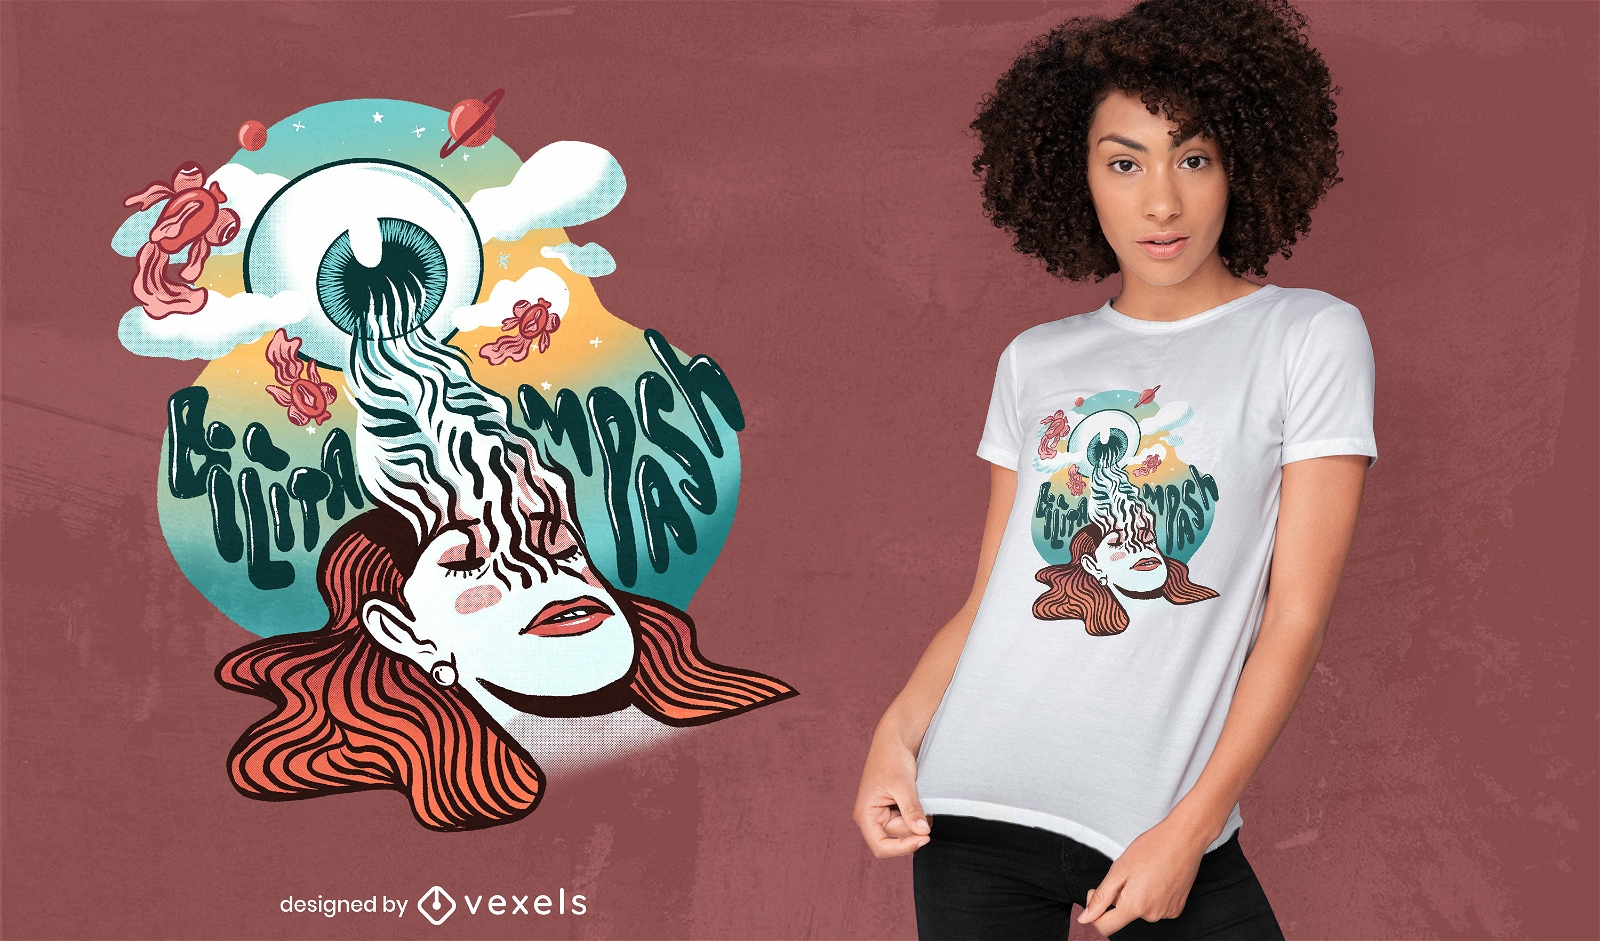
T-shirt Mulher sonhando fantasia psd
Escolha uma pasta
Todos os favoritos
Criar novo
Salvar
T-shirt Mulher sonhando fantasia psd
texto editável
Pronto para imprimir
para Merch
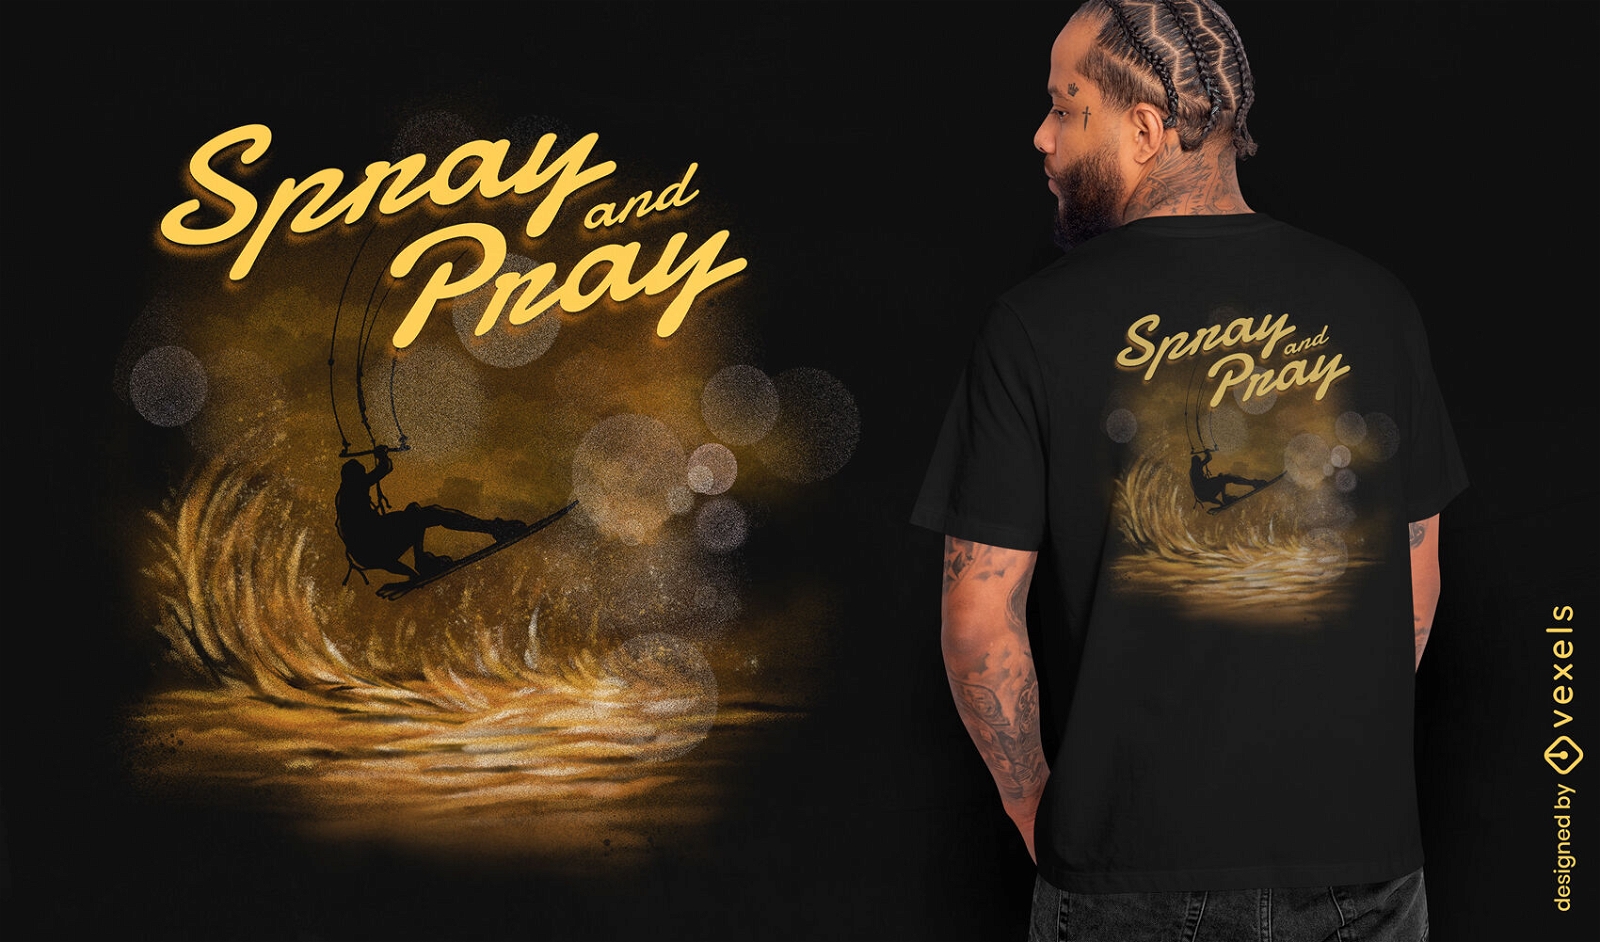
Design de camiseta de kitesurf
Escolha uma pasta
Todos os favoritos
Criar novo
Salvar
Design de camiseta de kitesurf
texto editável
Pronto para imprimir
para Merch
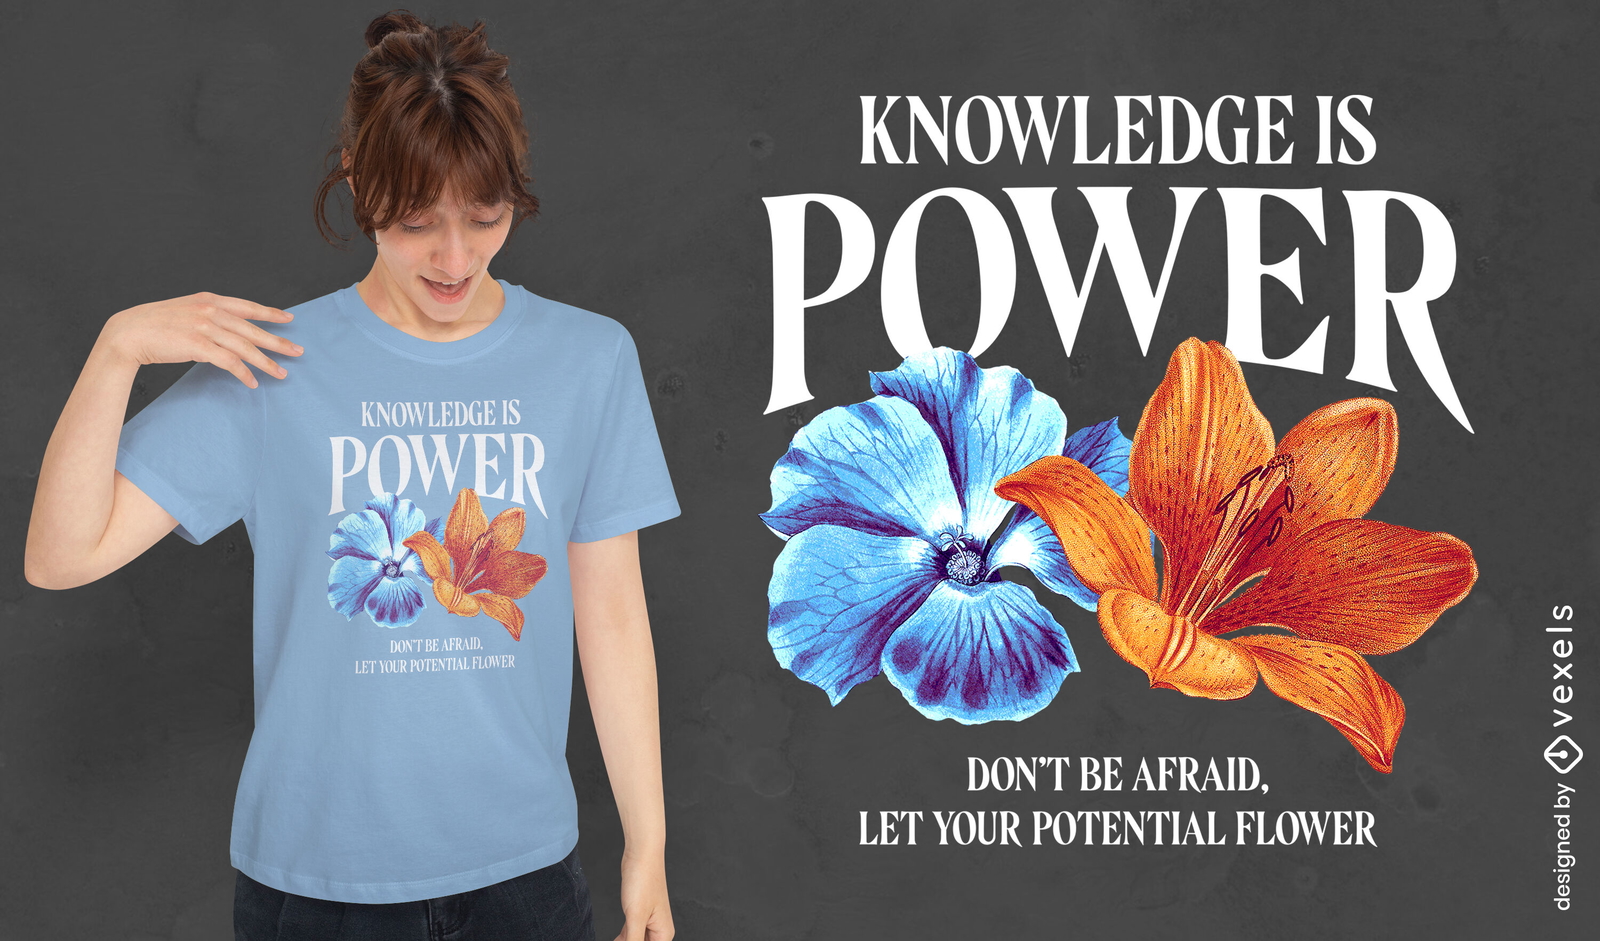
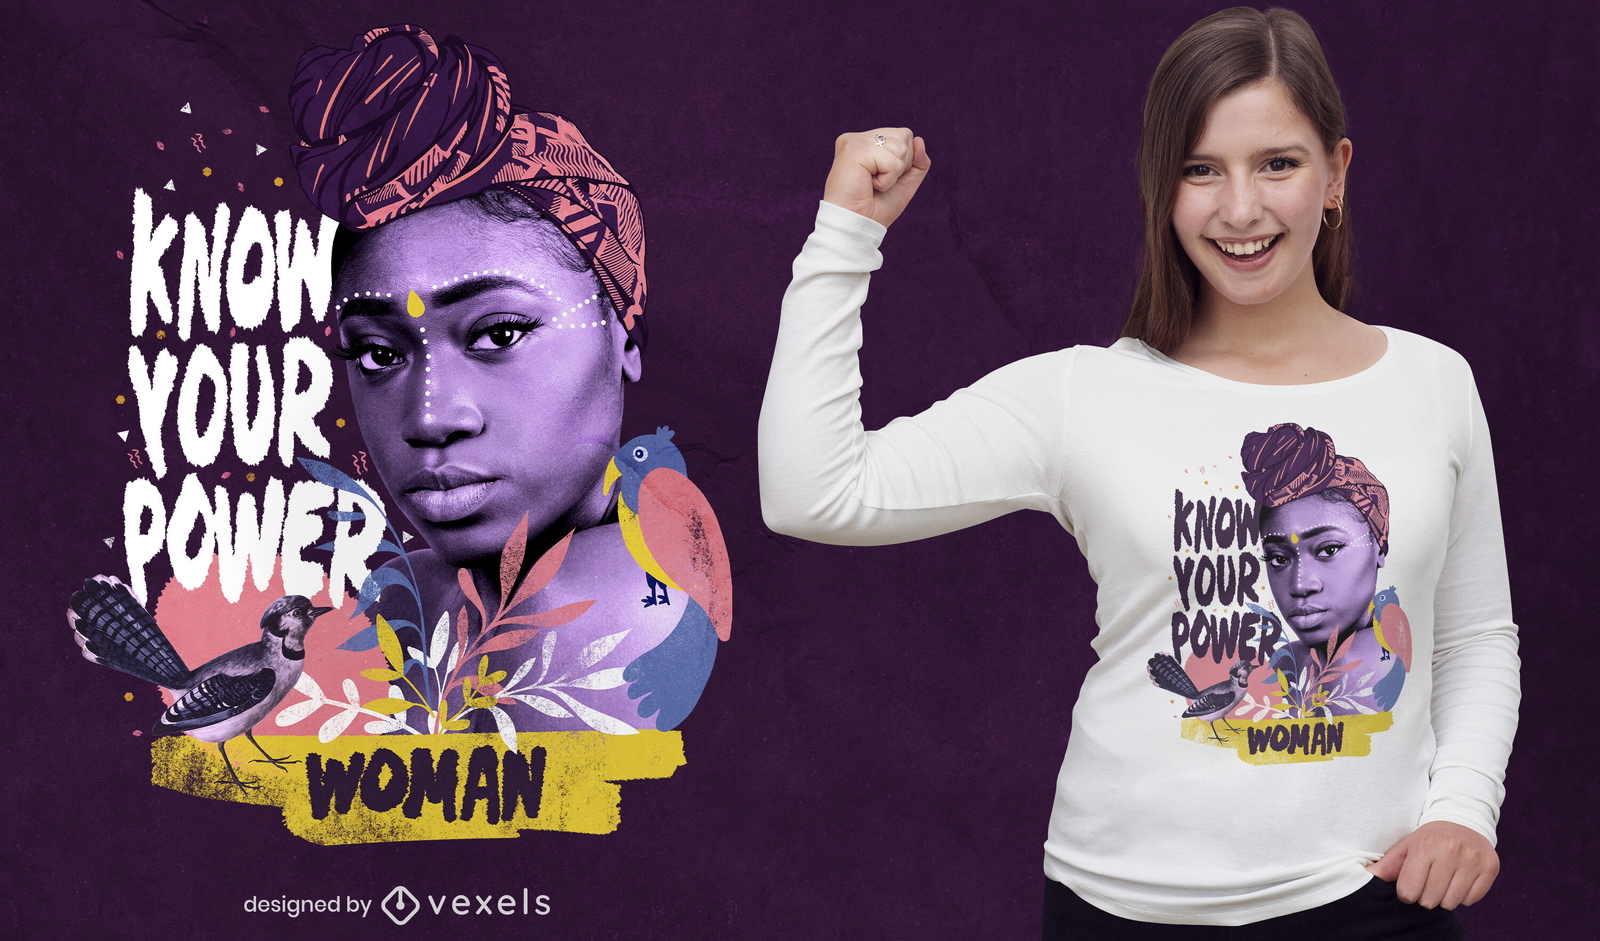
Conhecimento é design de camiseta de flor de poder
Escolha uma pasta
Todos os favoritos
Criar novo
Salvar
Conhecimento é design de camiseta de flor de poder
texto editável
Pronto para imprimir
para Merch
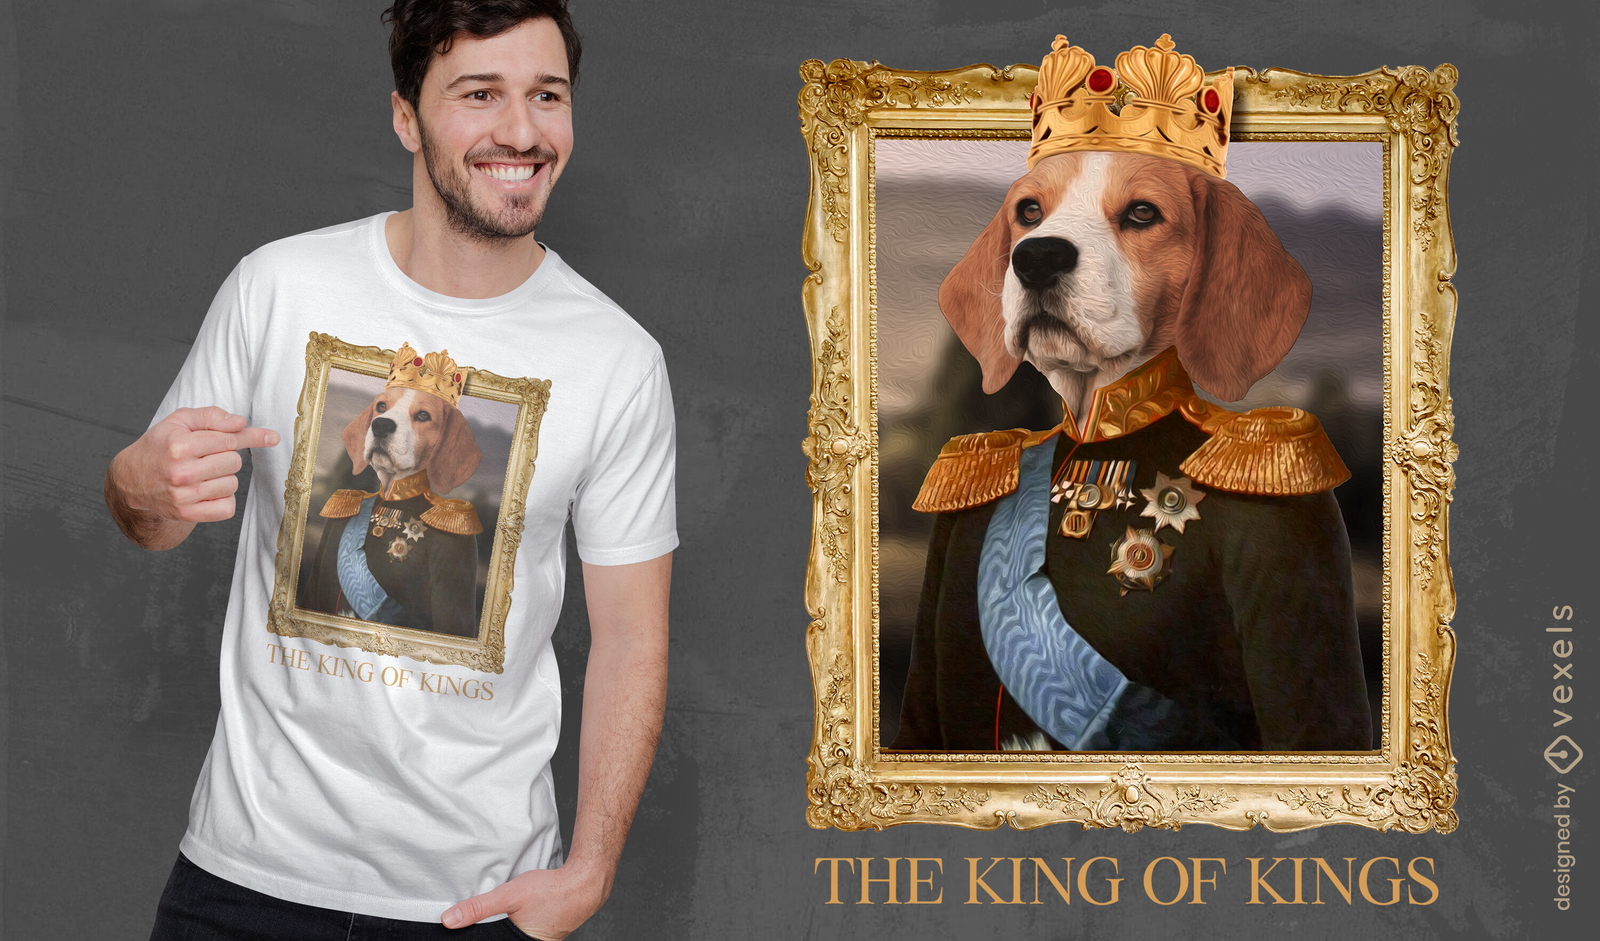
Design de camiseta psd do rei cão Beagle
Escolha uma pasta
Todos os favoritos
Criar novo
Salvar
Design de camiseta psd do rei cão Beagle
Pronto para imprimir
para Merch
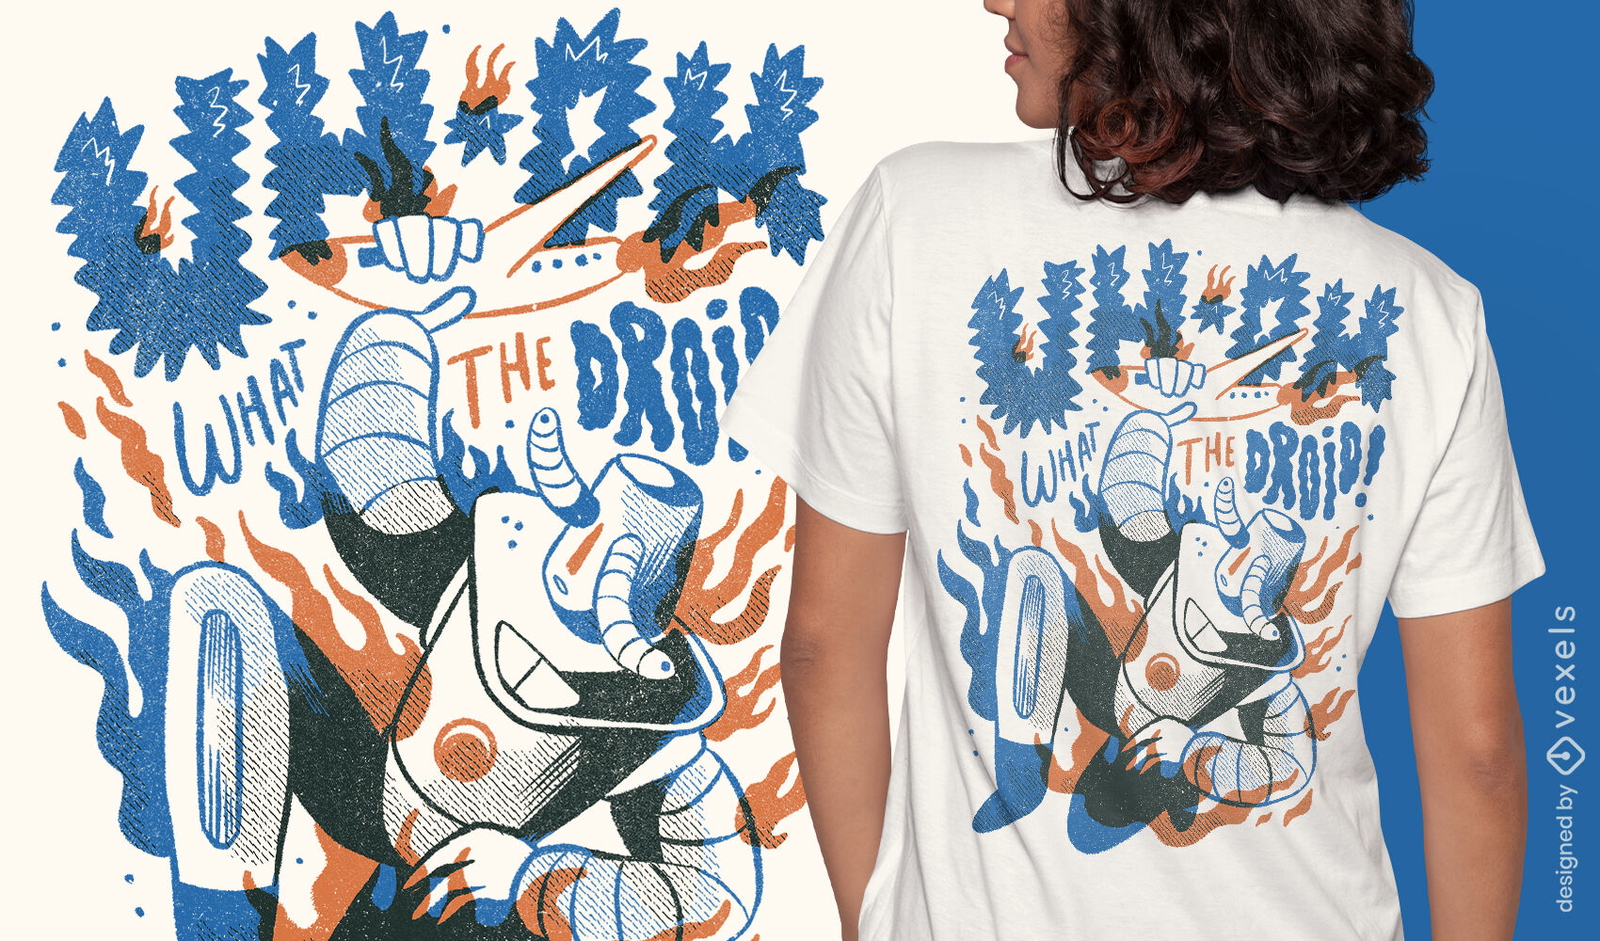
Design de camiseta de avião robô gigante
Escolha uma pasta
Todos os favoritos
Criar novo
Salvar
Design de camiseta de avião robô gigante
Pronto para imprimir
para Merch
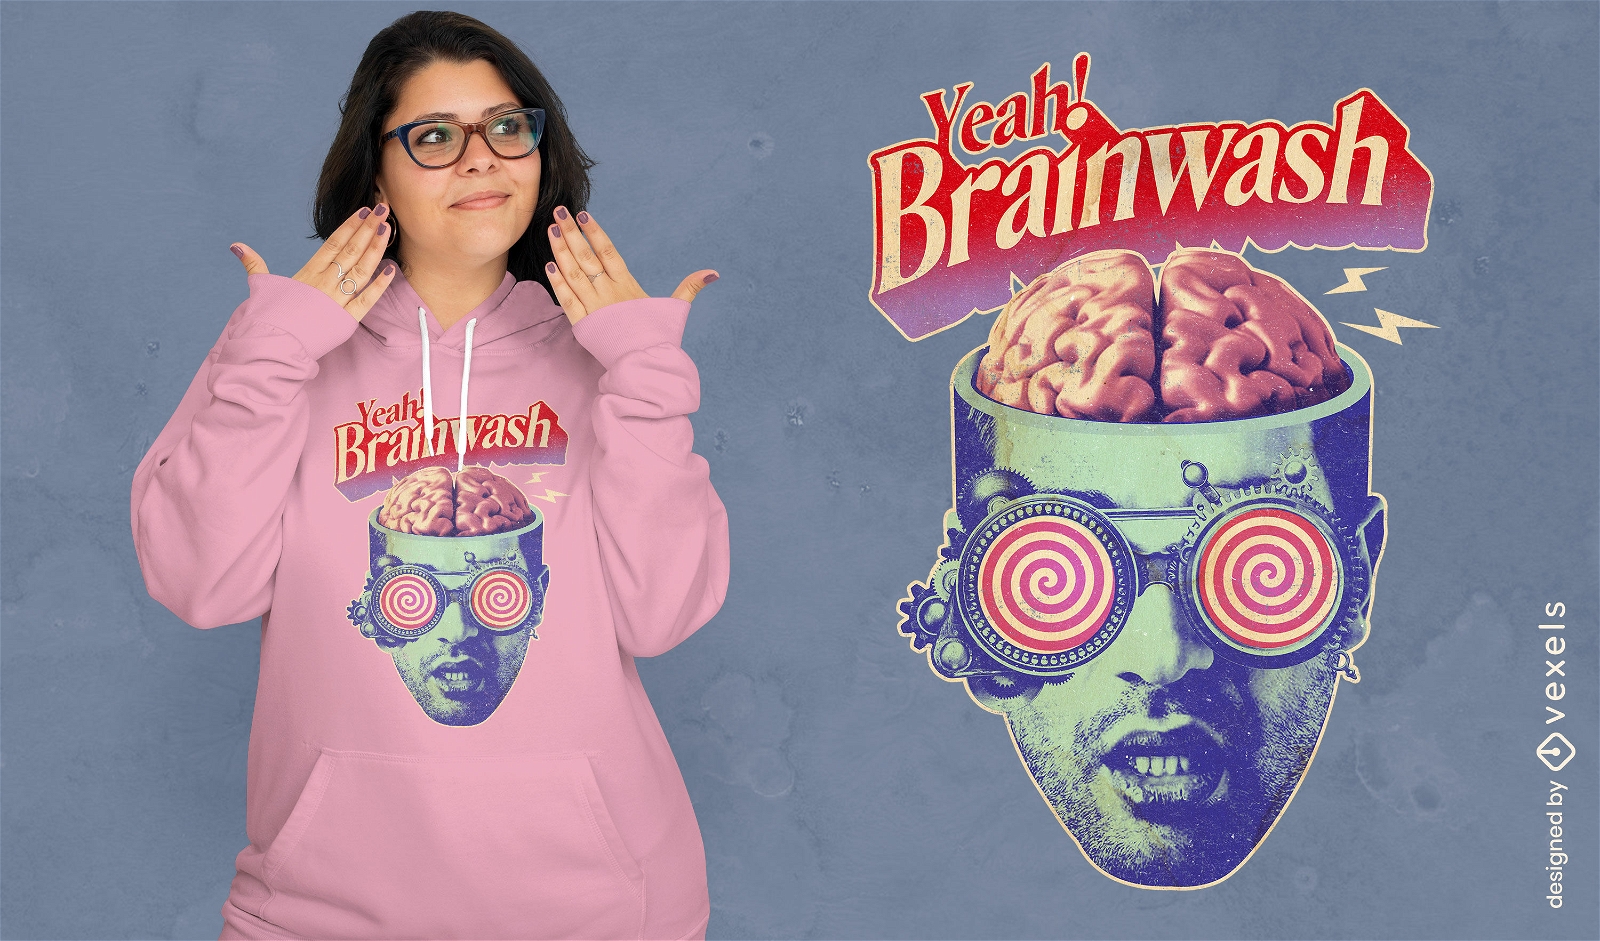
Design de camiseta psd de lavagem cerebral vintage
Escolha uma pasta
Todos os favoritos
Criar novo
Salvar
Design de camiseta psd de lavagem cerebral vintage
Pronto para imprimir
para Merch
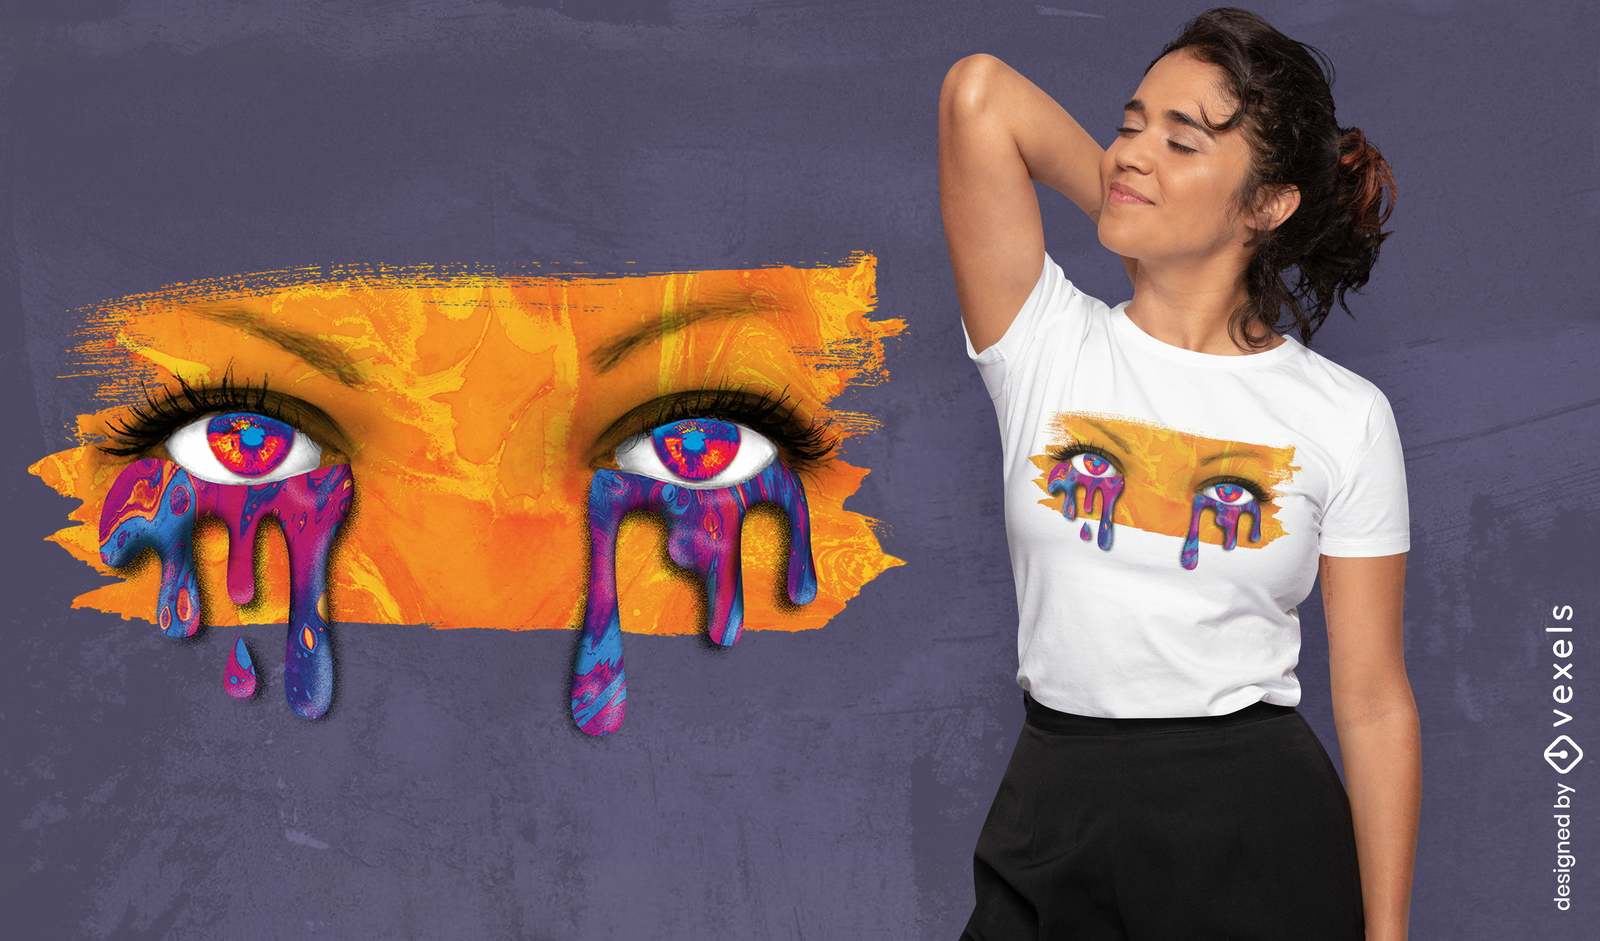
Olhos chorando pintura psd design de camiseta
Escolha uma pasta
Todos os favoritos
Criar novo
Salvar
Olhos chorando pintura psd design de camiseta
Pronto para imprimir
para Merch
Ignore-me borboletas PSD design de t-shirt
Escolha uma pasta
Todos os favoritos
Criar novo
Salvar
Ignore-me borboletas PSD design de t-shirt
Pronto para imprimir
para Merch
Design de t-shirt psd estátua de arte em vaporwave com colagem
Escolha uma pasta
Todos os favoritos
Criar novo
Salvar
Design de t-shirt psd estátua de arte em vaporwave com colagem
Pronto para imprimir
para Merch
Garota surrealista colagem vintage psd t-shirt design
Escolha uma pasta
Todos os favoritos
Criar novo
Salvar
Garota surrealista colagem vintage psd t-shirt design
Pronto para imprimir
para Merch
Design de t-shirt Dino dance PSD
Escolha uma pasta
Todos os favoritos
Criar novo
Salvar
Design de t-shirt Dino dance PSD
Camiseta PSD escalável
para Merch
t-shirt escalável de formas 3d psd
Escolha uma pasta
Todos os favoritos
Criar novo
Salvar
t-shirt escalável de formas 3d psd
Camiseta PSD escalável
para Merch
T-shirt escalável de cores alternativas psd
Escolha uma pasta
Todos os favoritos
Criar novo
Salvar
T-shirt escalável de cores alternativas psd
Pronto para imprimir
para Merch
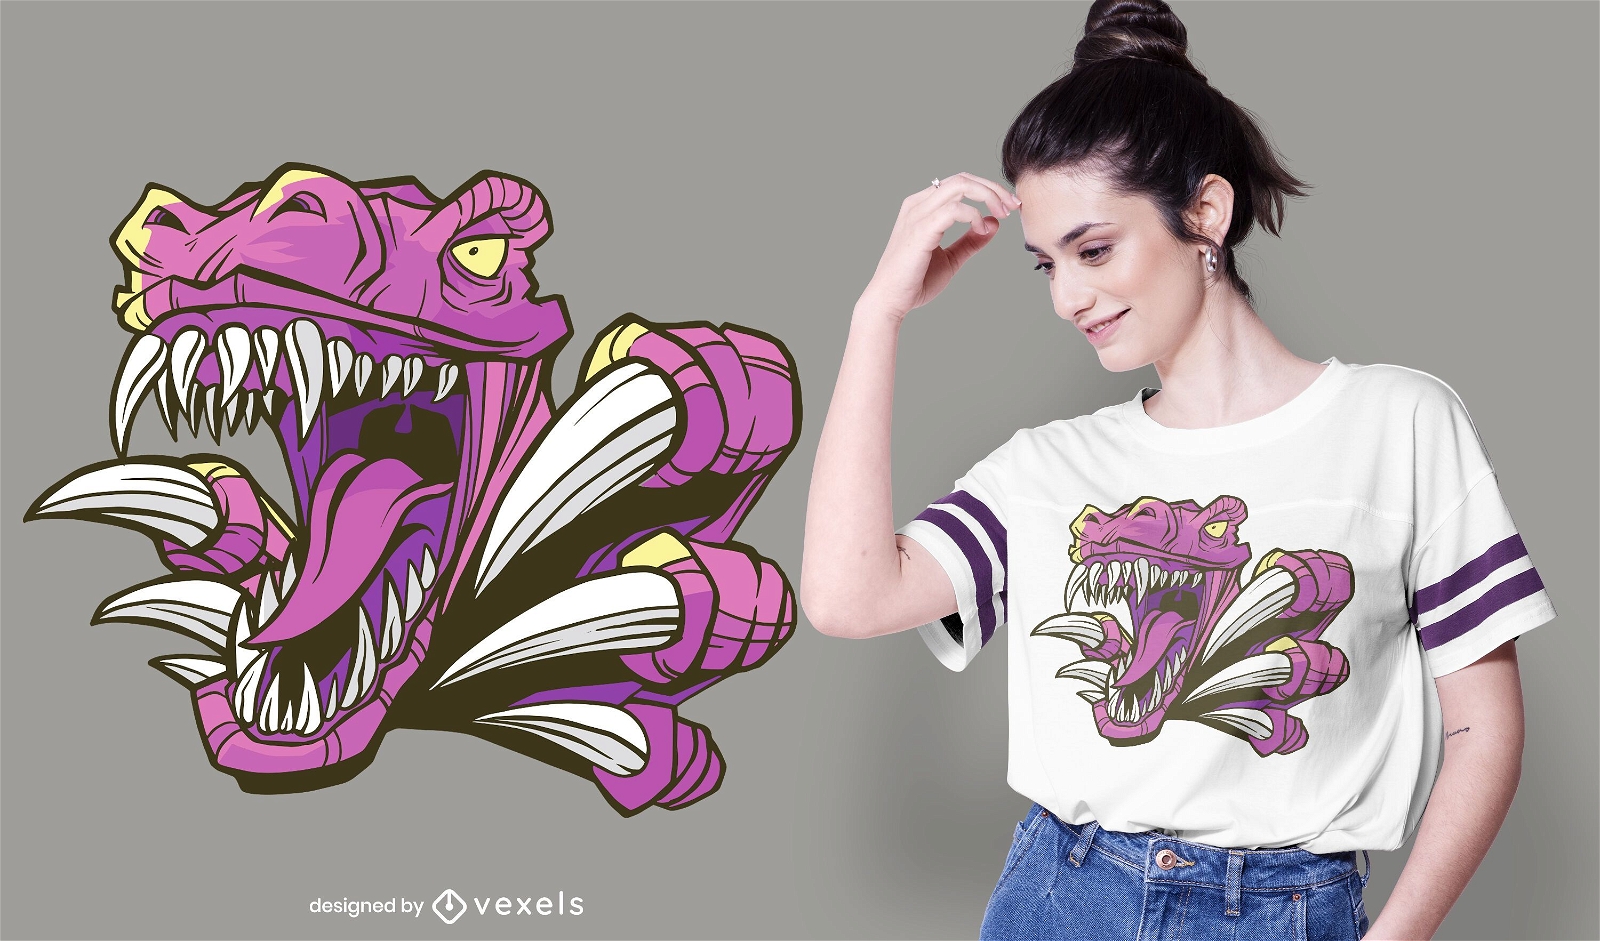
Design de camiseta rosa Raptor
Escolha uma pasta
Todos os favoritos
Criar novo
Salvar
Design de camiseta rosa Raptor
Camiseta PSD escalável
para Merch
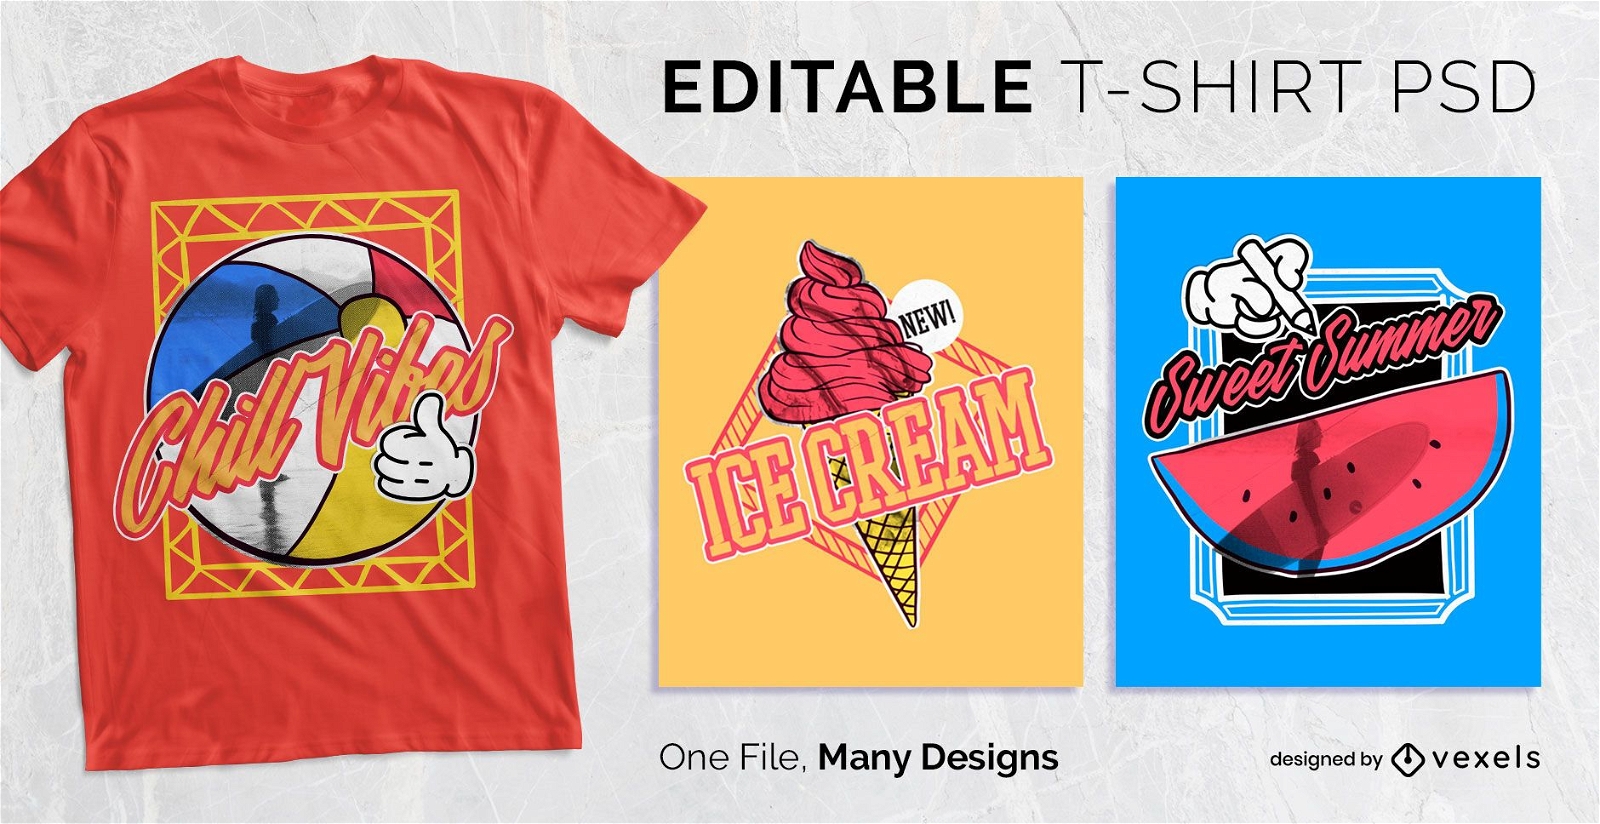
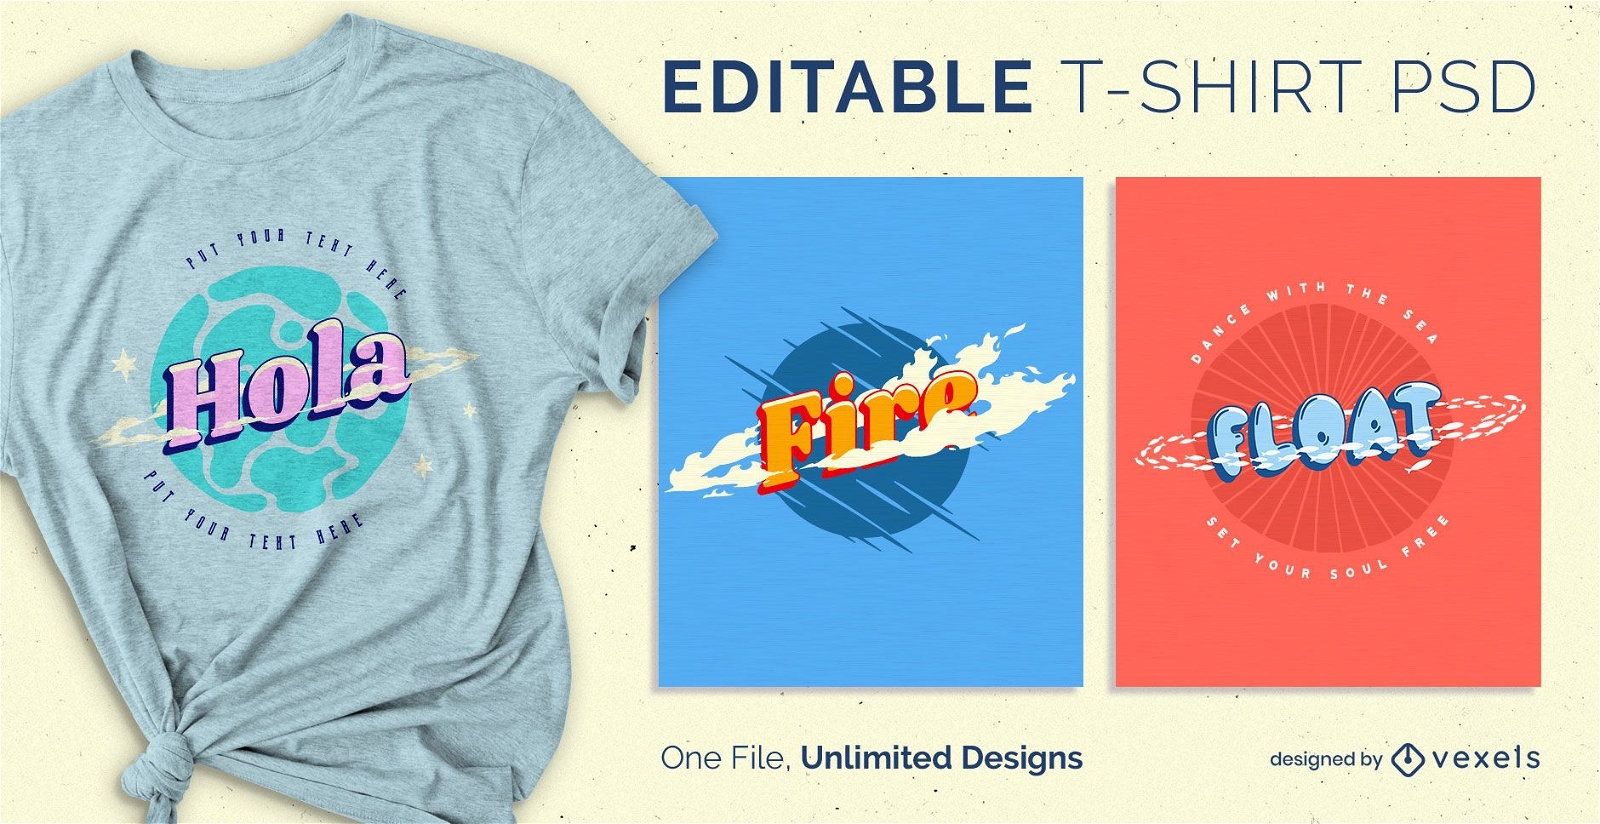
Molduras coloridas e letras com design PSD
Escolha uma pasta
Todos os favoritos
Criar novo
Salvar
Molduras coloridas e letras com design PSD
Pronto para imprimir
para Merch
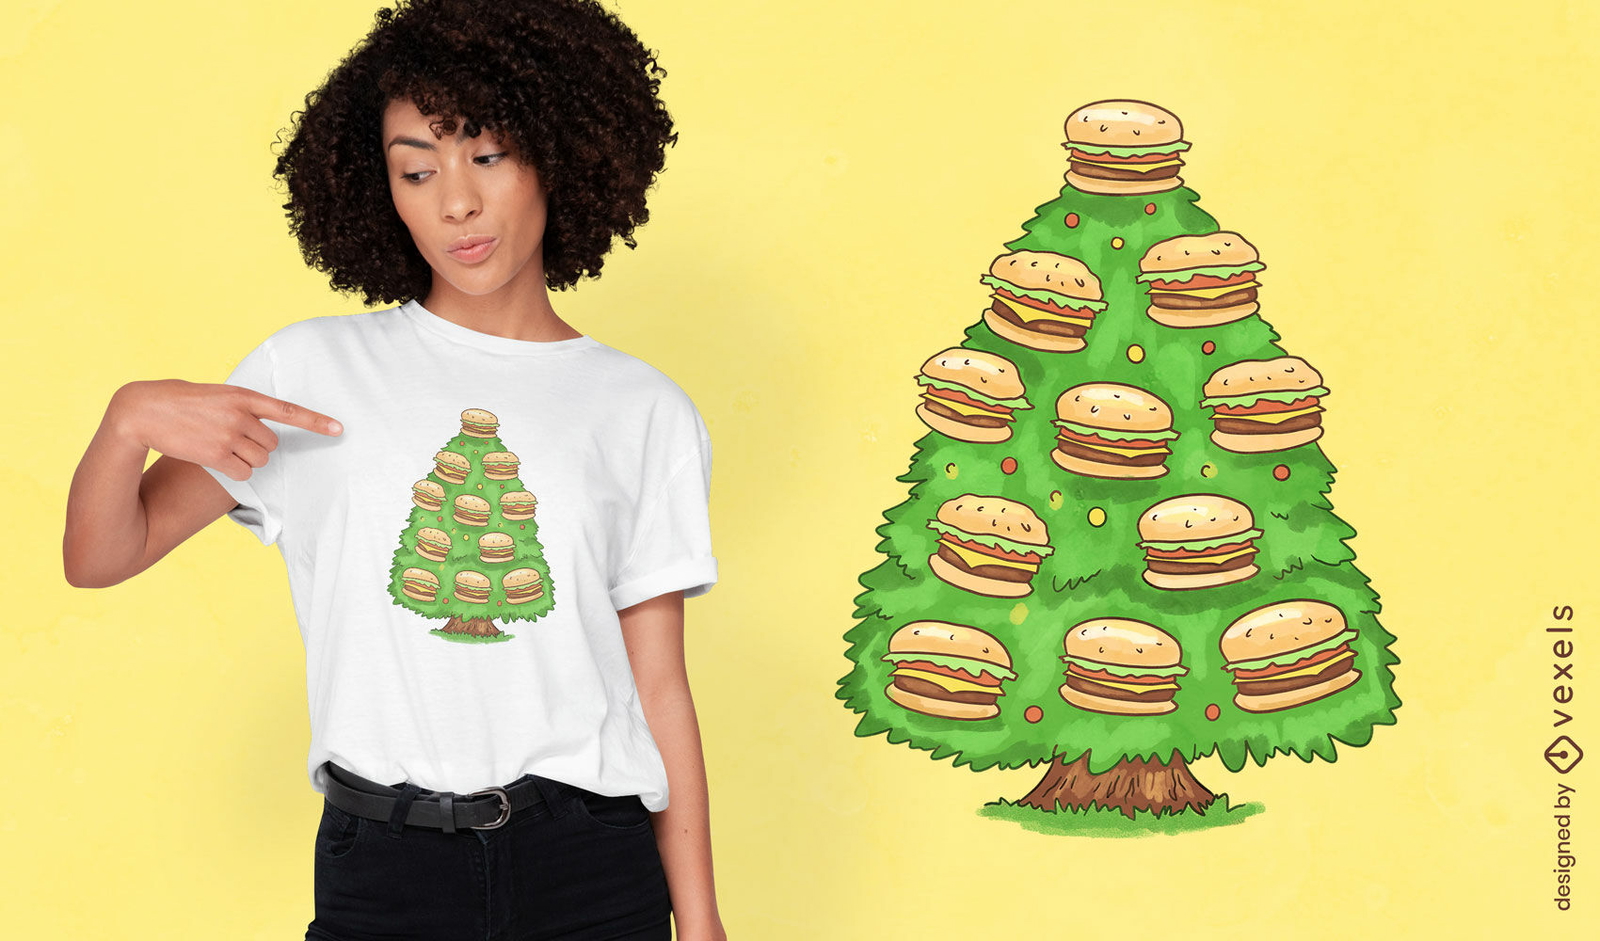
Design de camiseta com ?rvore de natal de hamb?rguer
Escolha uma pasta
Todos os favoritos
Criar novo
Salvar
Design de camiseta com ?rvore de natal de hamb?rguer
Pronto para imprimir
para Merch
Design de camisetas com caveiras e correntes
Escolha uma pasta
Todos os favoritos
Criar novo
Salvar
Design de camisetas com caveiras e correntes
Pronto para imprimir
para Merch
Design de camiseta com escudo de soldado romano
Escolha uma pasta
Todos os favoritos
Criar novo
Salvar
Design de camiseta com escudo de soldado romano
Pronto para imprimir
para Merch
Design de camiseta com donut para ?rvore de Natal
Escolha uma pasta
Todos os favoritos
Criar novo
Salvar
Design de camiseta com donut para ?rvore de Natal
Pronto para imprimir
para Merch
Tigre escondido no design de camiseta de grama
Escolha uma pasta
Todos os favoritos
Criar novo
Salvar
Tigre escondido no design de camiseta de grama
Pronto para imprimir
para Merch
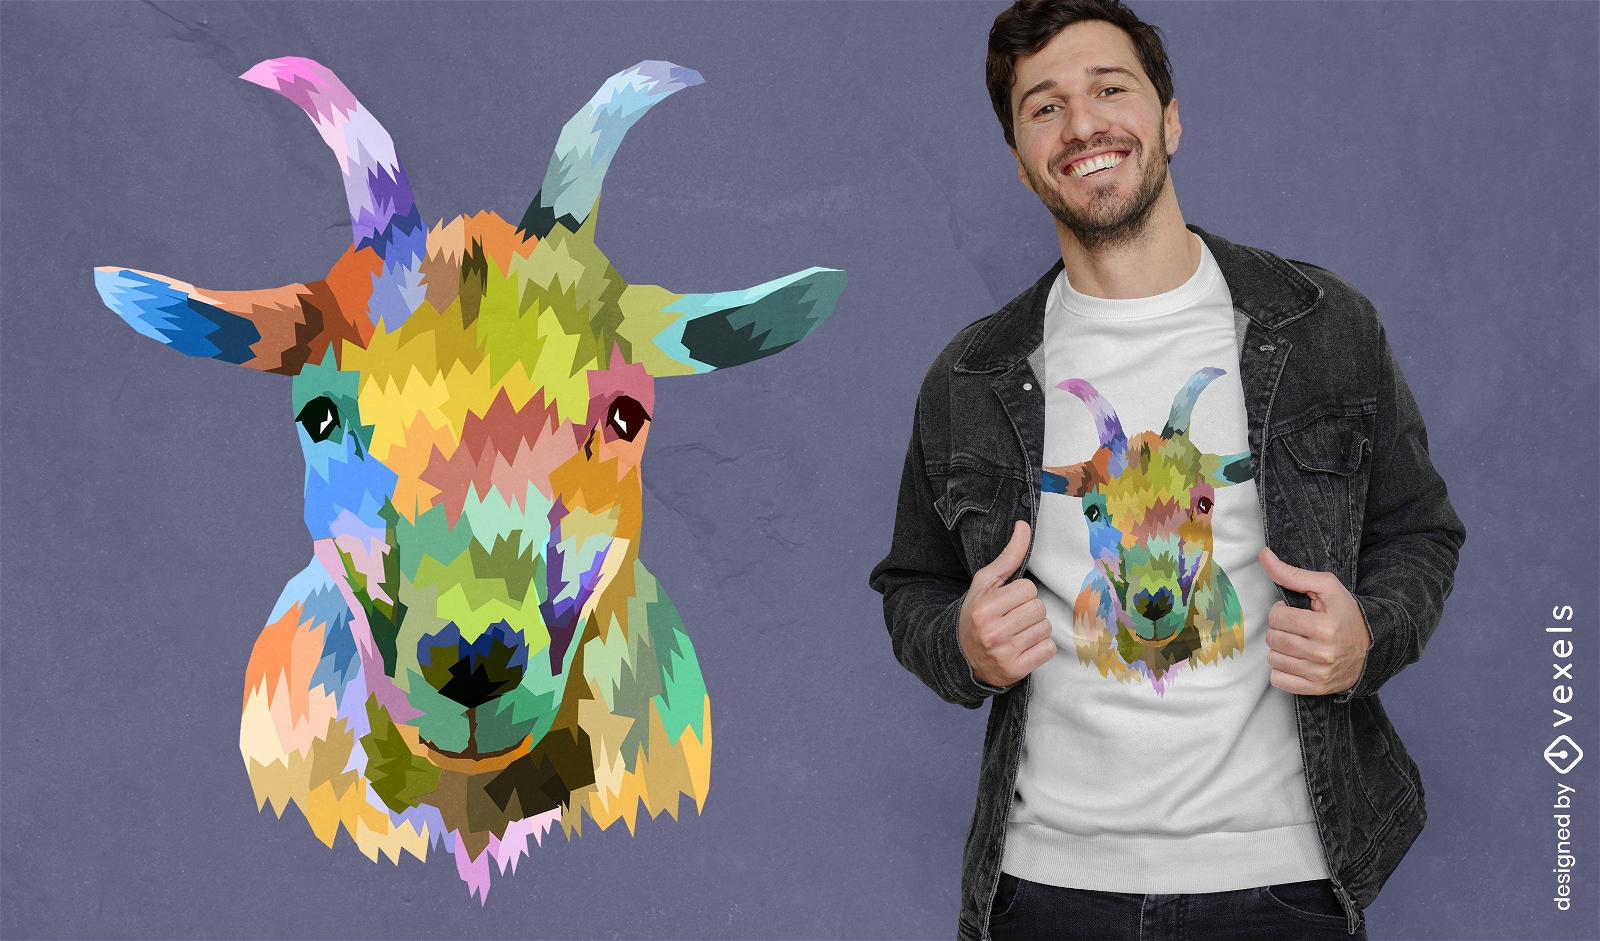
Design de camiseta de retrato de cabra Clorful
Escolha uma pasta
Todos os favoritos
Criar novo
Salvar
Design de camiseta de retrato de cabra Clorful
texto editável
Pronto para imprimir
para Merch
Camiseta com etiqueta vintage de frutas e limões psd
Escolha uma pasta
Todos os favoritos
Criar novo
Salvar
Camiseta com etiqueta vintage de frutas e limões psd
Pronto para imprimir
para Merch
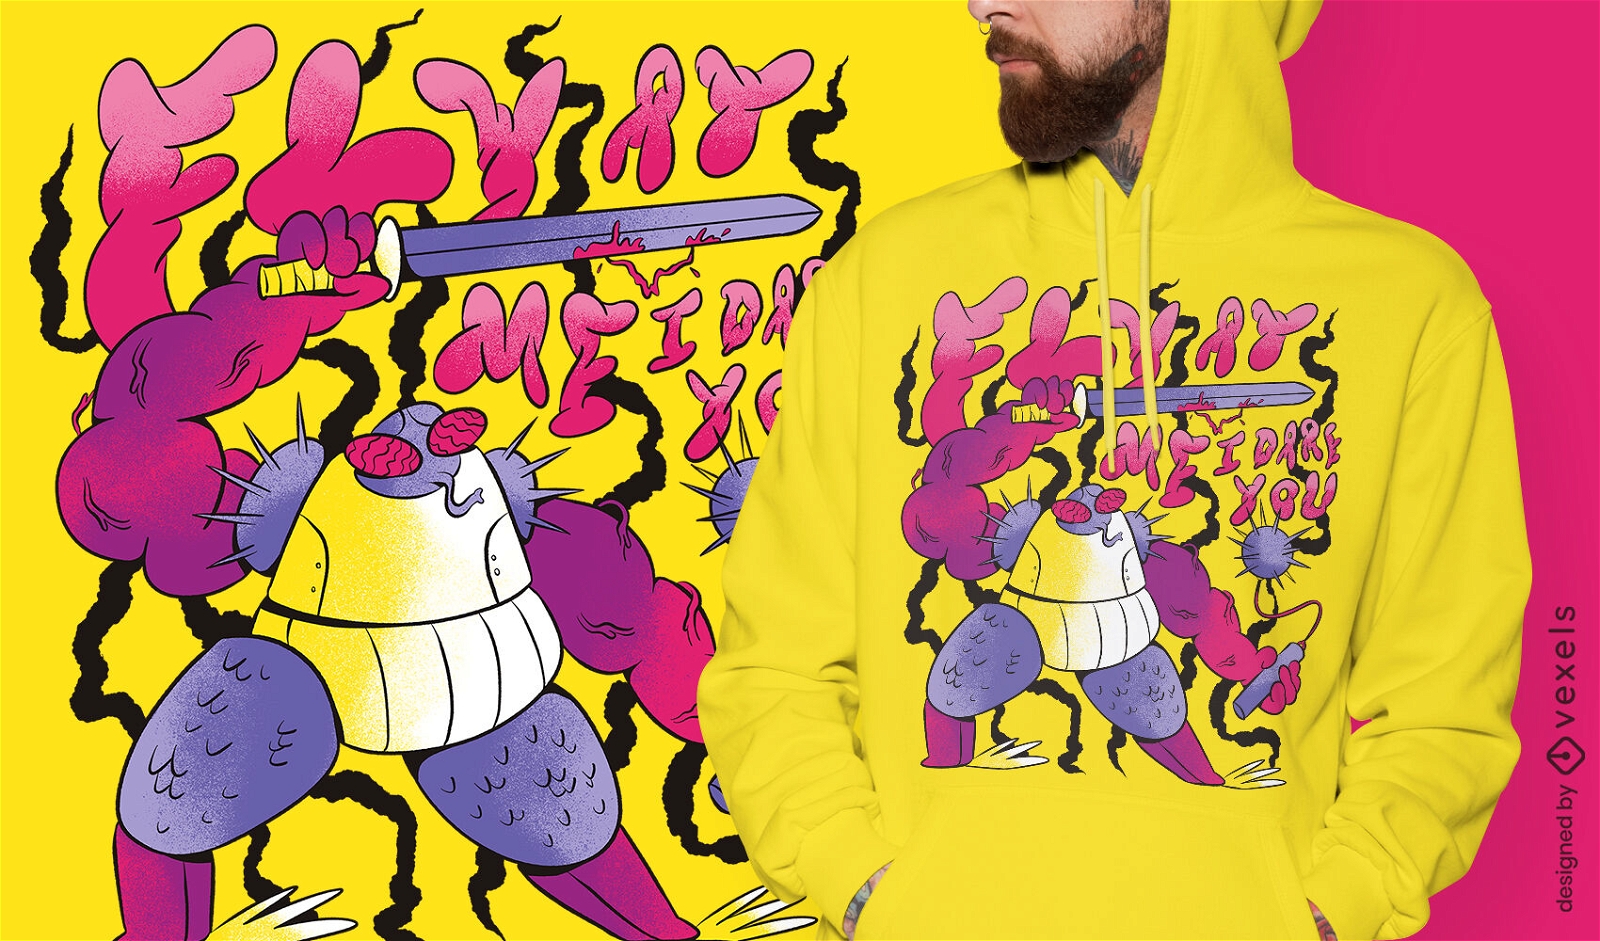
T-shirt gigante do guerreiro inseto mosca psd
Escolha uma pasta
Todos os favoritos
Criar novo
Salvar
T-shirt gigante do guerreiro inseto mosca psd
texto editável
para Merch
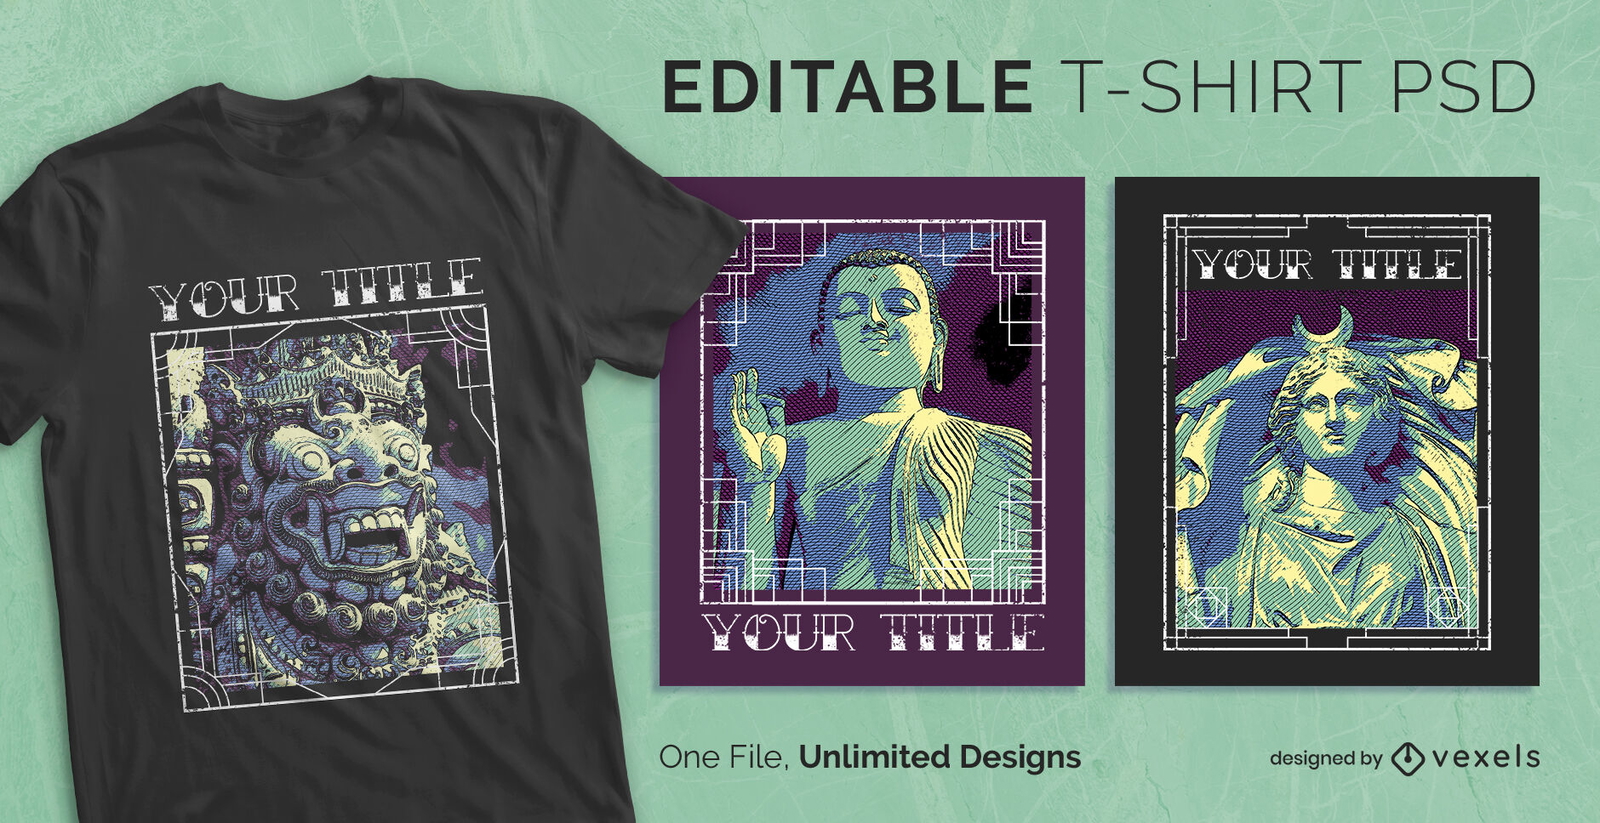
T-shirt escalável de textura de escamas de animais psd
Escolha uma pasta
Todos os favoritos
Criar novo
Salvar
T-shirt escalável de textura de escamas de animais psd
texto editável
para Merch
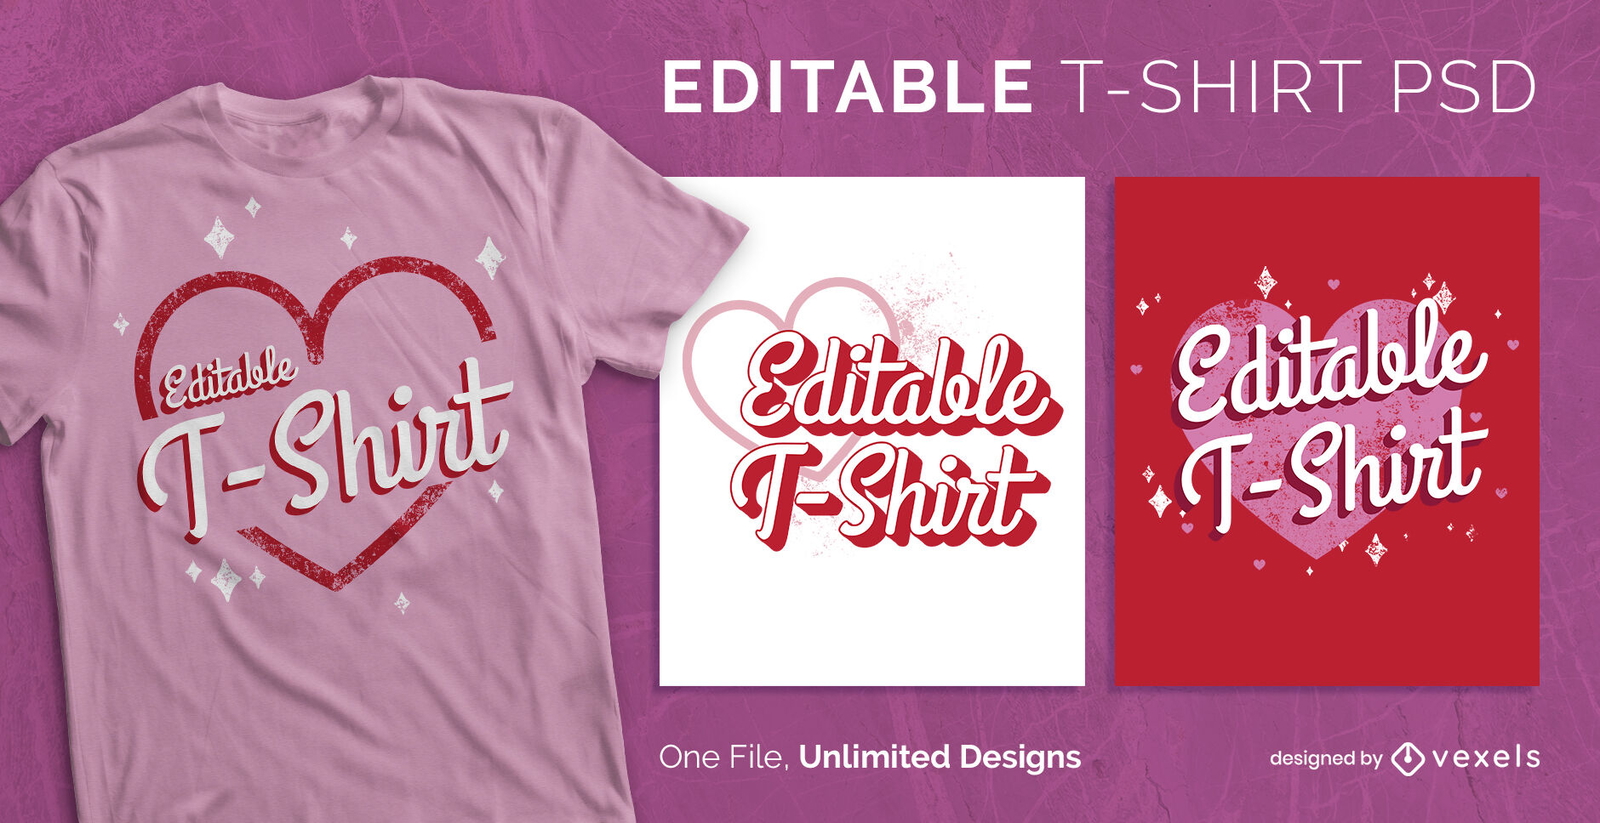
T-shirt escalável de corações e textos doces psd
Escolha uma pasta
Todos os favoritos
Criar novo
Salvar
T-shirt escalável de corações e textos doces psd
Pronto para imprimir
para Merch
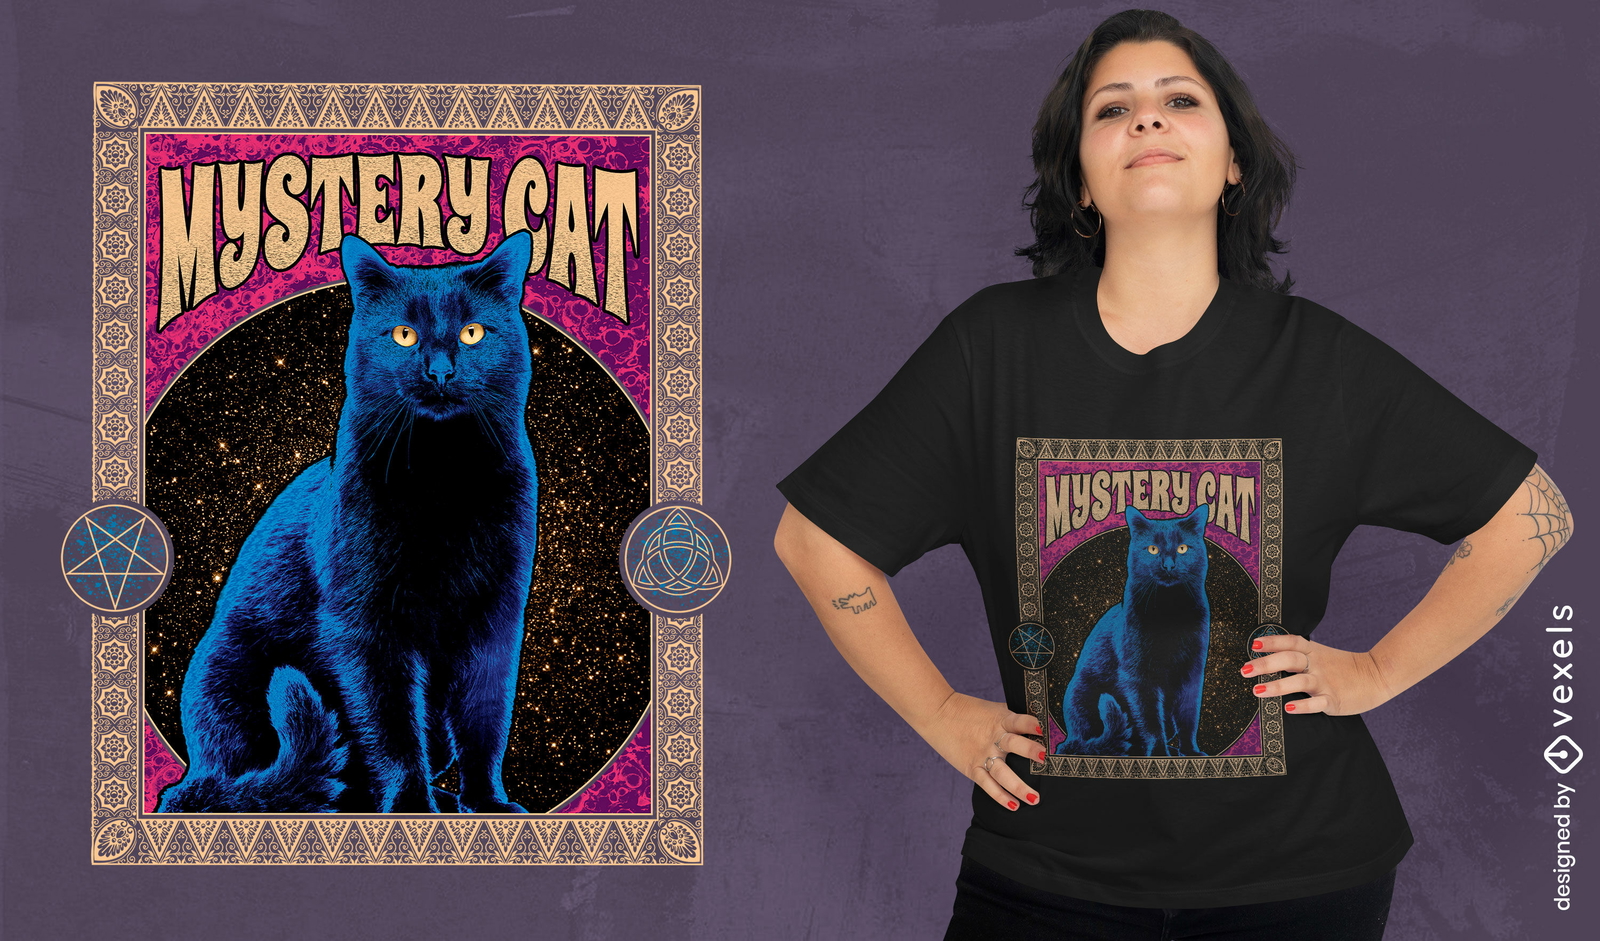
Design de camiseta PSD de mistério de gato preto
Escolha uma pasta
Todos os favoritos
Criar novo
Salvar
Design de camiseta PSD de mistério de gato preto
Pronto para imprimir
para Merch
Camiseta fotográfica feminina de energia psd
Escolha uma pasta
Todos os favoritos
Criar novo
Salvar
Camiseta fotográfica feminina de energia psd
Camiseta PSD escalável
para Merch
T-shirt escalável anel psd
Escolha uma pasta
Todos os favoritos
Criar novo
Salvar
T-shirt escalável anel psd
Pronto para imprimir
para Merch
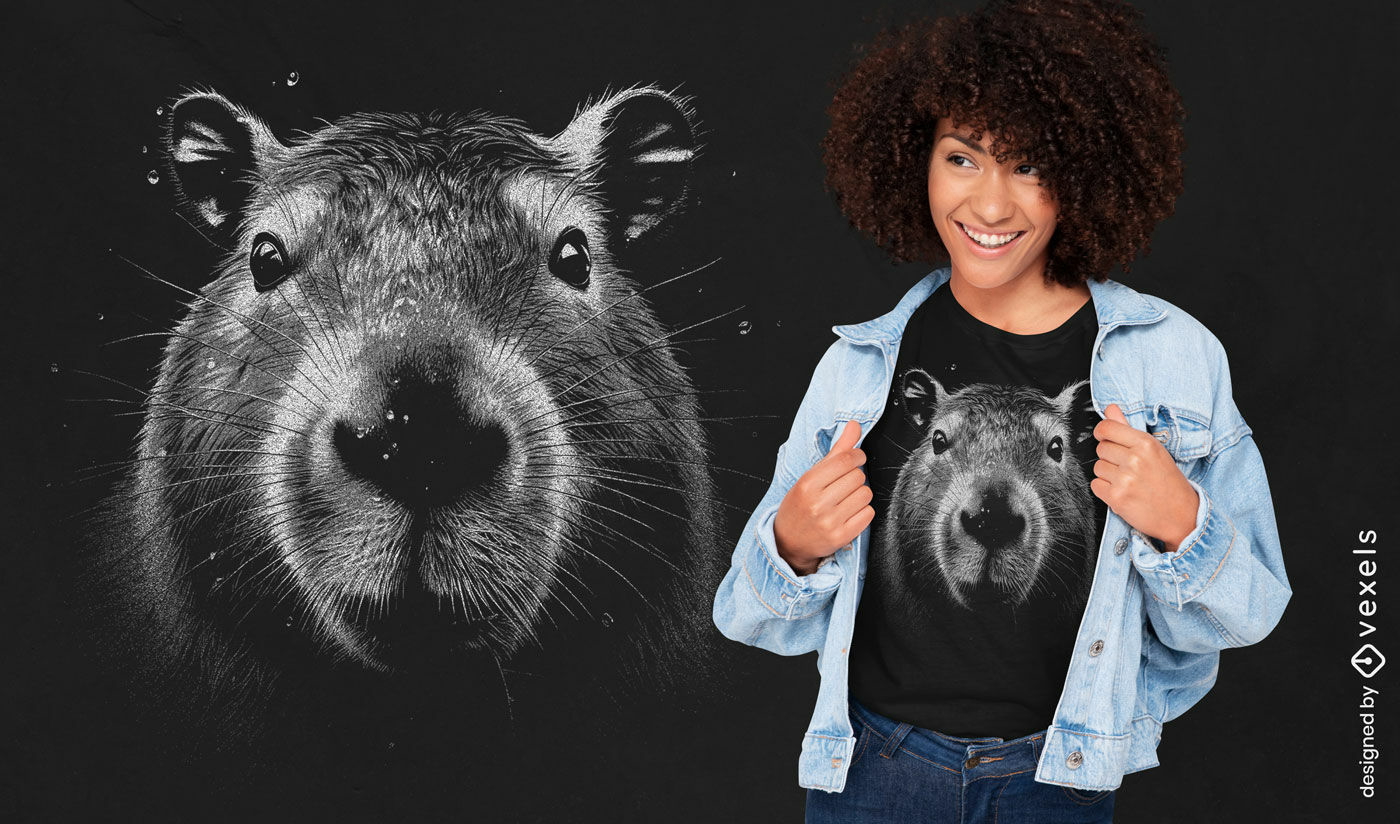
Design realista de camiseta capivara
Escolha uma pasta
Todos os favoritos
Criar novo
Salvar
Design realista de camiseta capivara
Pronto para imprimir
para Merch
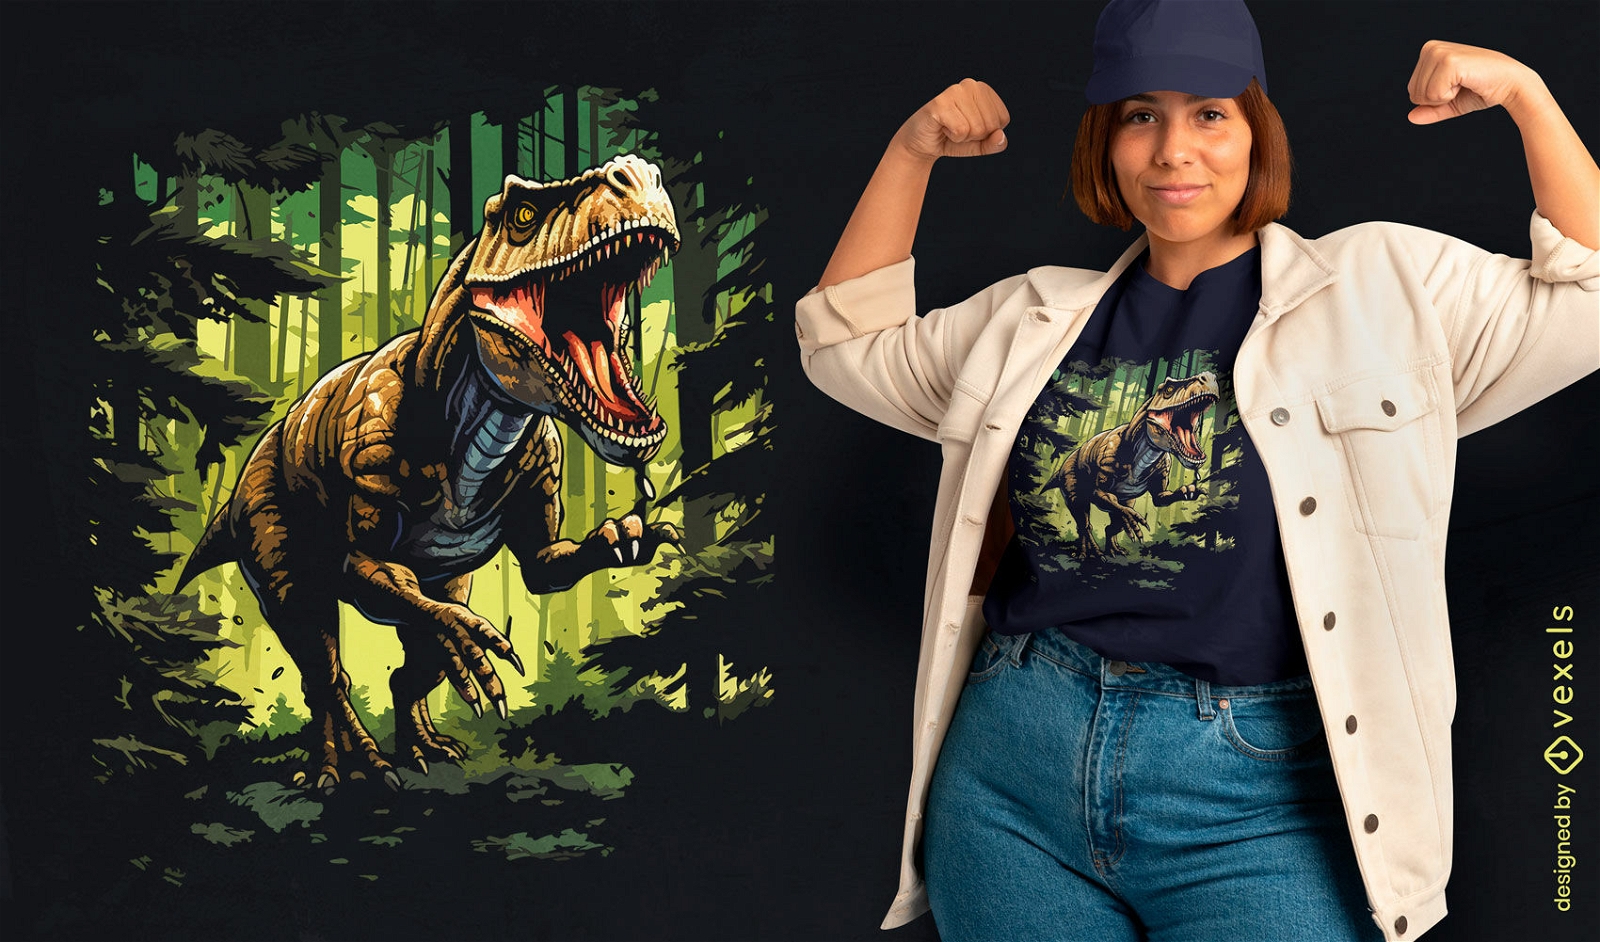
Design de camiseta T-rex correndo na floresta
Escolha uma pasta
Todos os favoritos
Criar novo
Salvar
Design de camiseta T-rex correndo na floresta
texto editável
Pronto para imprimir
para Merch
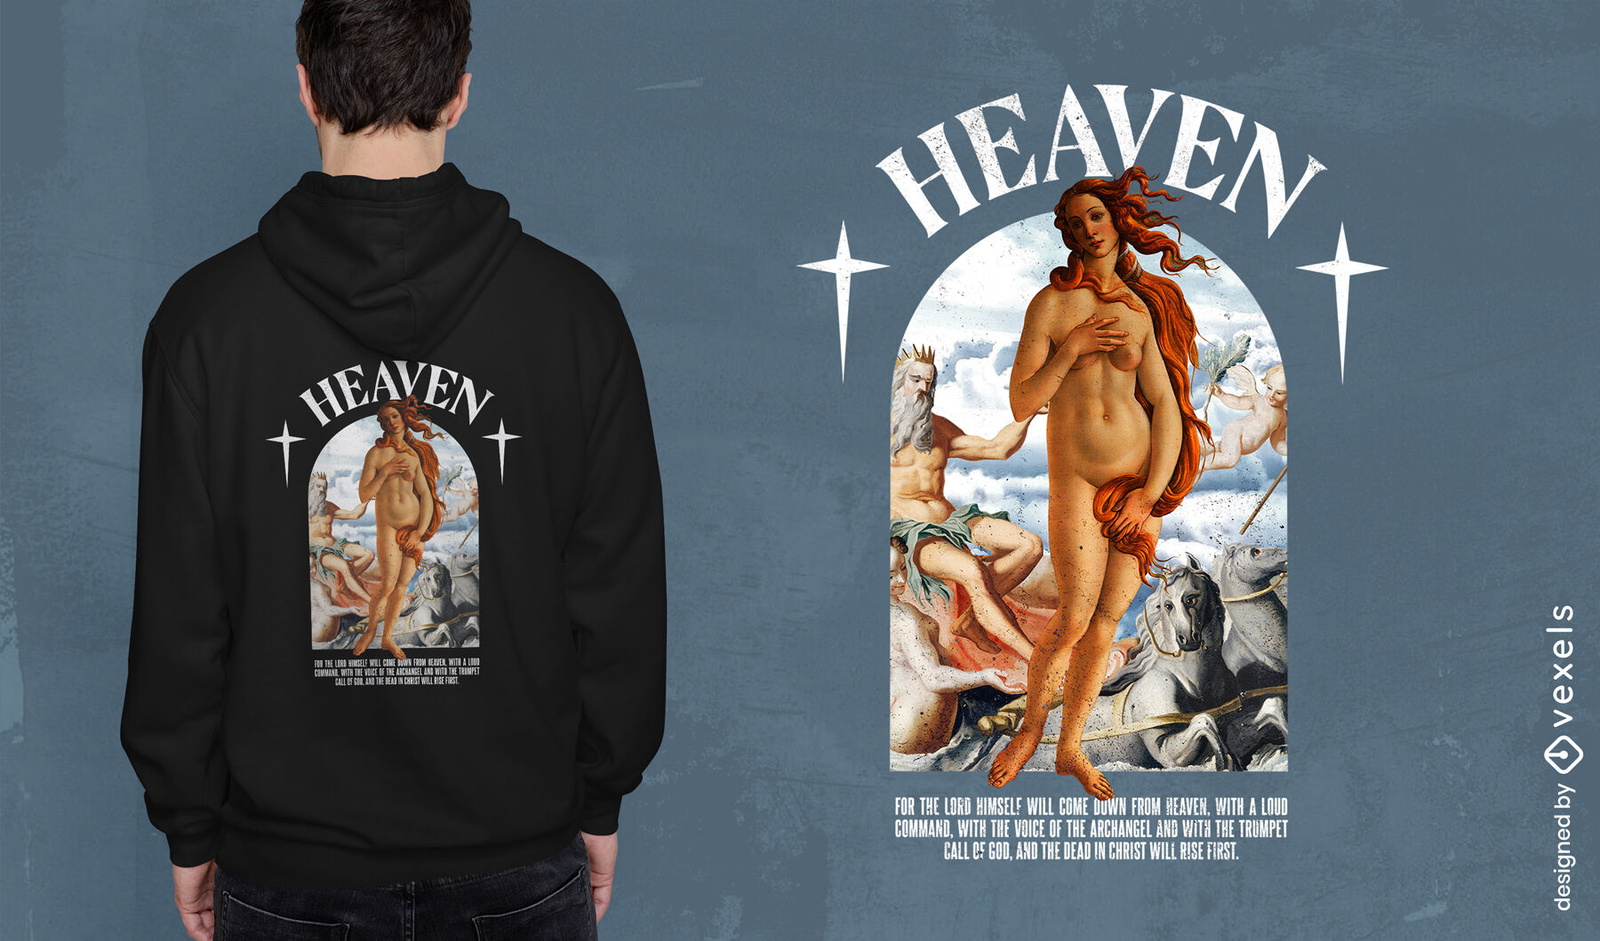
Design de camiseta PSD de Vênus Celestial
Escolha uma pasta
Todos os favoritos
Criar novo
Salvar
Design de camiseta PSD de Vênus Celestial
texto editável
para Merch
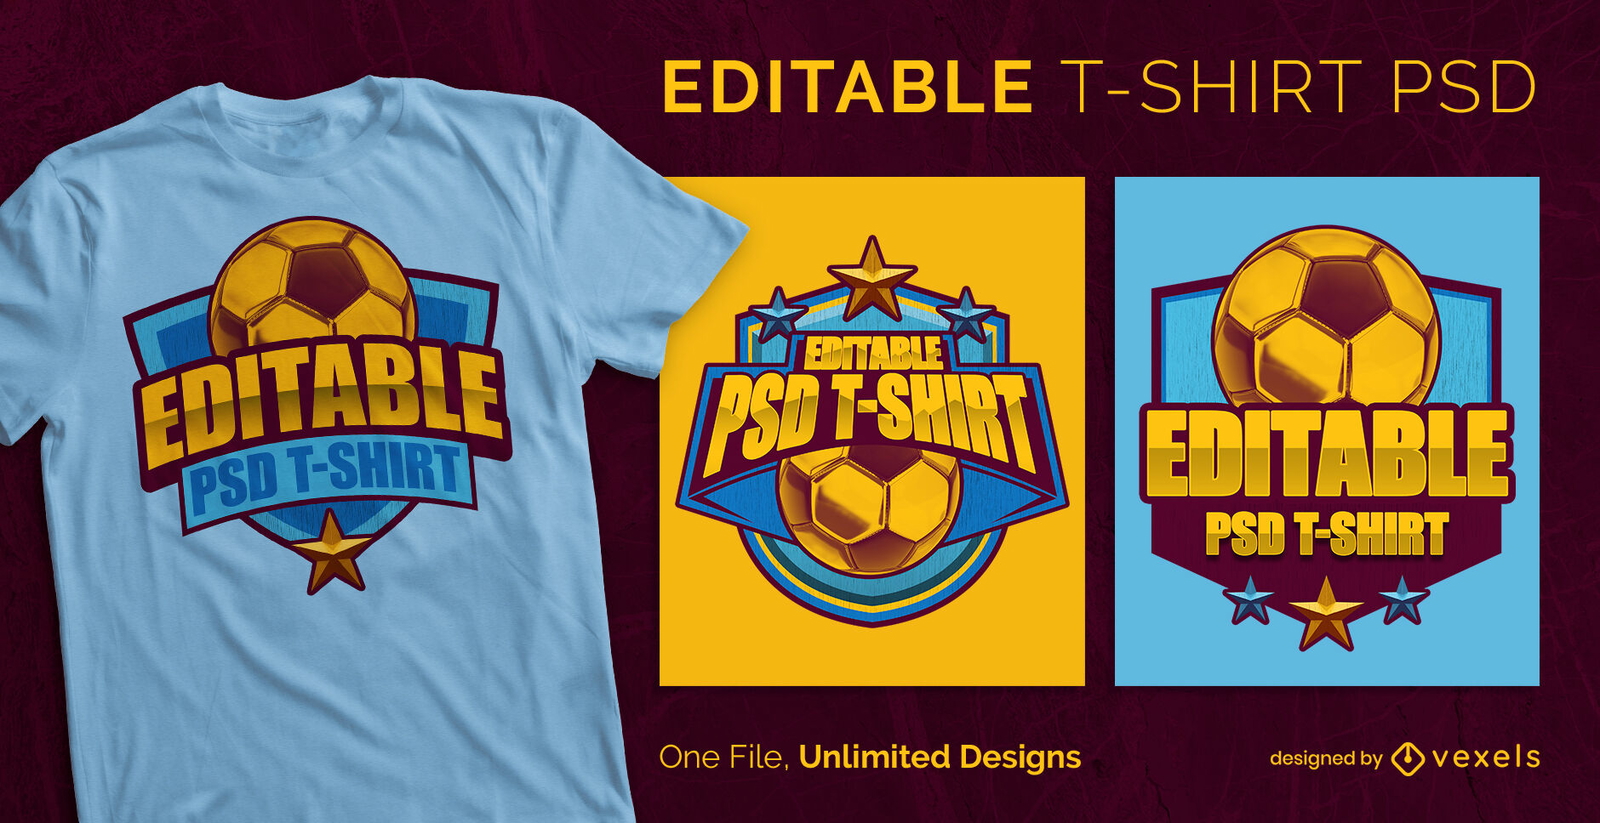
T-shirt PSD editável de troféus de futebol Qatar
Escolha uma pasta
Todos os favoritos
Criar novo
Salvar
T-shirt PSD editável de troféus de futebol Qatar
Impulsione seu negócio
Com a plataforma gráfica líder de mercado.
Ver planos
Próxima
do 67
prev page
next page