Biblioteca de design
Novos designs Merch
Camisetas
Vectores
Designs de Merch de Tendência
PNGs & SVGs
Mockups
Modelos de T-Shirt PSD
Explorar Desenhos
Designs KDP
Pôsteres
Canecas
Capas para celular
Sacos de compras
Almofadas
Ferramentas de desenho
Merch Designer
Novo!
Mockup Generator
Gerador de Design de AI
Vetorizador
Quote Generator
T-Shirt Maker (Antigo)
Ajuda
Merch Digest
Blog
Centro de Ajuda
Saiba mais sobre o Merch
Feedback
Soluções Corporativas
Empresa
Acesso à API
Estúdio de Design
Design em Lote
Preços
Carregando...
Inscrever-se
Conecte-se
PSD Templates
graficos
Biblioteca de design
Novos designs Merch
Camisetas
Vectores
Designs de Merch de Tendência
PNGs & SVGs
Mockups
Modelos de T-Shirt PSD
Explorar Desenhos
Designs KDP
Pôsteres
Canecas
Capas para celular
Sacos de compras
Almofadas
Ferramentas de desenho
Merch Designer
Novo!
Mockup Generator
Gerador de Design de AI
Vetorizador
Quote Generator
T-Shirt Maker (Antigo)
Ajuda
Merch Digest
Blog
Centro de Ajuda
Saiba mais sobre o Merch
Feedback
Soluções Corporativas
Empresa
Acesso à API
Estúdio de Design
Design em Lote
PLANOS
PSD Templates
graficos
3311 Designs de Camisetas e Mockups PSD de graficos
Baixar designs de camisetas ou mockups PSD editáveis de graficos
Relacionado:
graficos vetoriais
,
desenhos graficos de ações
,
graficos tridimensionais
Ordenar por
Mais relevante
Resultados patrocinados da
Ganhe 15% de desconto com o código: VEXELS15
veja mais detalhes
texto editável
para Merch
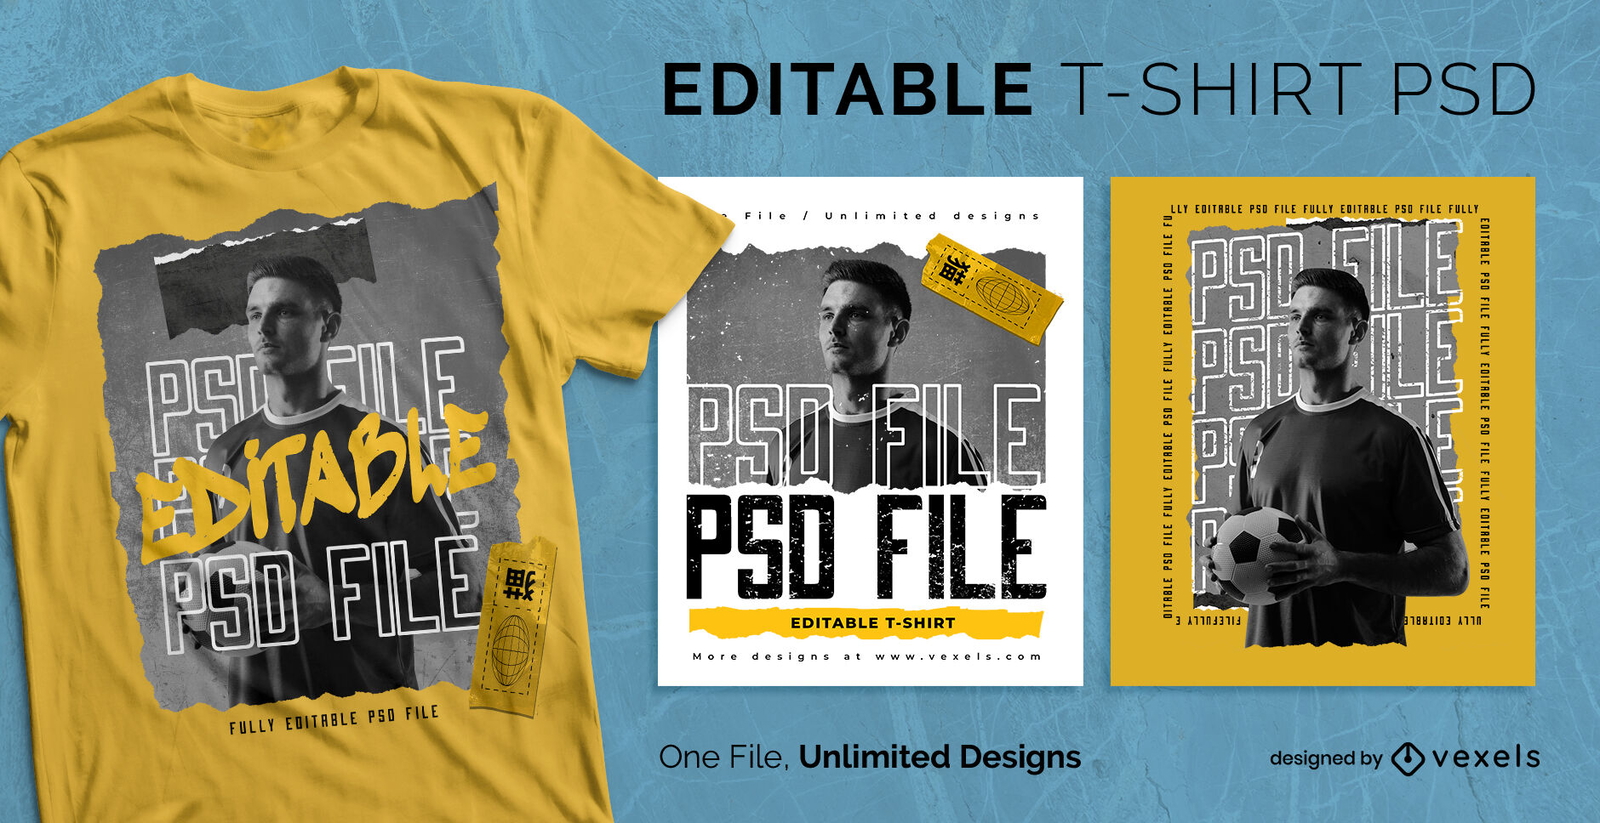
Design de camiseta psd escalável de jogador de futebol
Escolha uma pasta
Todos os favoritos
Criar novo
Salvar
Design de camiseta psd escalável de jogador de futebol
texto editável
Pronto para imprimir
para Merch
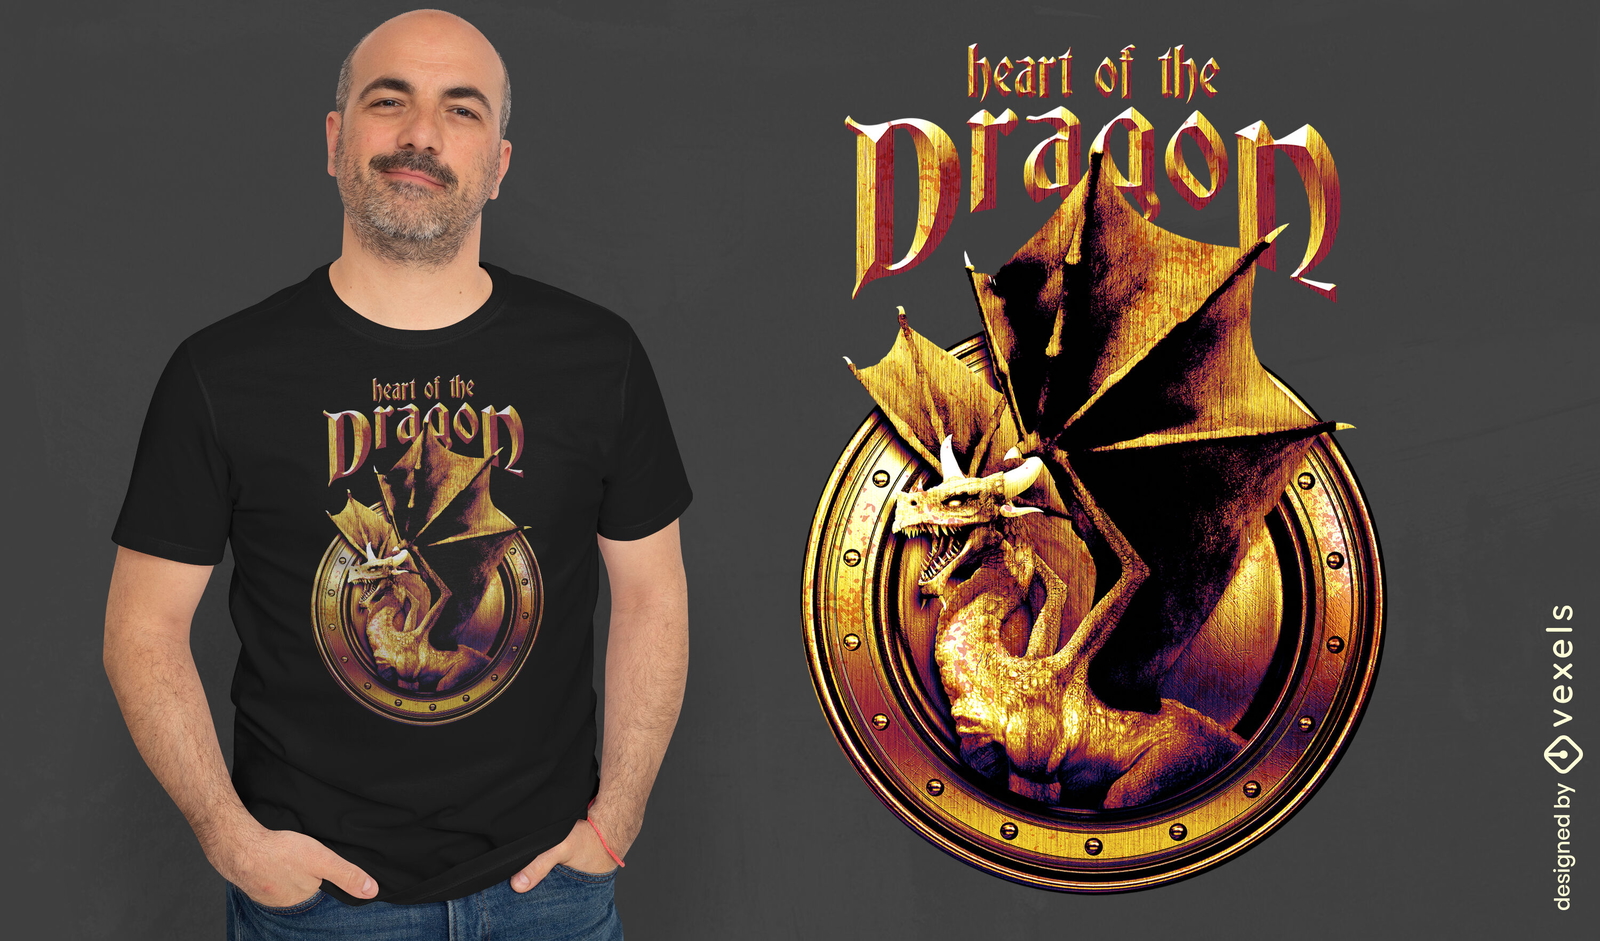
Coração do dragão design de camiseta PSD
Escolha uma pasta
Todos os favoritos
Criar novo
Salvar
Coração do dragão design de camiseta PSD
texto editável
Pronto para imprimir
para Merch
Design de camiseta dragão vs cavaleiro
Escolha uma pasta
Todos os favoritos
Criar novo
Salvar
Design de camiseta dragão vs cavaleiro
texto editável
Pronto para imprimir
para Merch
Festa de ano novo com camiseta de fogos de artifício psd
Escolha uma pasta
Todos os favoritos
Criar novo
Salvar
Festa de ano novo com camiseta de fogos de artifício psd
texto editável
Pronto para imprimir
para Merch
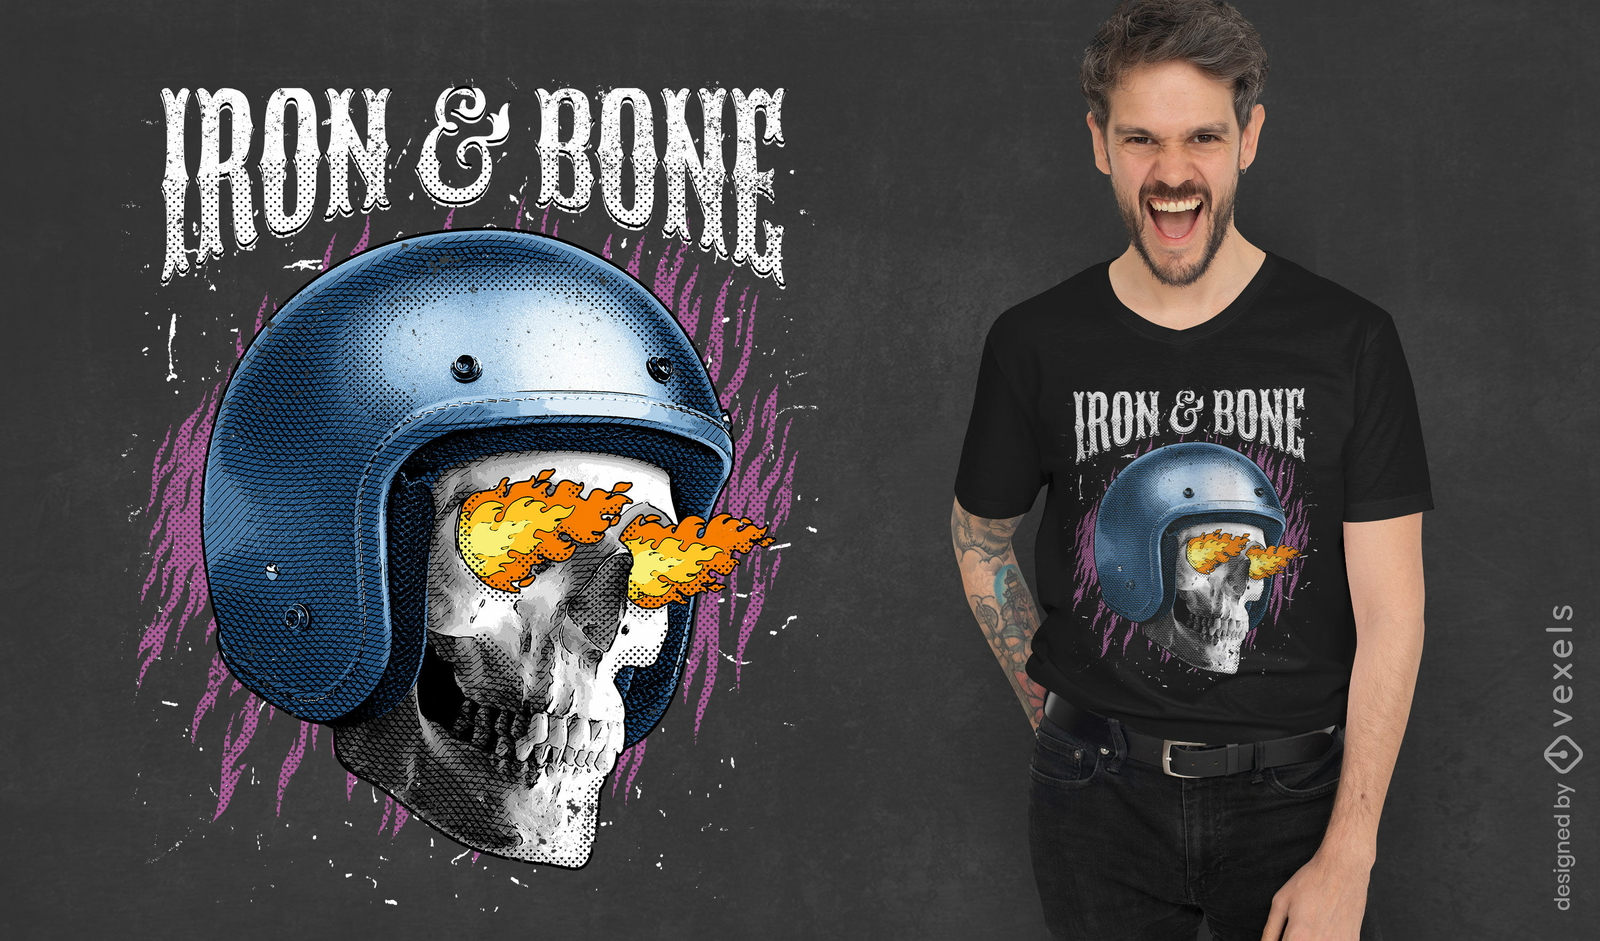
Crânio com design de camiseta psd de capacete de motociclista
Escolha uma pasta
Todos os favoritos
Criar novo
Salvar
Crânio com design de camiseta psd de capacete de motociclista
Pronto para imprimir
para Merch
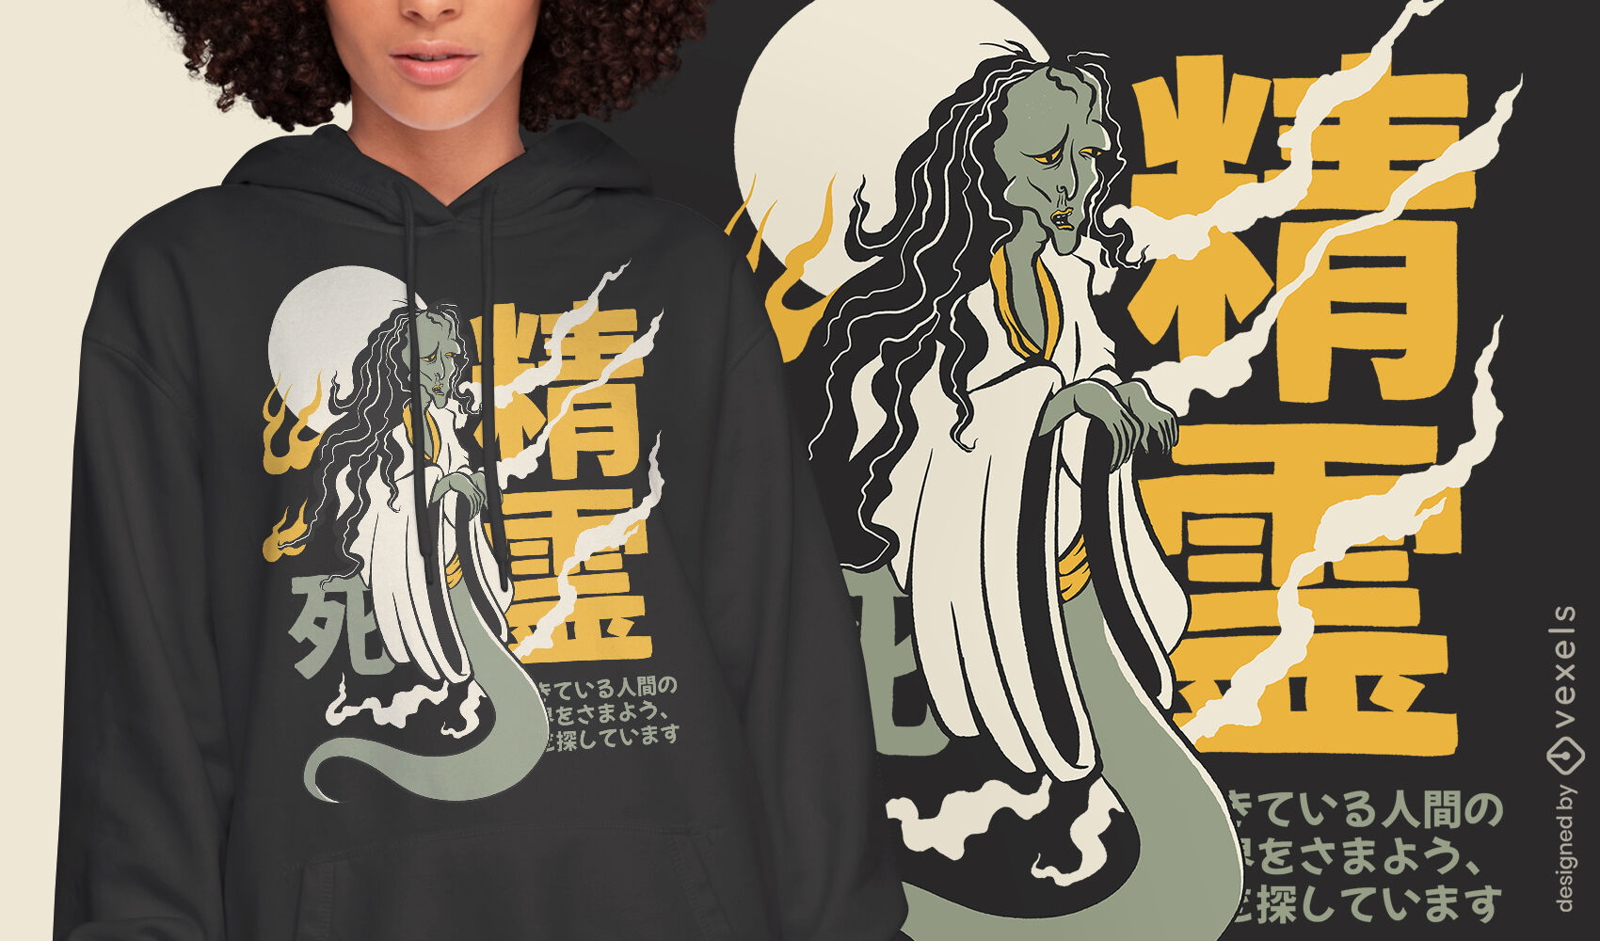
Design de camiseta japonesa de fantasma de mulher Yurei
Escolha uma pasta
Todos os favoritos
Criar novo
Salvar
Design de camiseta japonesa de fantasma de mulher Yurei
Pronto para imprimir
para Merch
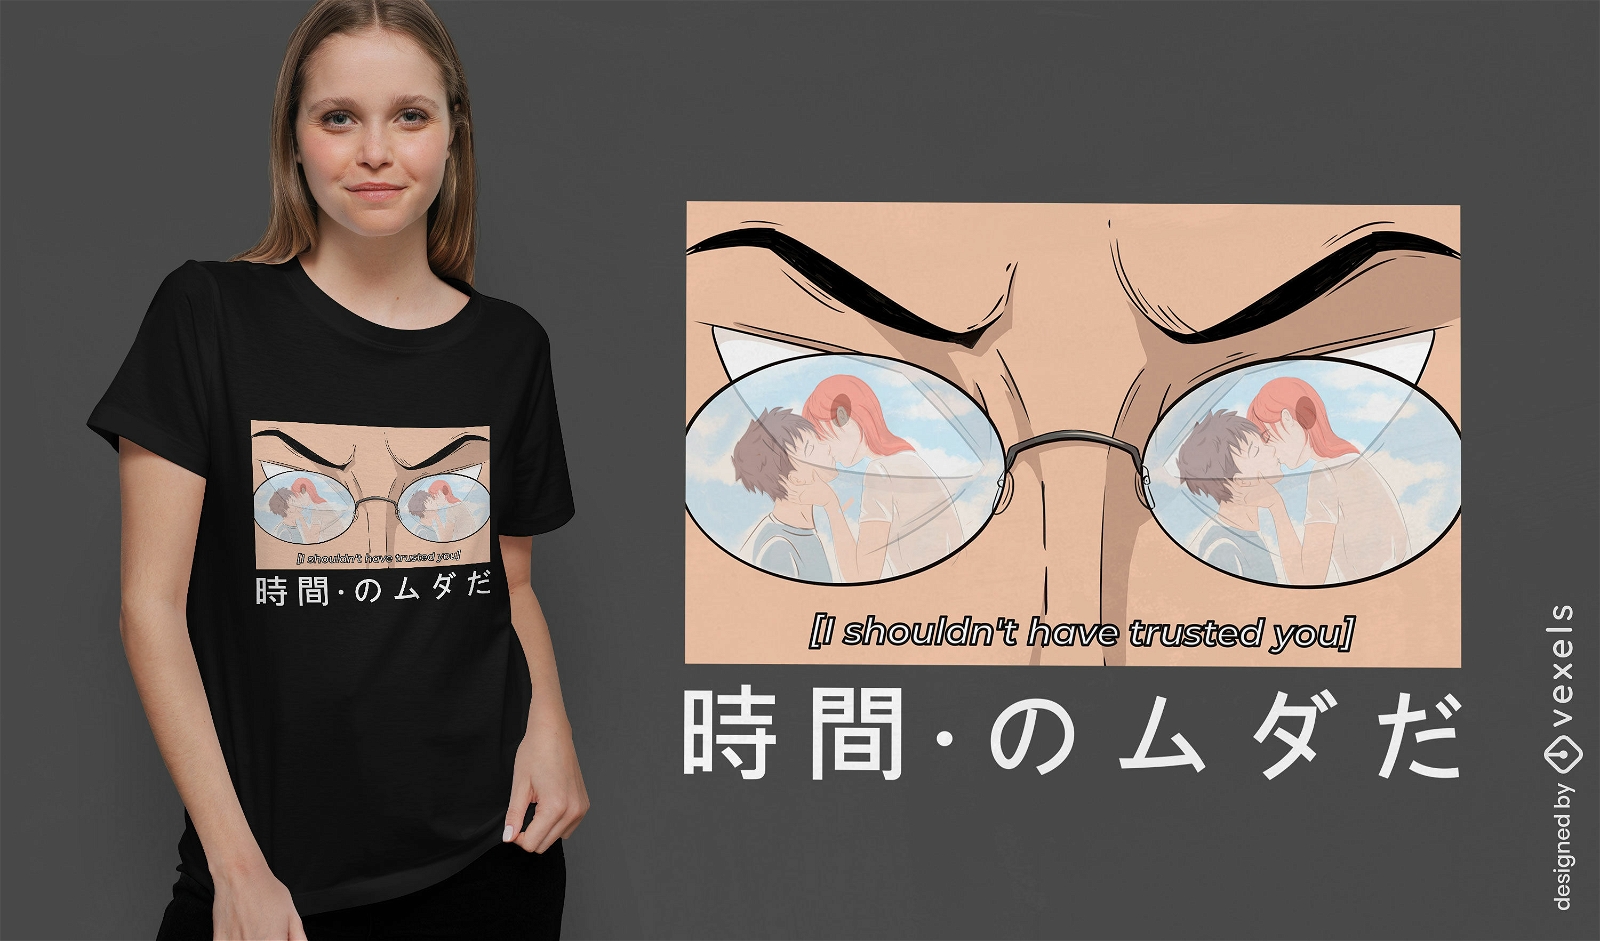
Design de camiseta de drama de romance de anime
Escolha uma pasta
Todos os favoritos
Criar novo
Salvar
Design de camiseta de drama de romance de anime
Pronto para imprimir
para Merch
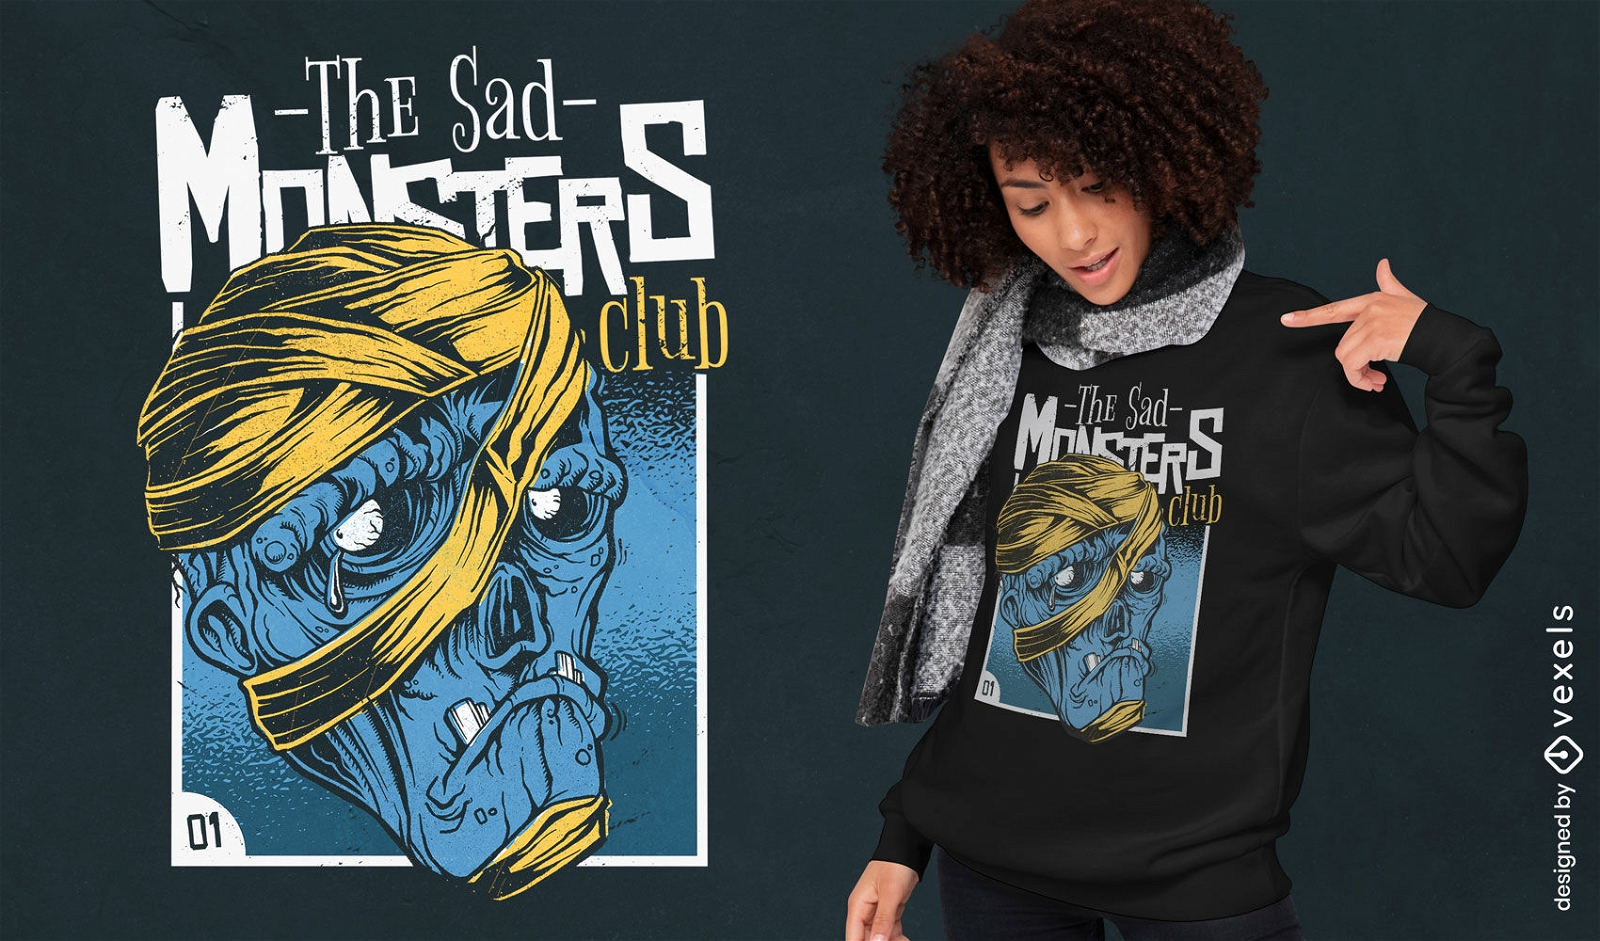
Design de camiseta em quadrinhos de monstro zumbi triste
Escolha uma pasta
Todos os favoritos
Criar novo
Salvar
Design de camiseta em quadrinhos de monstro zumbi triste
texto editável
Pronto para imprimir
para Merch
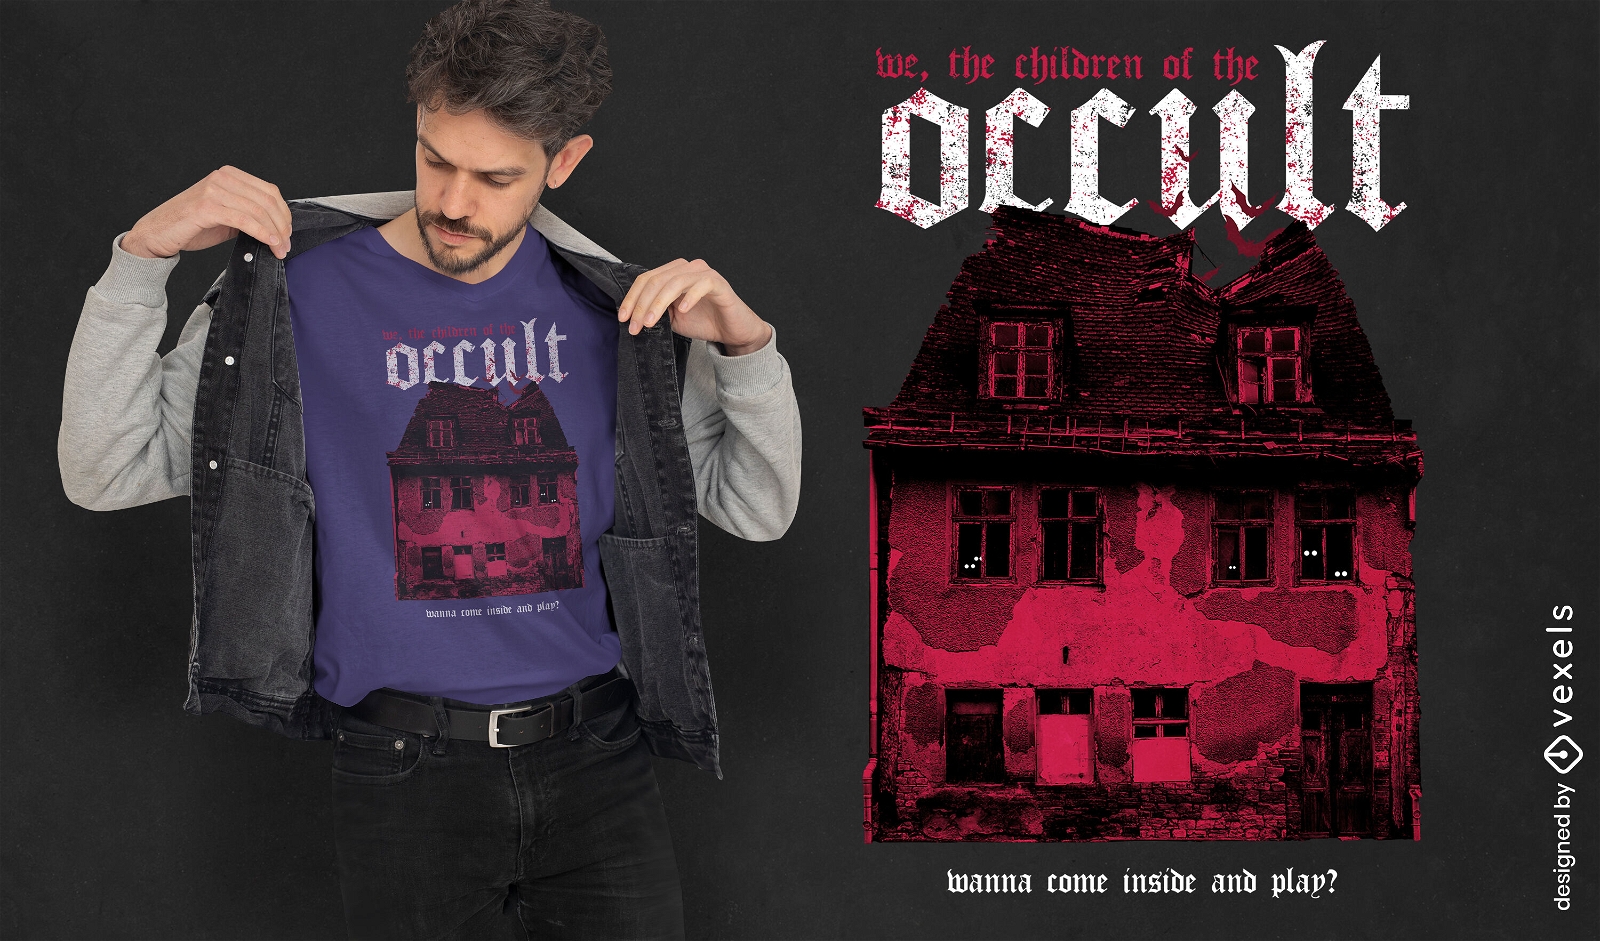
Design de camiseta PSD de terror de casa assombrada
Escolha uma pasta
Todos os favoritos
Criar novo
Salvar
Design de camiseta PSD de terror de casa assombrada
texto editável
Pronto para imprimir
para Merch
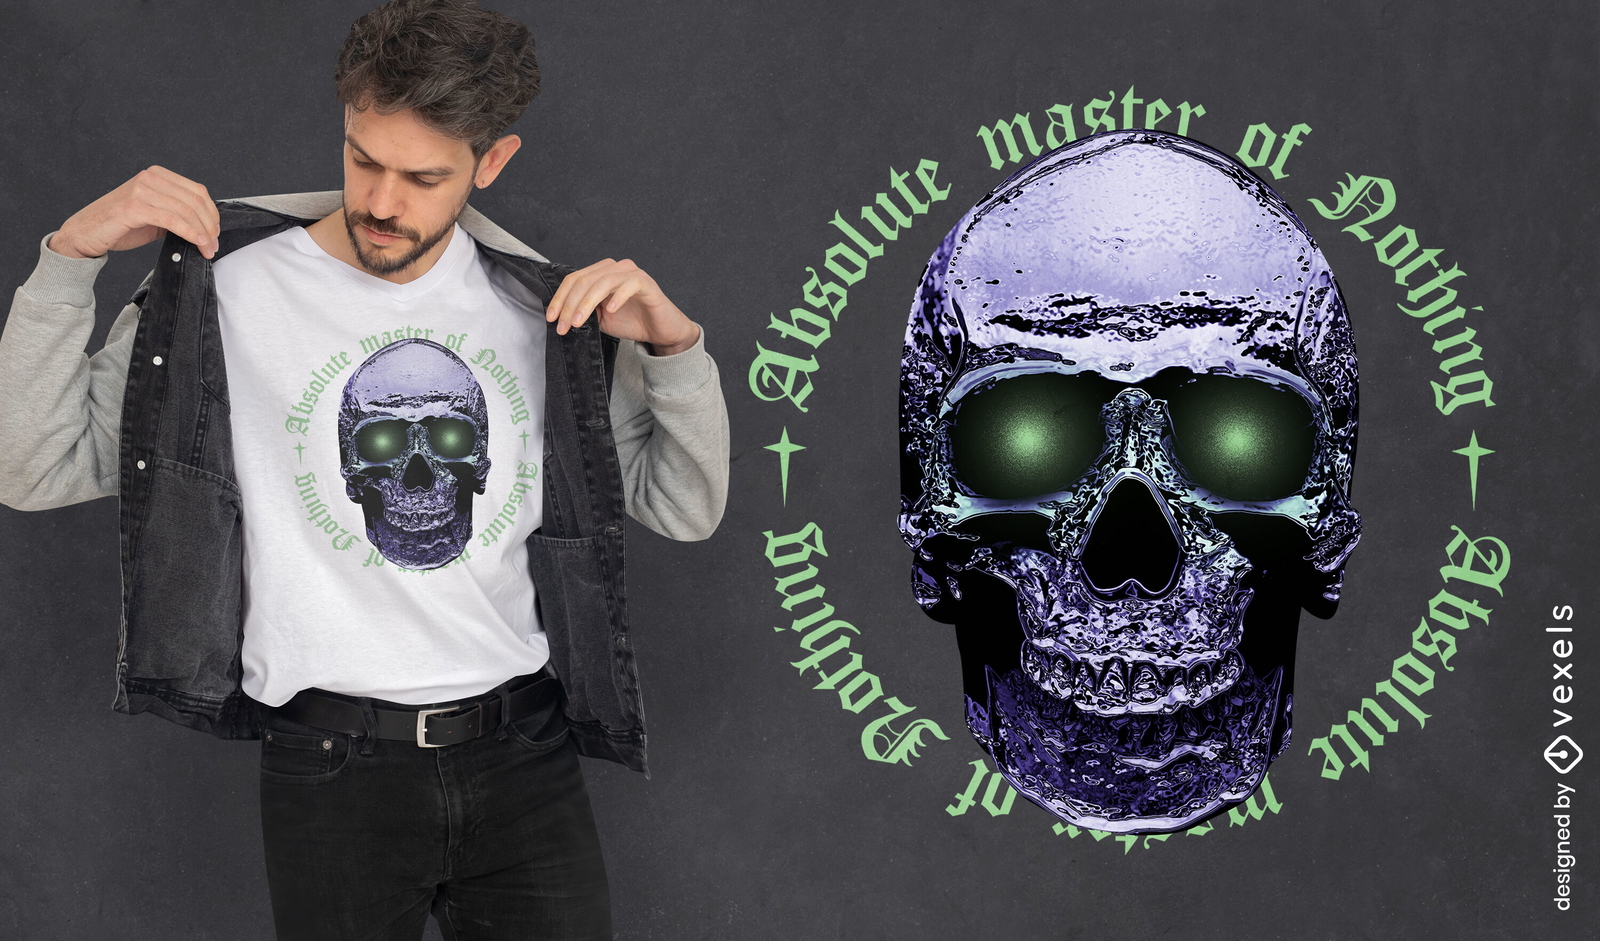
Design de camiseta com citação de caveira de metal
Escolha uma pasta
Todos os favoritos
Criar novo
Salvar
Design de camiseta com citação de caveira de metal
Pronto para imprimir
para Merch
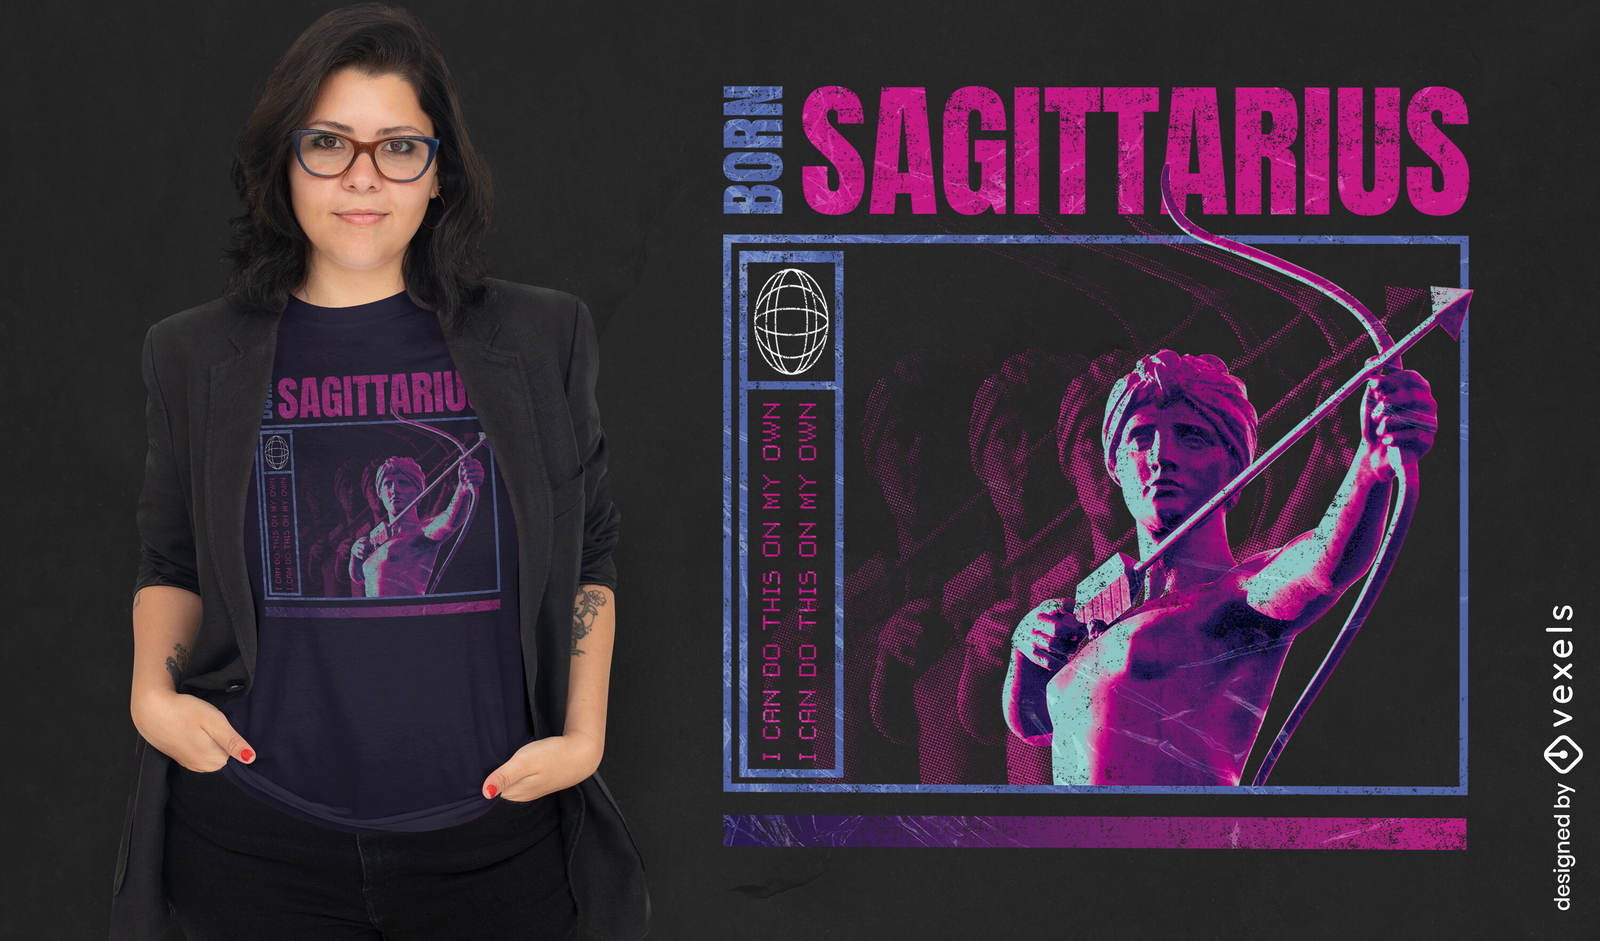
Design de camiseta psd nascido em Sagitário
Escolha uma pasta
Todos os favoritos
Criar novo
Salvar
Design de camiseta psd nascido em Sagitário
Pronto para imprimir
para Merch
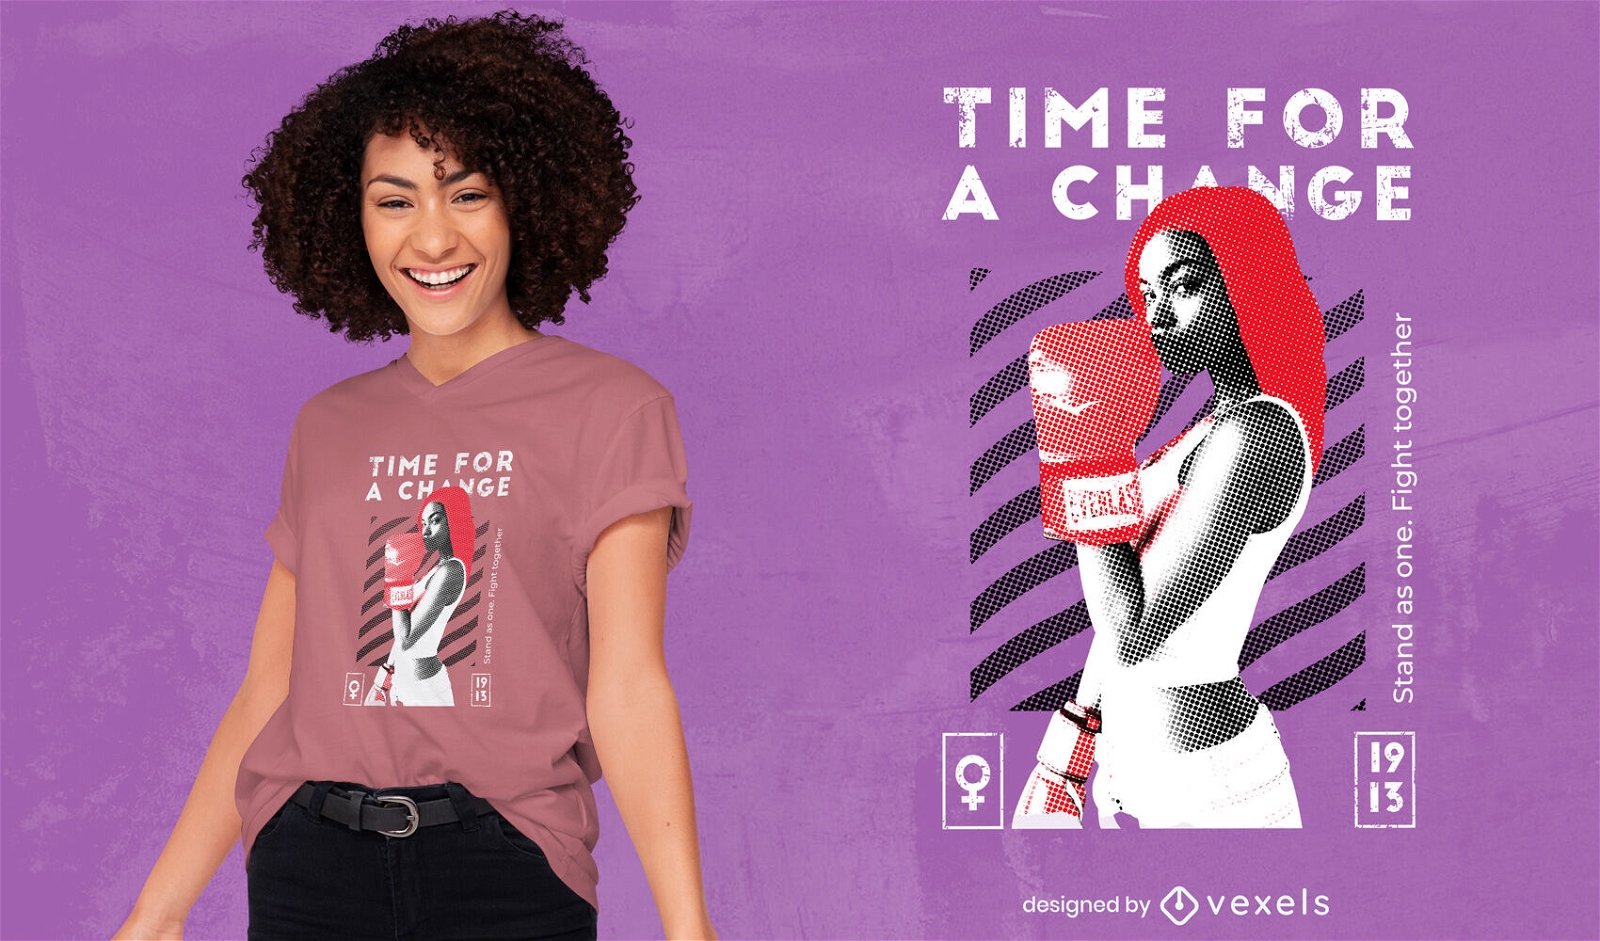
Camiseta esporte forte ruiva boxe menina psd
Escolha uma pasta
Todos os favoritos
Criar novo
Salvar
Camiseta esporte forte ruiva boxe menina psd
Pronto para imprimir
para Merch
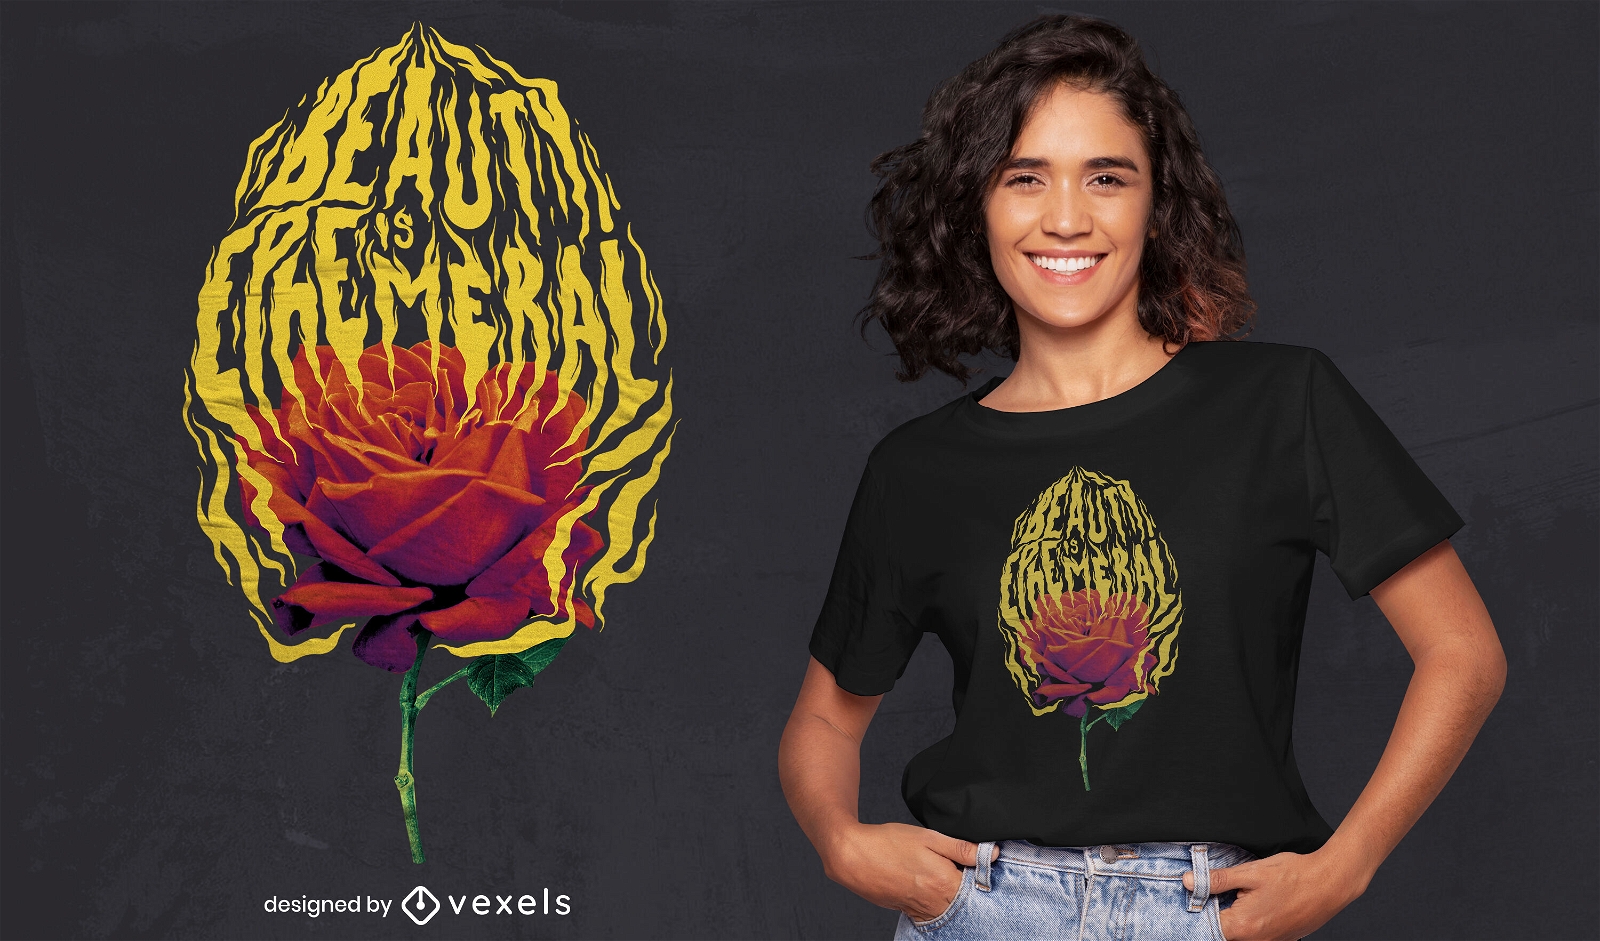
Rosa em chamas design de camiseta psd
Escolha uma pasta
Todos os favoritos
Criar novo
Salvar
Rosa em chamas design de camiseta psd
Pronto para imprimir
para Merch
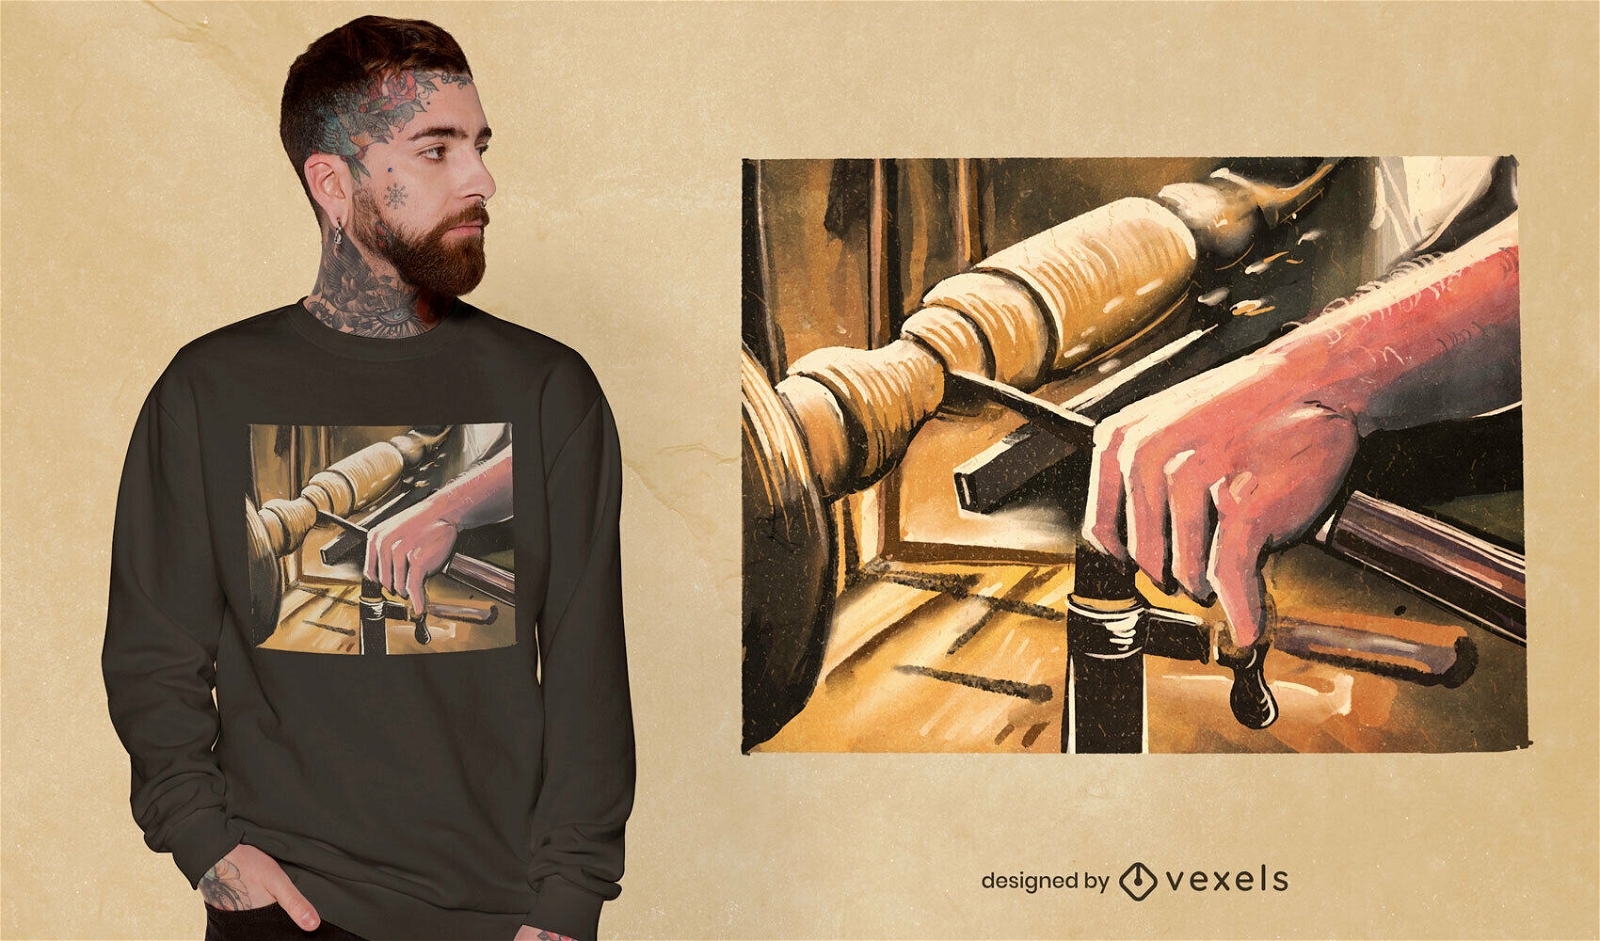
T-shirt de pintura realista de torneiro de madeira psd
Escolha uma pasta
Todos os favoritos
Criar novo
Salvar
T-shirt de pintura realista de torneiro de madeira psd
Pronto para imprimir
para Merch
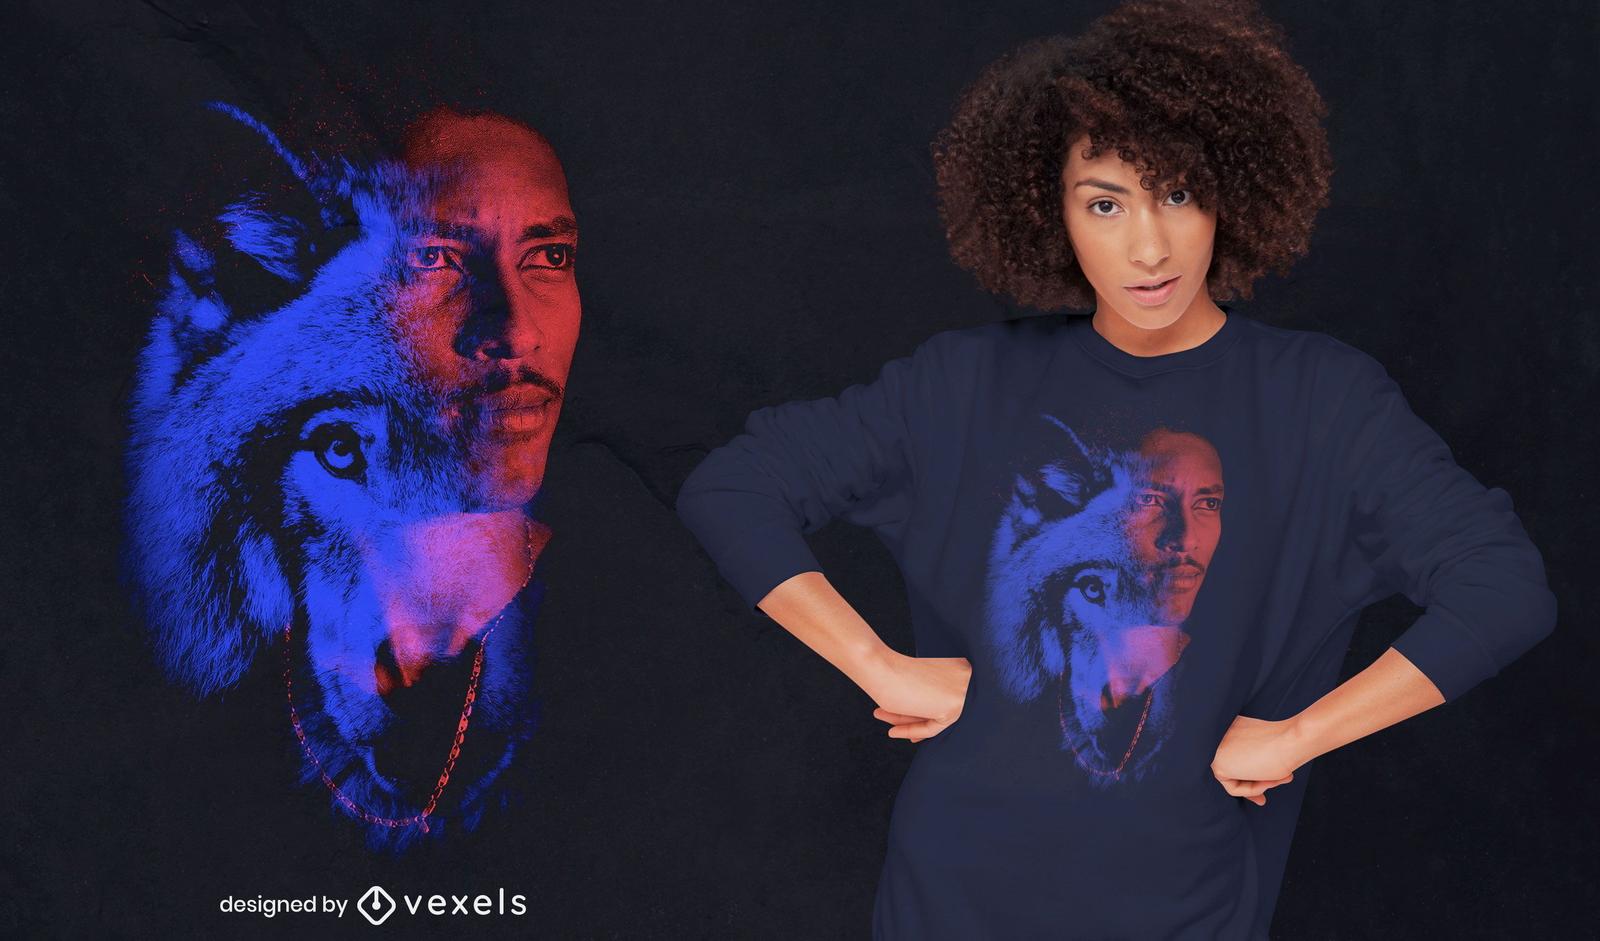
Design de t-shirt psd dupla exposição homem e lobo
Escolha uma pasta
Todos os favoritos
Criar novo
Salvar
Design de t-shirt psd dupla exposição homem e lobo
Camiseta PSD escalável
para Merch
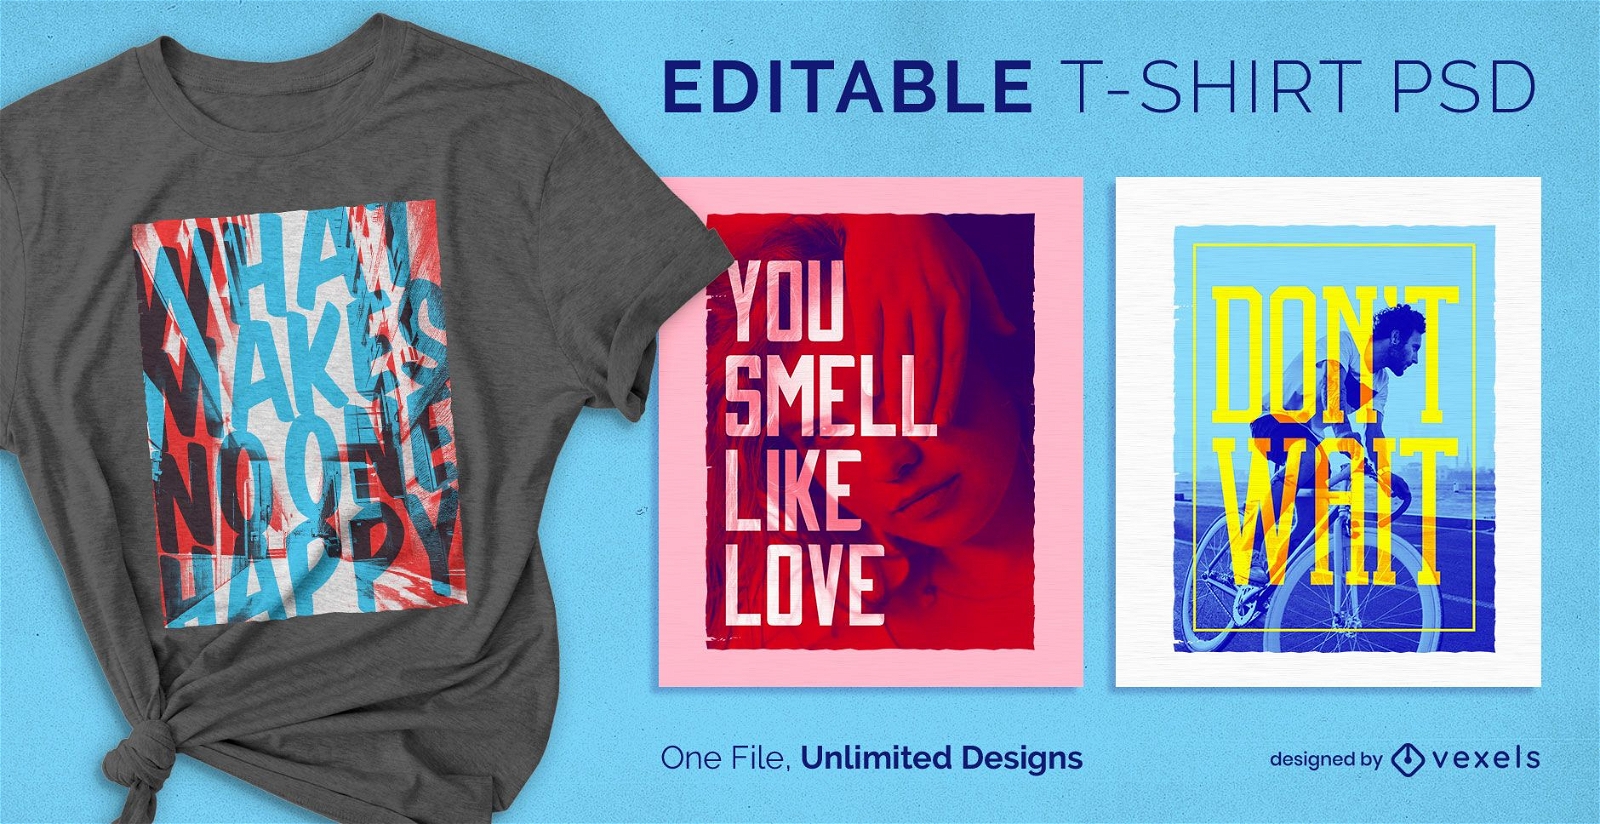
T-shirt escalável com texto transparente psd
Escolha uma pasta
Todos os favoritos
Criar novo
Salvar
T-shirt escalável com texto transparente psd
Camiseta PSD escalável
para Merch
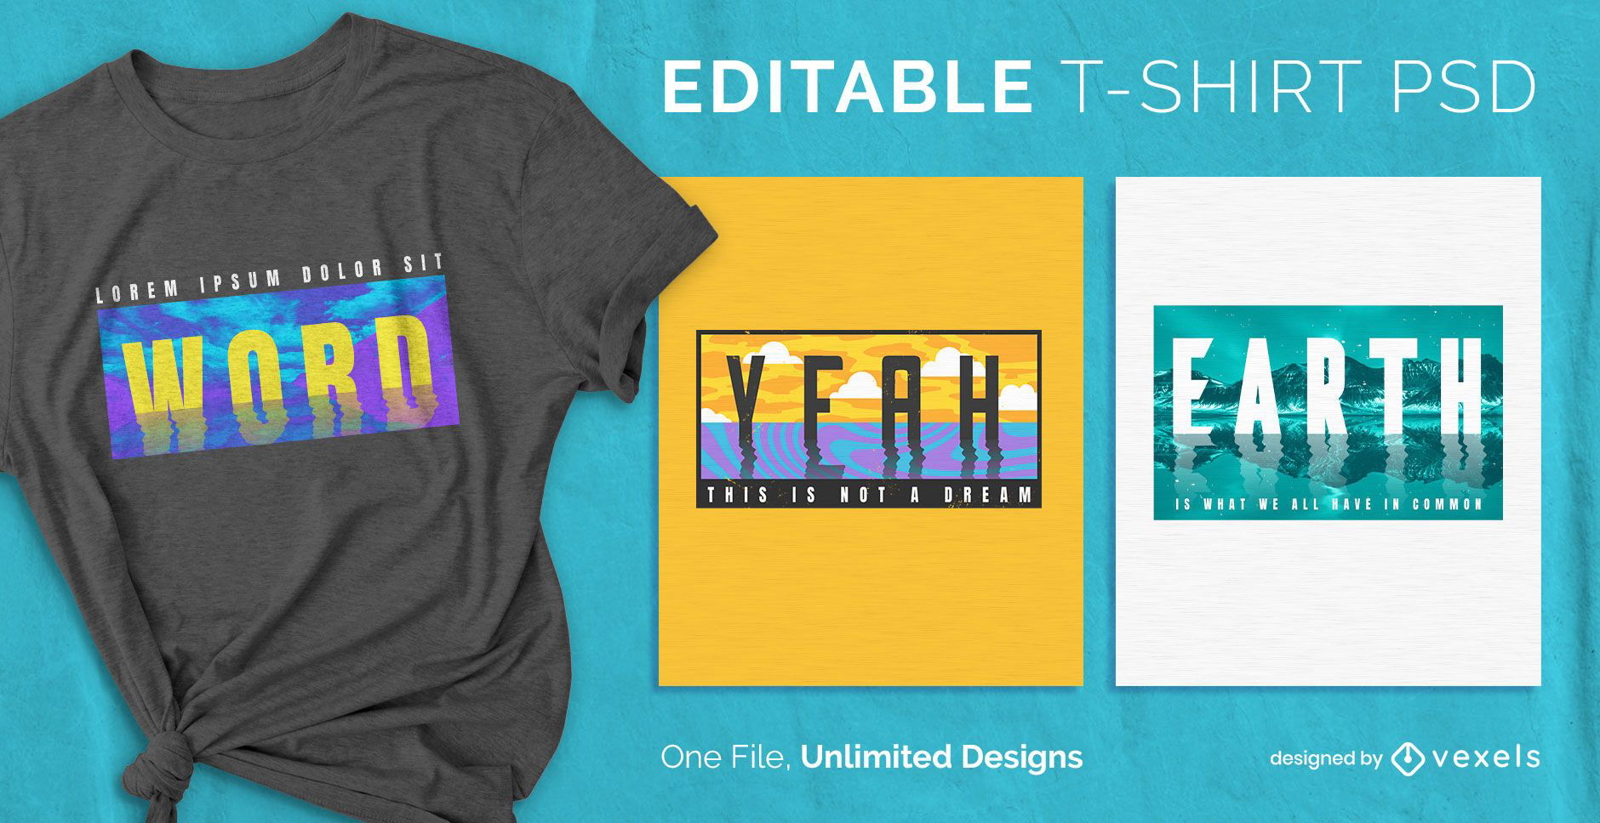
Camiseta escalável água PSD
Escolha uma pasta
Todos os favoritos
Criar novo
Salvar
Camiseta escalável água PSD
Camiseta PSD escalável
para Merch
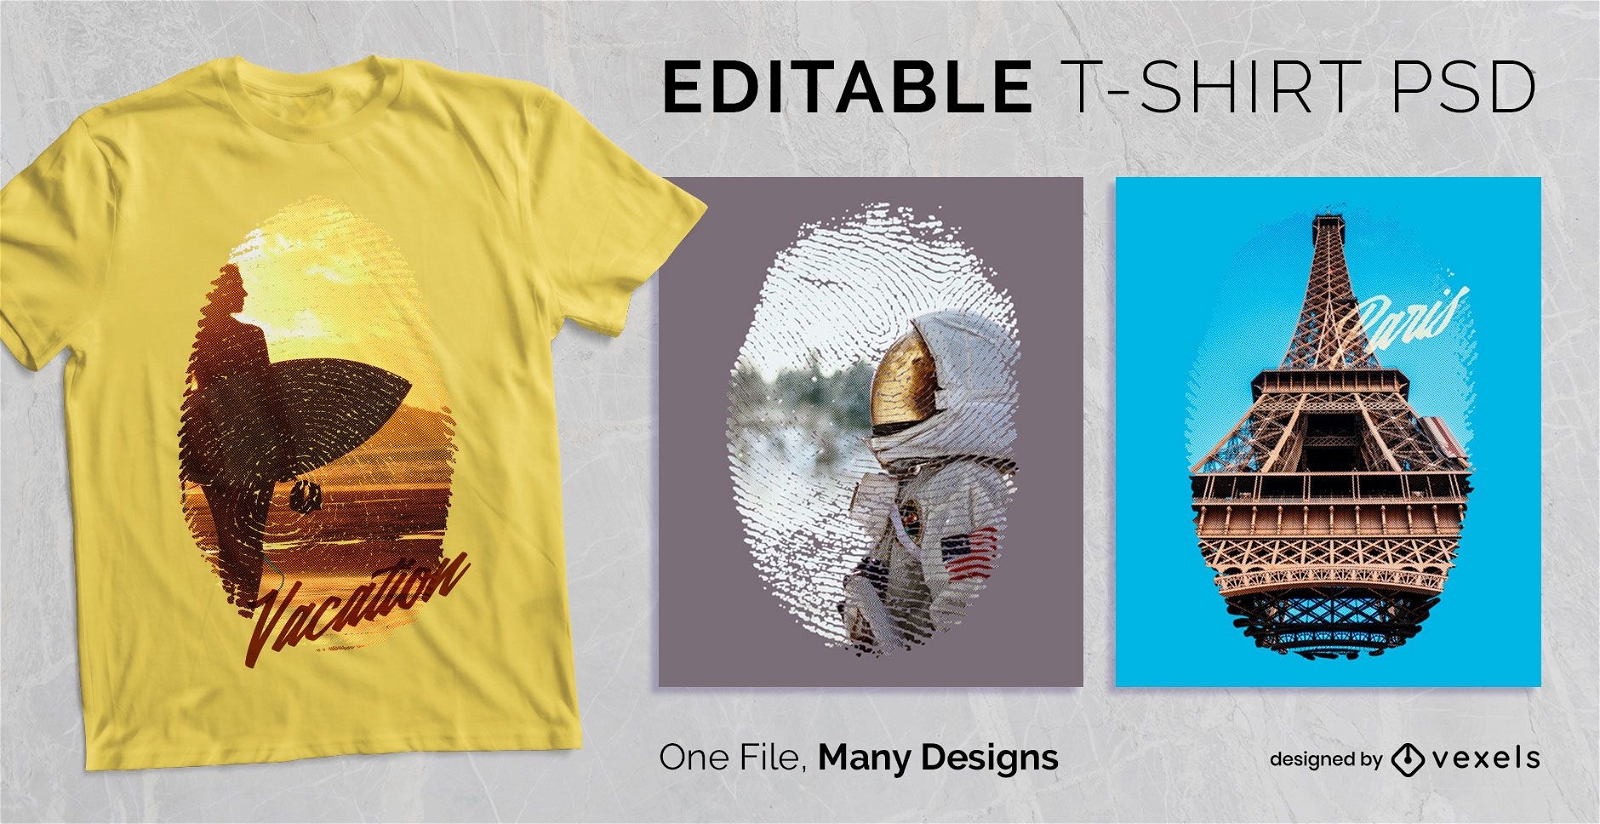
Camiseta PSD escalável com impressão digital editável
Escolha uma pasta
Todos os favoritos
Criar novo
Salvar
Camiseta PSD escalável com impressão digital editável
Pronto para imprimir
para Merch
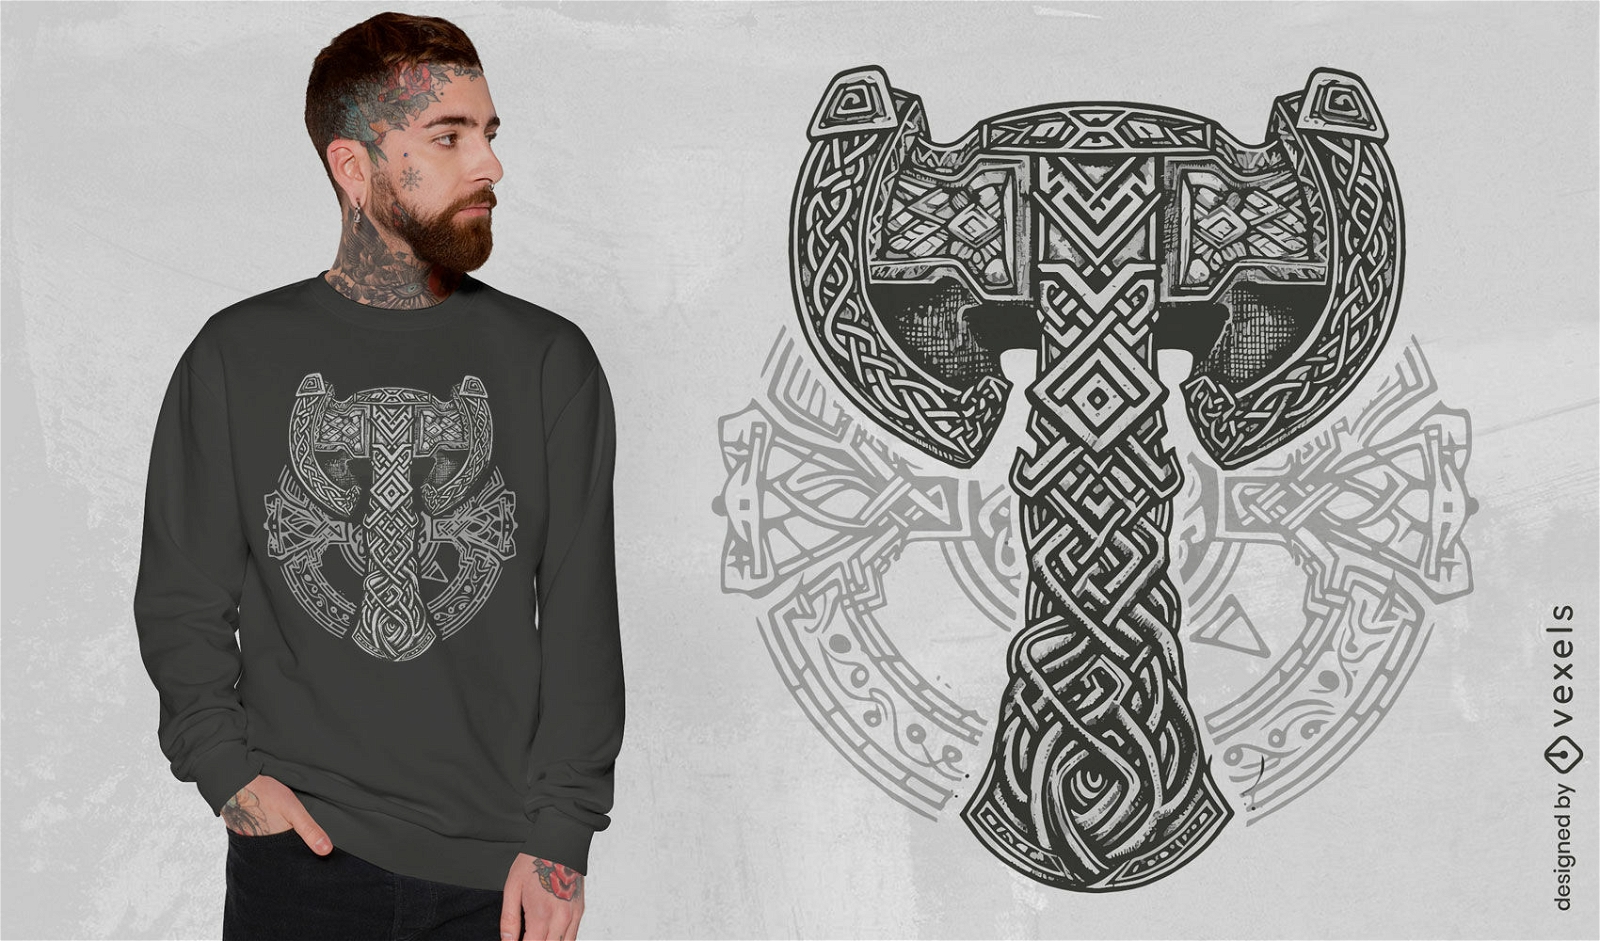
Design de camiseta tribal com martelo viking
Escolha uma pasta
Todos os favoritos
Criar novo
Salvar
Design de camiseta tribal com martelo viking
Pronto para imprimir
para Merch
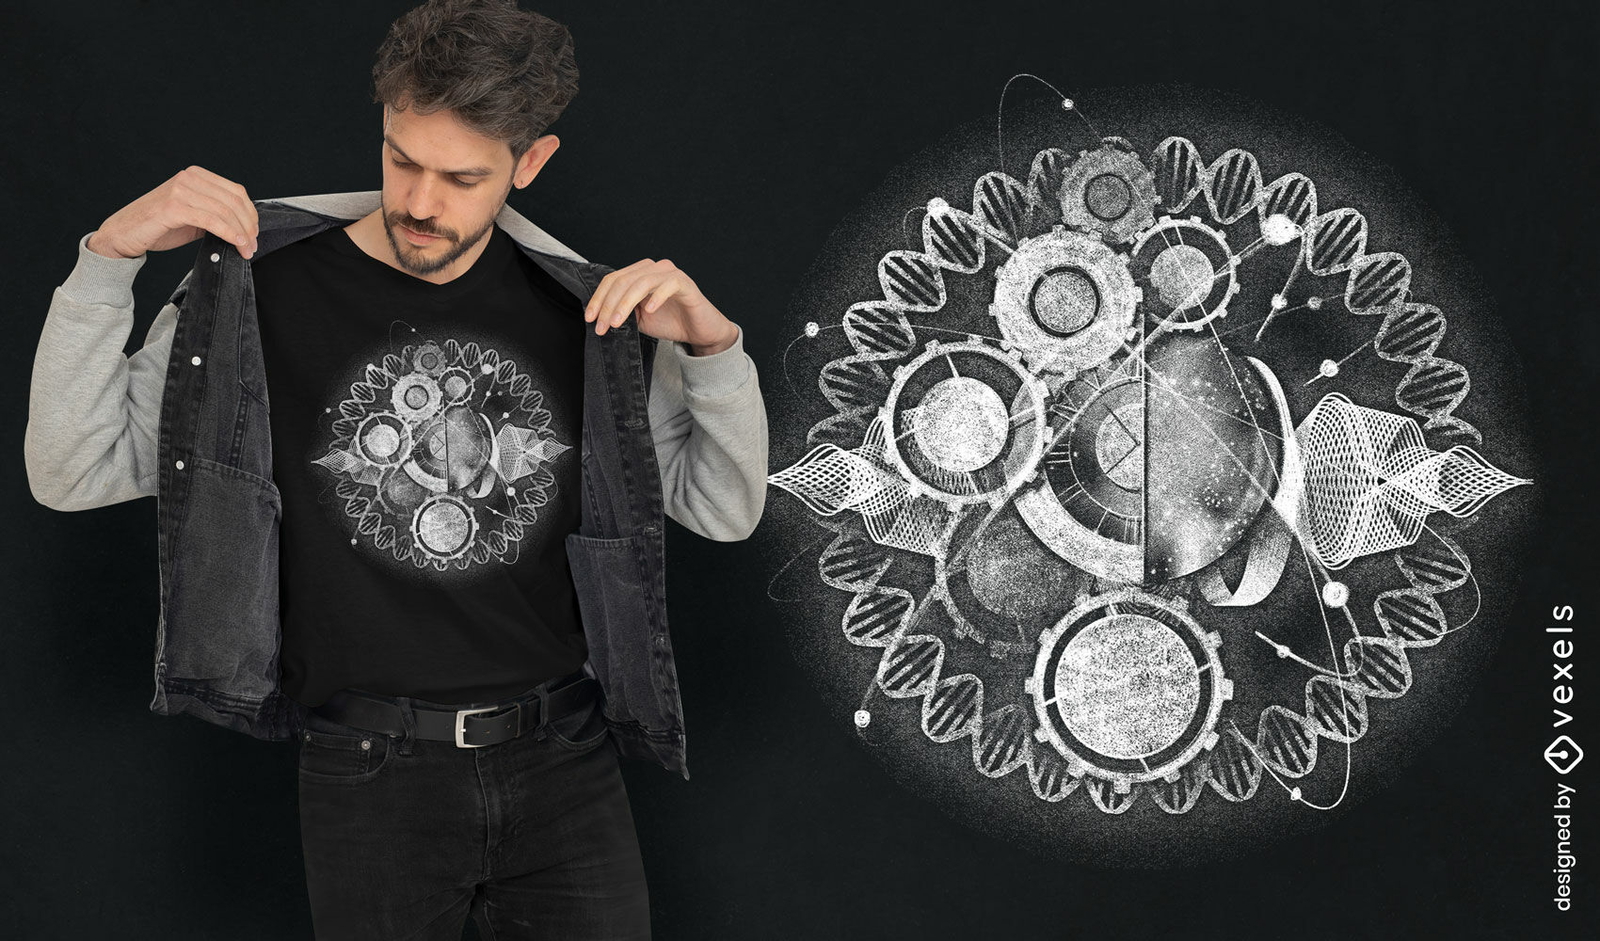
Design de camiseta do relógio do universo
Escolha uma pasta
Todos os favoritos
Criar novo
Salvar
Design de camiseta do relógio do universo
Pronto para imprimir
para Merch
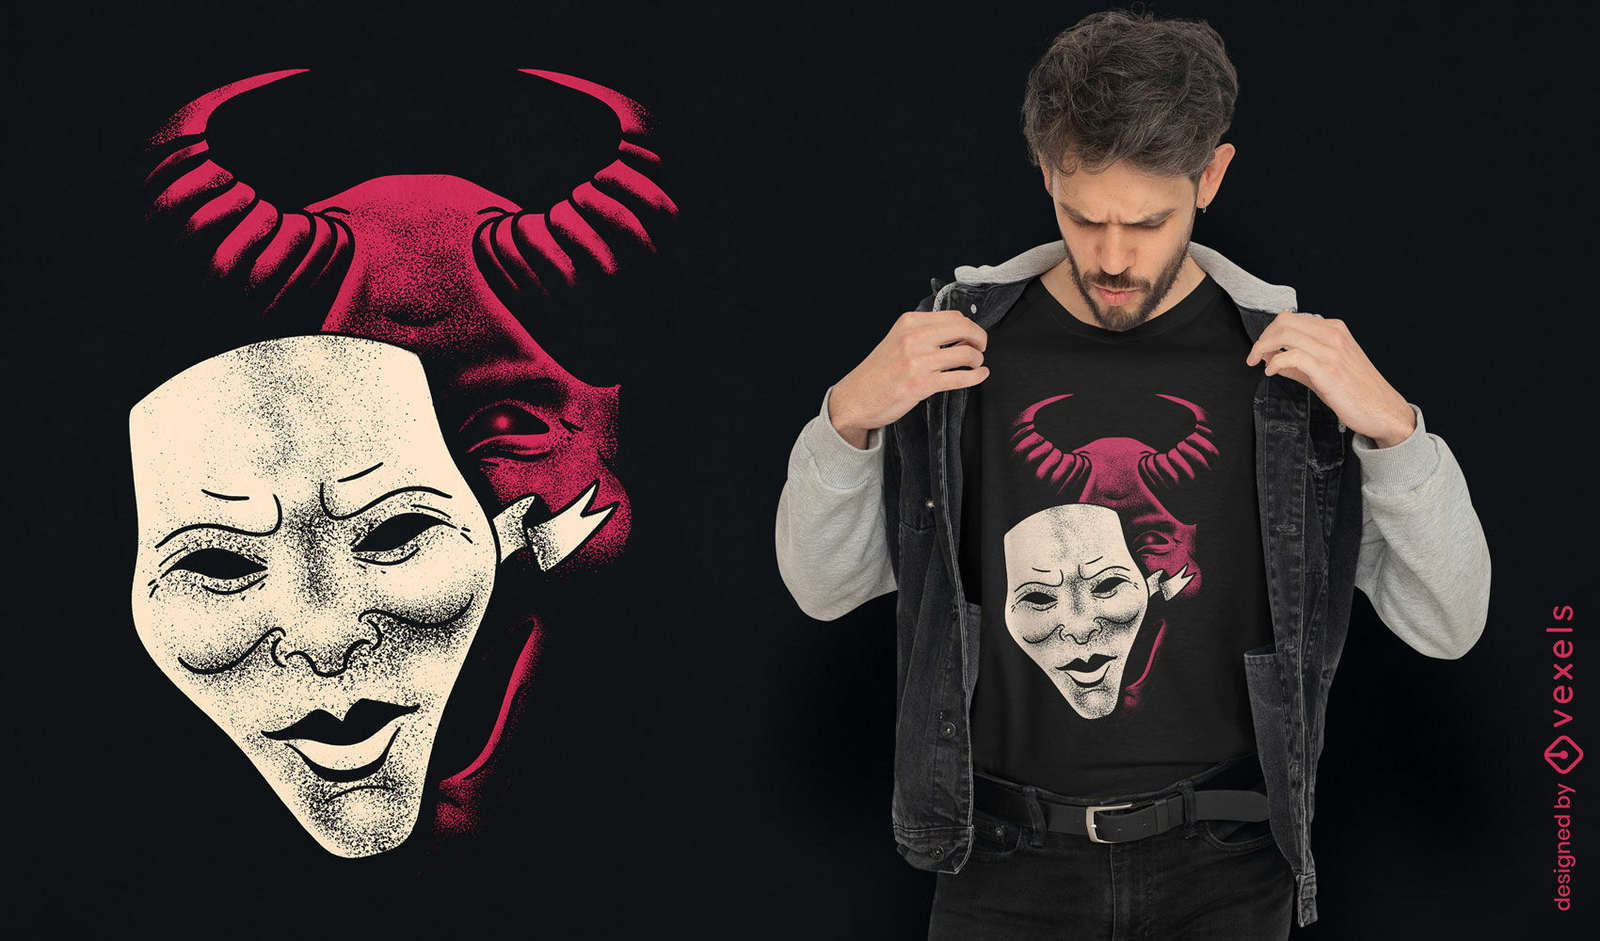
Design de camiseta de halloween demônio e máscara
Escolha uma pasta
Todos os favoritos
Criar novo
Salvar
Design de camiseta de halloween demônio e máscara
Pronto para imprimir
para Merch
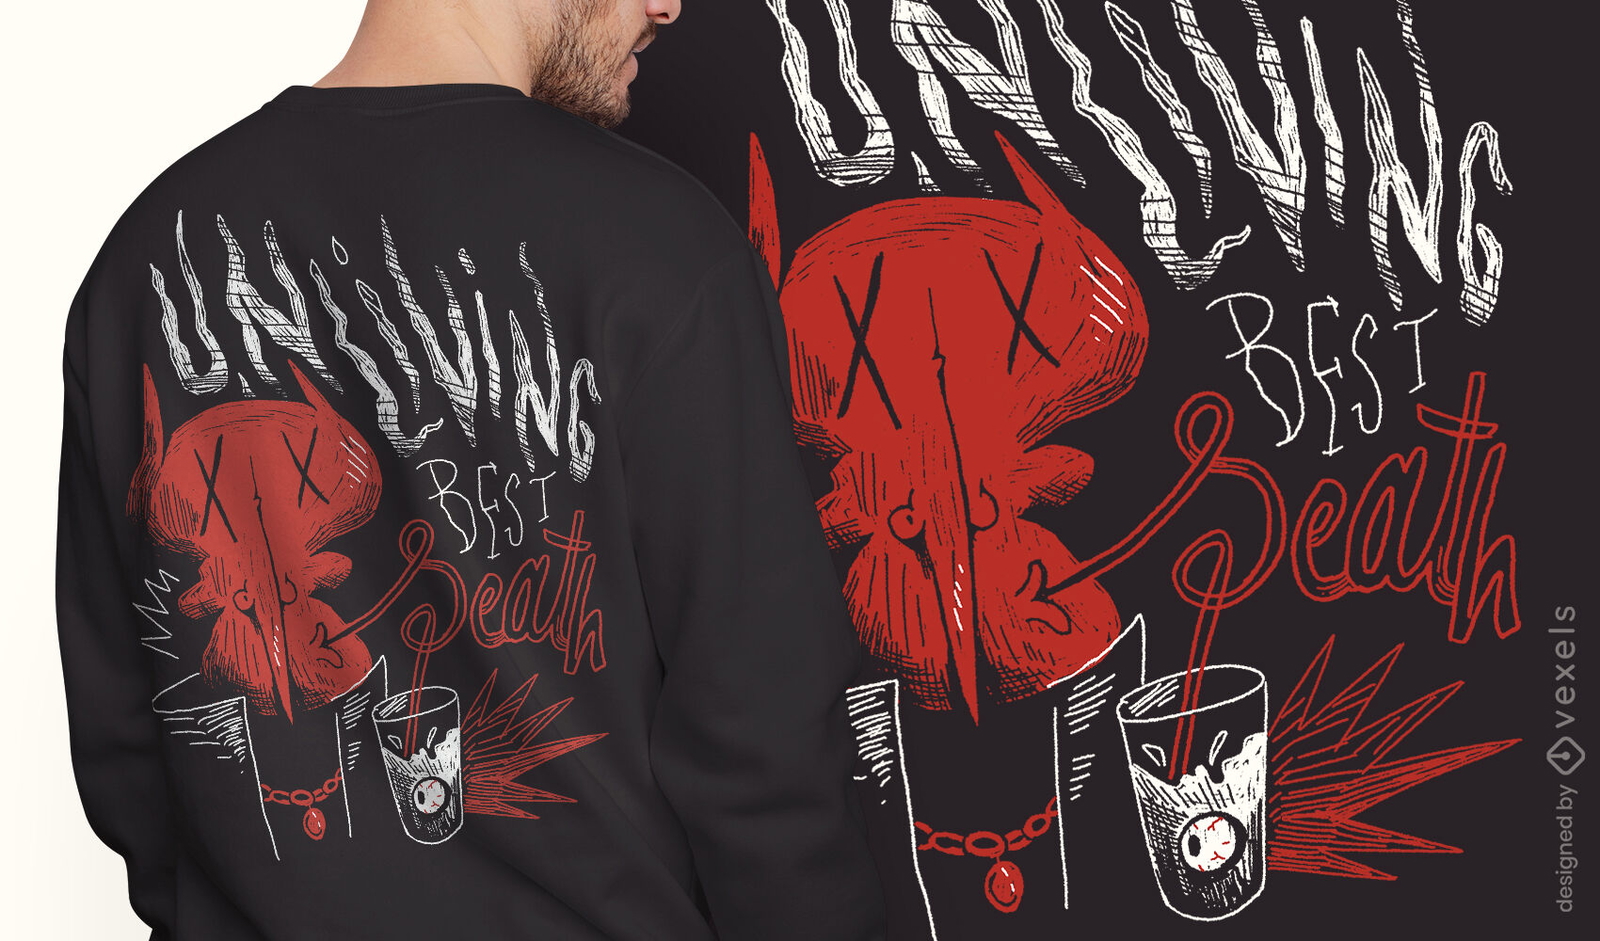
Unliving melhor design de camiseta da morte após a morte
Escolha uma pasta
Todos os favoritos
Criar novo
Salvar
Unliving melhor design de camiseta da morte após a morte
texto editável
Pronto para imprimir
para Merch
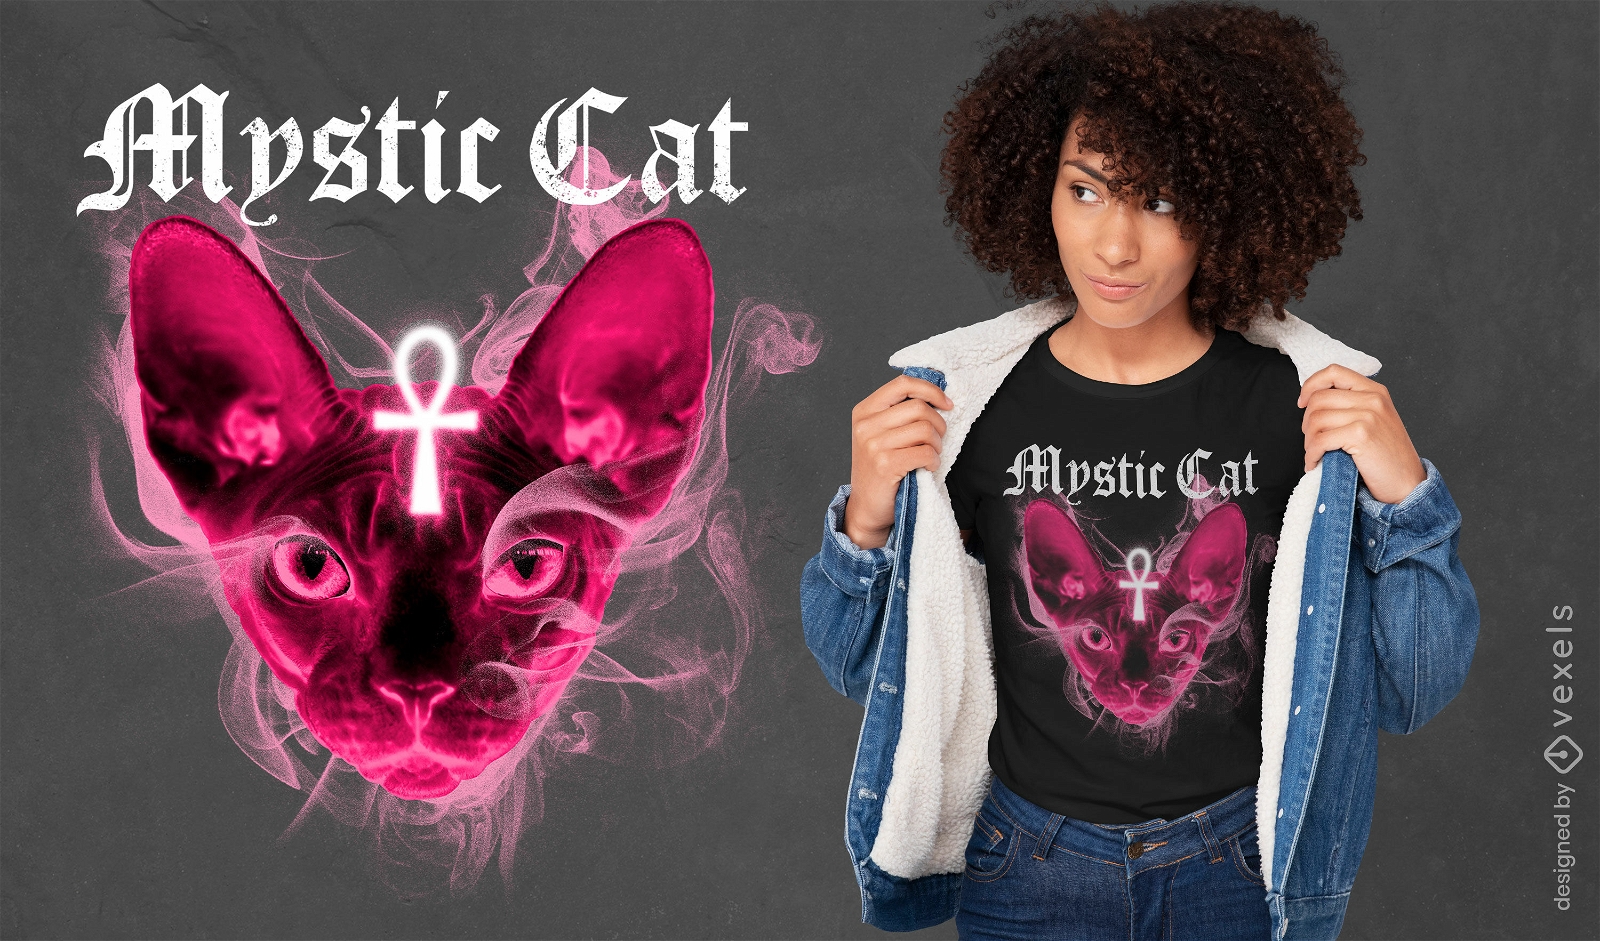
Design de camiseta psd de gato Mystic Sphynx
Escolha uma pasta
Todos os favoritos
Criar novo
Salvar
Design de camiseta psd de gato Mystic Sphynx
Pronto para imprimir
para Merch
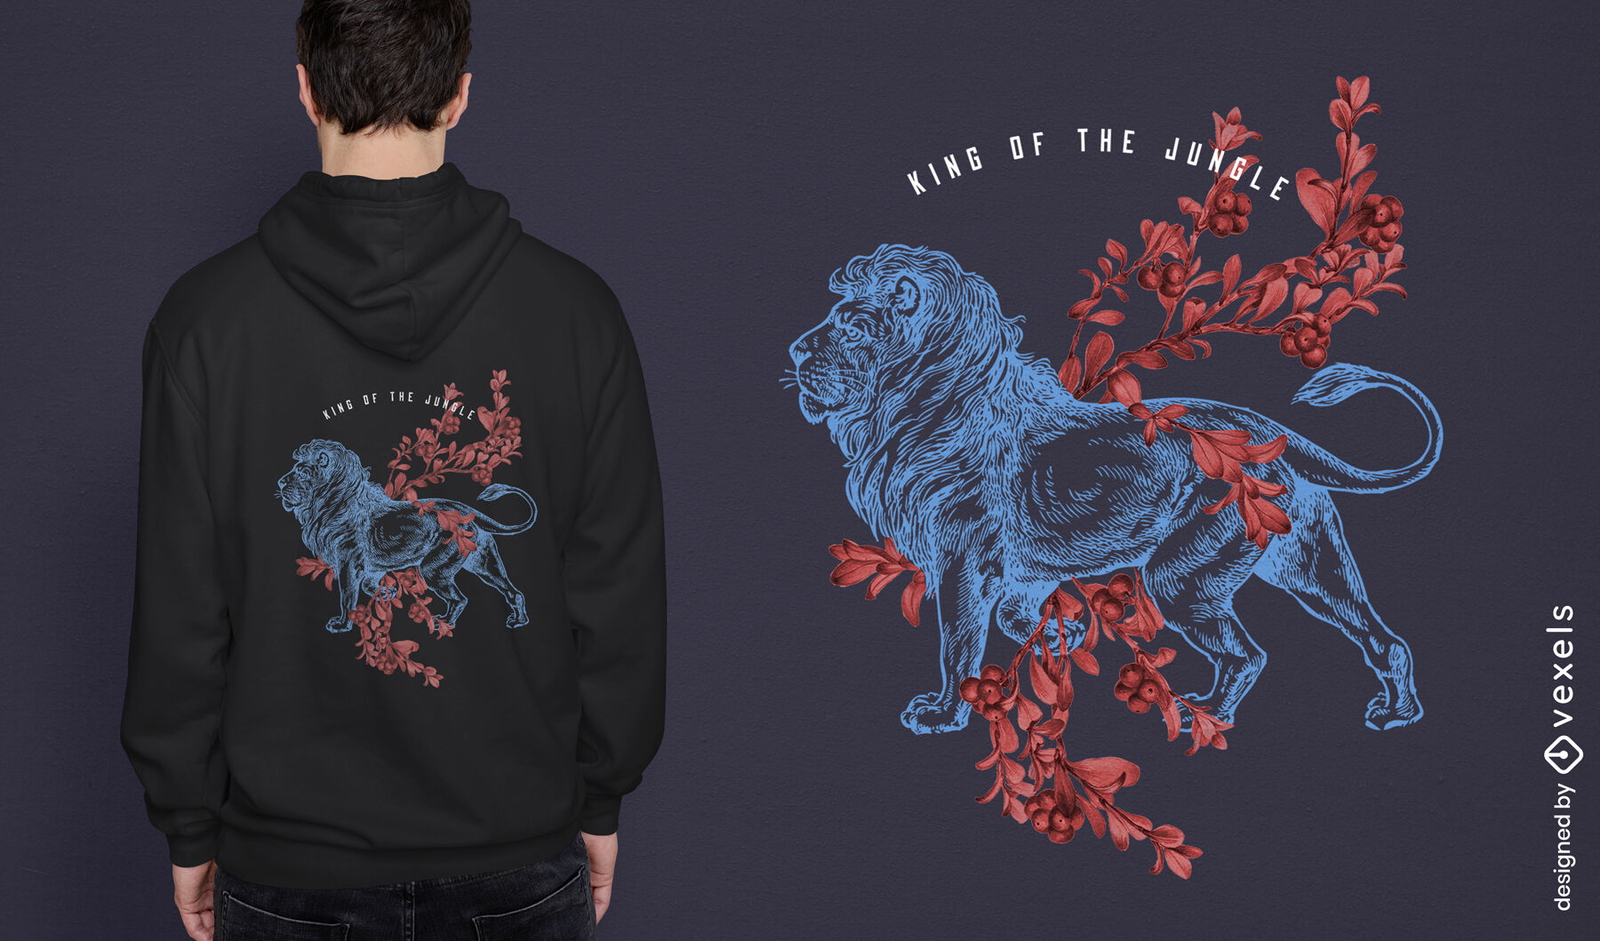
Design de camiseta desenhada à mão de animais selvagens de leão
Escolha uma pasta
Todos os favoritos
Criar novo
Salvar
Design de camiseta desenhada à mão de animais selvagens de leão
Pronto para imprimir
para Merch
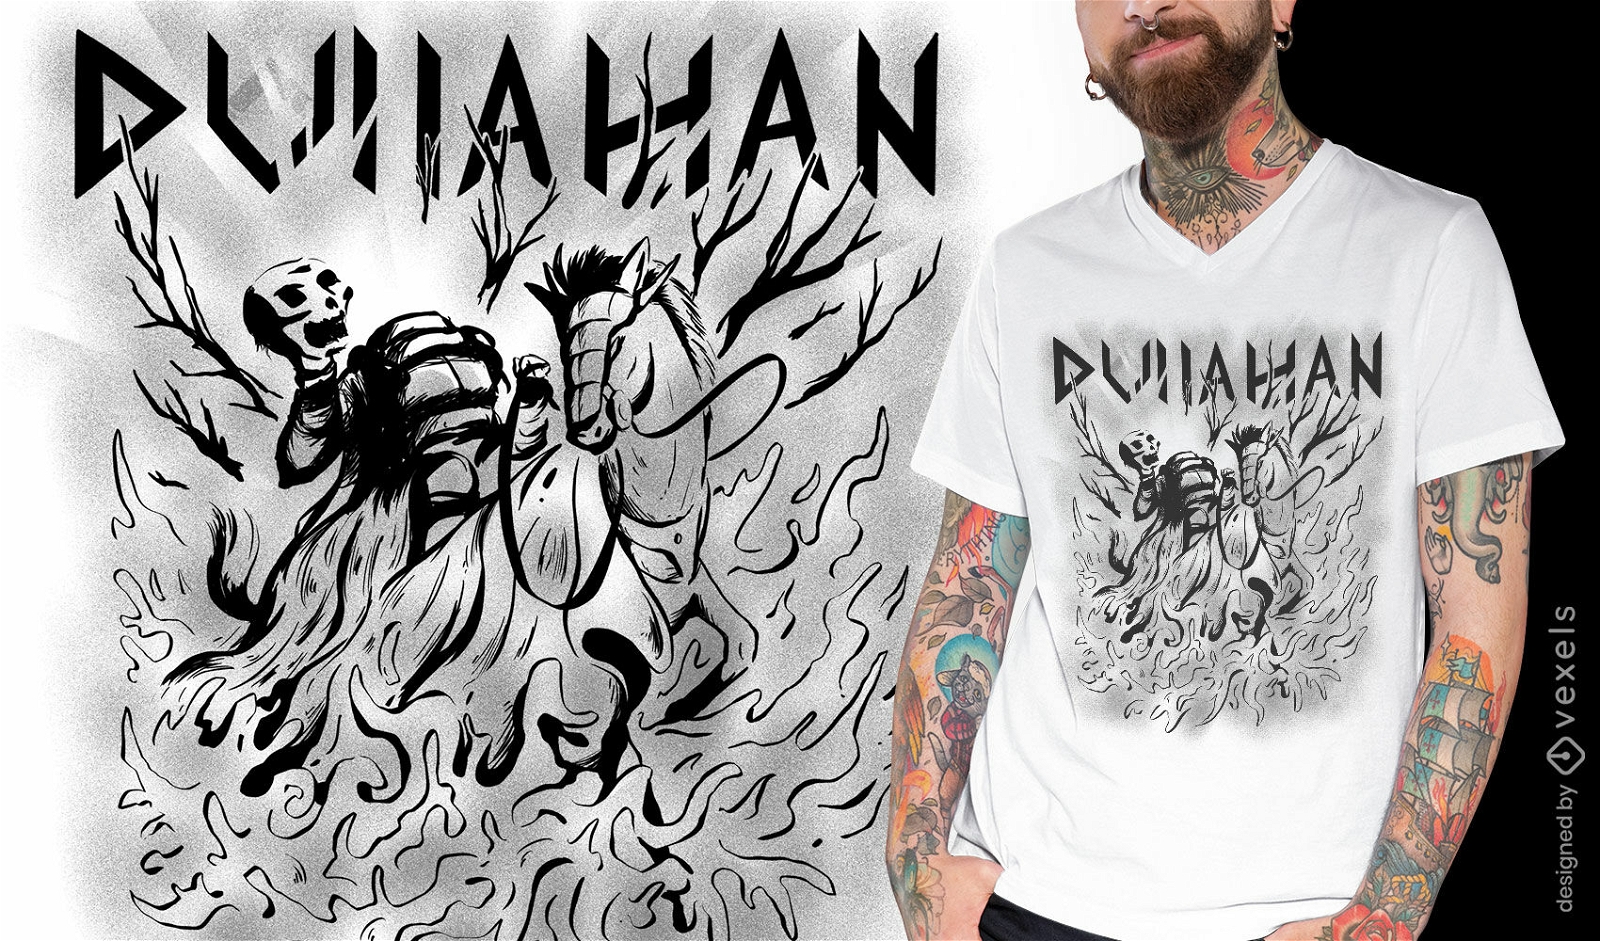
Design de camiseta de mitologia de criatura celta
Escolha uma pasta
Todos os favoritos
Criar novo
Salvar
Design de camiseta de mitologia de criatura celta
Pronto para imprimir
para Merch
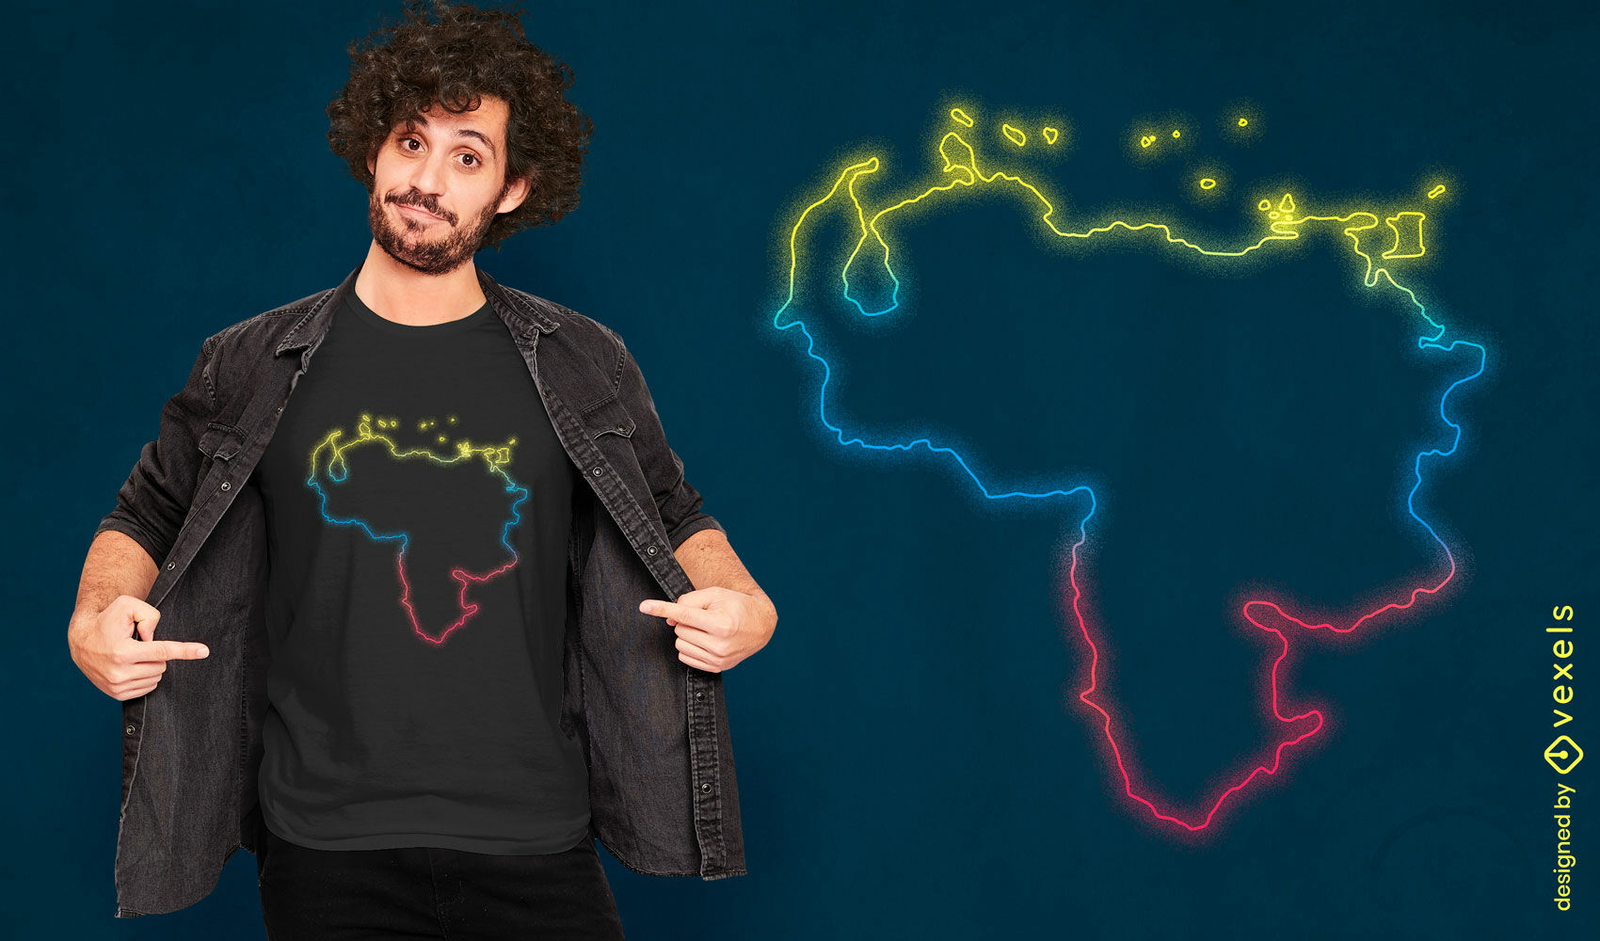
Design de camiseta de mapa de néon venezuelano
Escolha uma pasta
Todos os favoritos
Criar novo
Salvar
Design de camiseta de mapa de néon venezuelano
texto editável
Pronto para imprimir
para Merch
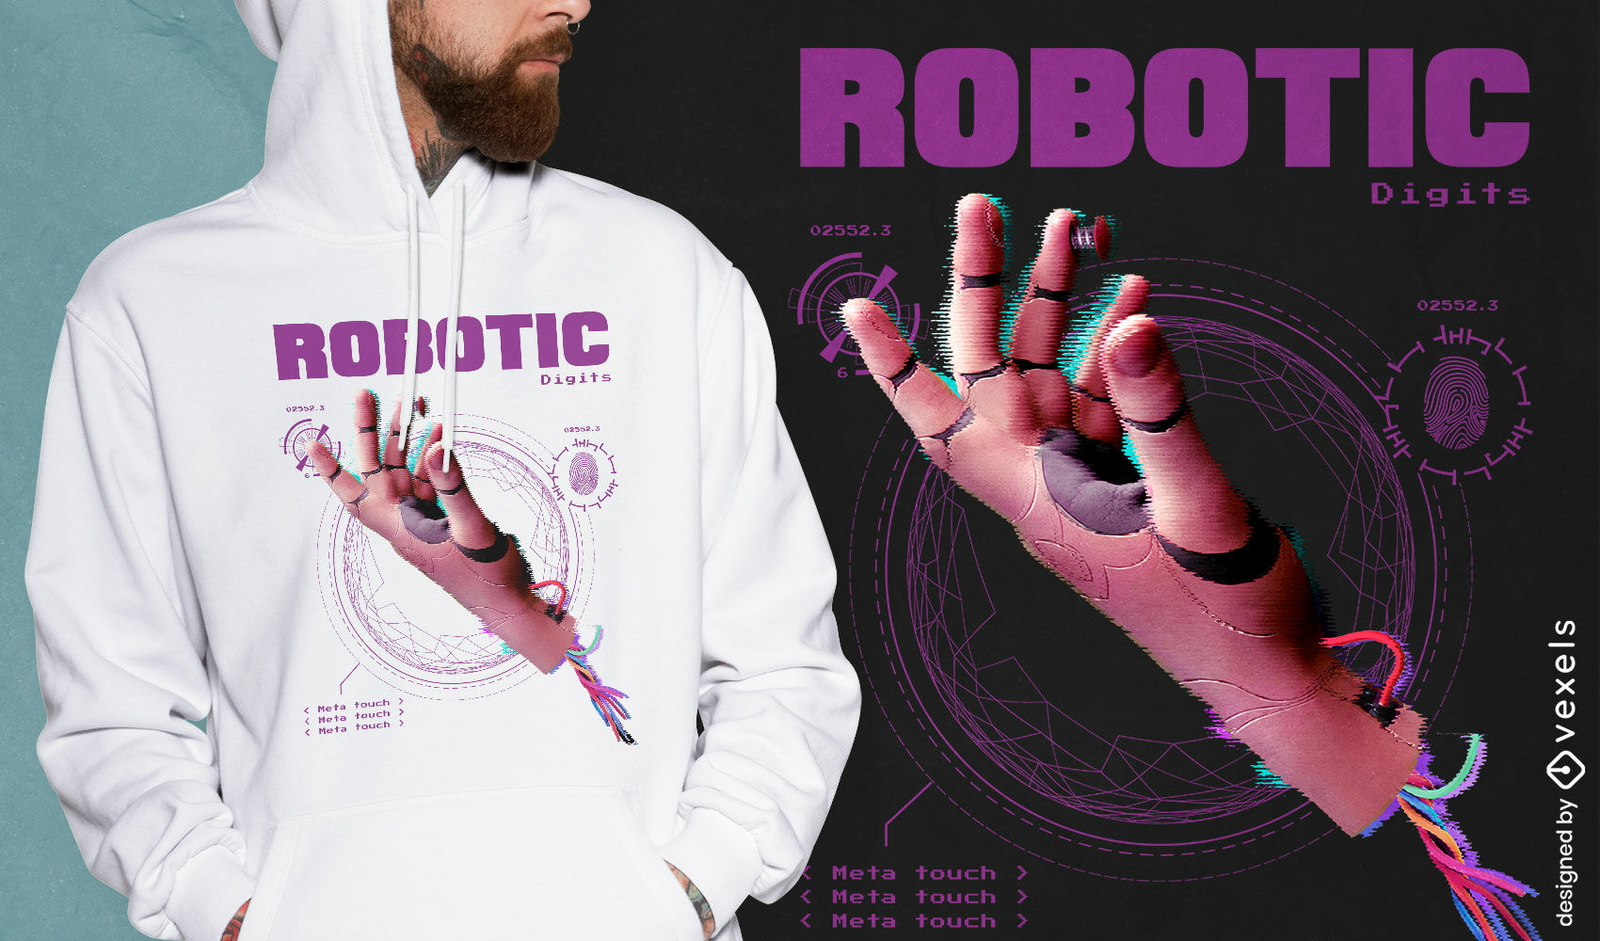
Design de camiseta de mão robótica
Escolha uma pasta
Todos os favoritos
Criar novo
Salvar
Design de camiseta de mão robótica
Pronto para imprimir
para Merch
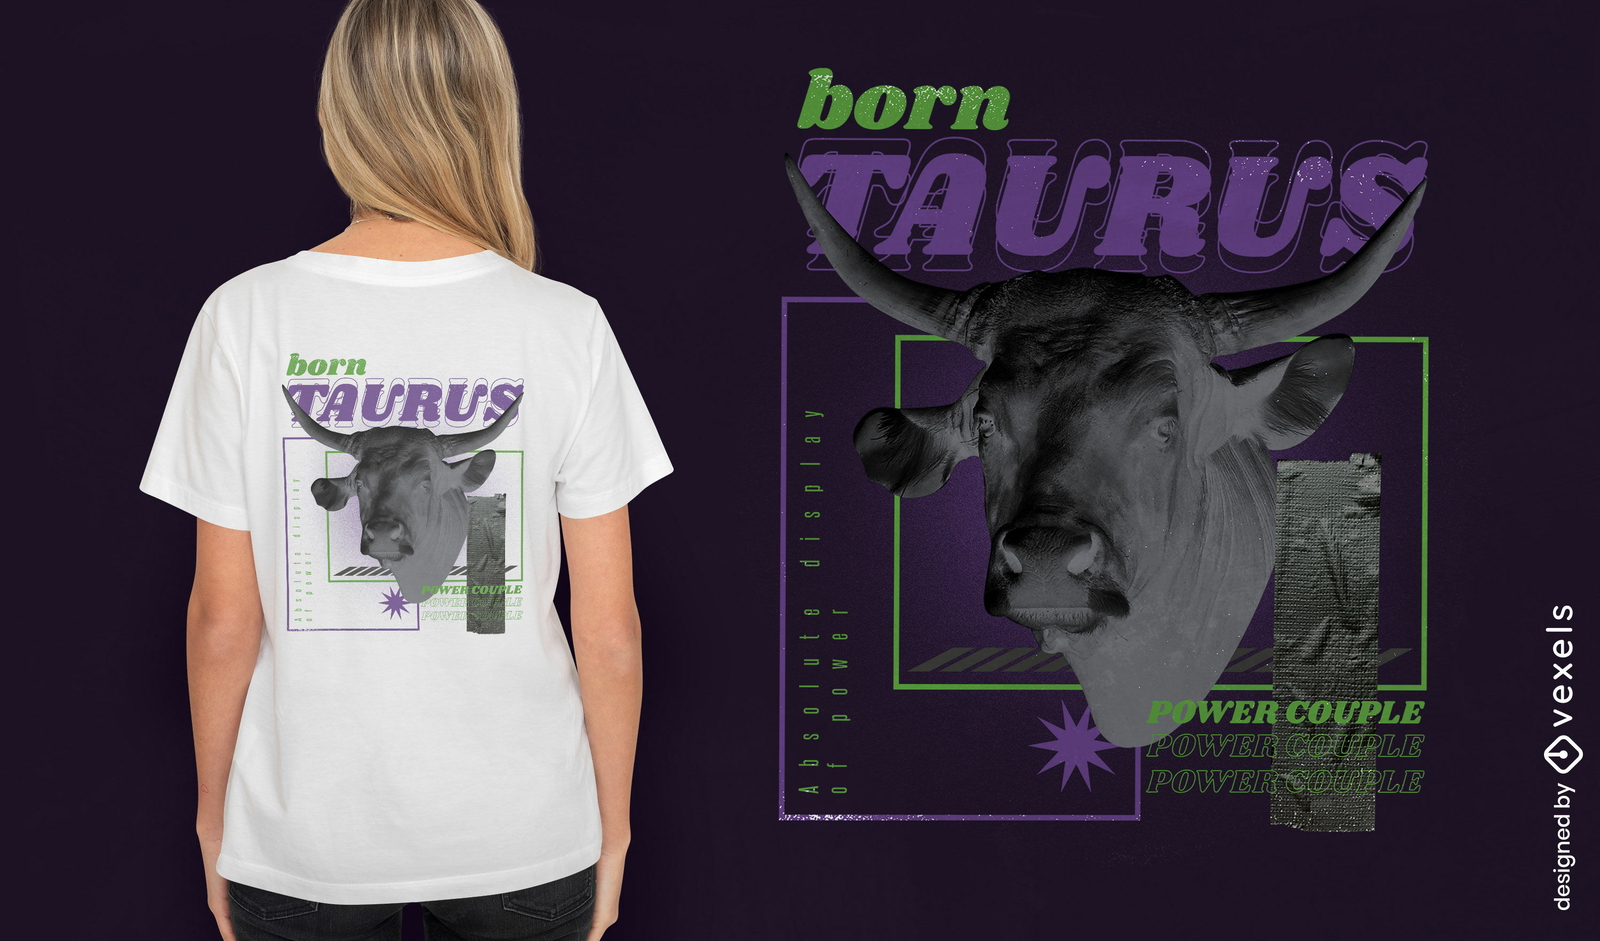
T-shirt animal touro horóscopo touro psd
Escolha uma pasta
Todos os favoritos
Criar novo
Salvar
T-shirt animal touro horóscopo touro psd
Pronto para imprimir
para Merch
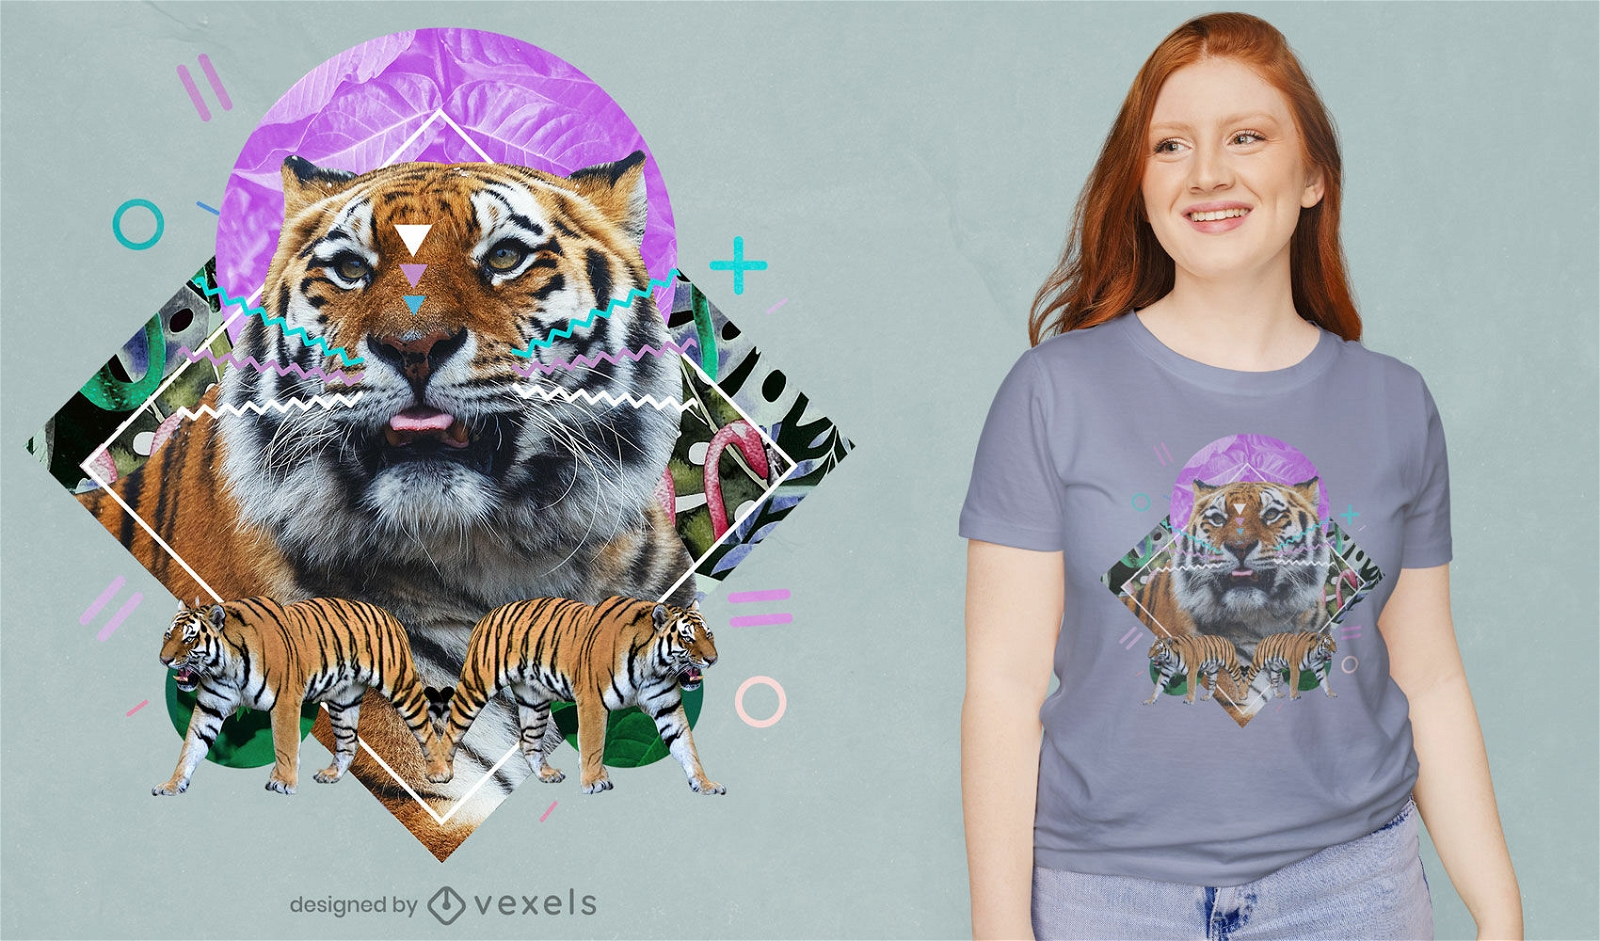
Camiseta de colagem de animal selvagem tigre psd
Escolha uma pasta
Todos os favoritos
Criar novo
Salvar
Camiseta de colagem de animal selvagem tigre psd
Pronto para imprimir
para Merch
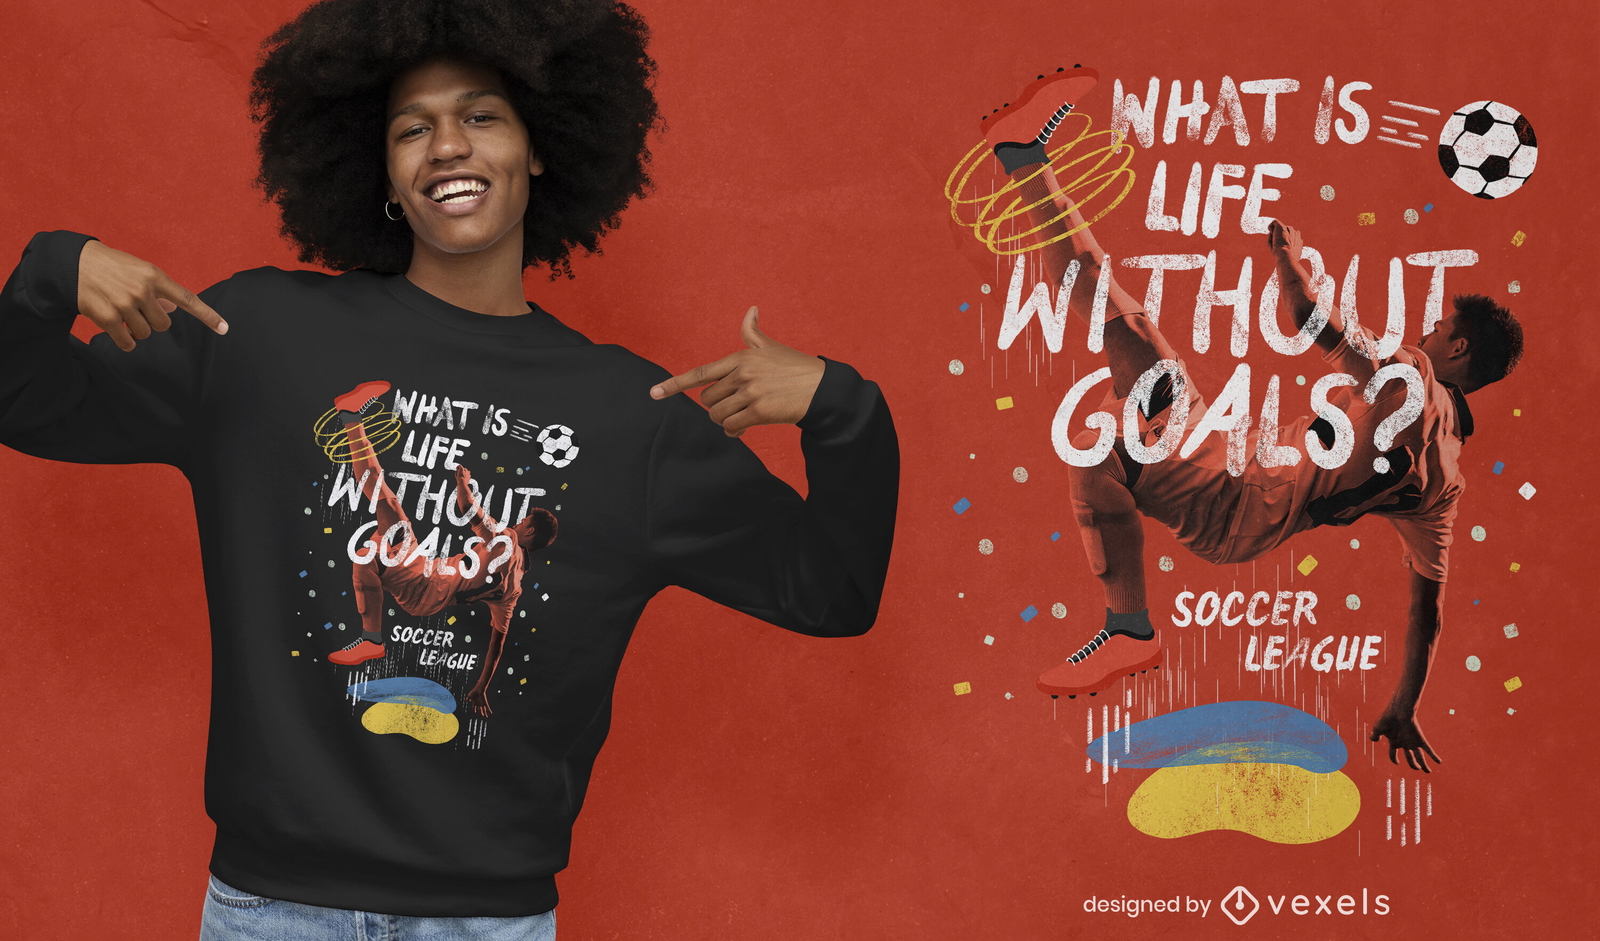
Citação de colagem fotográfica de futebol design de camiseta psd
Escolha uma pasta
Todos os favoritos
Criar novo
Salvar
Citação de colagem fotográfica de futebol design de camiseta psd
Pronto para imprimir
para Merch
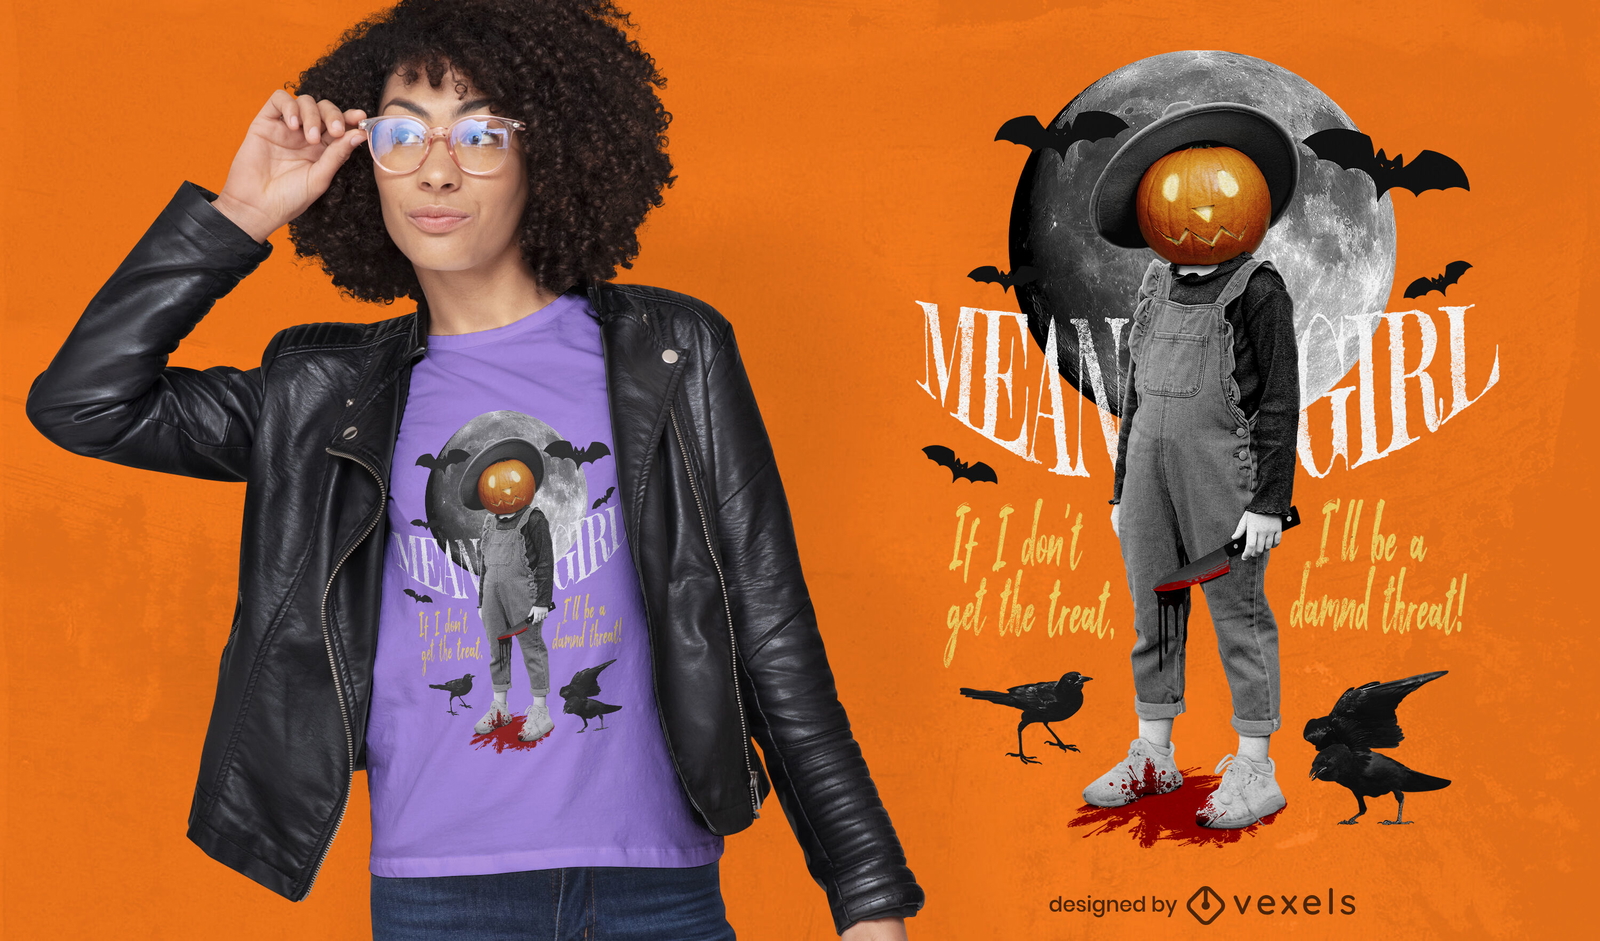
T-shirt de colagem homem abóbora de Halloween psd
Escolha uma pasta
Todos os favoritos
Criar novo
Salvar
T-shirt de colagem homem abóbora de Halloween psd
PSD Camisetas
para Merch
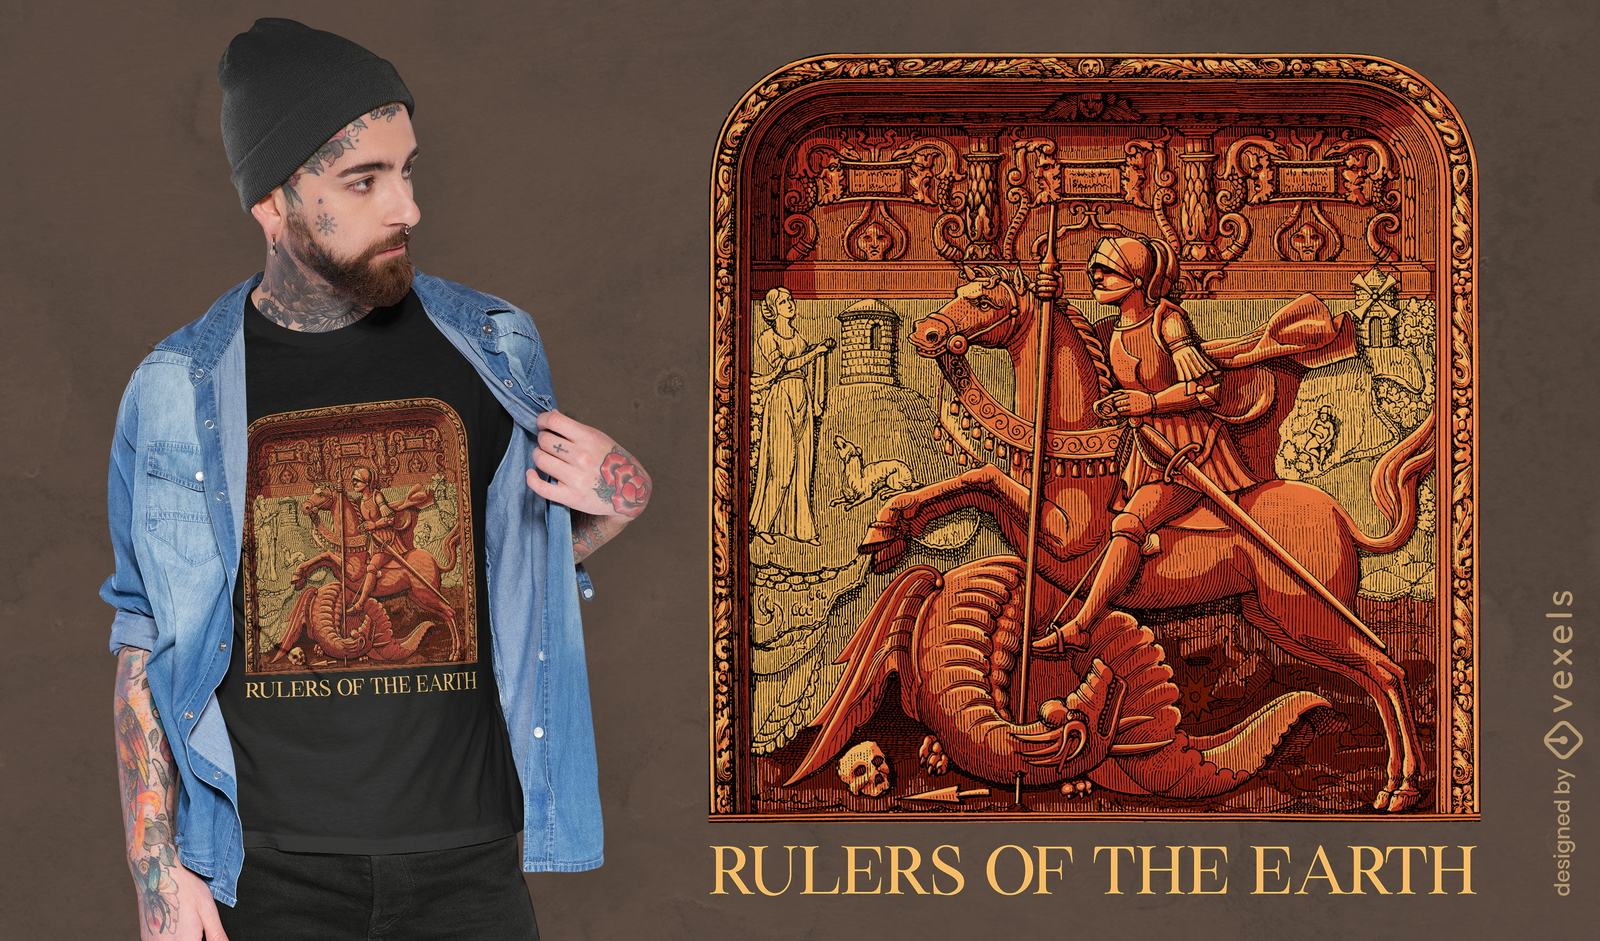
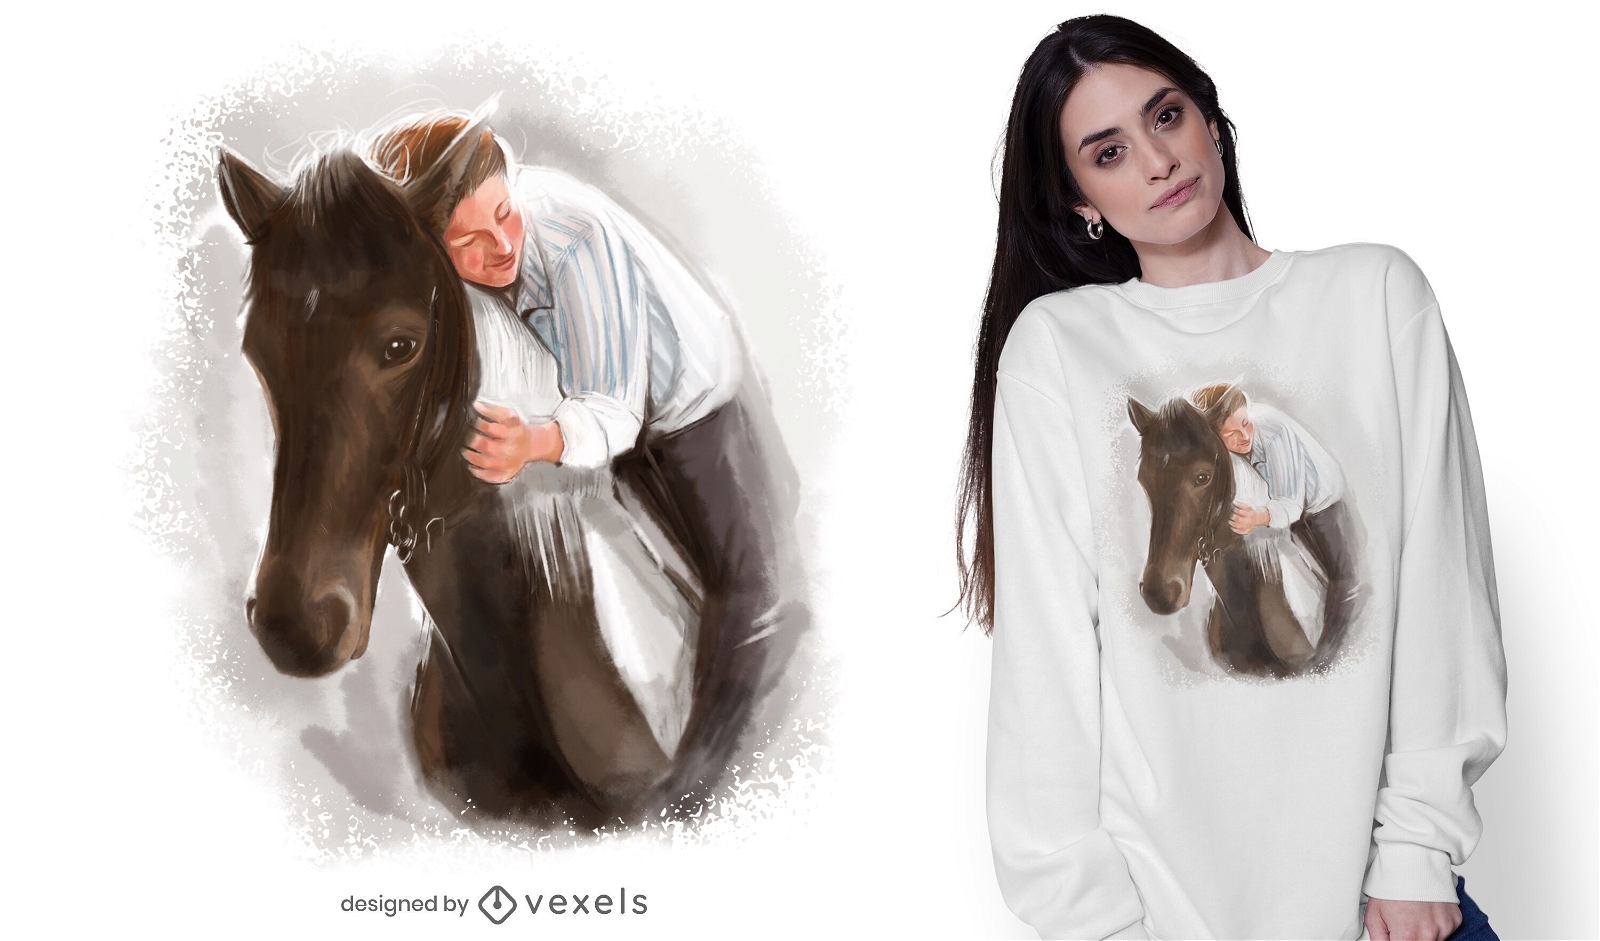
Design de camisetas de homem e cavalo
Escolha uma pasta
Todos os favoritos
Criar novo
Salvar
Design de camisetas de homem e cavalo
Camiseta PSD escalável
para Merch
T-shirt escalável Mosaic psd
Escolha uma pasta
Todos os favoritos
Criar novo
Salvar
T-shirt escalável Mosaic psd
Camiseta PSD escalável
para Merch
T-shirt escalável de cores invertidas psd
Escolha uma pasta
Todos os favoritos
Criar novo
Salvar
T-shirt escalável de cores invertidas psd
Camiseta PSD escalável
para Merch
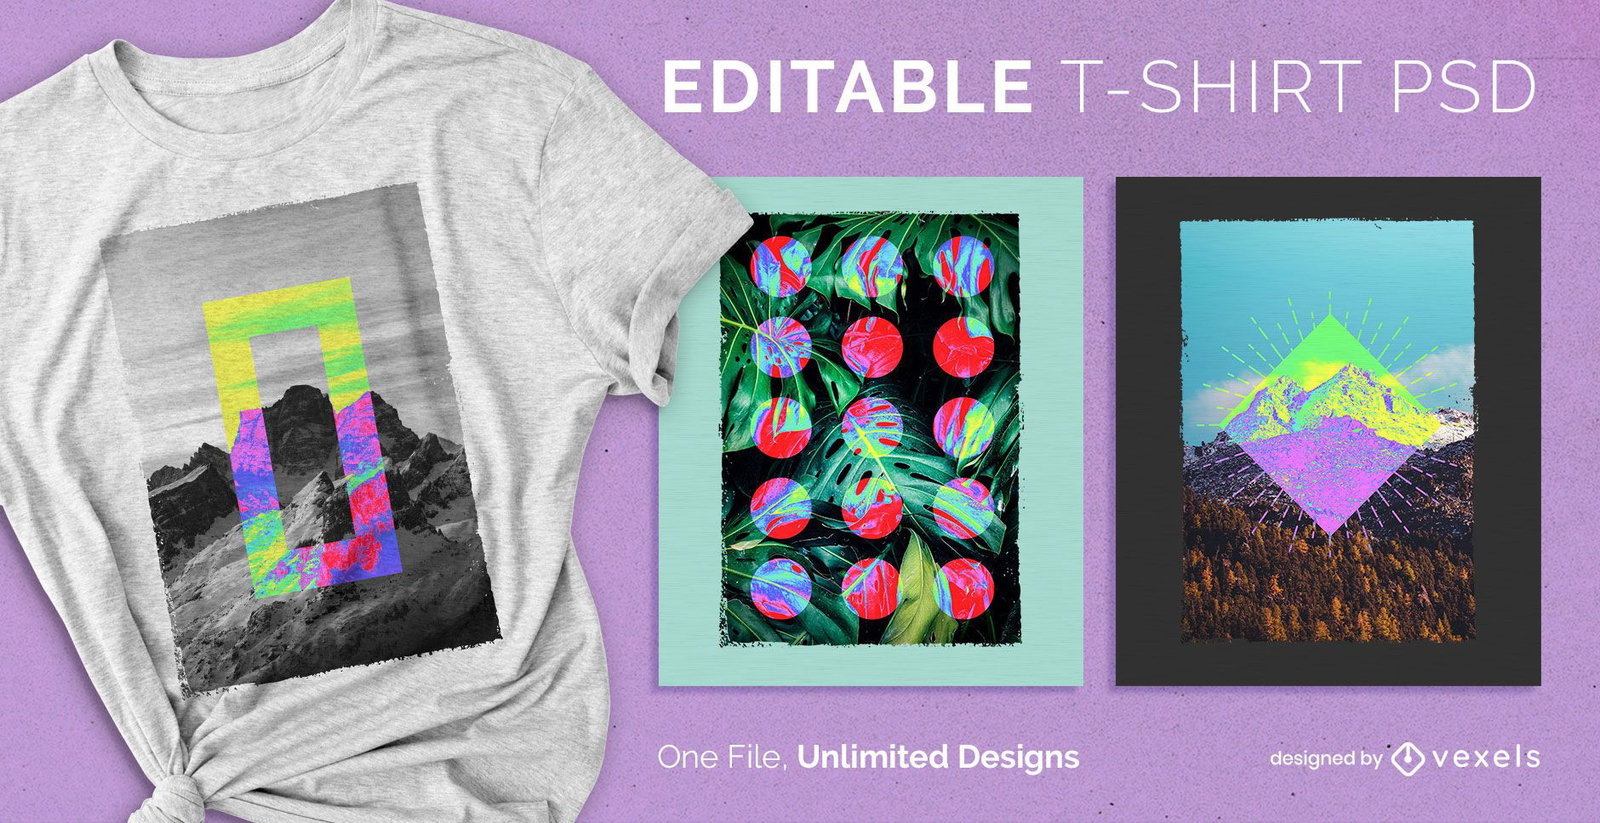
Camiseta escalável geométrica psd
Escolha uma pasta
Todos os favoritos
Criar novo
Salvar
Camiseta escalável geométrica psd
Camiseta PSD escalável
para Merch
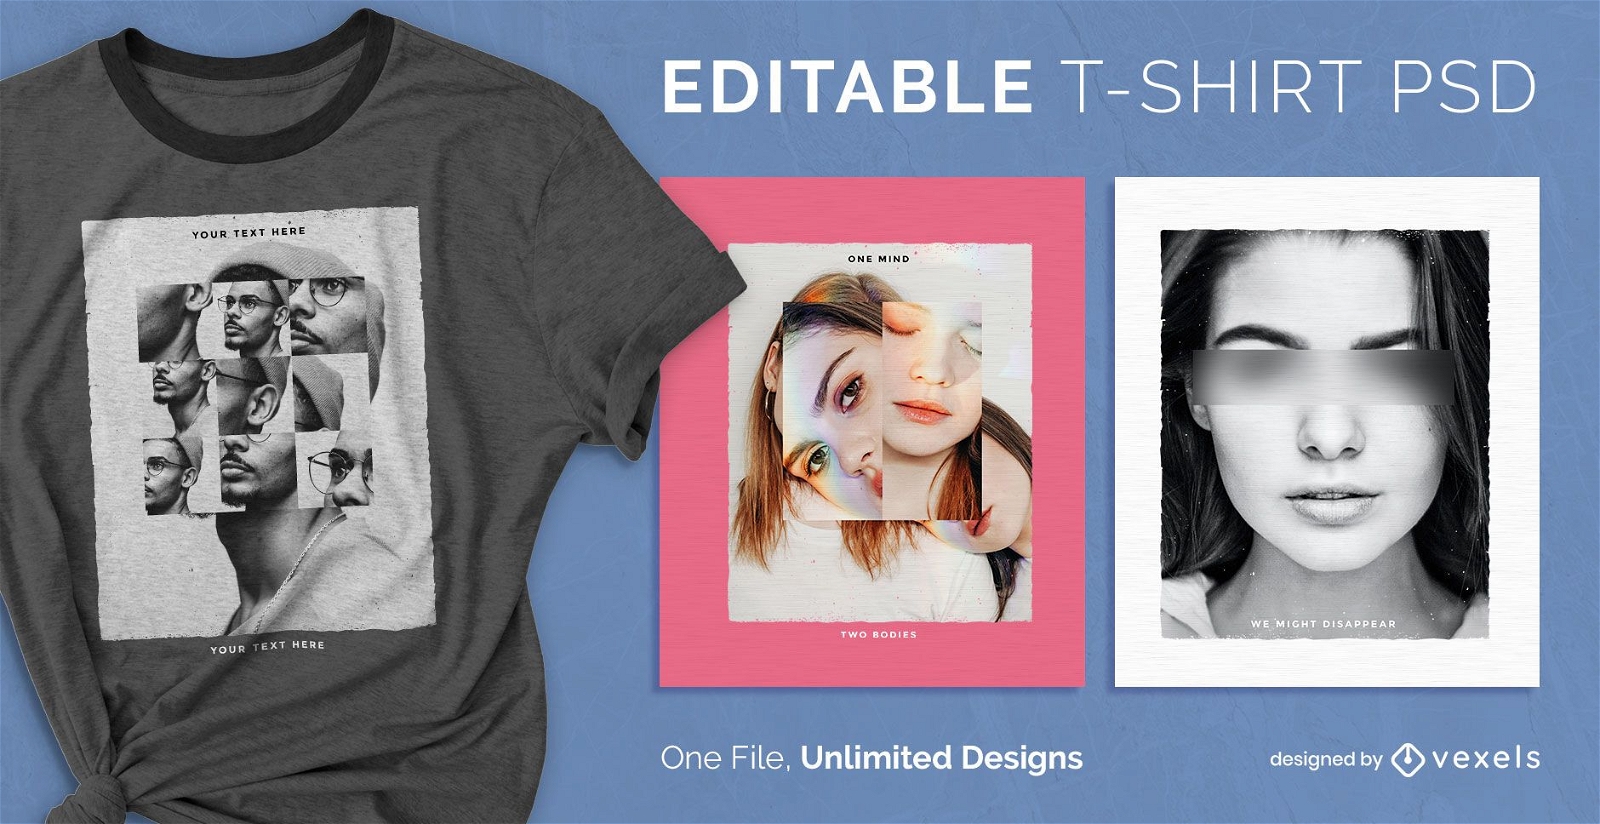
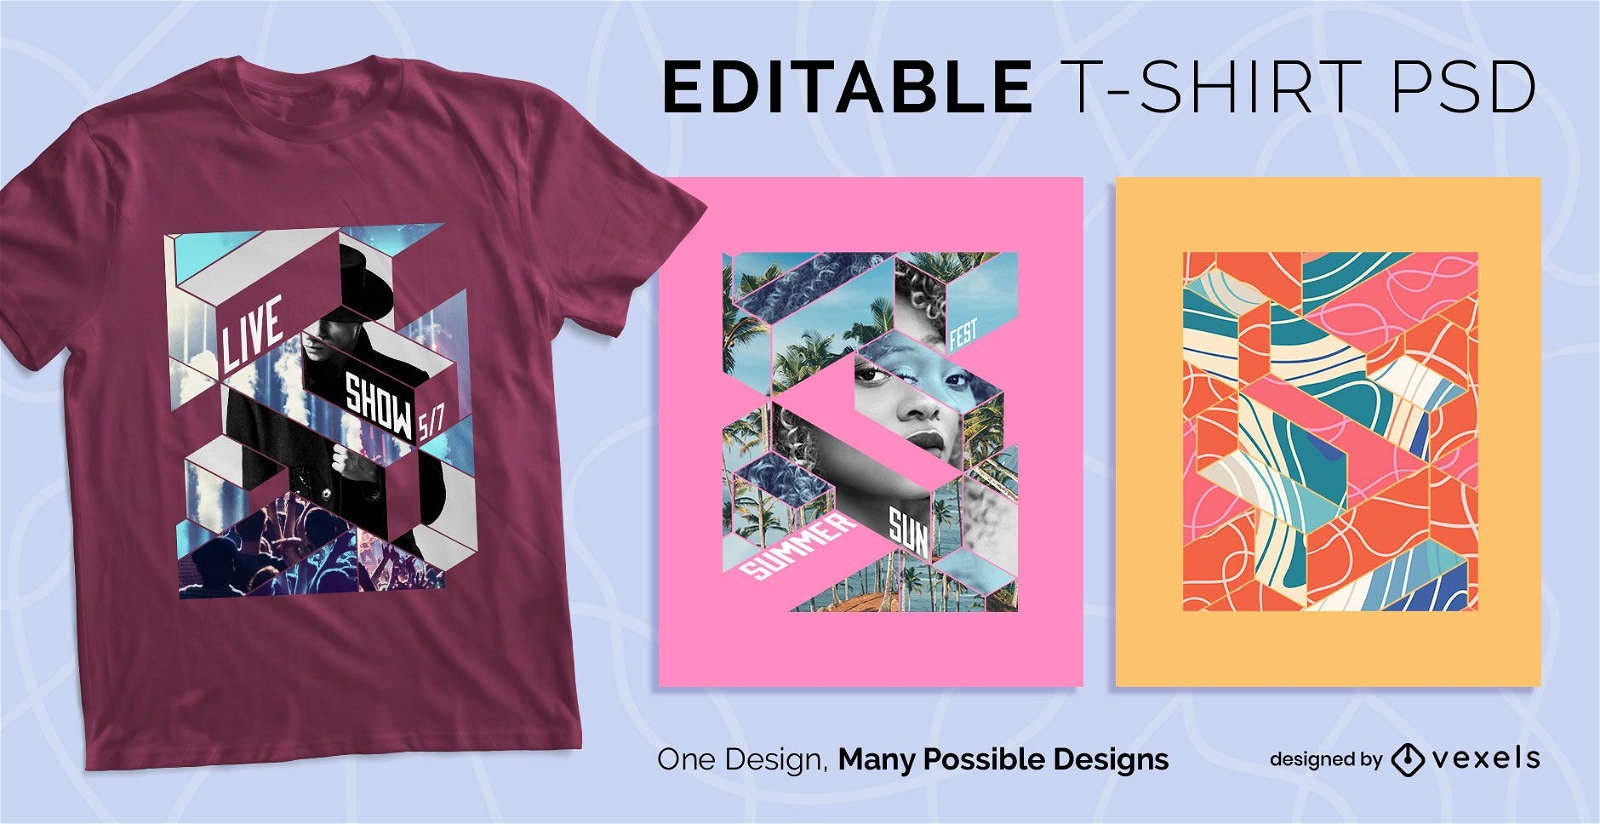
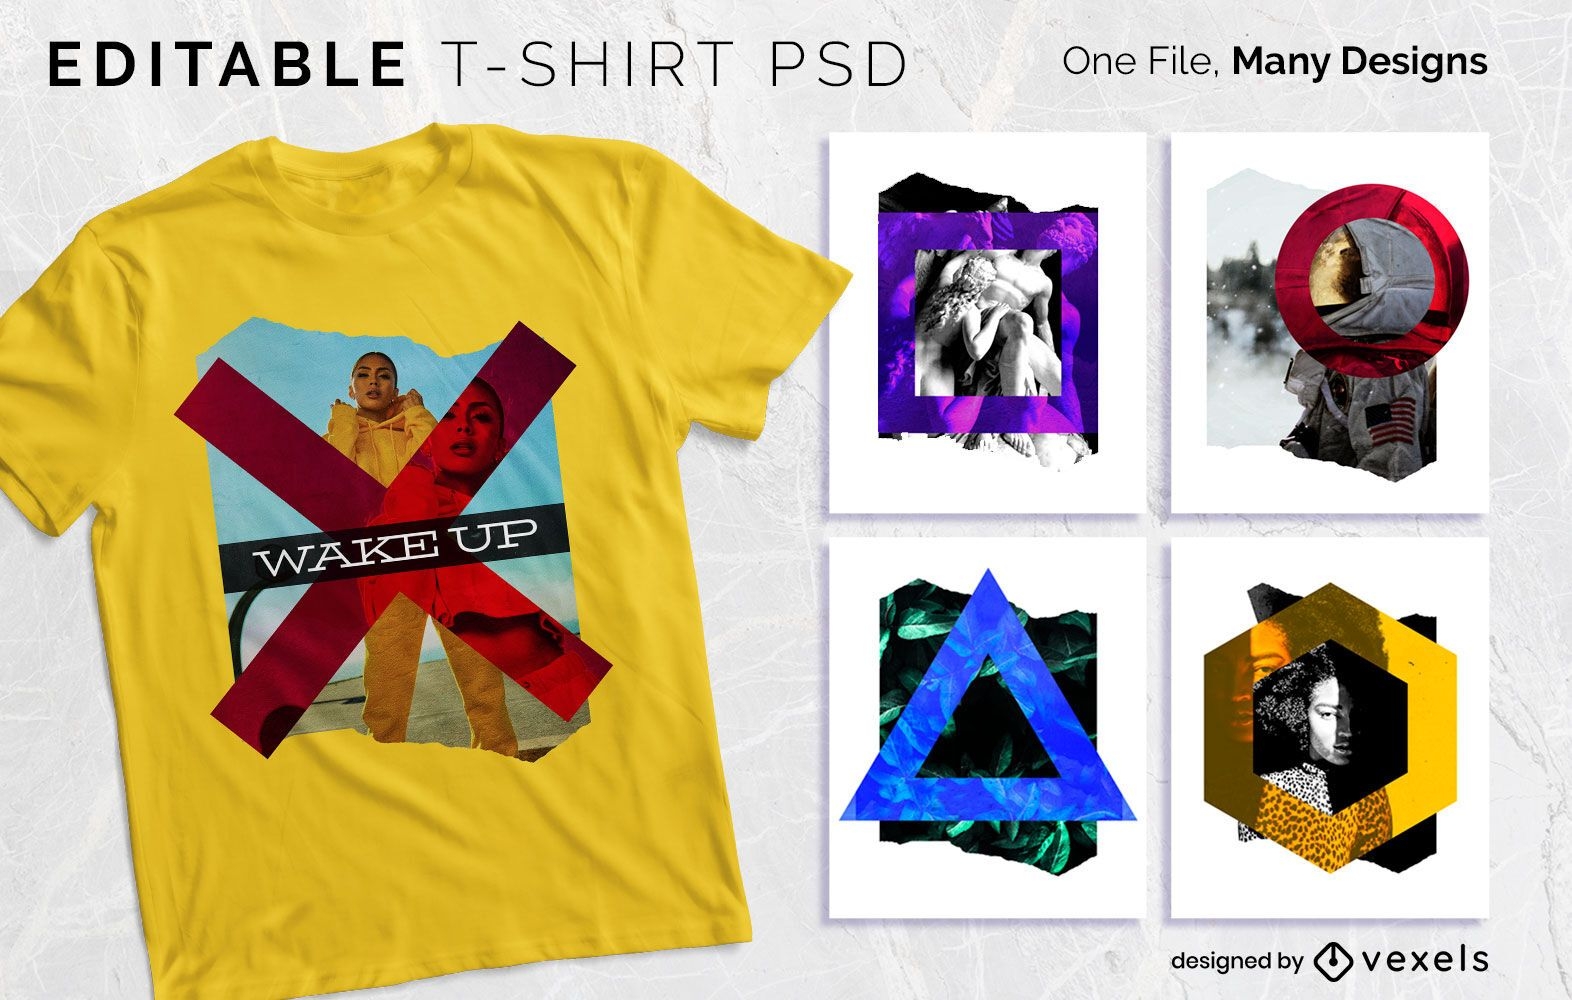
Design PSD de camiseta com colagem de formas
Escolha uma pasta
Todos os favoritos
Criar novo
Salvar
Design PSD de camiseta com colagem de formas
Pronto para imprimir
para Merch
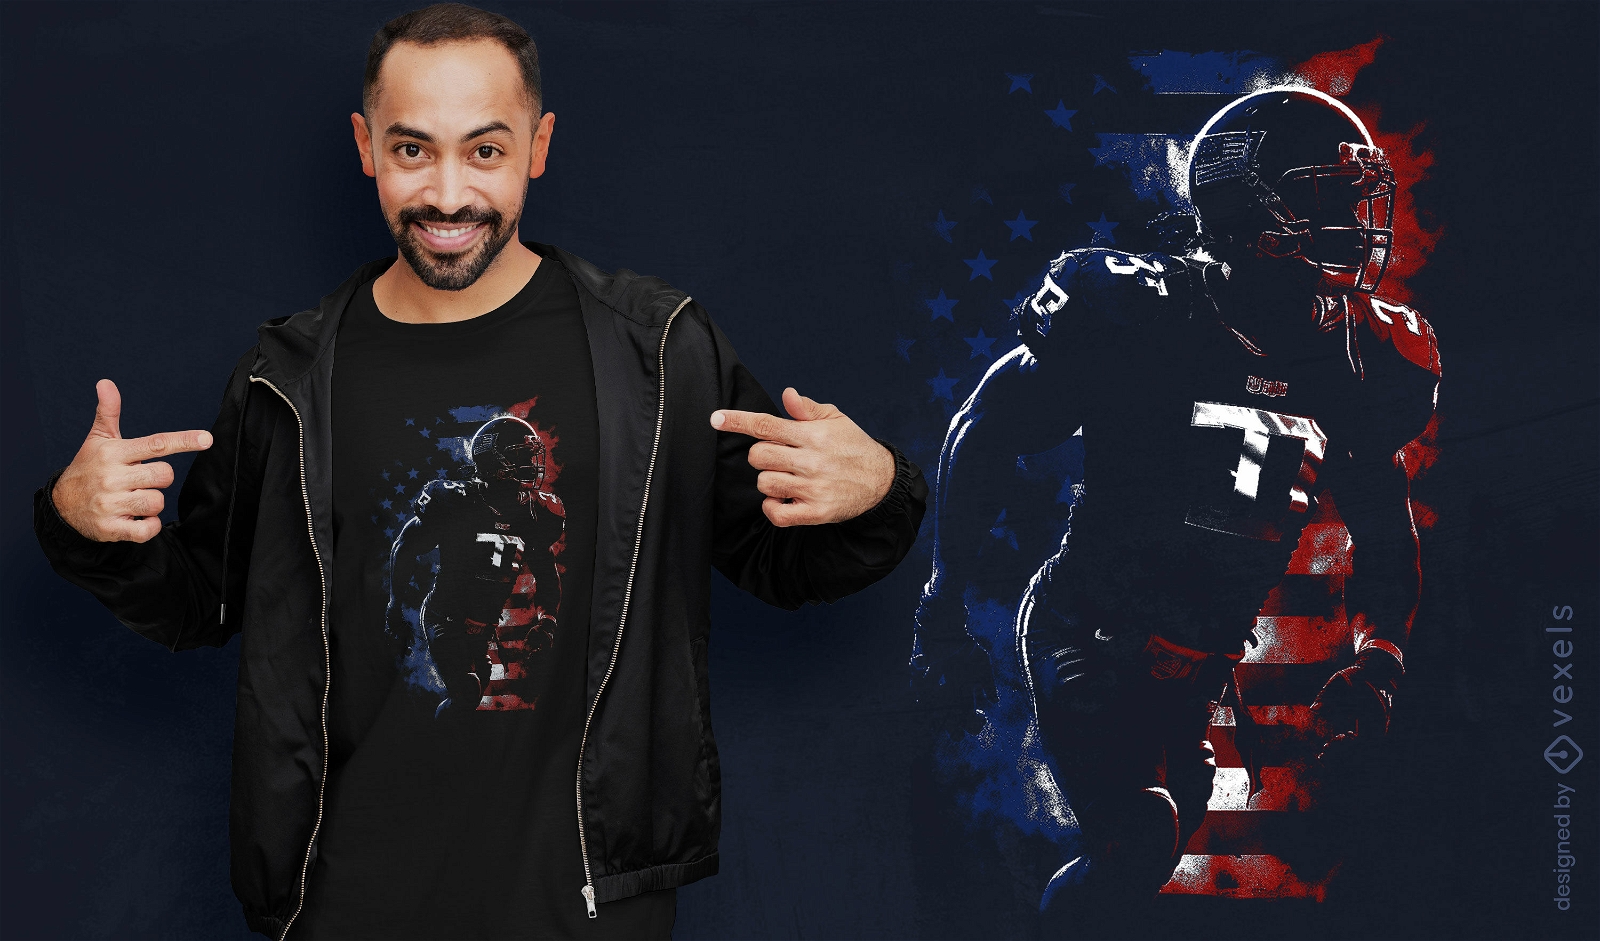
Design de camiseta com bandeira de jogador de futebol americano
Escolha uma pasta
Todos os favoritos
Criar novo
Salvar
Design de camiseta com bandeira de jogador de futebol americano
texto editável
Pronto para imprimir
para Merch
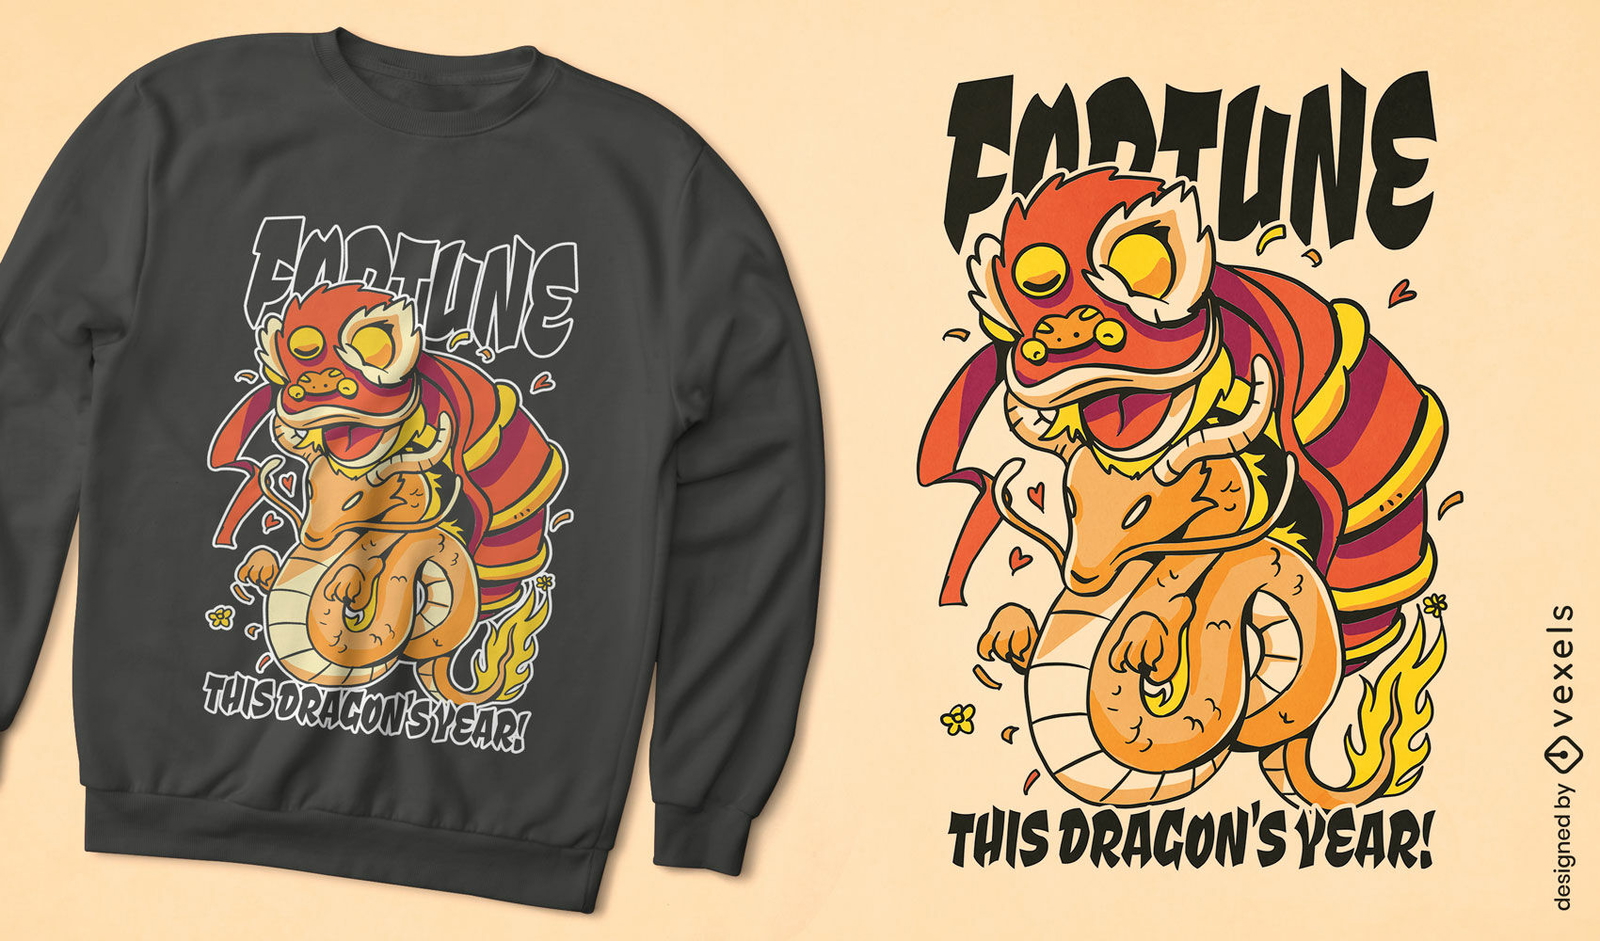
Design de camiseta do ano do drag?o chin?s
Escolha uma pasta
Todos os favoritos
Criar novo
Salvar
Design de camiseta do ano do drag?o chin?s
Pronto para imprimir
para Merch
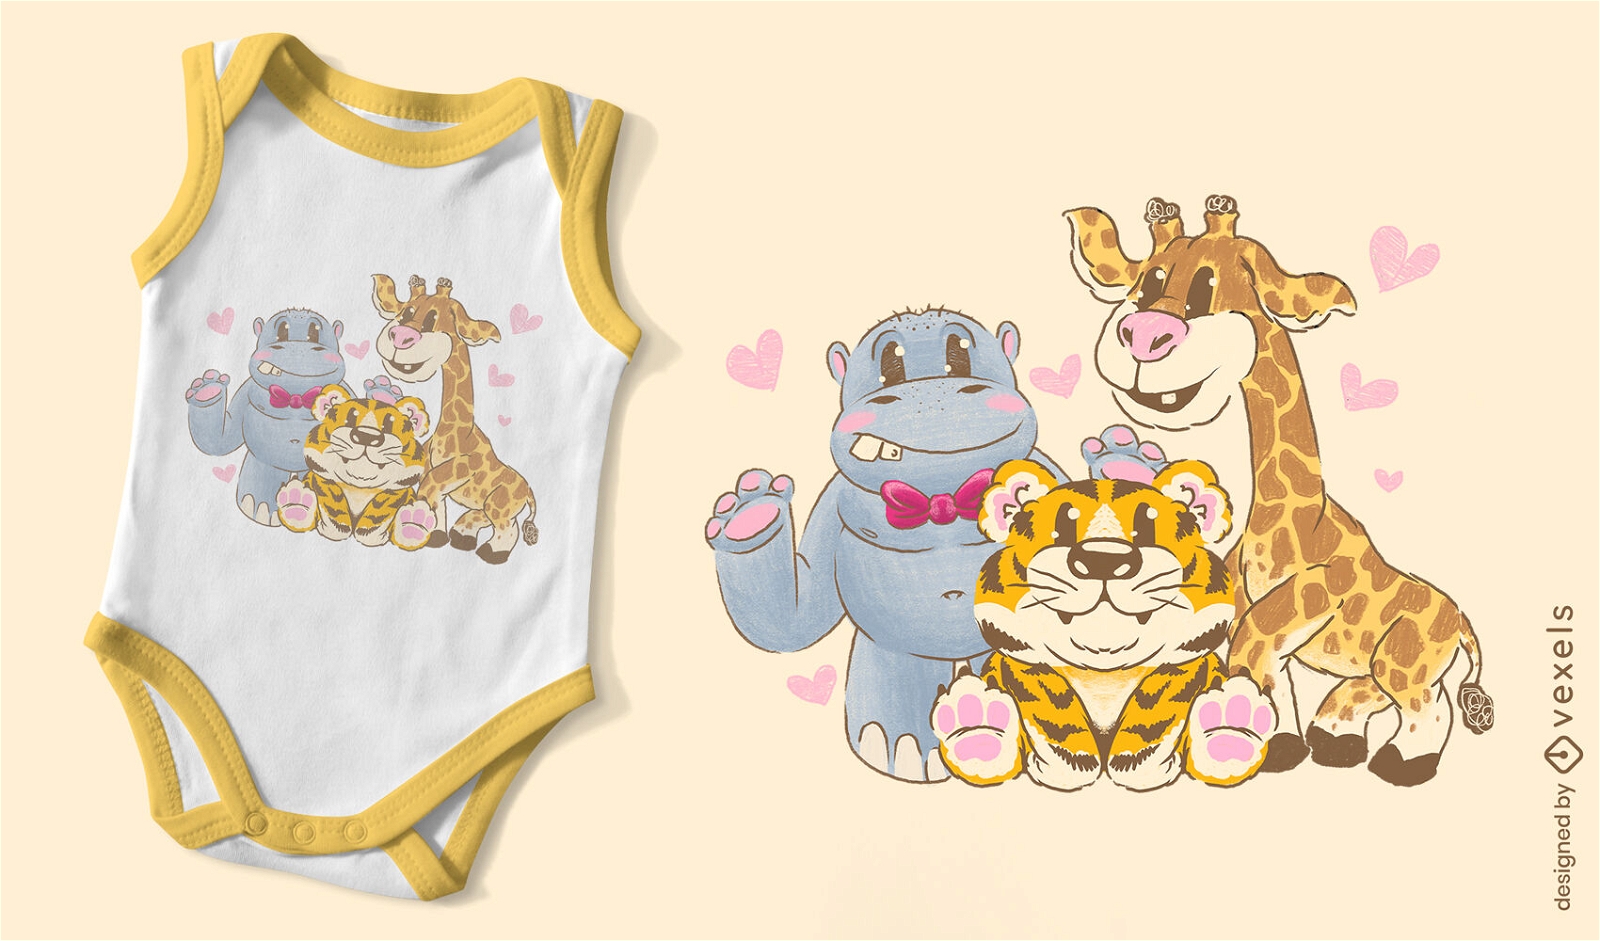
Design de camiseta de desenho animado de animais fofos
Escolha uma pasta
Todos os favoritos
Criar novo
Salvar
Design de camiseta de desenho animado de animais fofos
texto editável
para Merch
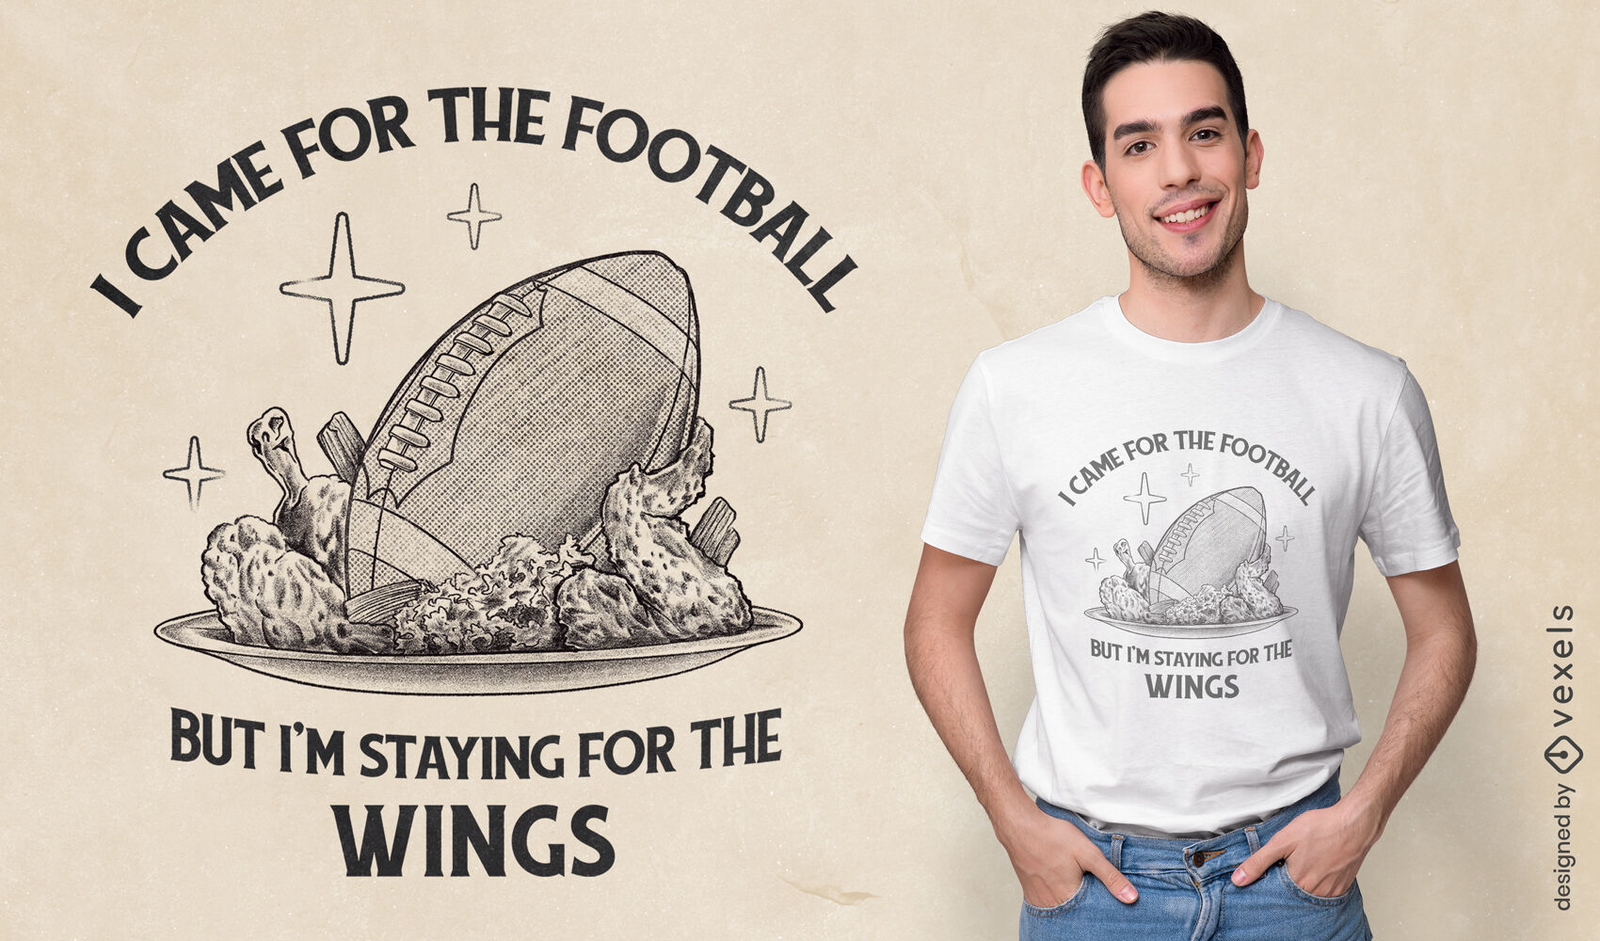
Design de camiseta com citação de asas de frango de futebol
Escolha uma pasta
Todos os favoritos
Criar novo
Salvar
Design de camiseta com citação de asas de frango de futebol
Pronto para imprimir
para Merch
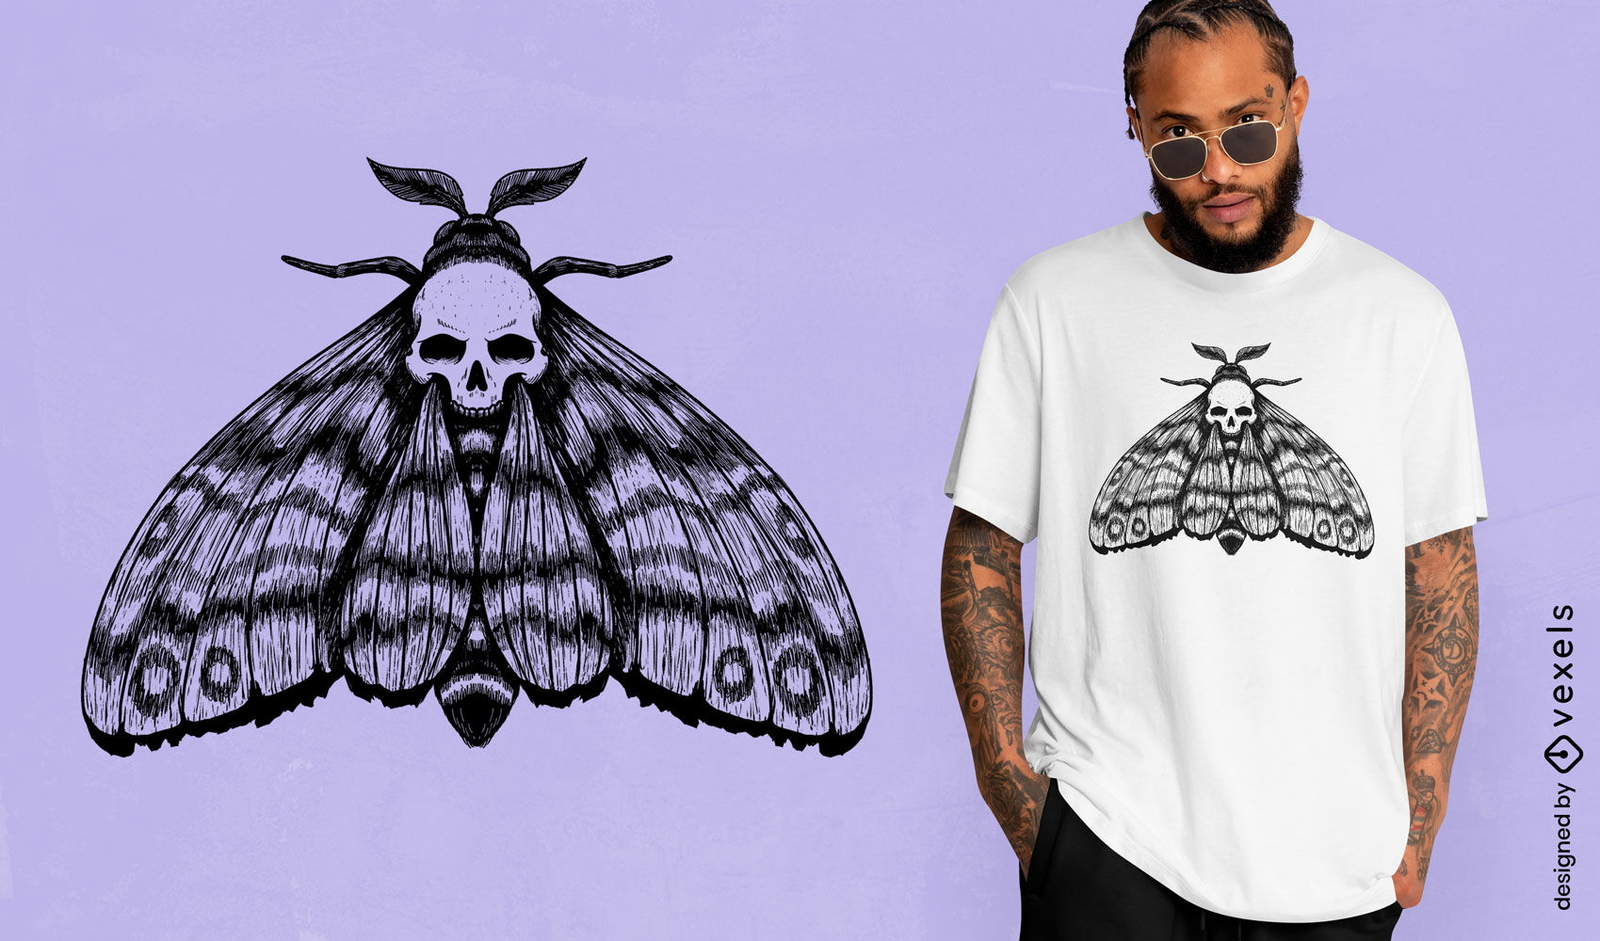
Design de camiseta com ilustração de caveira de mariposa
Escolha uma pasta
Todos os favoritos
Criar novo
Salvar
Design de camiseta com ilustração de caveira de mariposa
Pronto para imprimir
para Merch
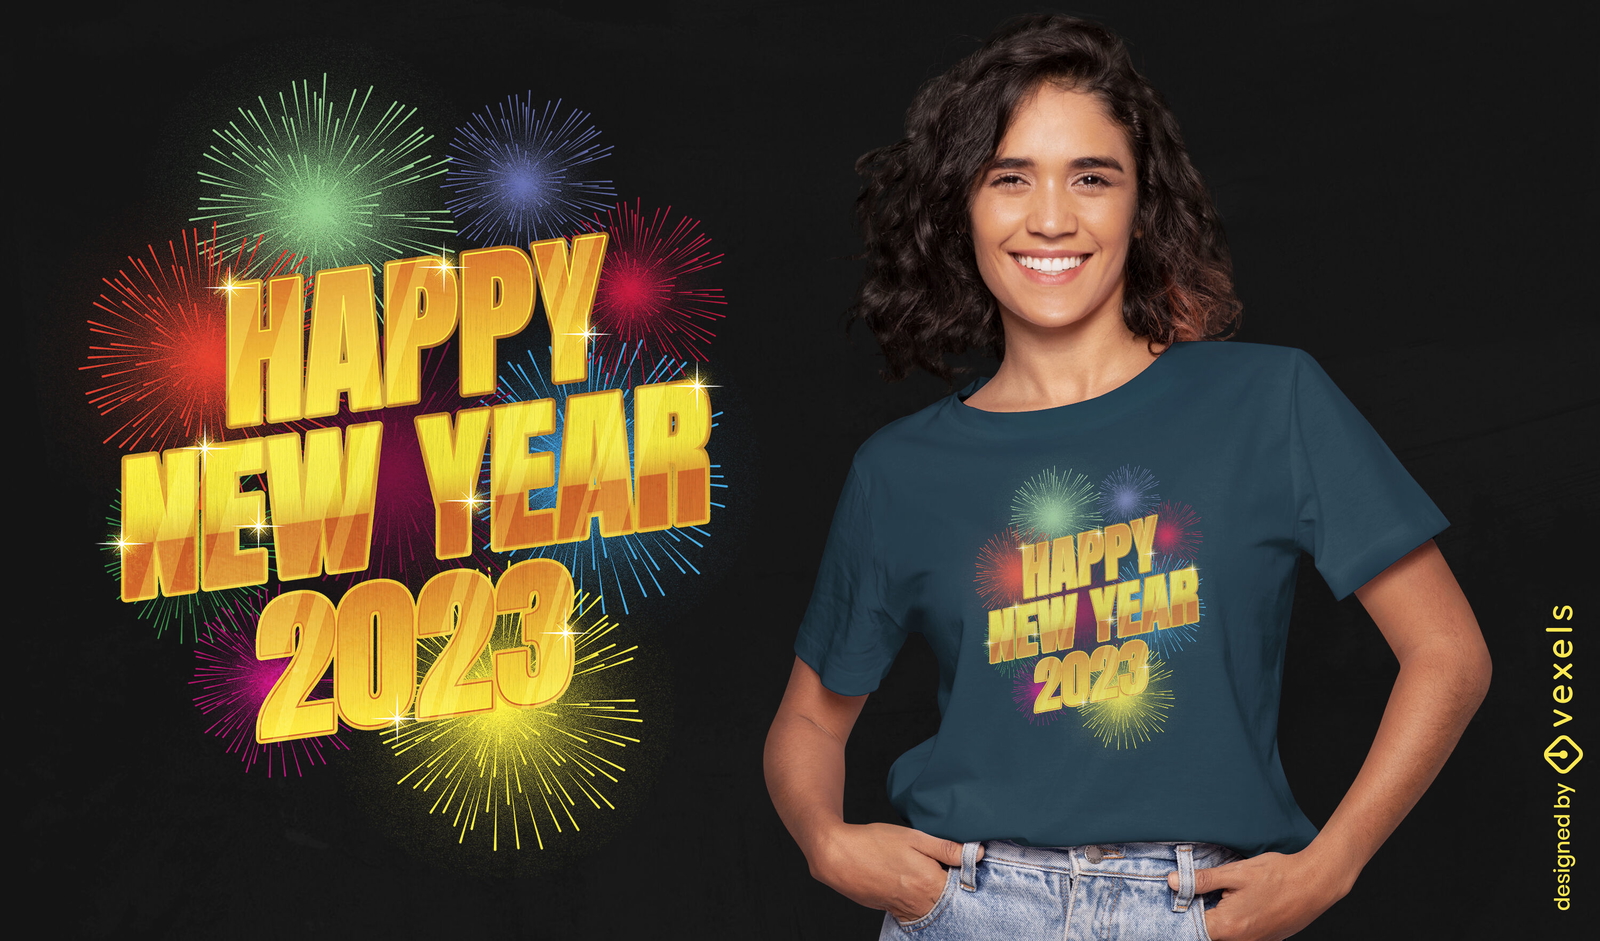
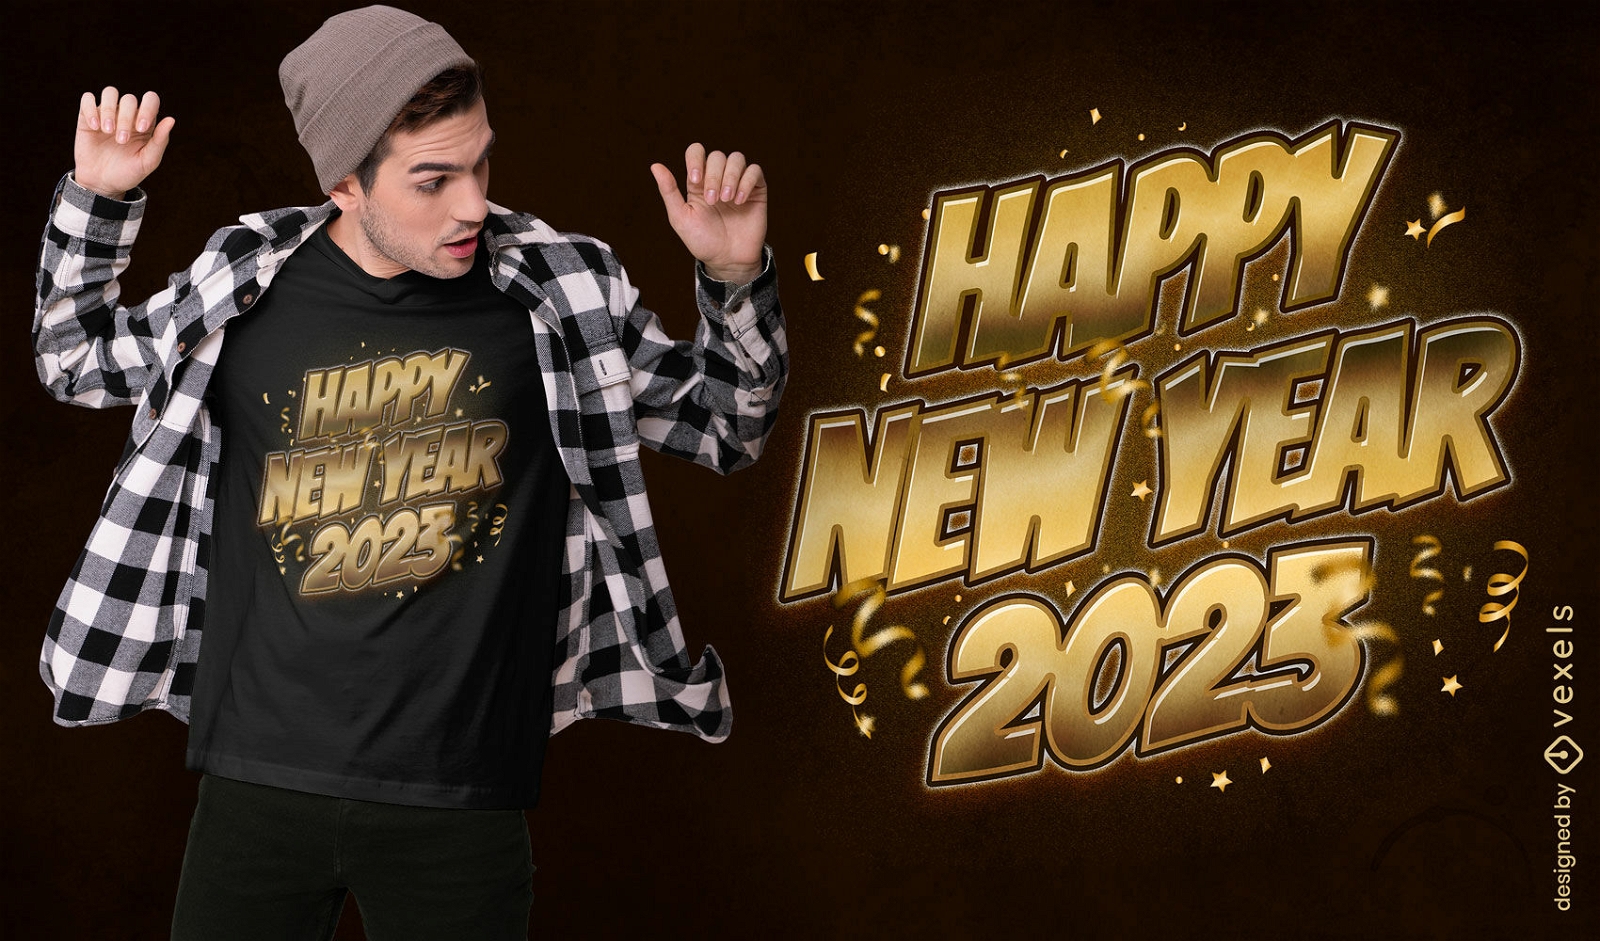
Feliz ano novo 2023 design de camiseta dourada
Escolha uma pasta
Todos os favoritos
Criar novo
Salvar
Feliz ano novo 2023 design de camiseta dourada
Pronto para imprimir
para Merch
Design de camiseta com doodle de caveira de cabra
Escolha uma pasta
Todos os favoritos
Criar novo
Salvar
Design de camiseta com doodle de caveira de cabra
Pronto para imprimir
para Merch
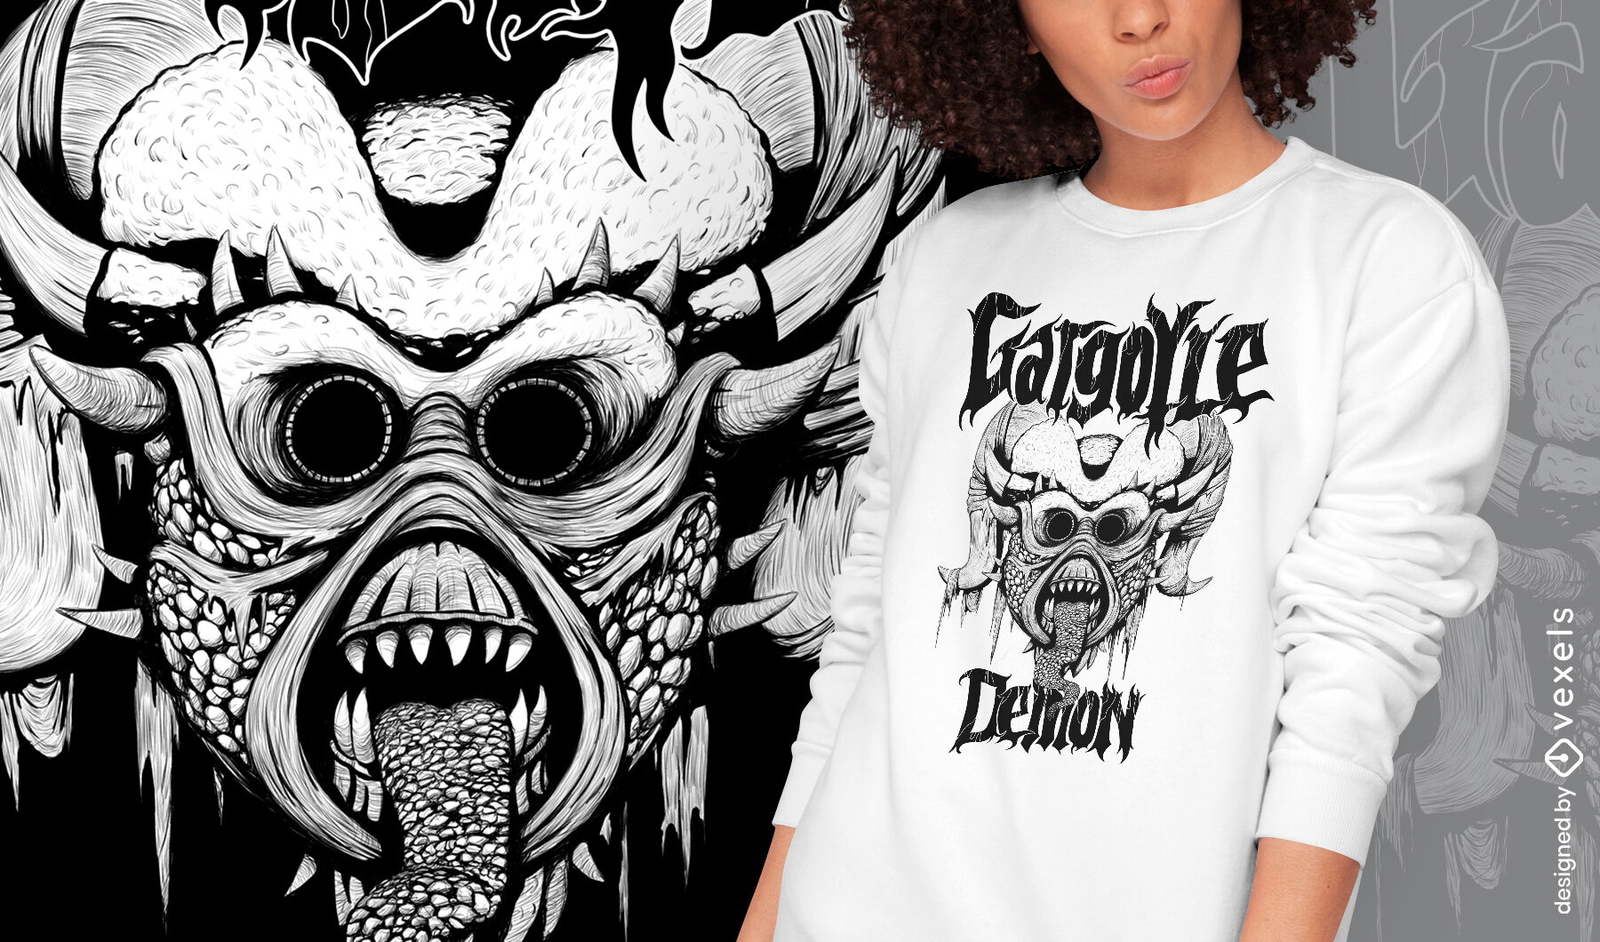
T-shirt desenhada à mão do monstro do gárgula demônio psd
Escolha uma pasta
Todos os favoritos
Criar novo
Salvar
T-shirt desenhada à mão do monstro do gárgula demônio psd
Pronto para imprimir
para Merch
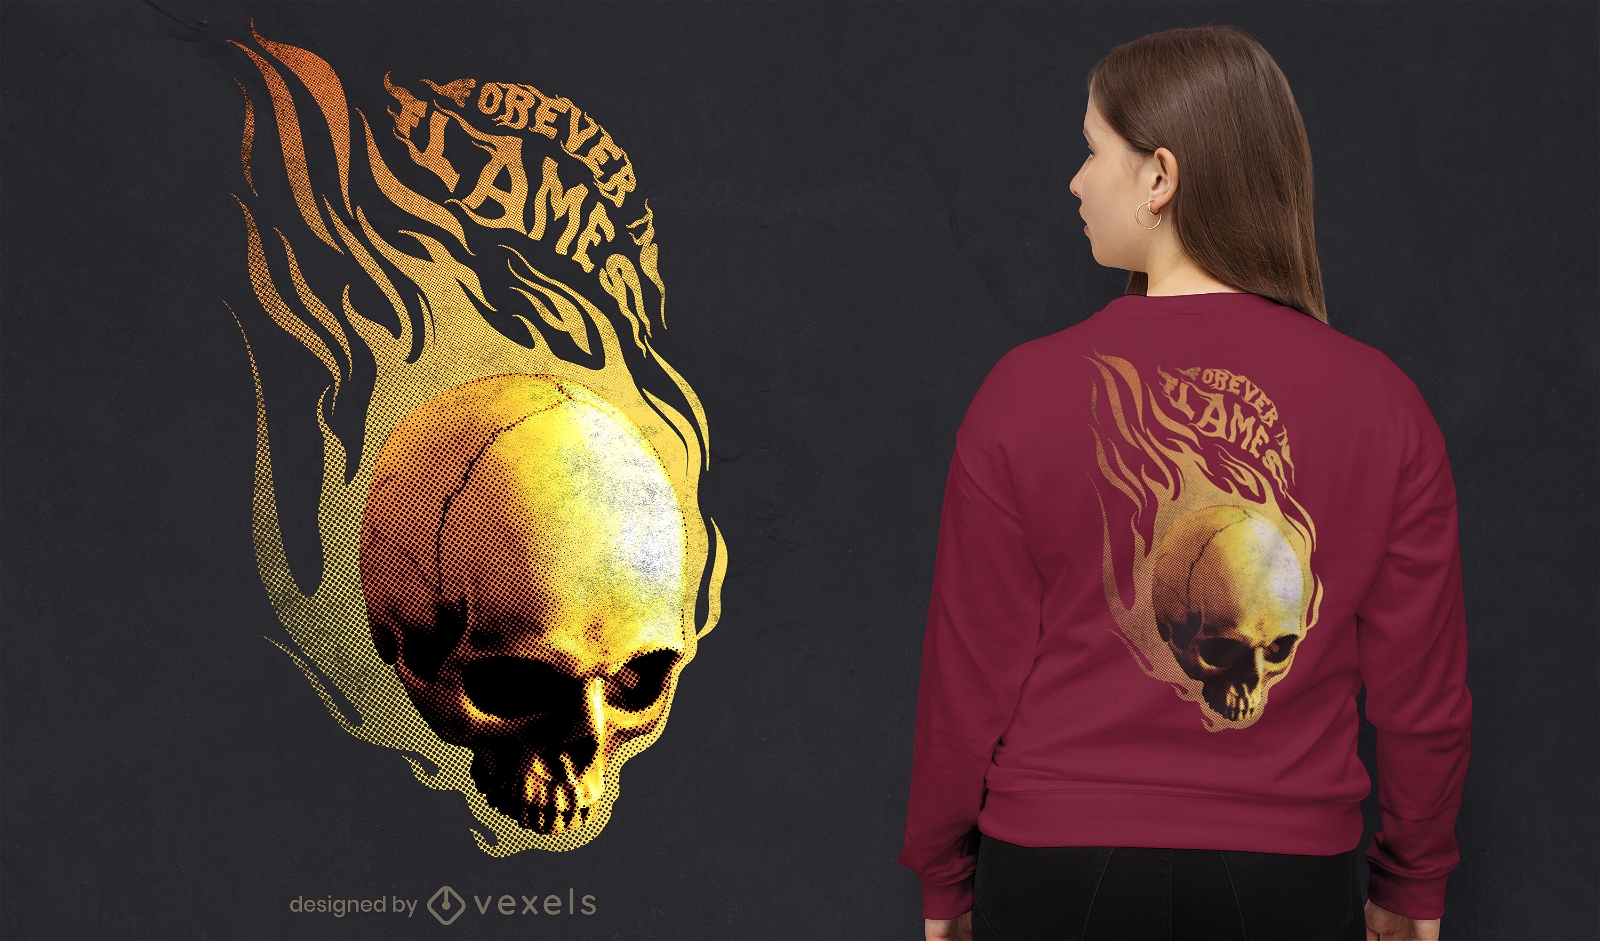
Design de t-shirt psd Skull in Flames
Escolha uma pasta
Todos os favoritos
Criar novo
Salvar
Design de t-shirt psd Skull in Flames
Pronto para imprimir
para Merch
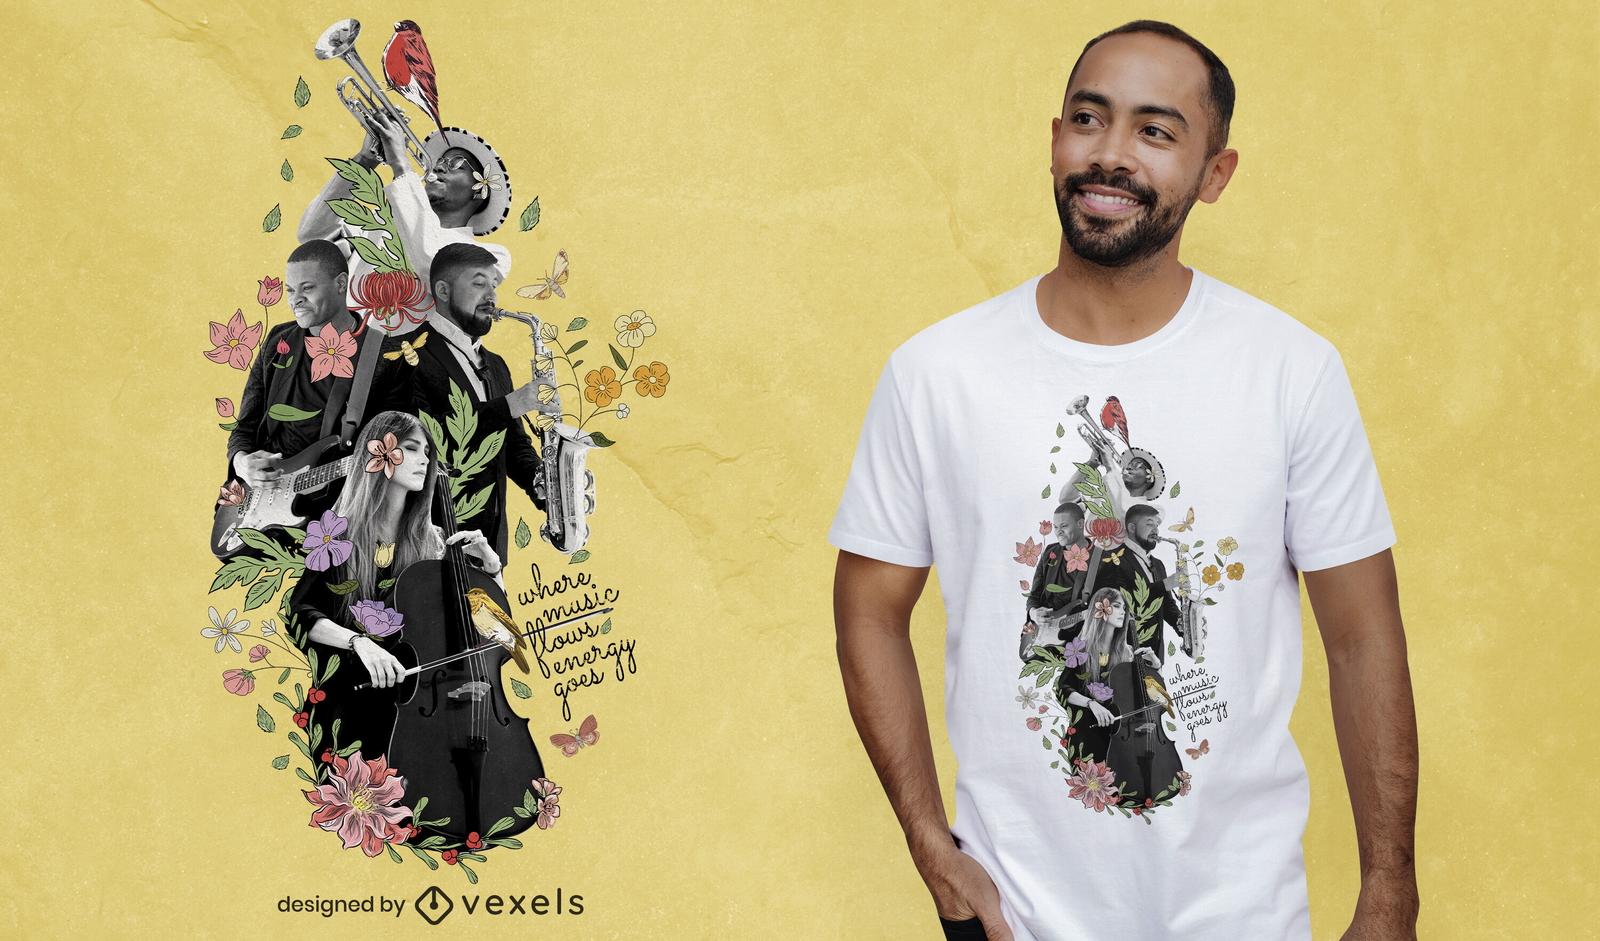
Design de t-shirt psd de colagem fotográfica de música
Escolha uma pasta
Todos os favoritos
Criar novo
Salvar
Design de t-shirt psd de colagem fotográfica de música
Pronto para imprimir
para Merch
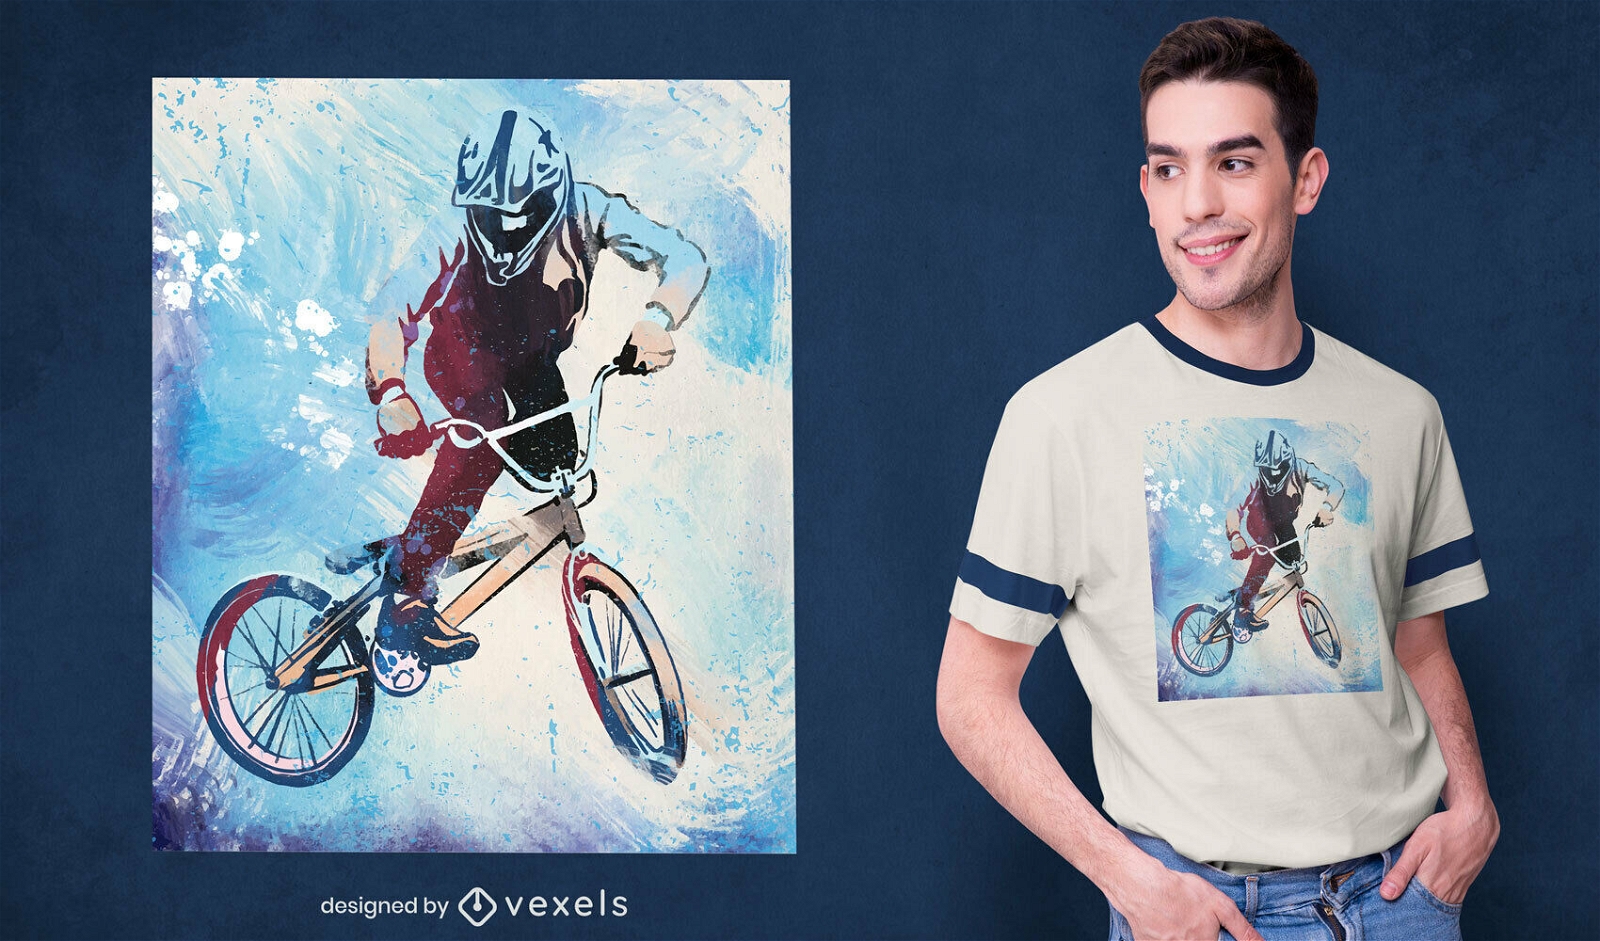
Camiseta legal de motociclista para acrobacias em aquarela psd
Escolha uma pasta
Todos os favoritos
Criar novo
Salvar
Camiseta legal de motociclista para acrobacias em aquarela psd
Pronto para imprimir
para Merch
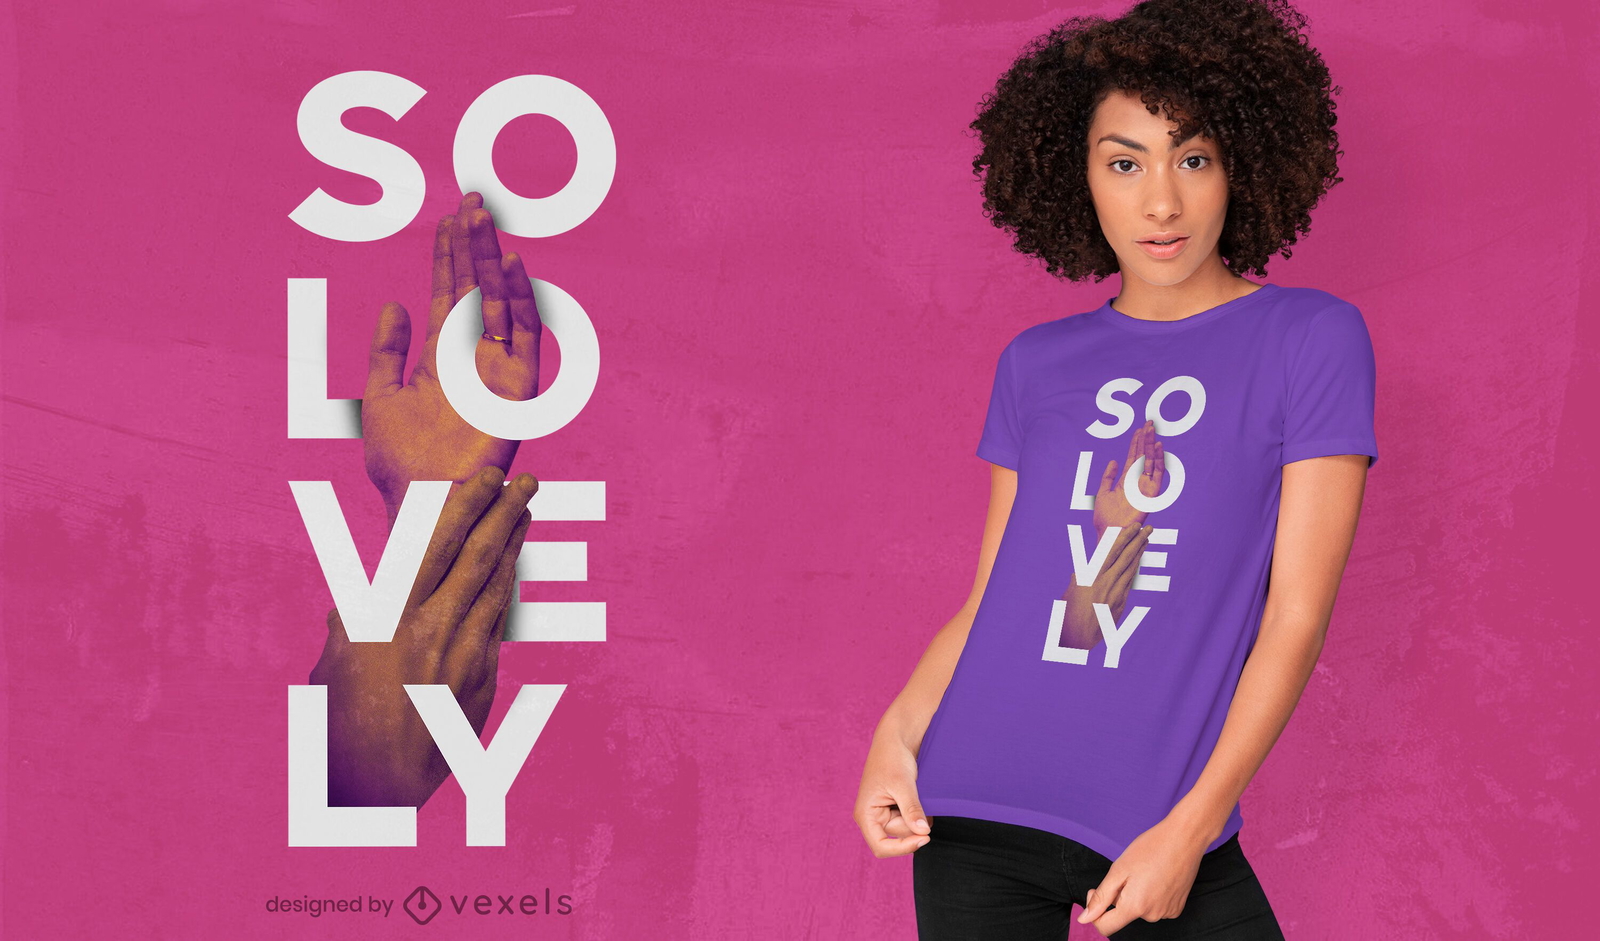
Tão lindo design de camiseta psd
Escolha uma pasta
Todos os favoritos
Criar novo
Salvar
Tão lindo design de camiseta psd
Camiseta PSD escalável
para Merch
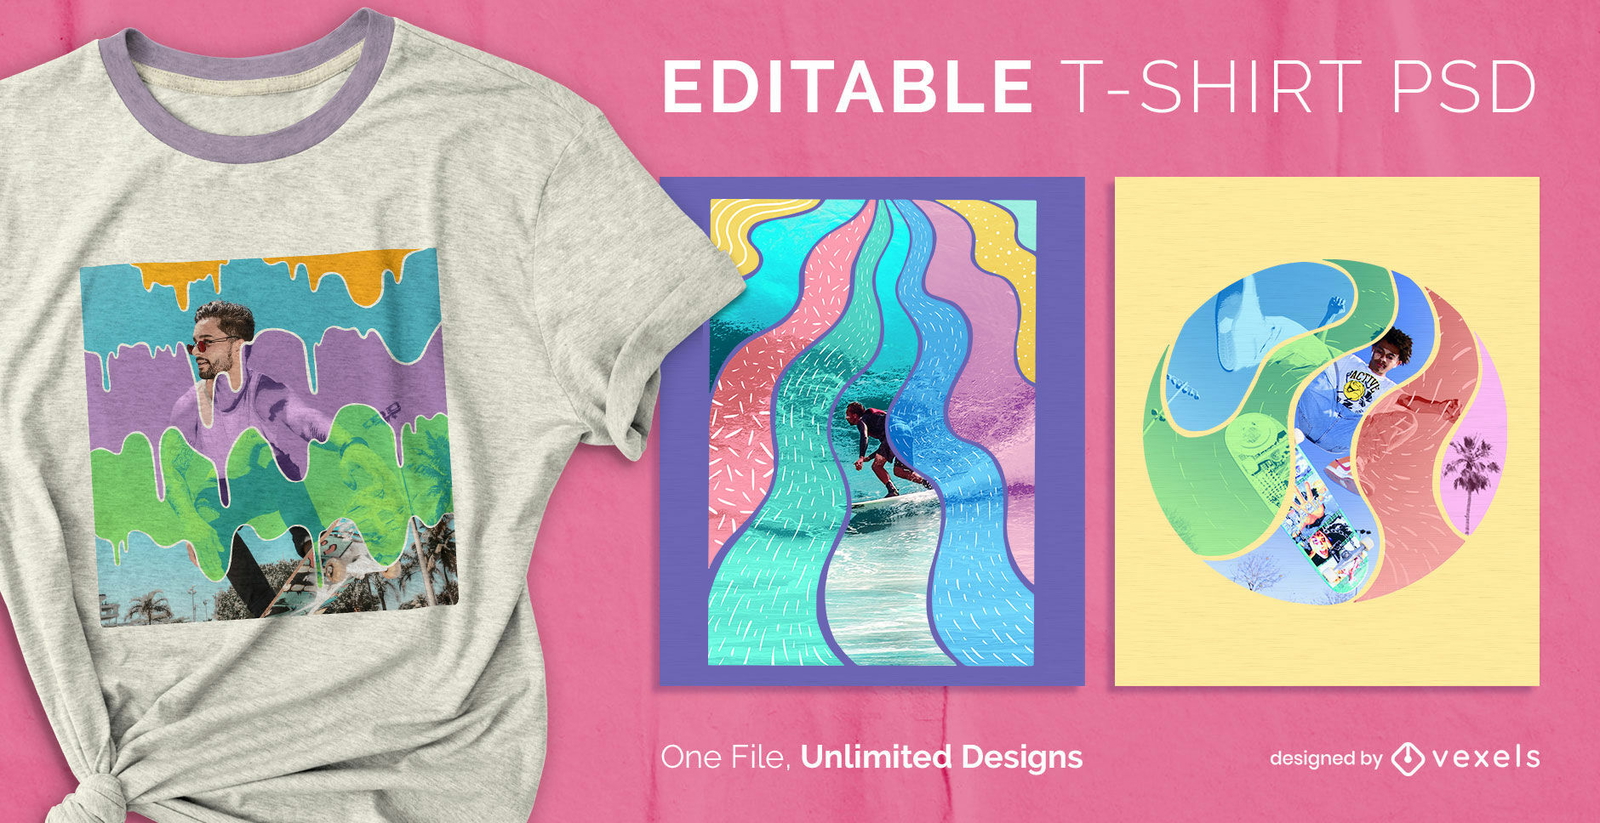
T-shirt escalável com imagens coloridas de esportes psd
Escolha uma pasta
Todos os favoritos
Criar novo
Salvar
T-shirt escalável com imagens coloridas de esportes psd
Camiseta PSD escalável
para Merch
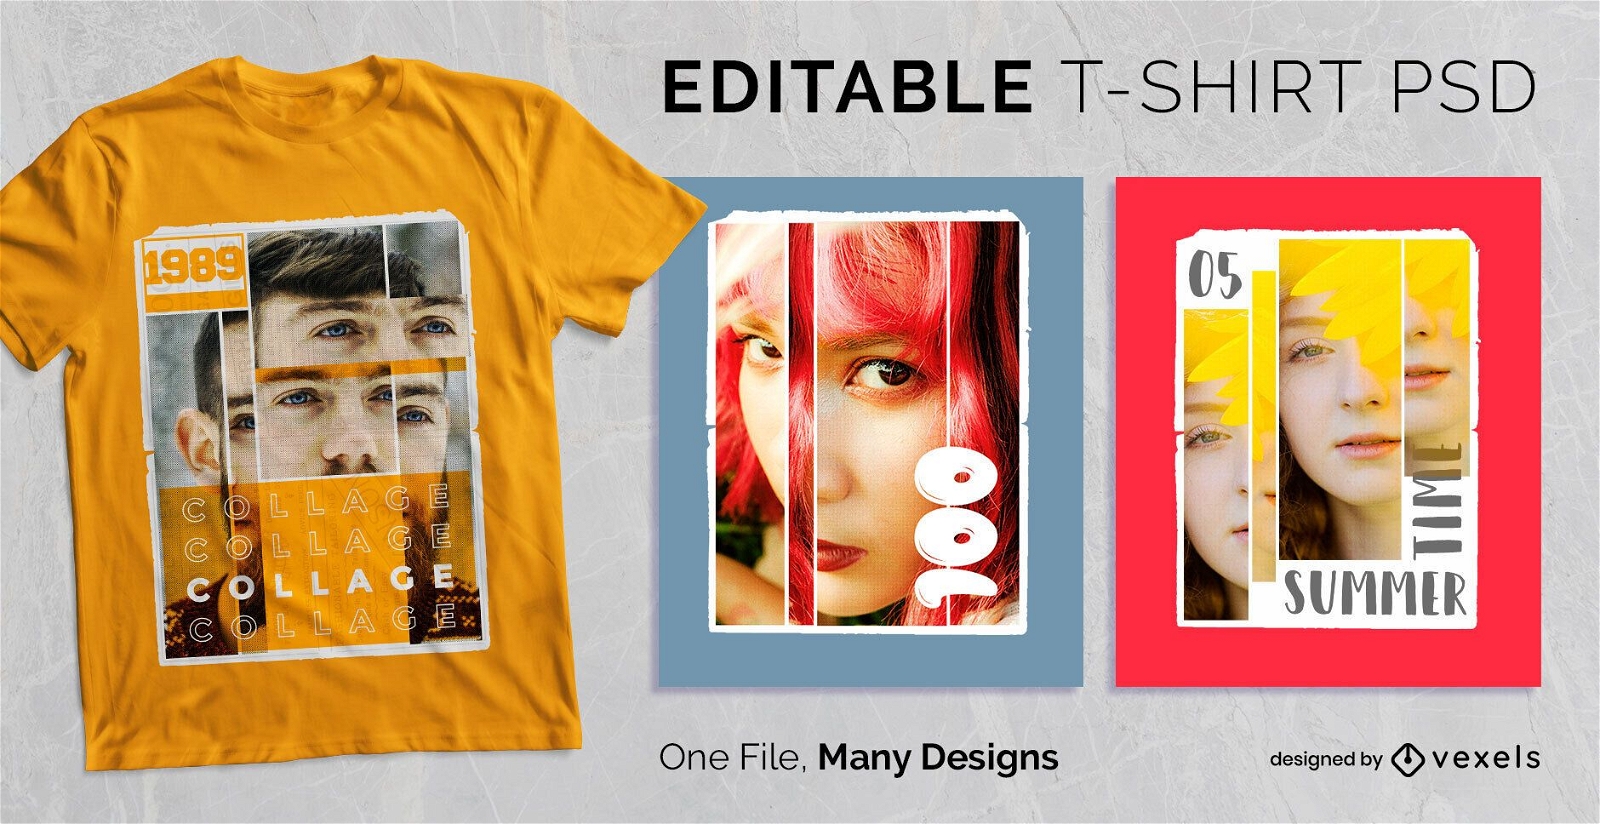
Design de camisetas com colagem retrô PSD
Escolha uma pasta
Todos os favoritos
Criar novo
Salvar
Design de camisetas com colagem retrô PSD
Impulsione seu negócio
Com a plataforma gráfica líder de mercado.
Ver planos
Próxima
do 67
prev page
next page