Biblioteca de design
Novos designs Merch
Camisetas
Vectores
Designs de Merch de Tendência
PNGs & SVGs
Mockups
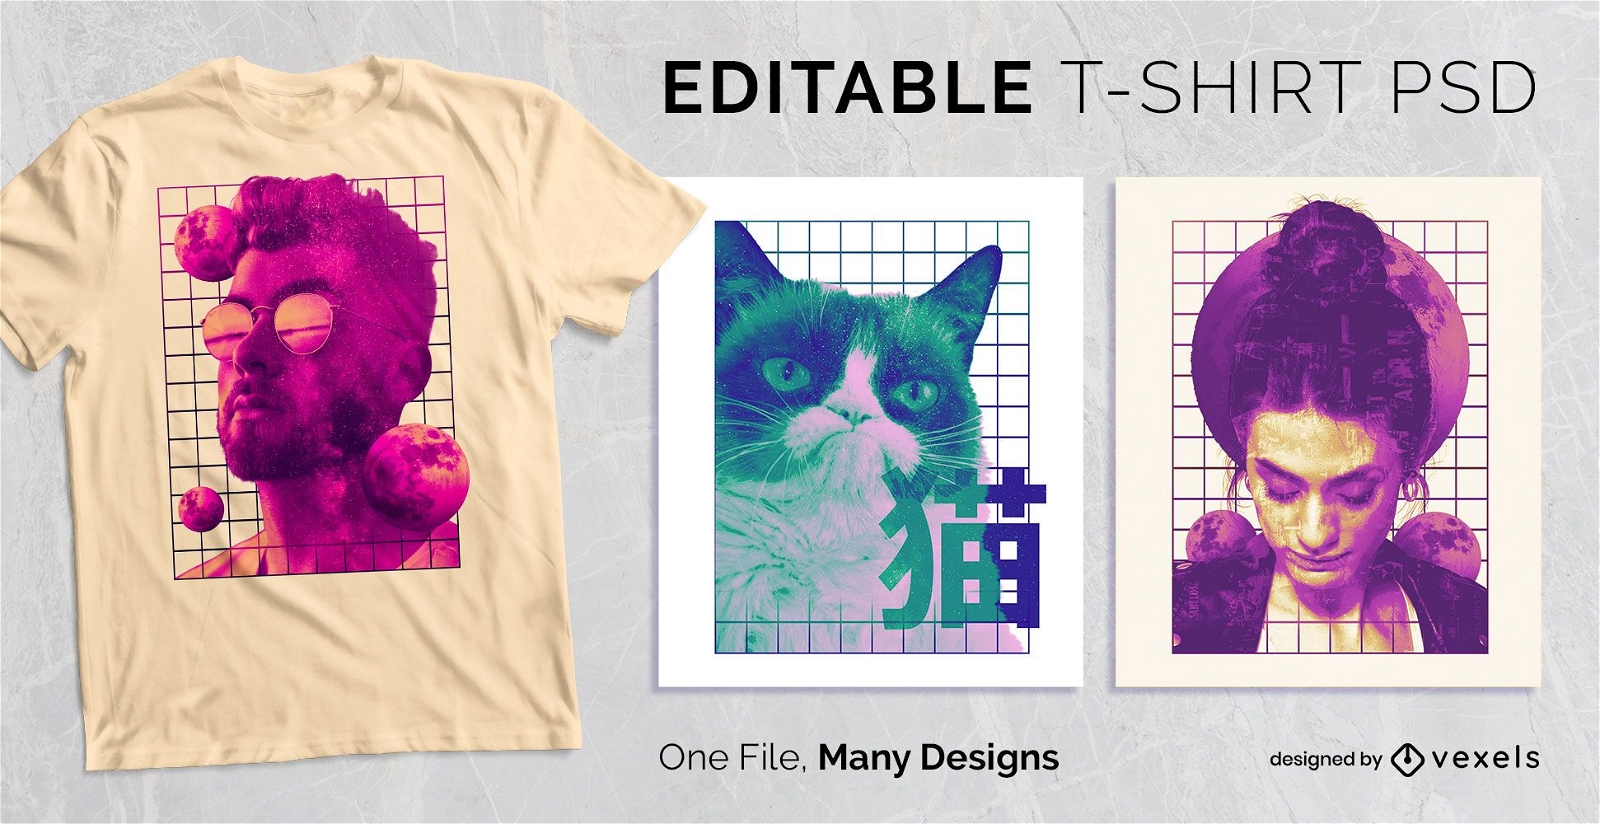
Modelos de T-Shirt PSD
Explorar Desenhos
Designs KDP
Pôsteres
Canecas
Capas para celular
Sacos de compras
Almofadas
Ferramentas de desenho
Merch Designer
Novo!
Mockup Generator
Gerador de Design de AI
Vetorizador
Quote Generator
T-Shirt Maker (Antigo)
Ajuda
Merch Digest
Blog
Centro de Ajuda
Saiba mais sobre o Merch
Feedback
Soluções Corporativas
Empresa
Acesso à API
Estúdio de Design
Design em Lote
Preços
Carregando...
Inscrever-se
Conecte-se
PSD Templates
graficos
Biblioteca de design
Novos designs Merch
Camisetas
Vectores
Designs de Merch de Tendência
PNGs & SVGs
Mockups
Modelos de T-Shirt PSD
Explorar Desenhos
Designs KDP
Pôsteres
Canecas
Capas para celular
Sacos de compras
Almofadas
Ferramentas de desenho
Merch Designer
Novo!
Mockup Generator
Gerador de Design de AI
Vetorizador
Quote Generator
T-Shirt Maker (Antigo)
Ajuda
Merch Digest
Blog
Centro de Ajuda
Saiba mais sobre o Merch
Feedback
Soluções Corporativas
Empresa
Acesso à API
Estúdio de Design
Design em Lote
PLANOS
PSD Templates
graficos
3311 Designs de Camisetas e Mockups PSD de graficos
Baixar designs de camisetas ou mockups PSD editáveis de graficos
Relacionado:
graficos vetoriais
,
desenhos graficos de ações
,
graficos tridimensionais
Ordenar por
Mais relevante
Resultados patrocinados da
Ganhe 15% de desconto com o código: VEXELS15
veja mais detalhes
Camiseta PSD escalável
para Merch
Grid Collage T-shirt Design PSD
Escolha uma pasta
Todos os favoritos
Criar novo
Salvar
Grid Collage T-shirt Design PSD
Pronto para imprimir
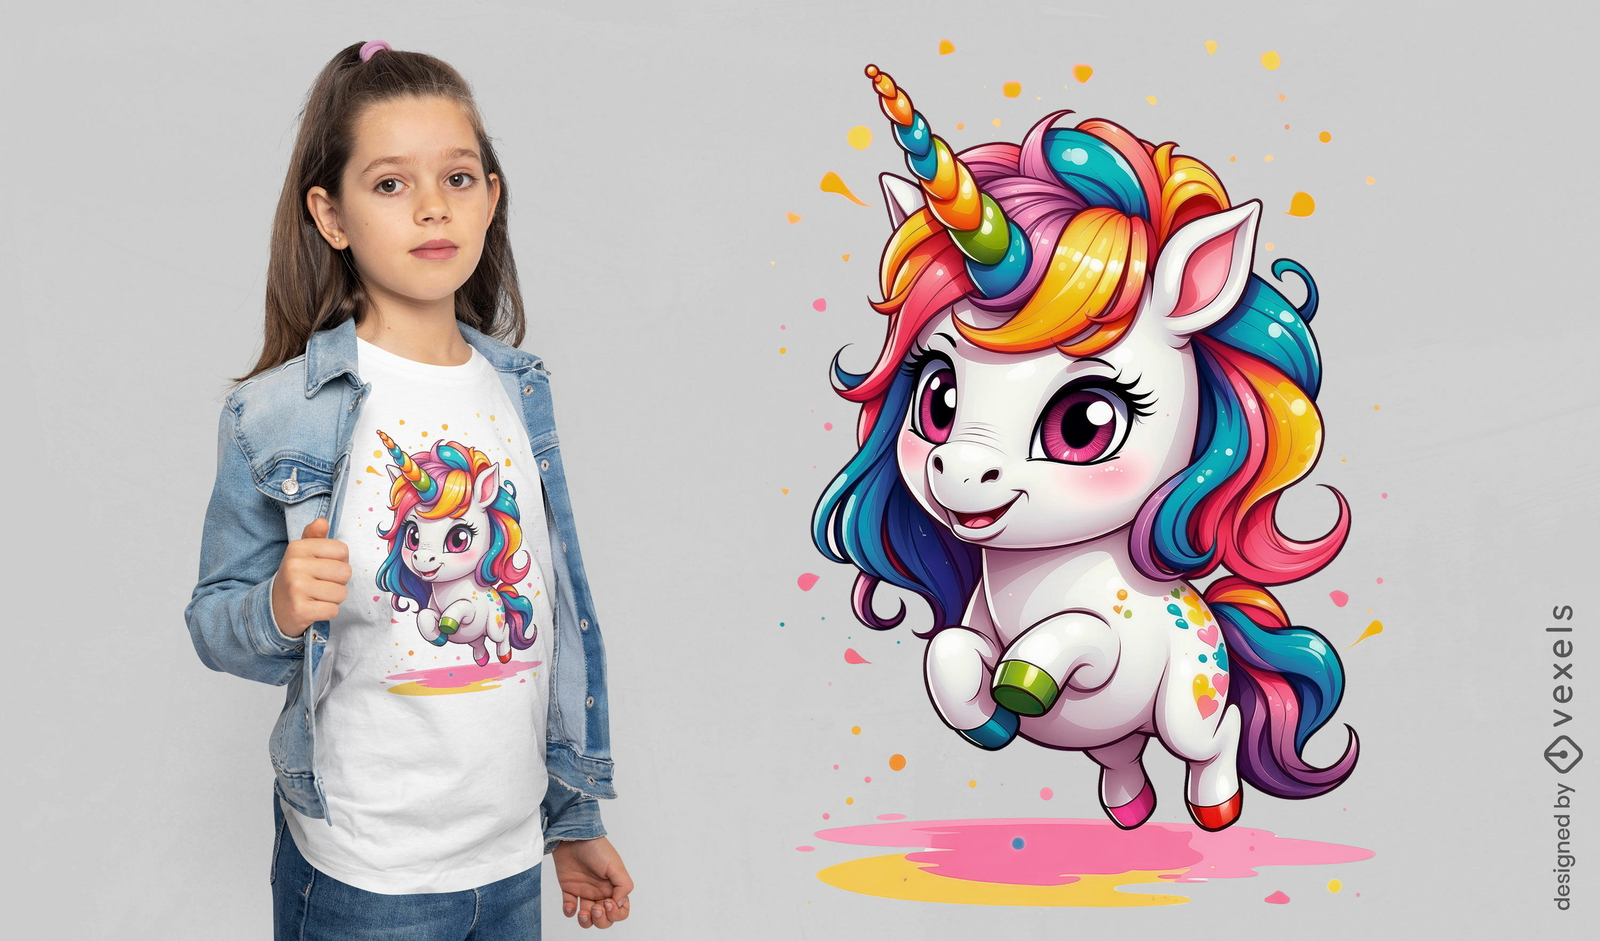
para Merch
Design super fofo de camiseta de unicórnio para bebê
Escolha uma pasta
Todos os favoritos
Criar novo
Salvar
Design super fofo de camiseta de unicórnio para bebê
Gerado por IA, selecionado por nossos designers.
para Merch
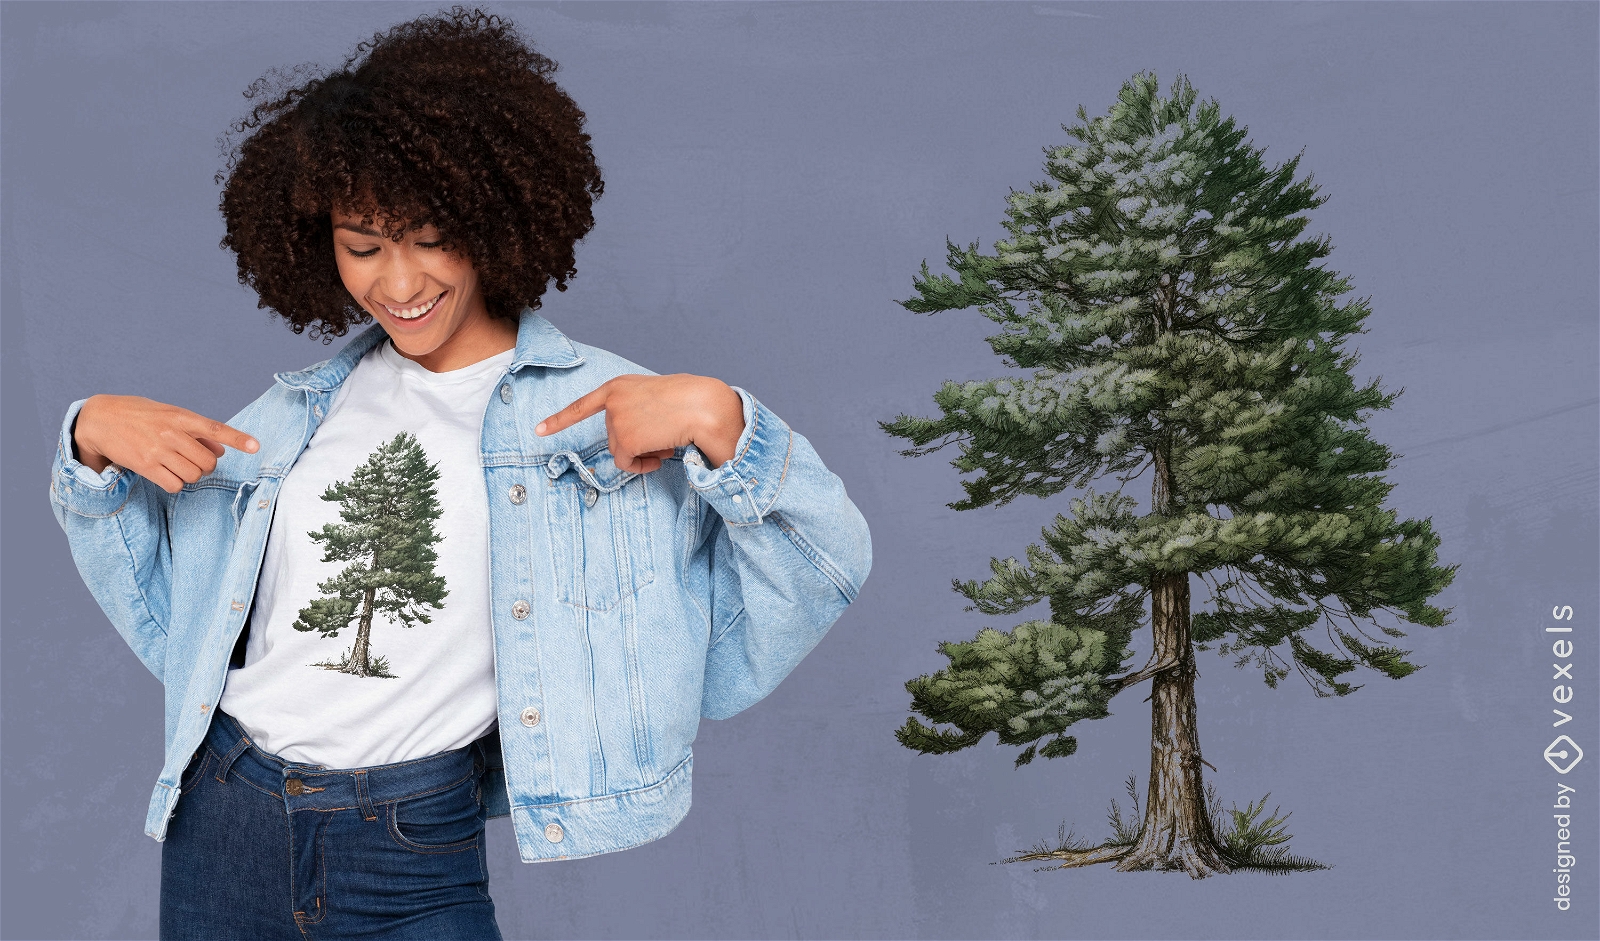
Design sereno de camiseta com ?rvore
Escolha uma pasta
Todos os favoritos
Criar novo
Salvar
Design sereno de camiseta com ?rvore
Gerado por IA, selecionado por nossos designers.
para Merch
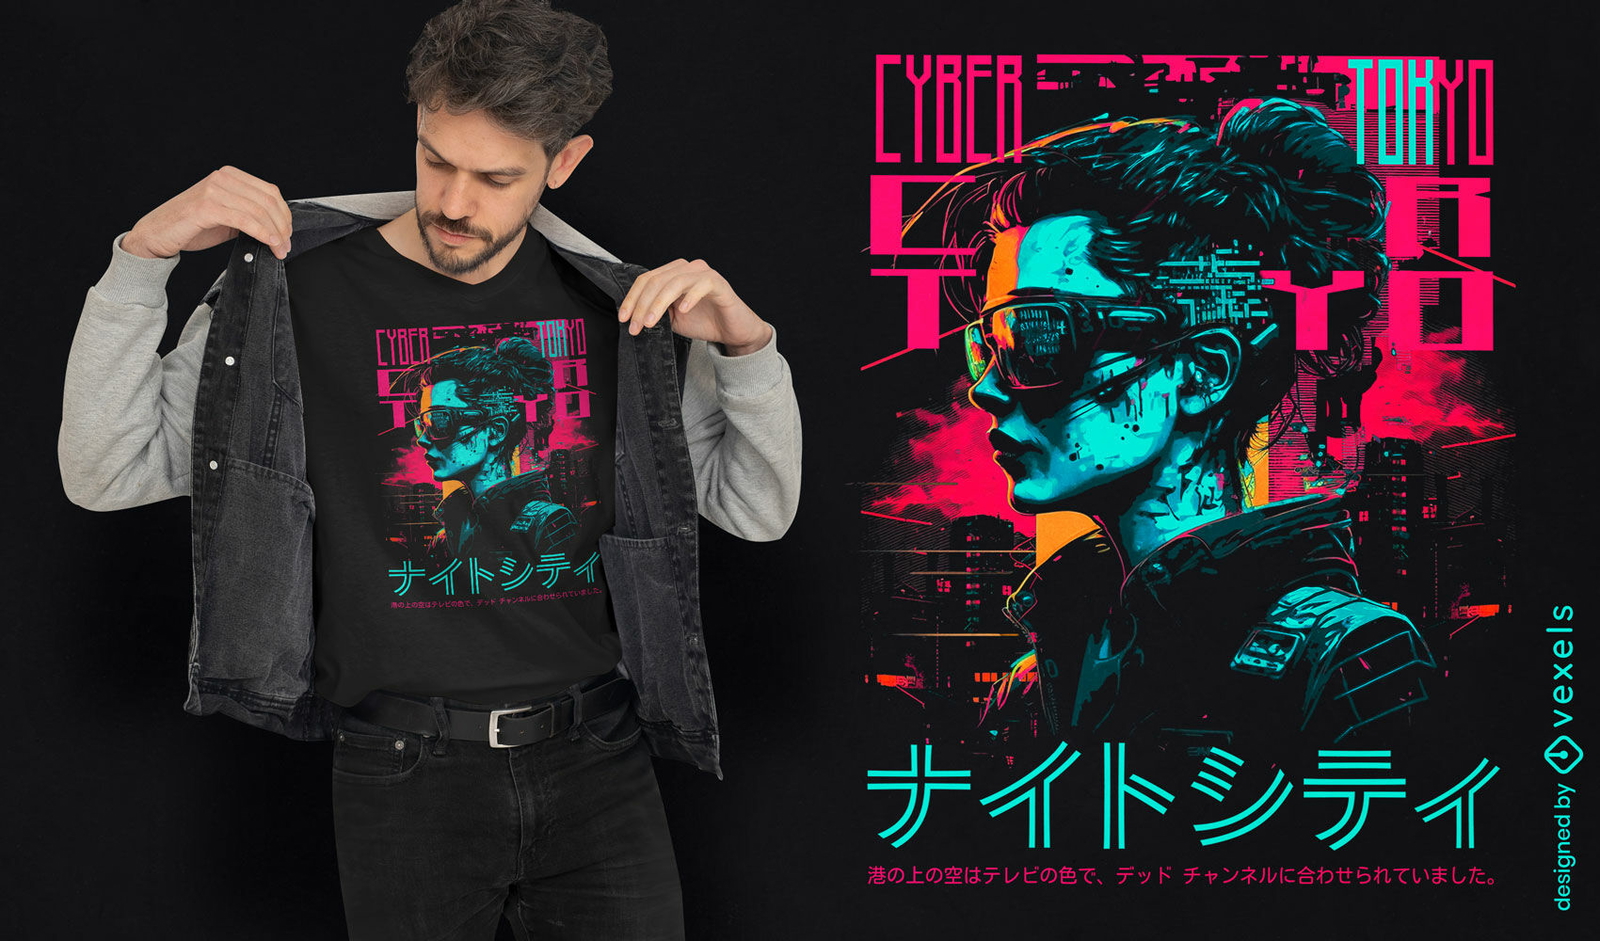
Design de camiseta Cyberpunk Tóquio
Escolha uma pasta
Todos os favoritos
Criar novo
Salvar
Design de camiseta Cyberpunk Tóquio
Pronto para imprimir
para Merch
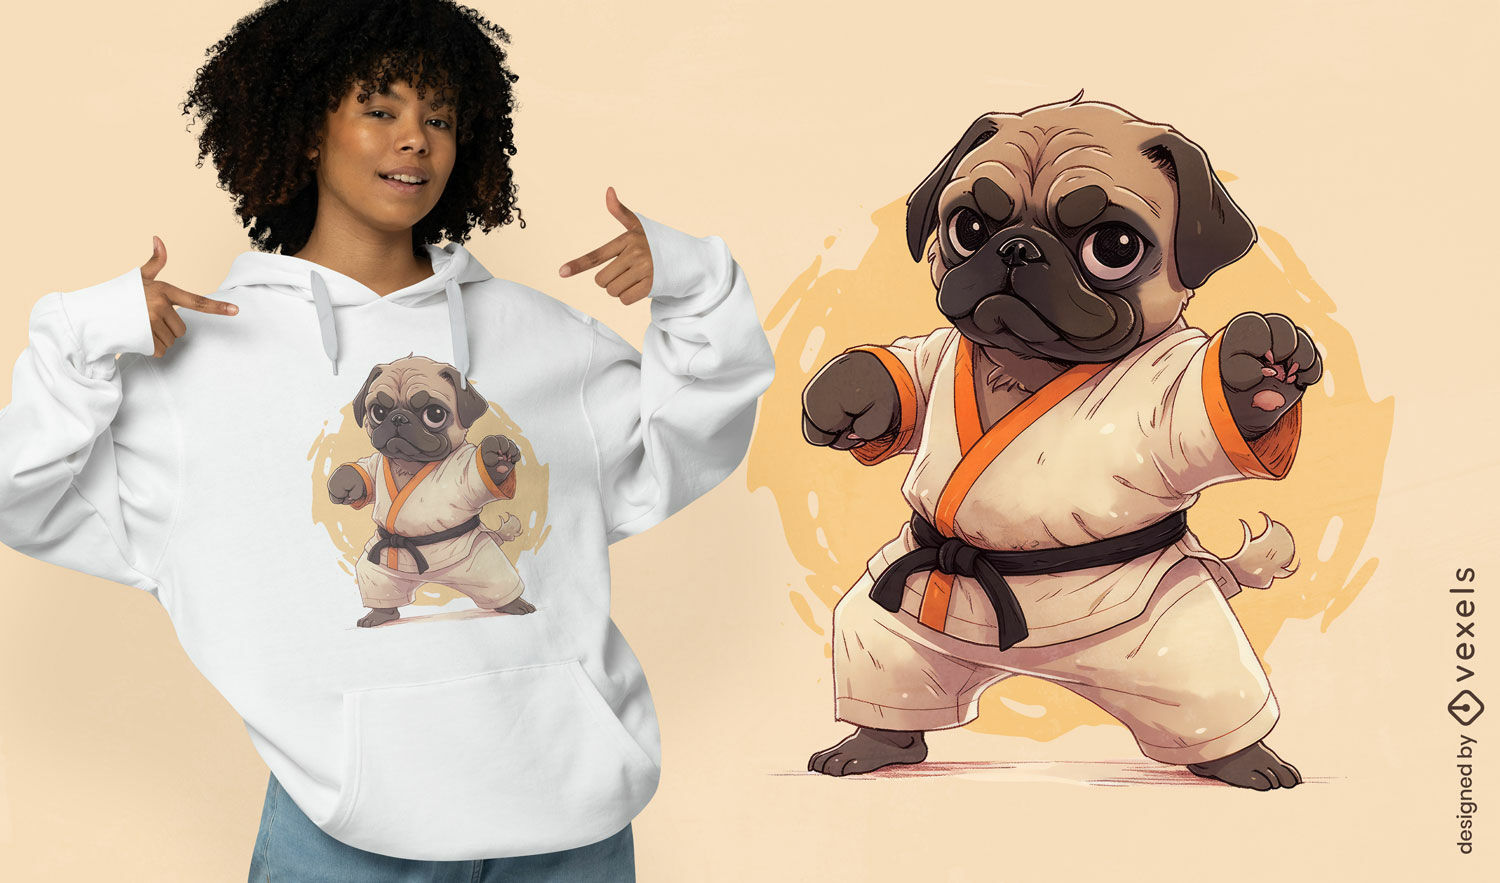
Design de camiseta de karatê Pug
Escolha uma pasta
Todos os favoritos
Criar novo
Salvar
Design de camiseta de karatê Pug
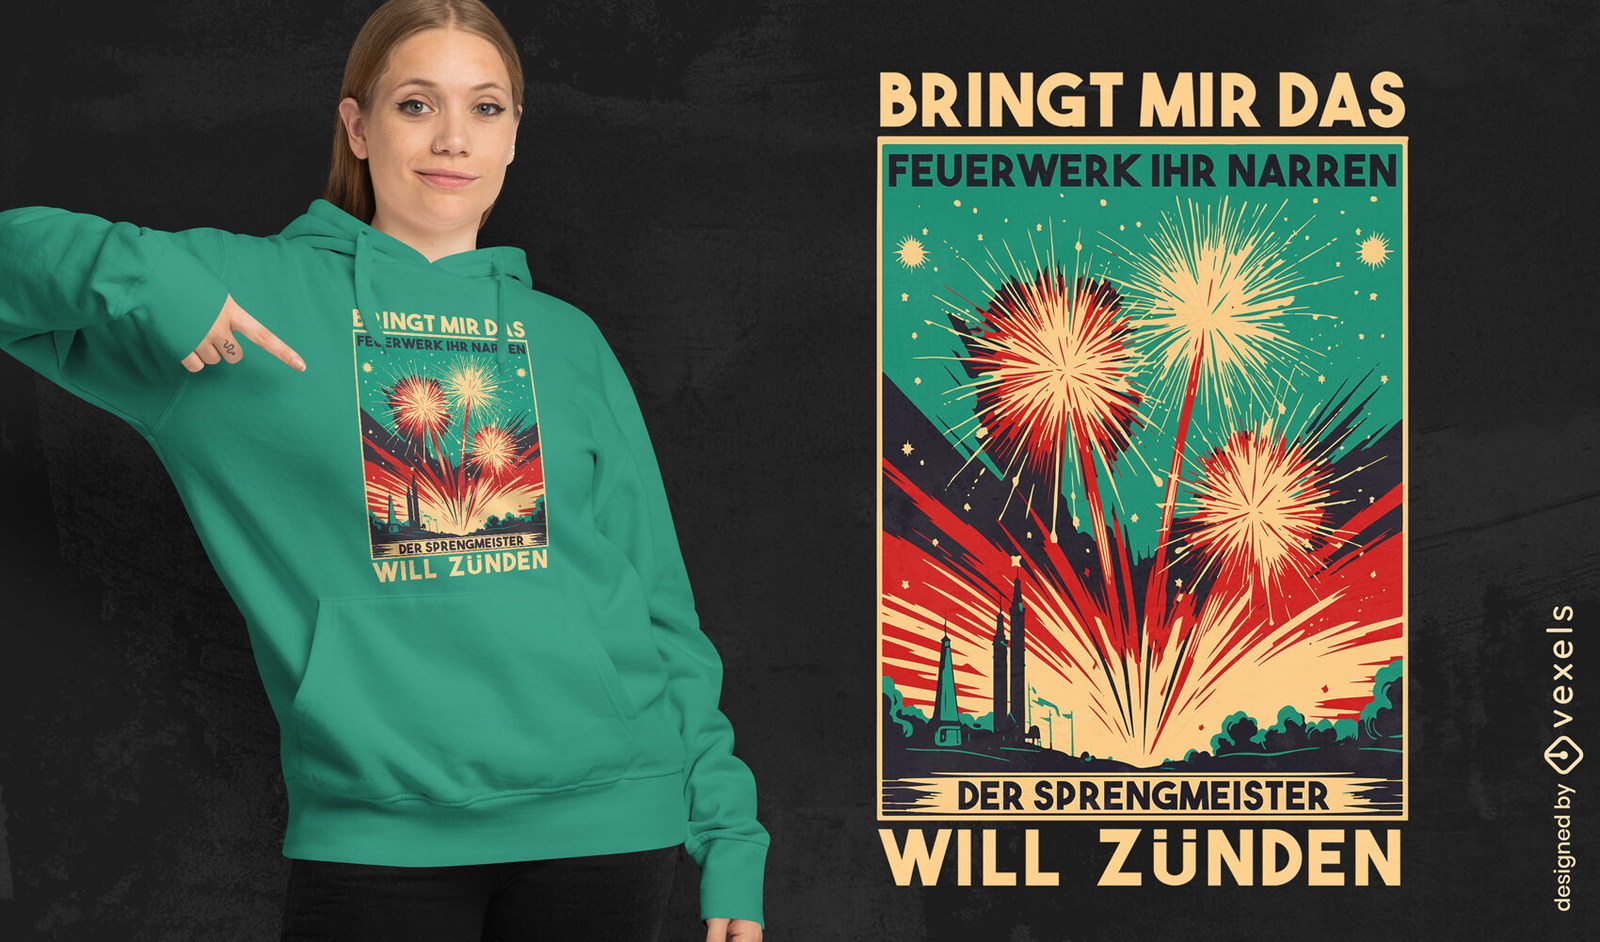
Conteúdo em alemão
Pronto para imprimir
para Merch
Design de camiseta vintage de fogos de artifício
Escolha uma pasta
Todos os favoritos
Criar novo
Salvar
Design de camiseta vintage de fogos de artifício
Pronto para imprimir
para Merch
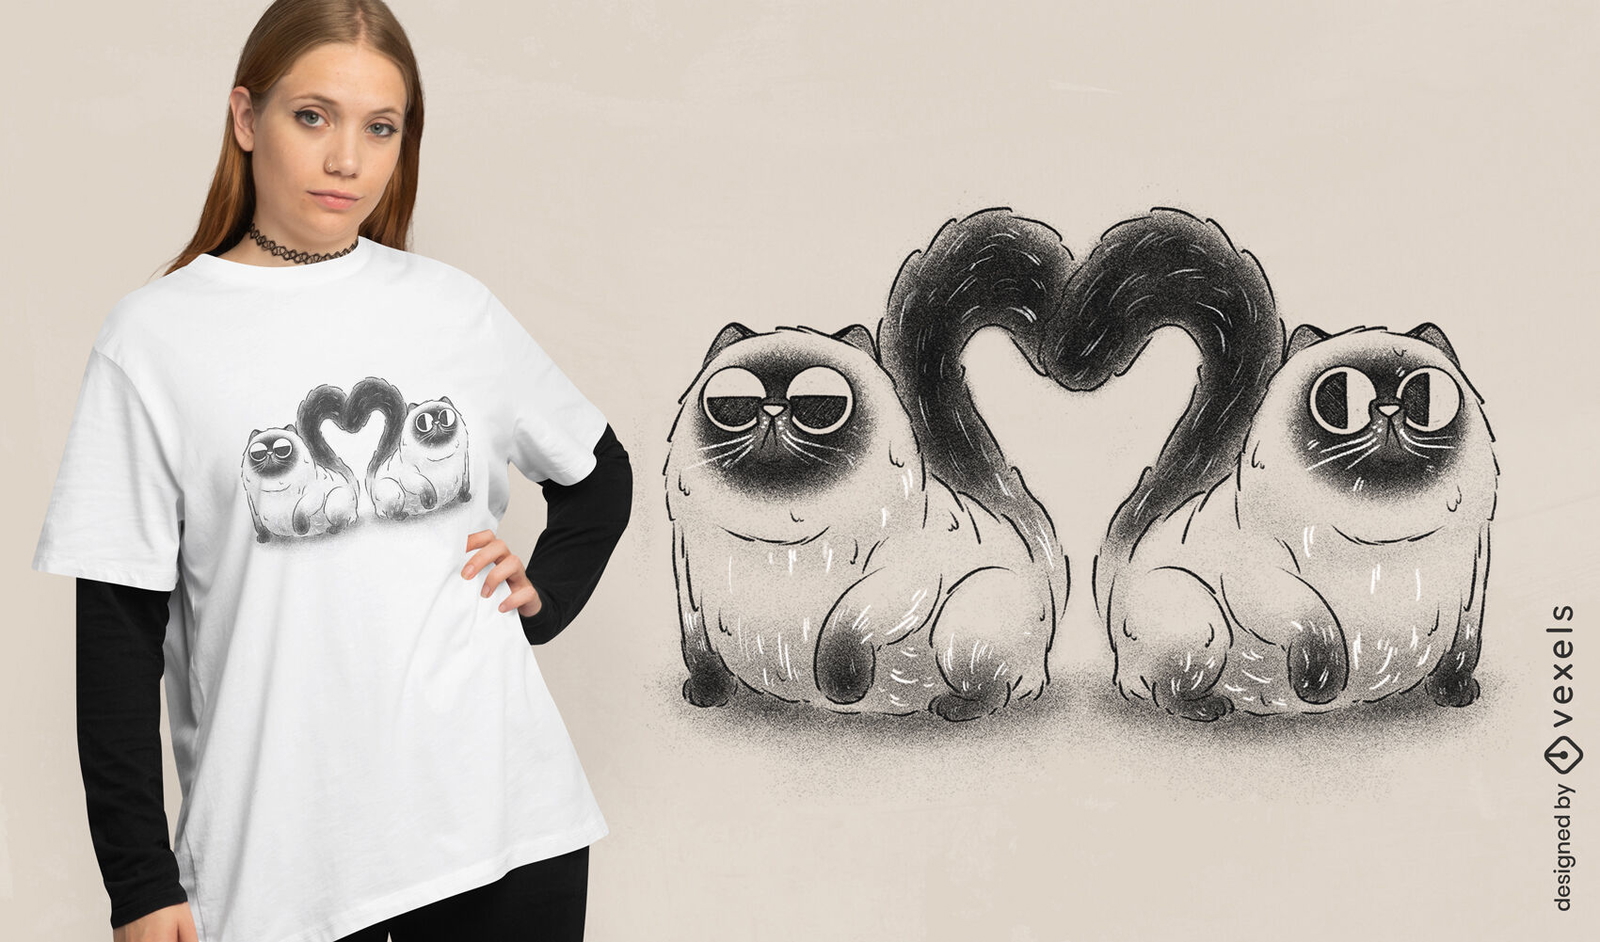
Design de camiseta de rabo de coração de gatos Persa
Escolha uma pasta
Todos os favoritos
Criar novo
Salvar
Design de camiseta de rabo de coração de gatos Persa
texto editável
para Merch
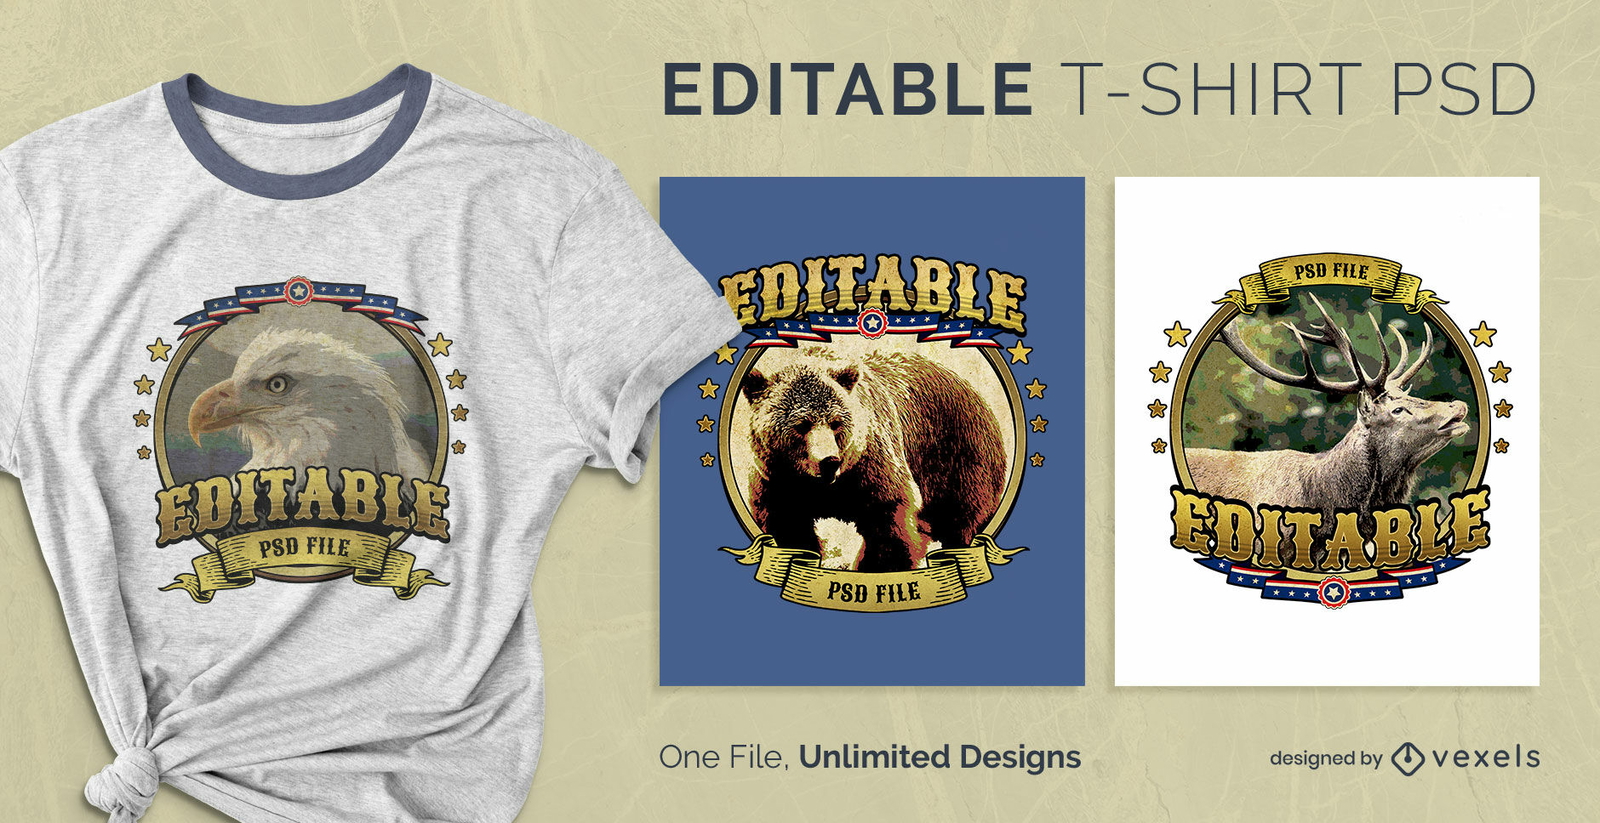
Camiseta escalável de animais selvagens americanos psd
Escolha uma pasta
Todos os favoritos
Criar novo
Salvar
Camiseta escalável de animais selvagens americanos psd
texto editável
para Merch
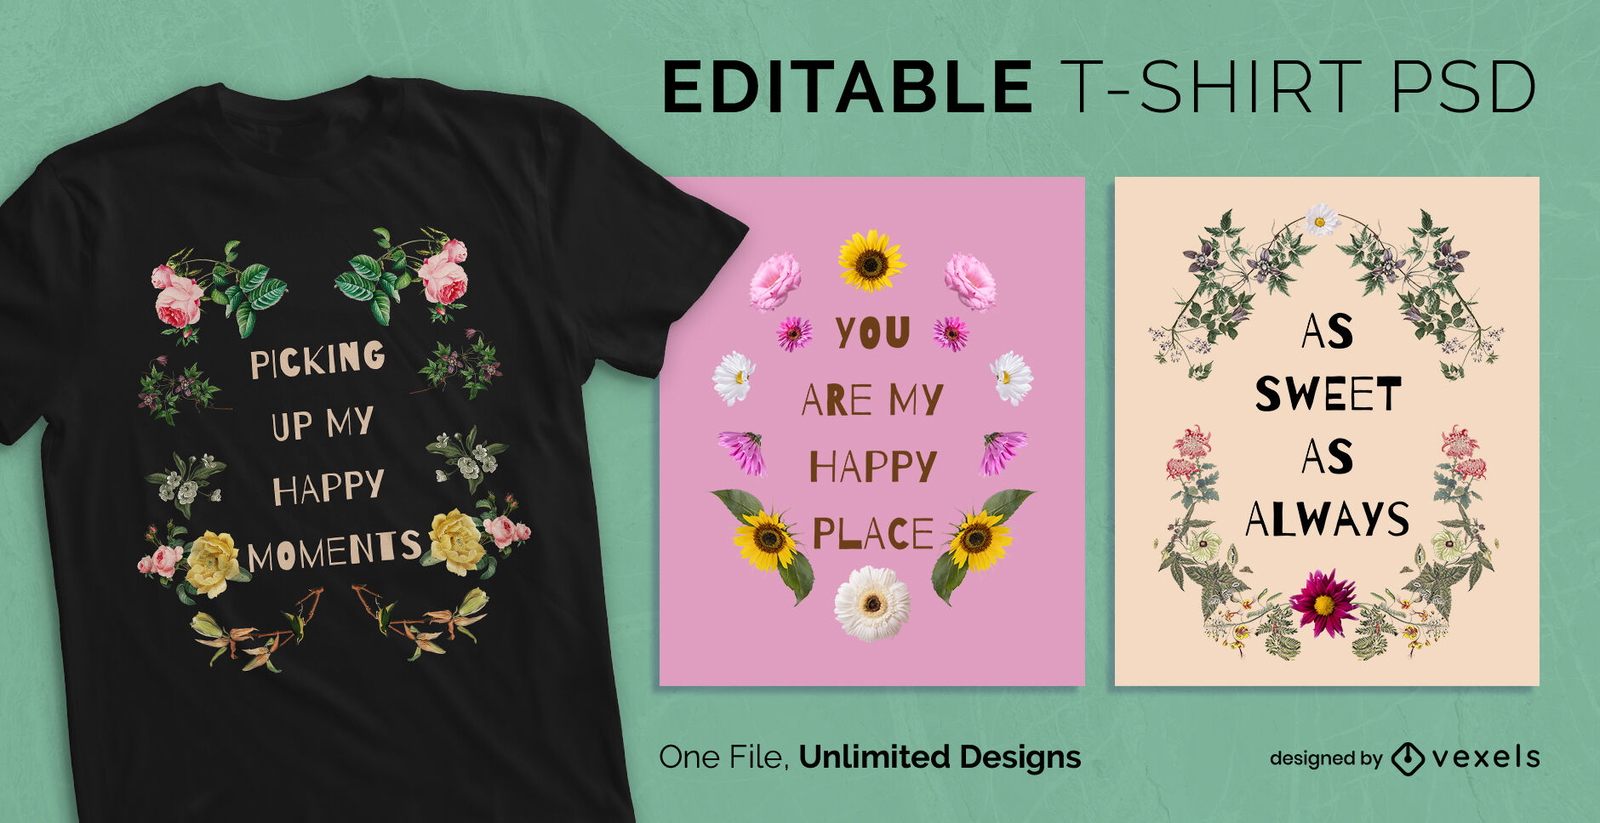
T-shirt psd escalável com guirlanda floral
Escolha uma pasta
Todos os favoritos
Criar novo
Salvar
T-shirt psd escalável com guirlanda floral
Pronto para imprimir
para Merch
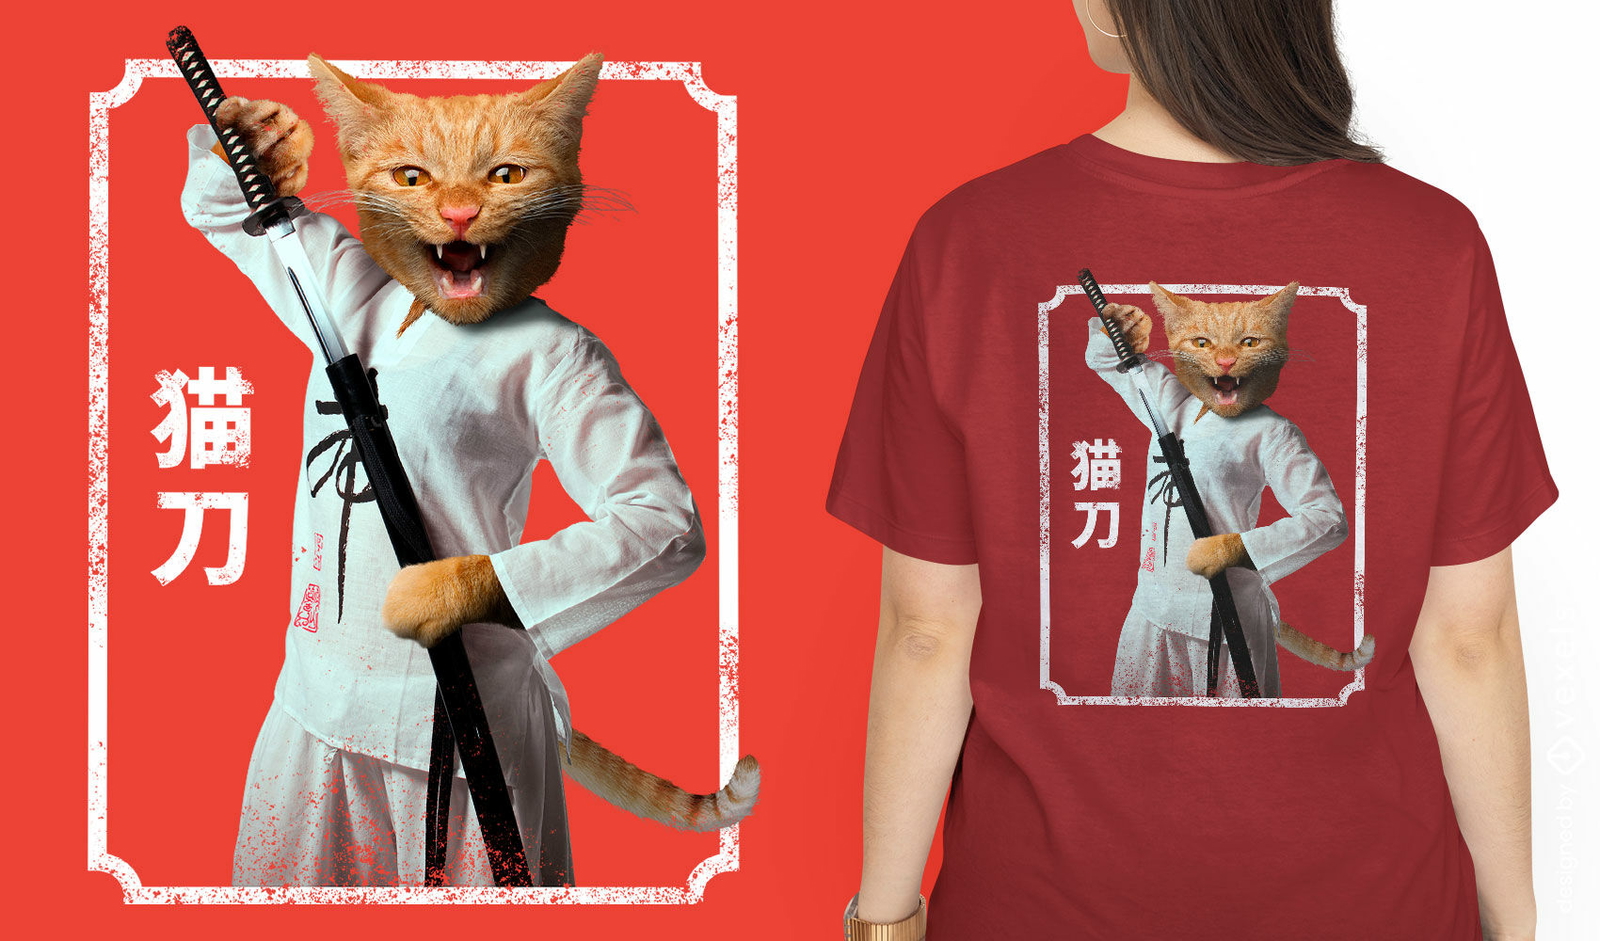
Gato ninja com design de camiseta de espada
Escolha uma pasta
Todos os favoritos
Criar novo
Salvar
Gato ninja com design de camiseta de espada
texto editável
Pronto para imprimir
para Merch
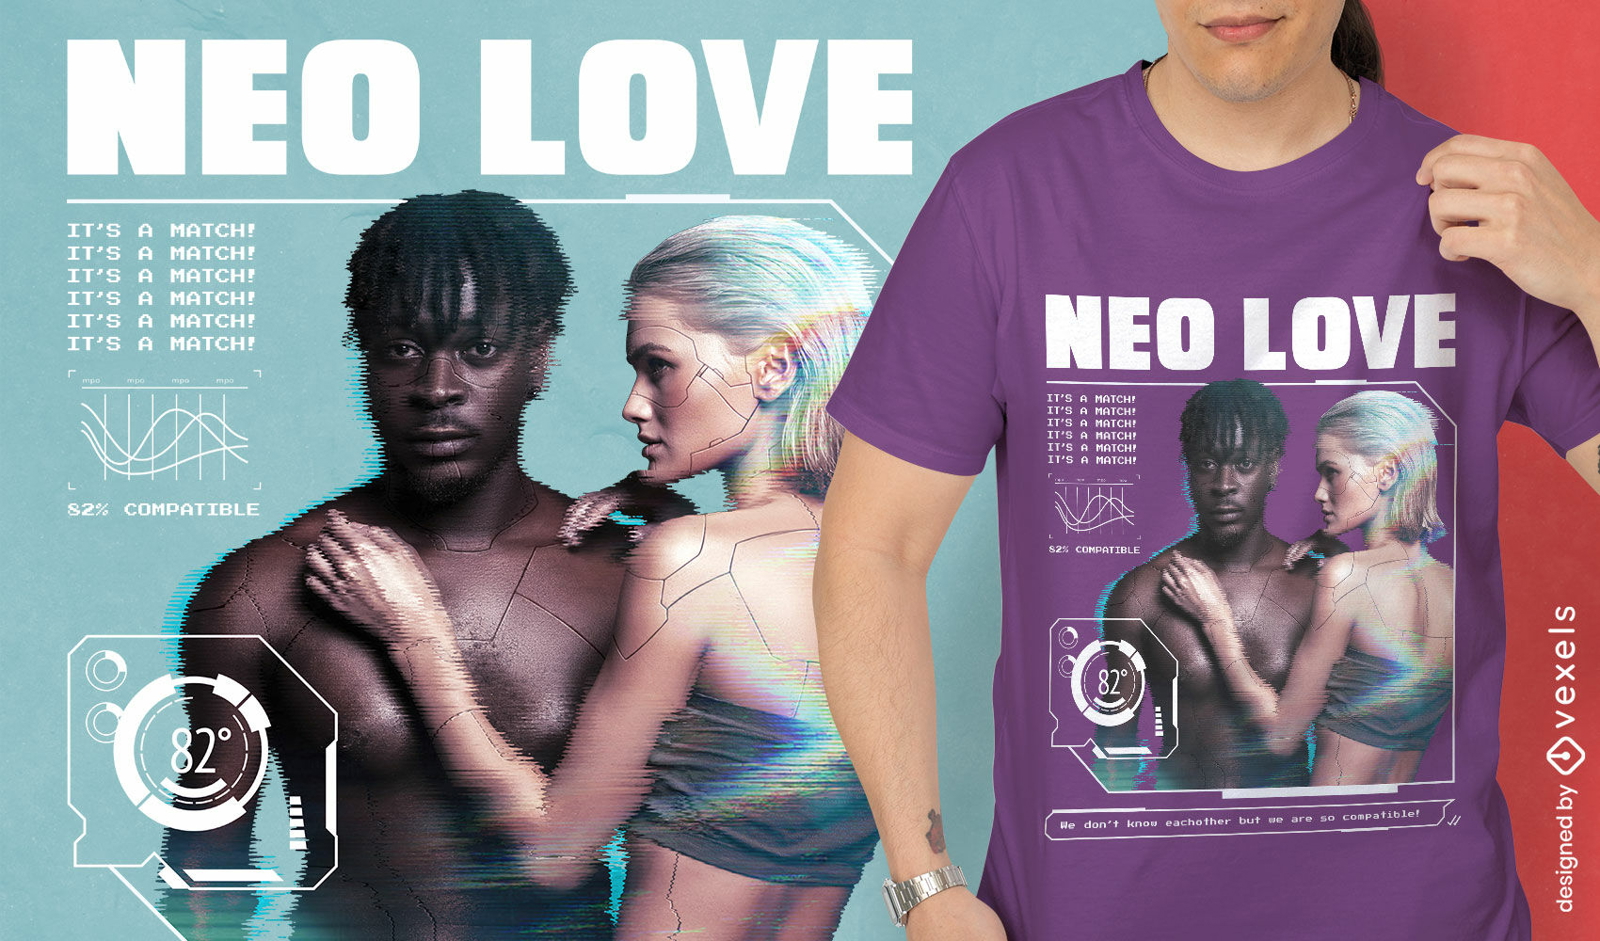
Design de camiseta de casal futurista
Escolha uma pasta
Todos os favoritos
Criar novo
Salvar
Design de camiseta de casal futurista
Pronto para imprimir
para Merch
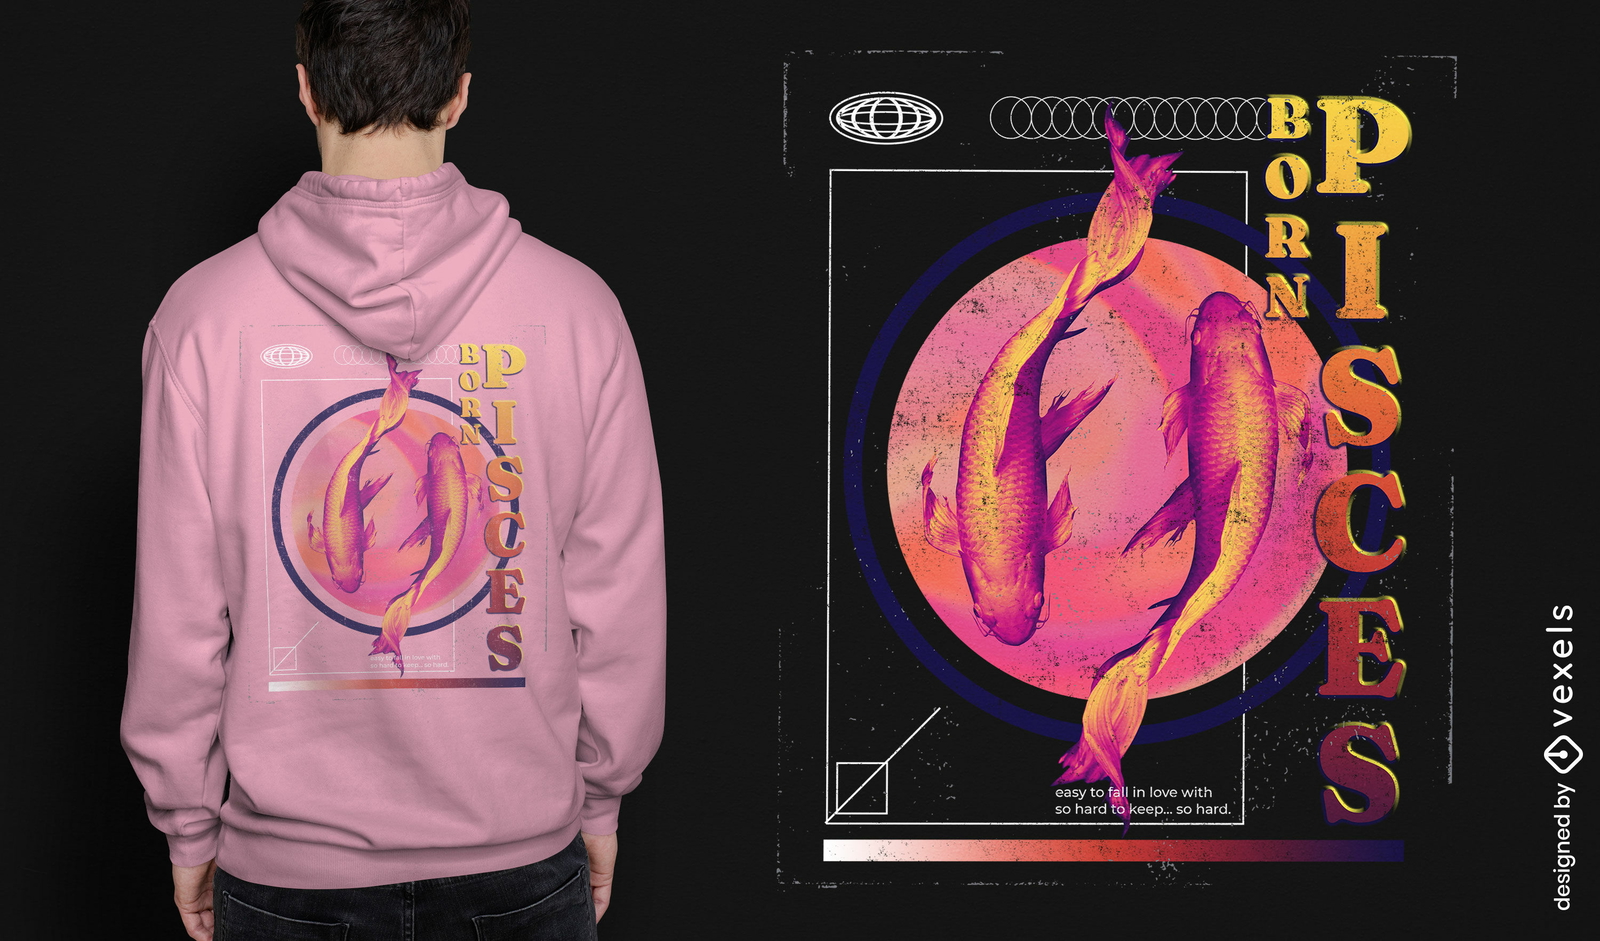
T-shirt de natação do horóscopo de peixes psd
Escolha uma pasta
Todos os favoritos
Criar novo
Salvar
T-shirt de natação do horóscopo de peixes psd
Pronto para imprimir
para Merch
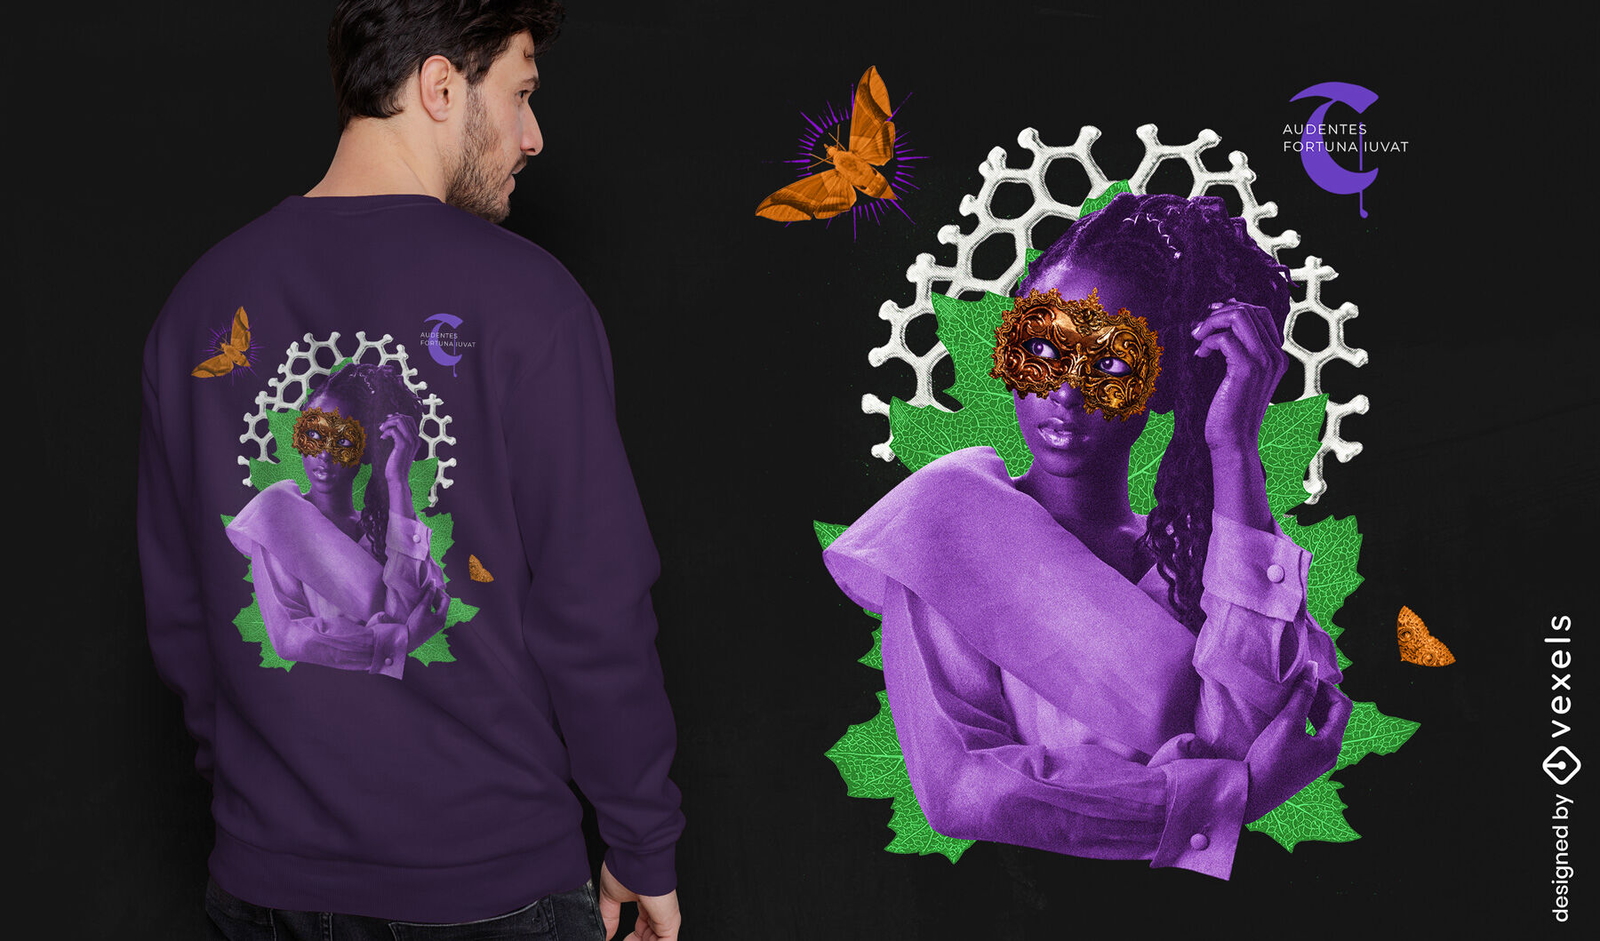
Mulher negra em camiseta de máscara de carnaval psd
Escolha uma pasta
Todos os favoritos
Criar novo
Salvar
Mulher negra em camiseta de máscara de carnaval psd
Pronto para imprimir
para Merch
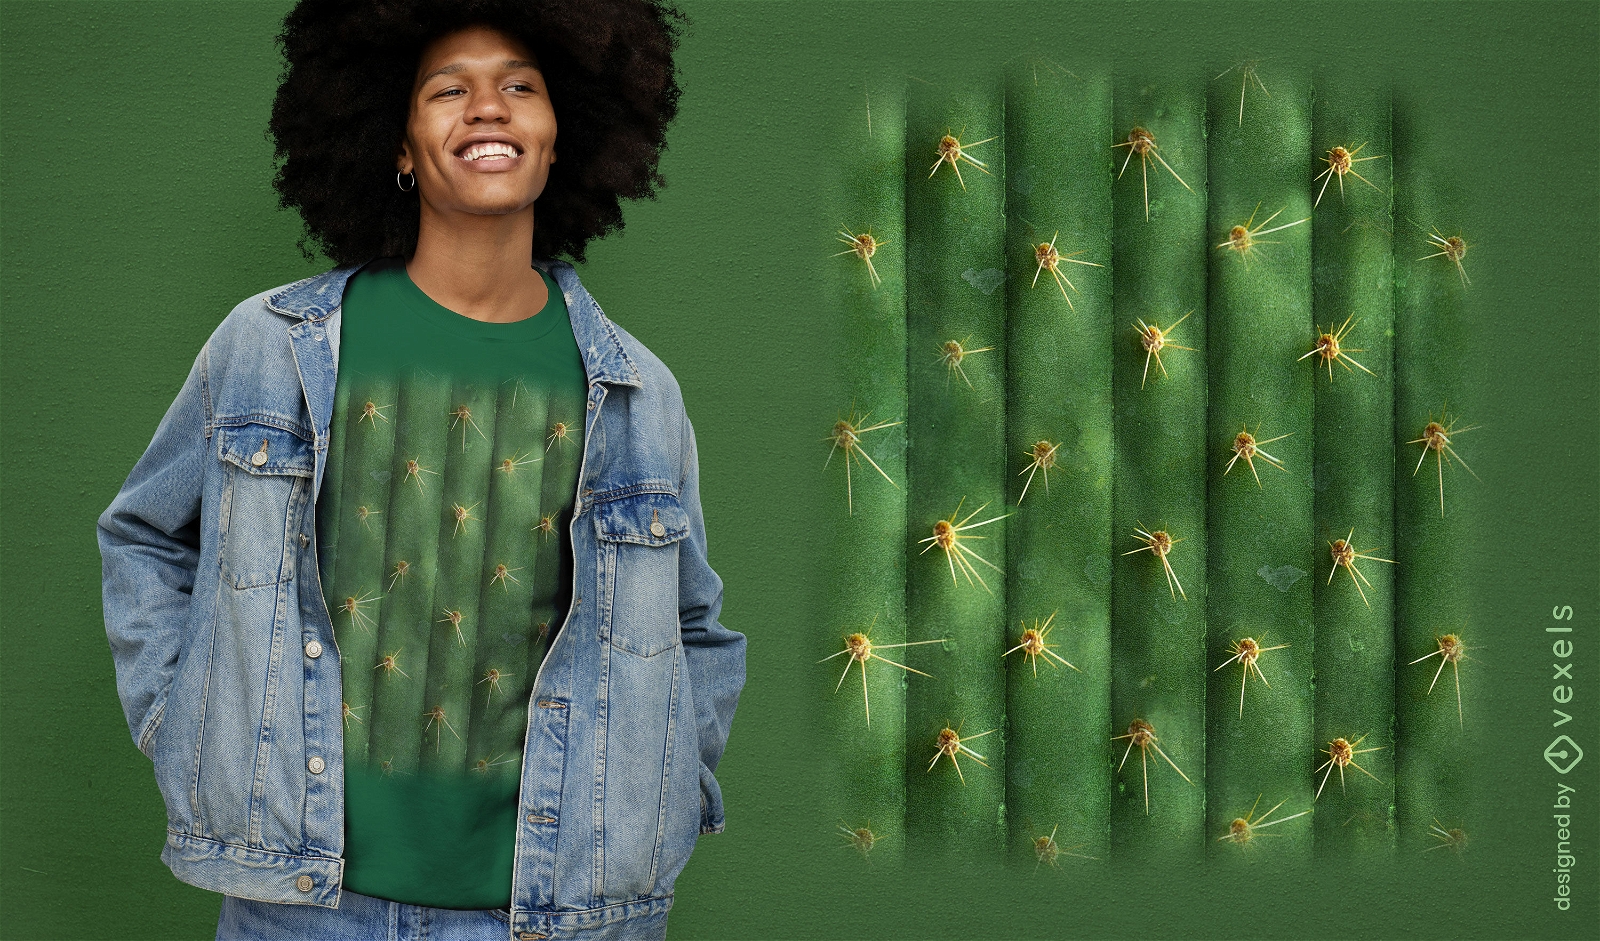
Design de camiseta de cacto realista
Escolha uma pasta
Todos os favoritos
Criar novo
Salvar
Design de camiseta de cacto realista
Pronto para imprimir
para Merch
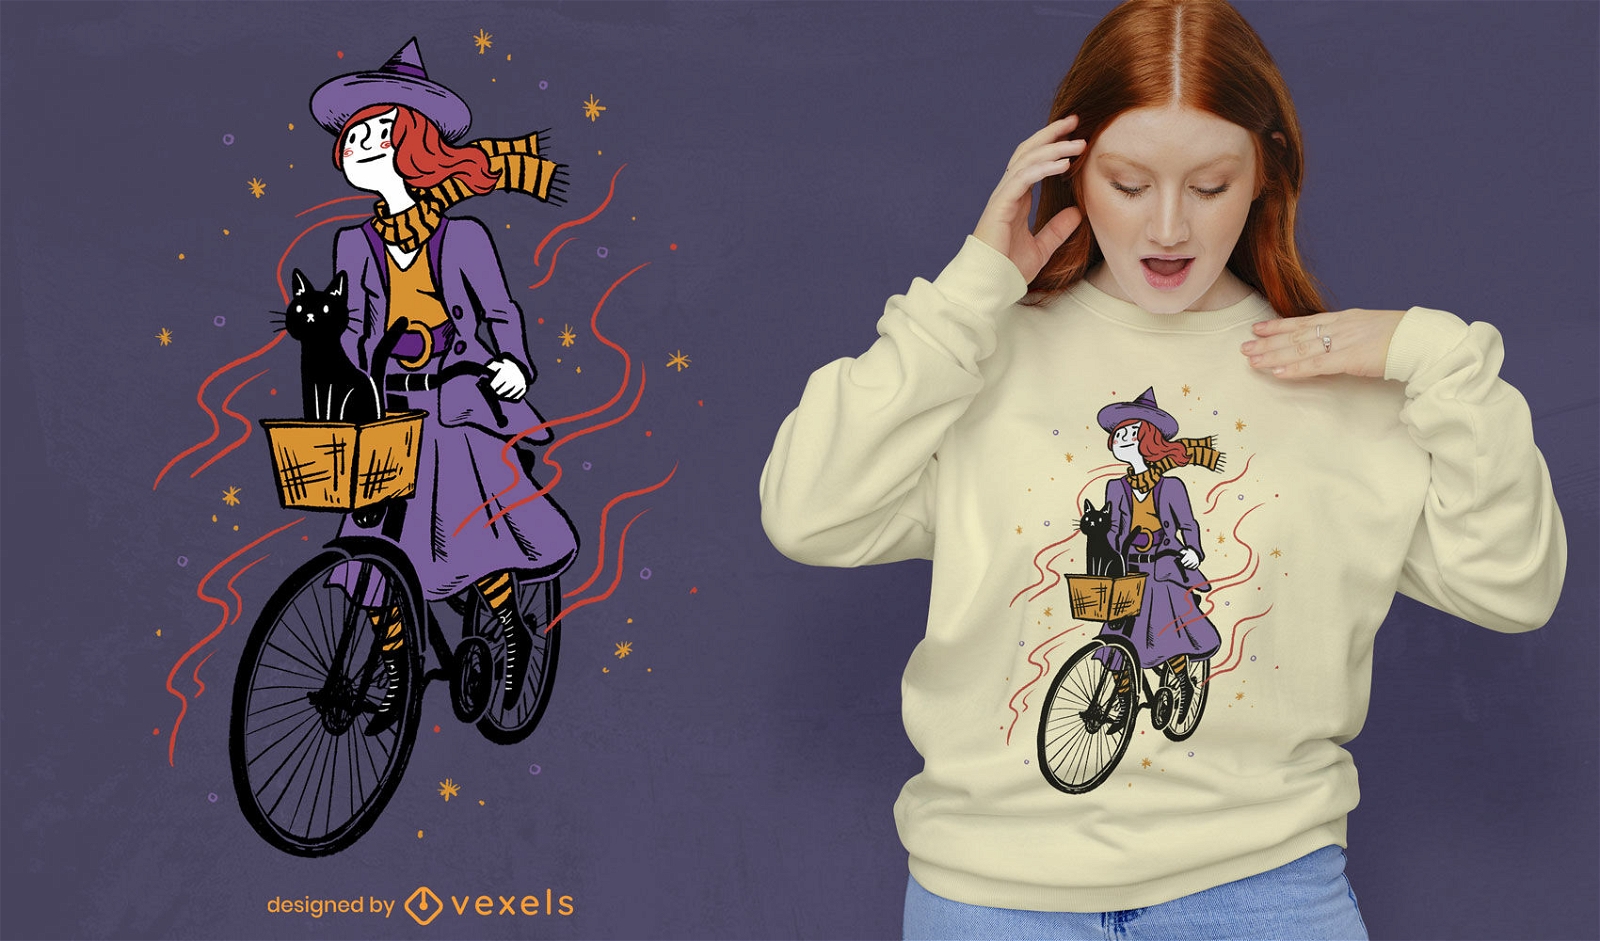
Bruxa andando de bicicleta com design psd de camiseta de gato
Escolha uma pasta
Todos os favoritos
Criar novo
Salvar
Bruxa andando de bicicleta com design psd de camiseta de gato
Pronto para imprimir
para Merch
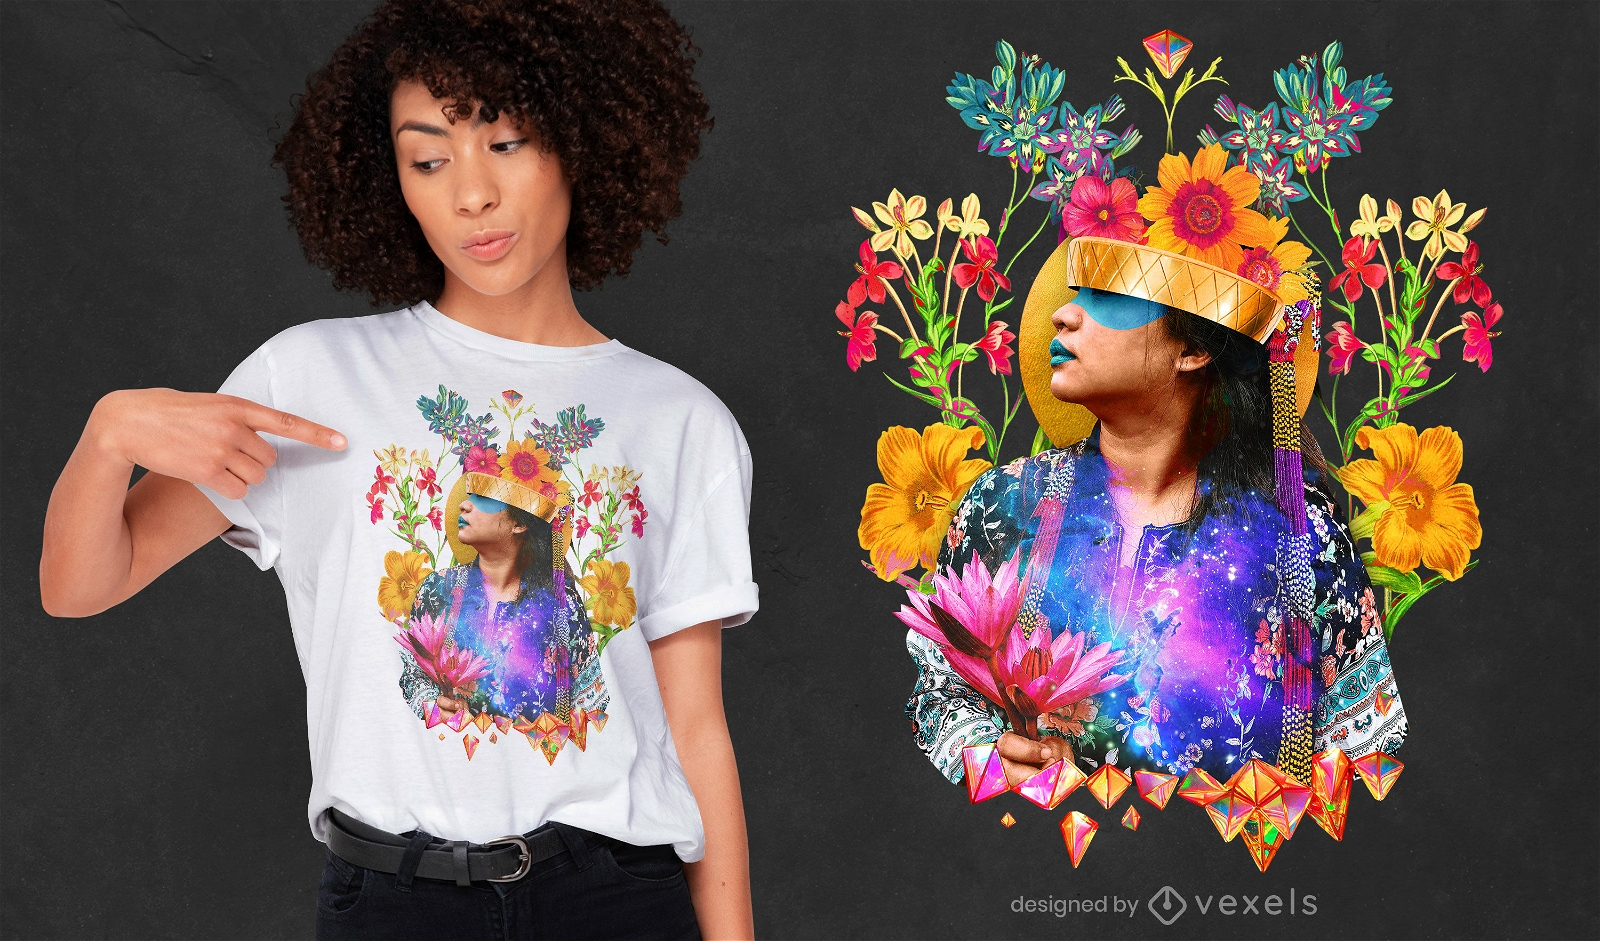
Design de t-shirt psd de menina com flores selvagens
Escolha uma pasta
Todos os favoritos
Criar novo
Salvar
Design de t-shirt psd de menina com flores selvagens
Camiseta PSD escalável
para Merch
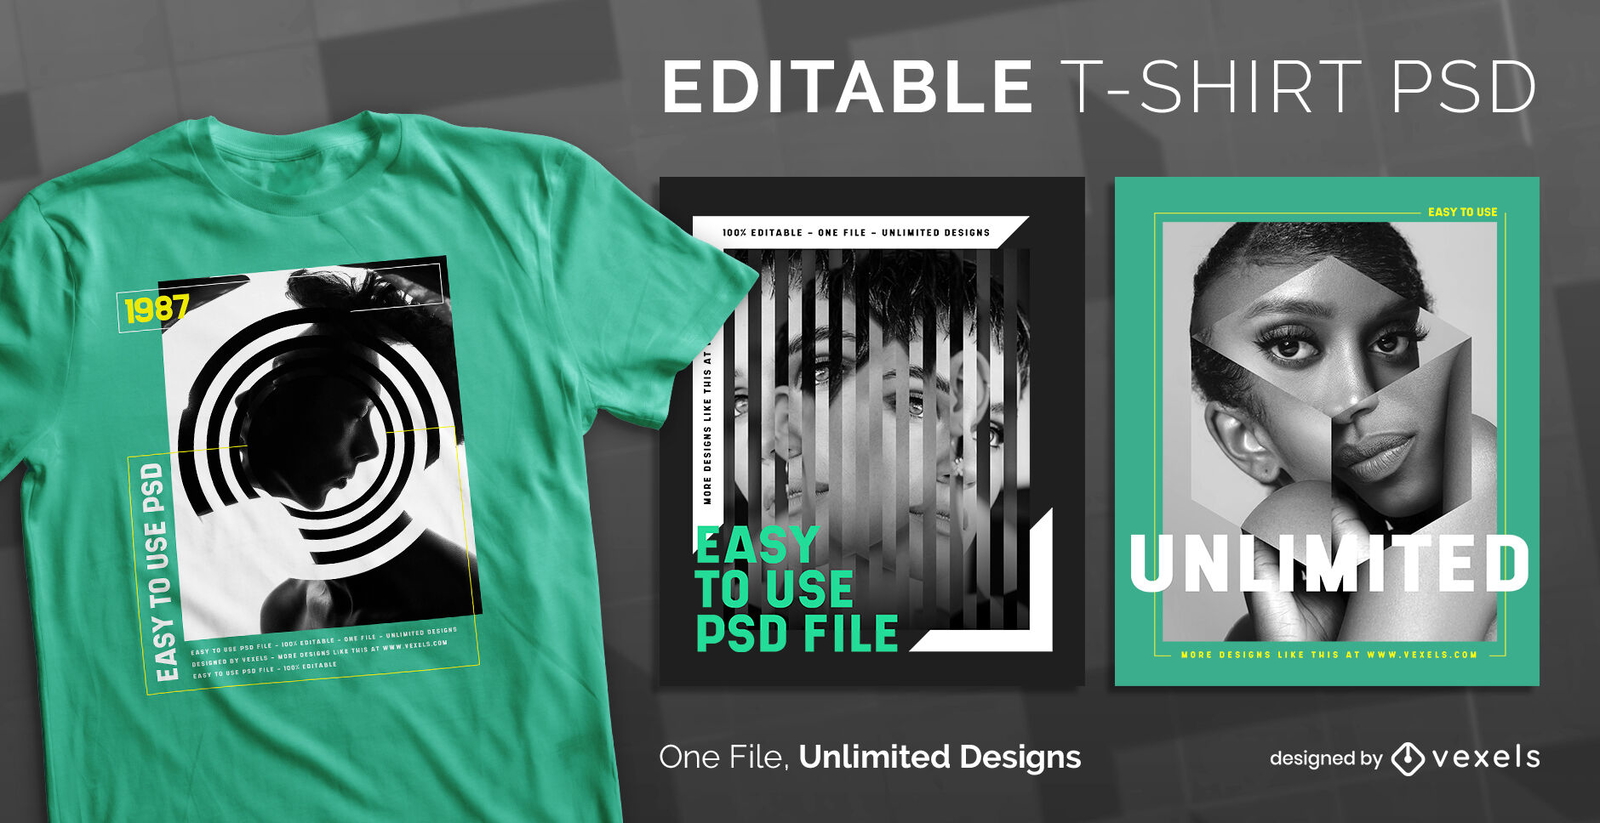
Pixels sobre imagem editável em t-shirt psd
Escolha uma pasta
Todos os favoritos
Criar novo
Salvar
Pixels sobre imagem editável em t-shirt psd
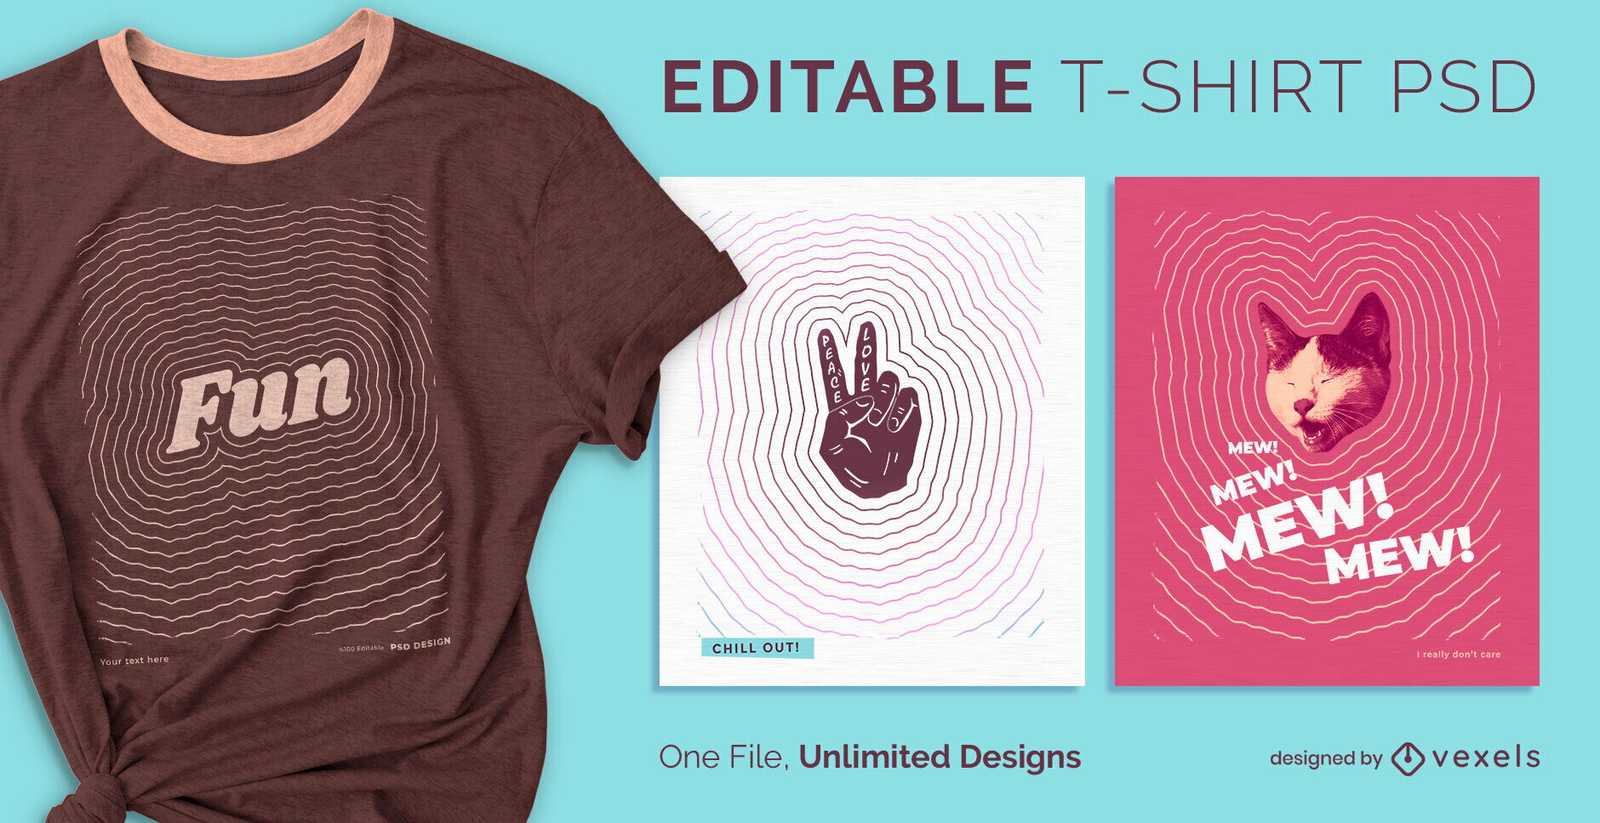
PSD Camisetas
para Merch
T-shirt psd escalável com linhas de traço
Escolha uma pasta
Todos os favoritos
Criar novo
Salvar
T-shirt psd escalável com linhas de traço
Camiseta PSD escalável
para Merch
Camiseta psd escalável com distorção geométrica
Escolha uma pasta
Todos os favoritos
Criar novo
Salvar
Camiseta psd escalável com distorção geométrica
Pronto para imprimir
para Merch
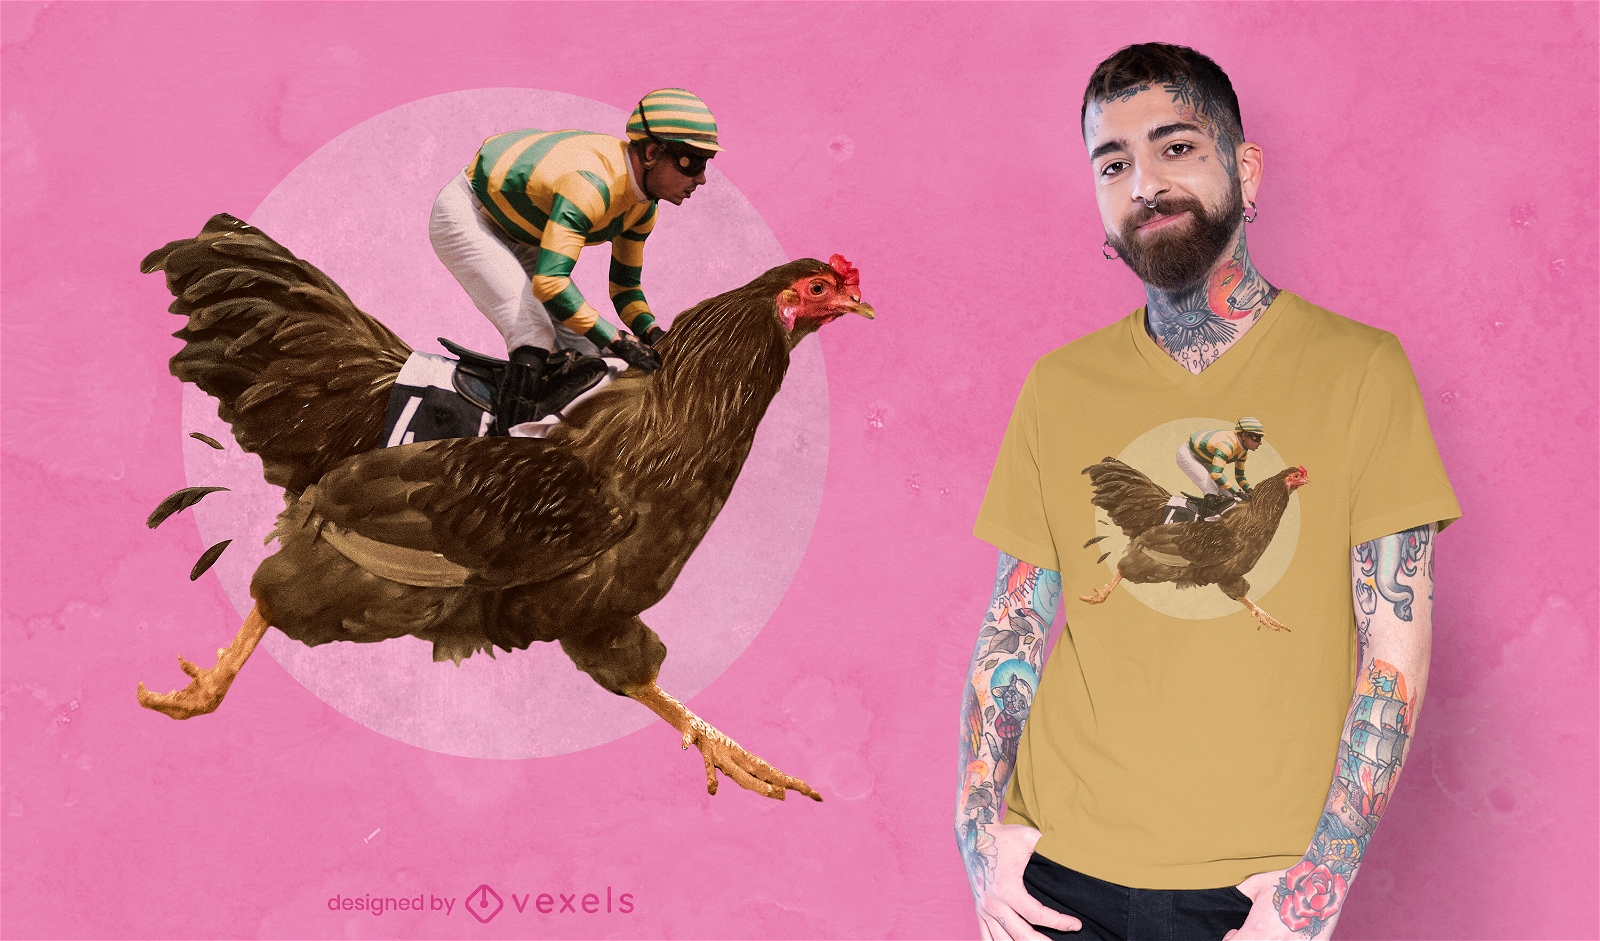
Homem montando frango design surreal de camiseta PSD
Escolha uma pasta
Todos os favoritos
Criar novo
Salvar
Homem montando frango design surreal de camiseta PSD
Pronto para imprimir
para Merch
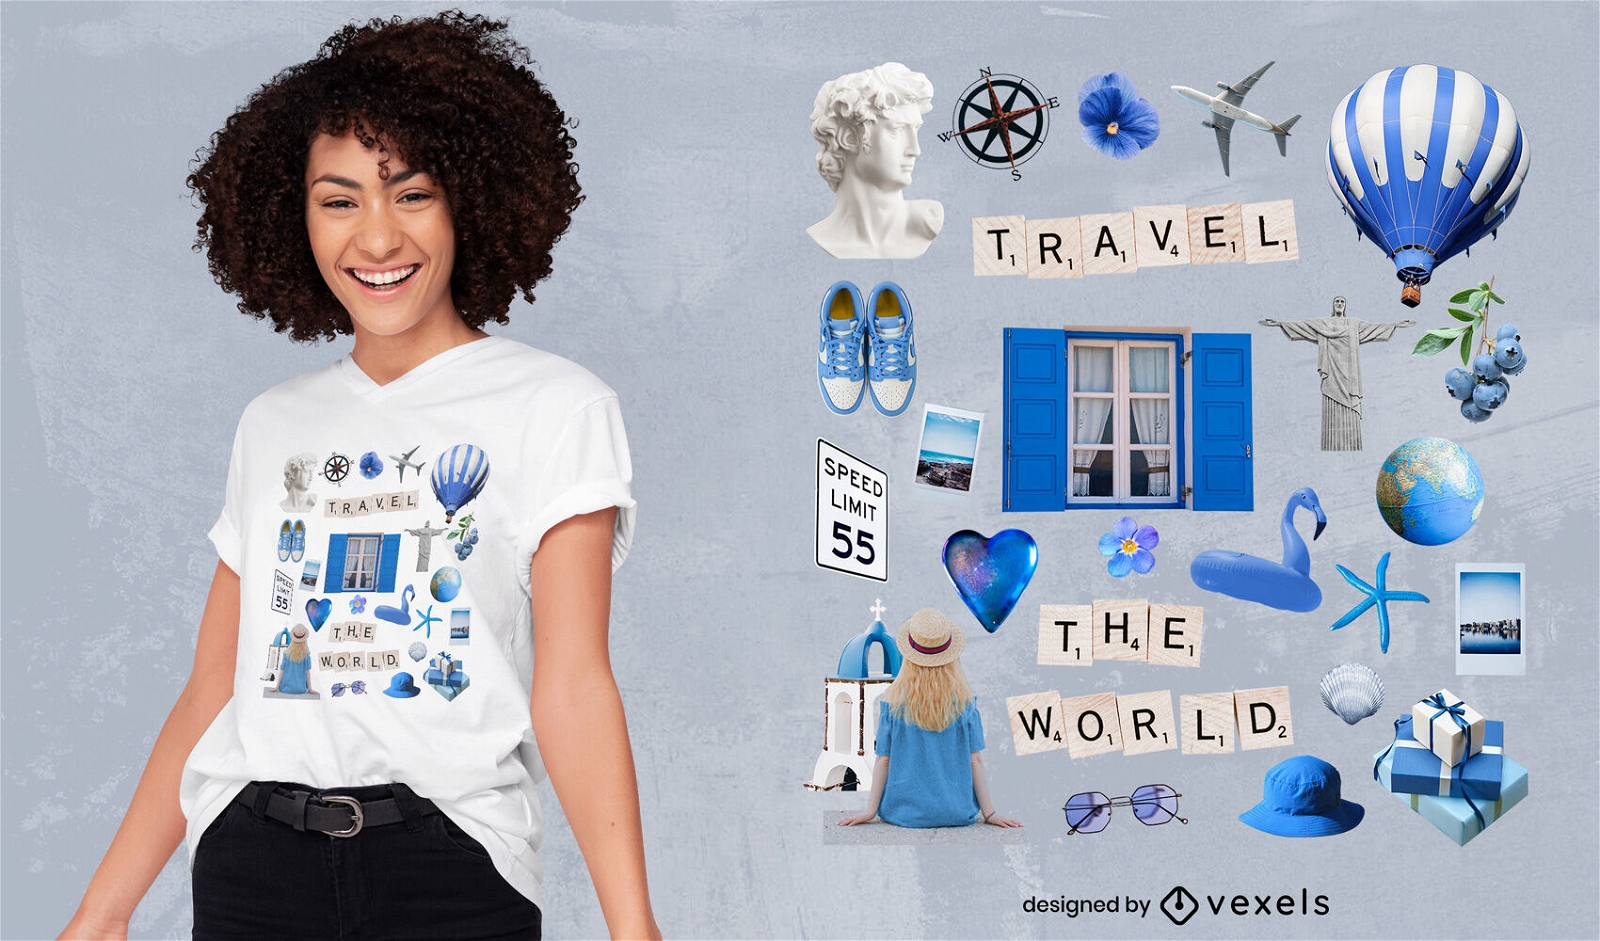
Design de t-shirt azul PSD de elementos de viagem
Escolha uma pasta
Todos os favoritos
Criar novo
Salvar
Design de t-shirt azul PSD de elementos de viagem
Camiseta PSD escalável
para Merch
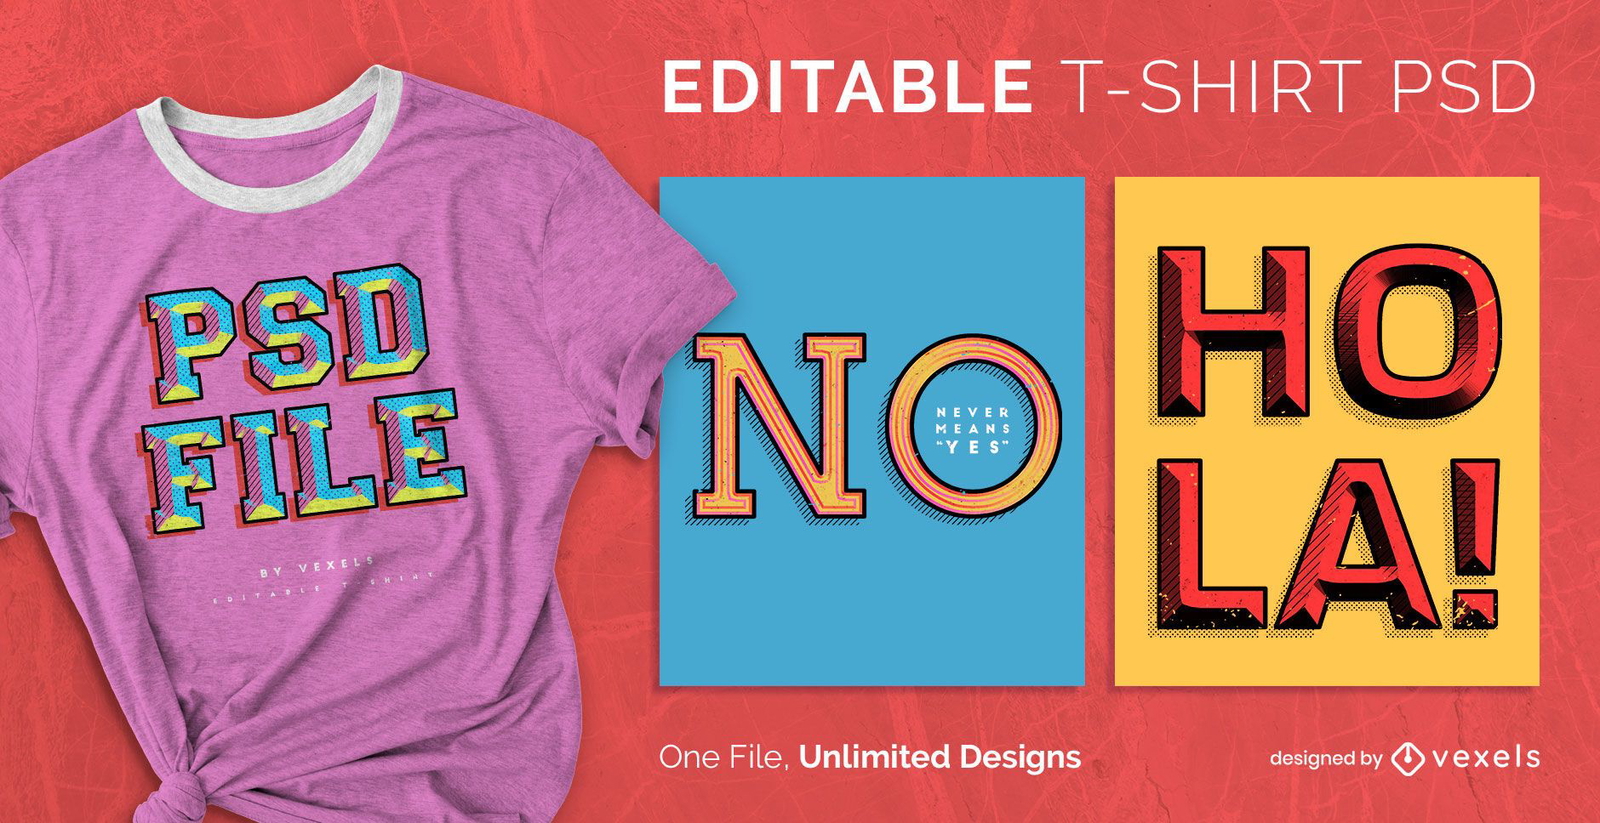
Design de t-shirt escalonável PSD com efeito de texto retro
Escolha uma pasta
Todos os favoritos
Criar novo
Salvar
Design de t-shirt escalonável PSD com efeito de texto retro
Camiseta PSD escalável
para Merch
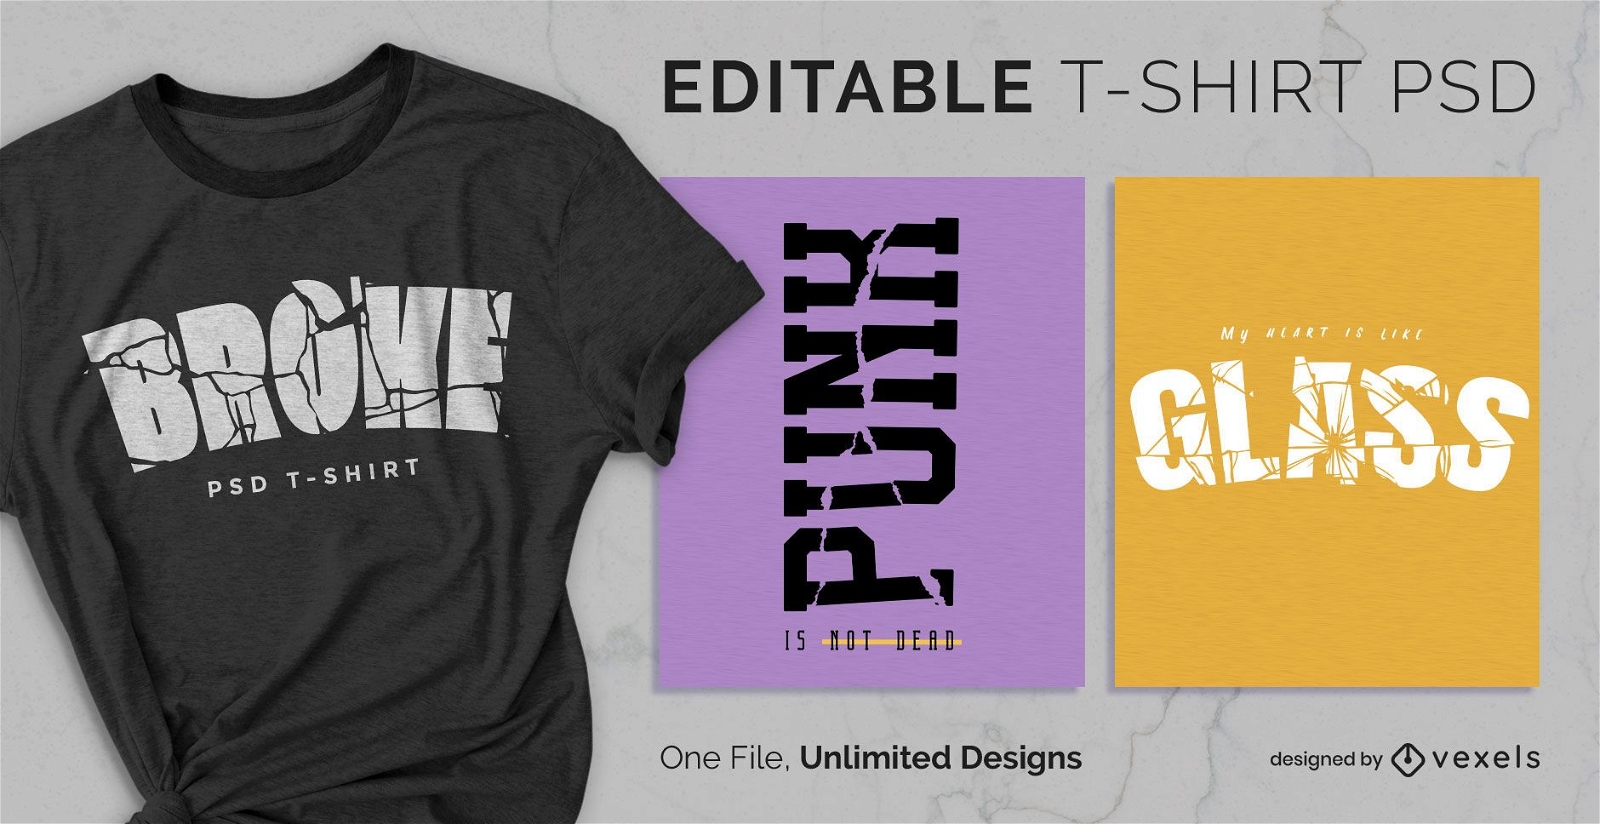
T-shirt escalonável de vidro quebrado psd
Escolha uma pasta
Todos os favoritos
Criar novo
Salvar
T-shirt escalonável de vidro quebrado psd
Camiseta PSD escalável
para Merch
Camiseta escalável urbana psd
Escolha uma pasta
Todos os favoritos
Criar novo
Salvar
Camiseta escalável urbana psd
Camiseta PSD escalável
para Merch
design de camiseta de texto 3d psd
Escolha uma pasta
Todos os favoritos
Criar novo
Salvar
design de camiseta de texto 3d psd
Camiseta PSD escalável
para Merch
Emblema oval com design de t-shirt personalizado PSD
Escolha uma pasta
Todos os favoritos
Criar novo
Salvar
Emblema oval com design de t-shirt personalizado PSD
Gerado por IA, selecionado por nossos designers.
para Merch
Design de camiseta para evento de eclipse solar
Escolha uma pasta
Todos os favoritos
Criar novo
Salvar
Design de camiseta para evento de eclipse solar
Gerado por IA, selecionado por nossos designers.
para Merch
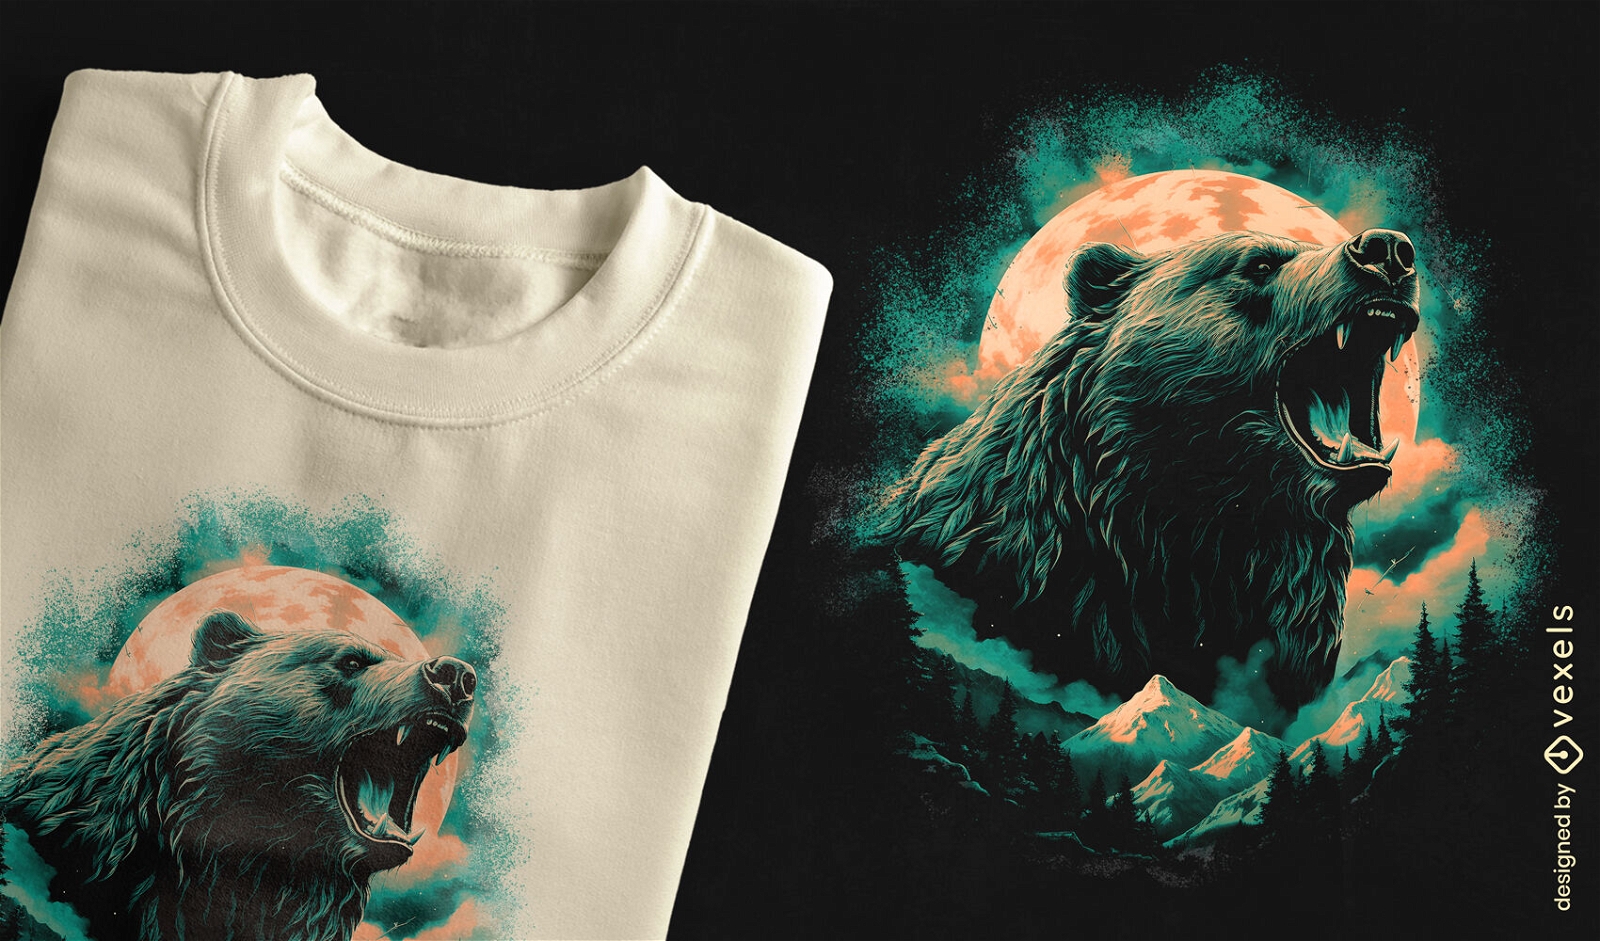
Design de camiseta de urso rugindo nas montanhas
Escolha uma pasta
Todos os favoritos
Criar novo
Salvar
Design de camiseta de urso rugindo nas montanhas
Pronto para imprimir
para Merch
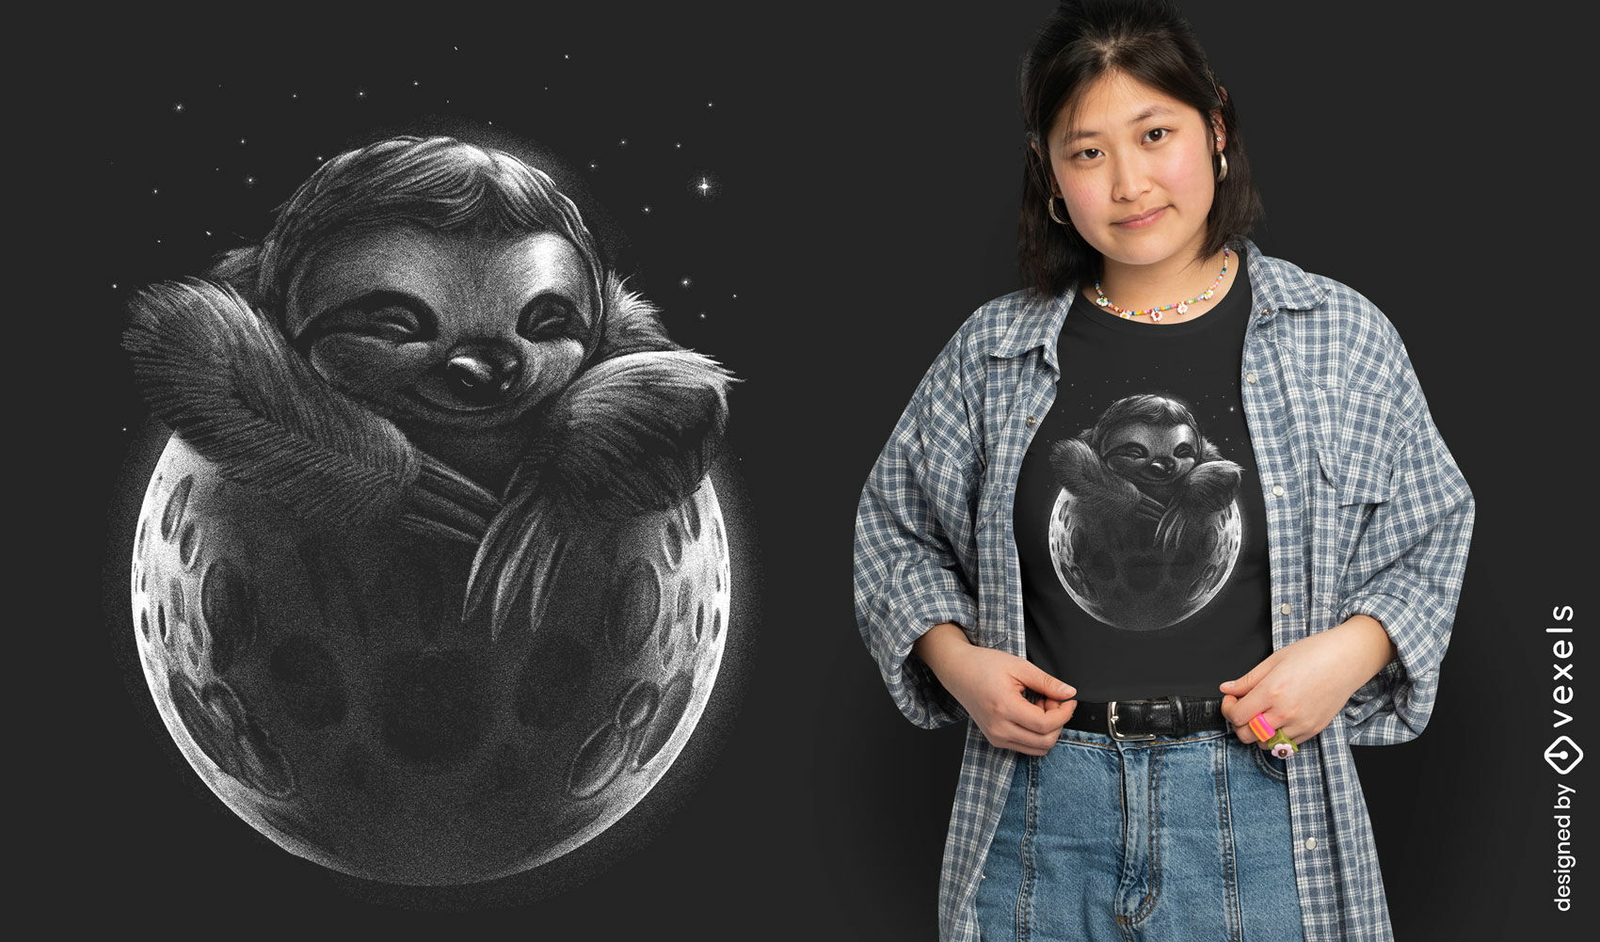
Preguiça dormindo no design da camiseta da lua
Escolha uma pasta
Todos os favoritos
Criar novo
Salvar
Preguiça dormindo no design da camiseta da lua
Pronto para imprimir
para Merch
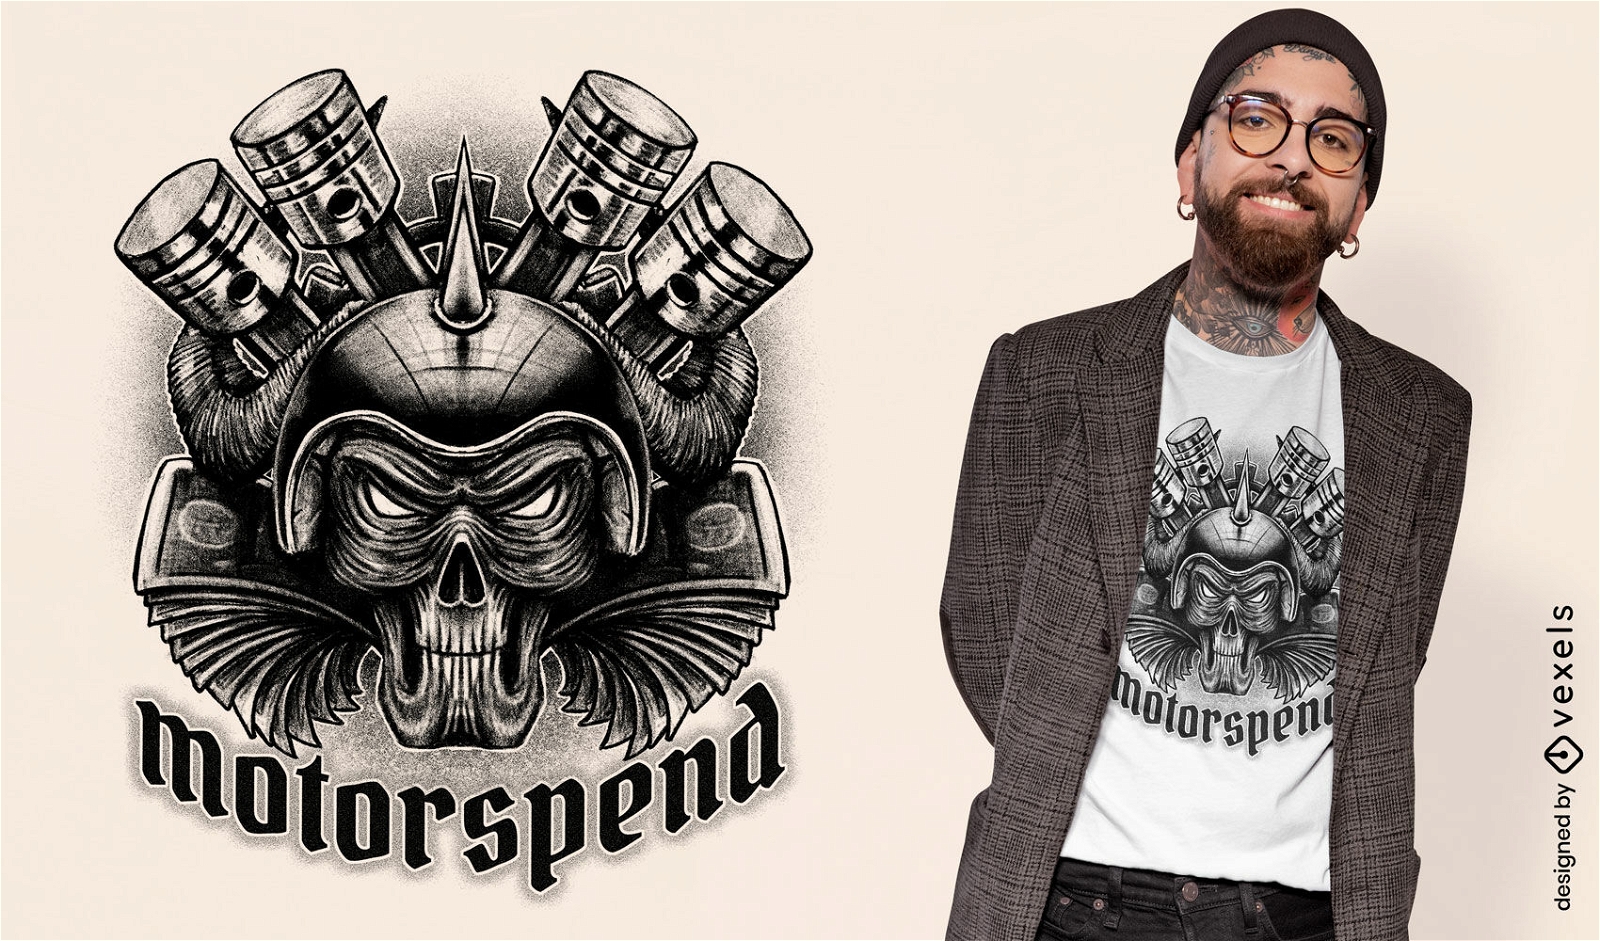
Design de camiseta de metal do monstro do motor
Escolha uma pasta
Todos os favoritos
Criar novo
Salvar
Design de camiseta de metal do monstro do motor
Pronto para imprimir
para Merch
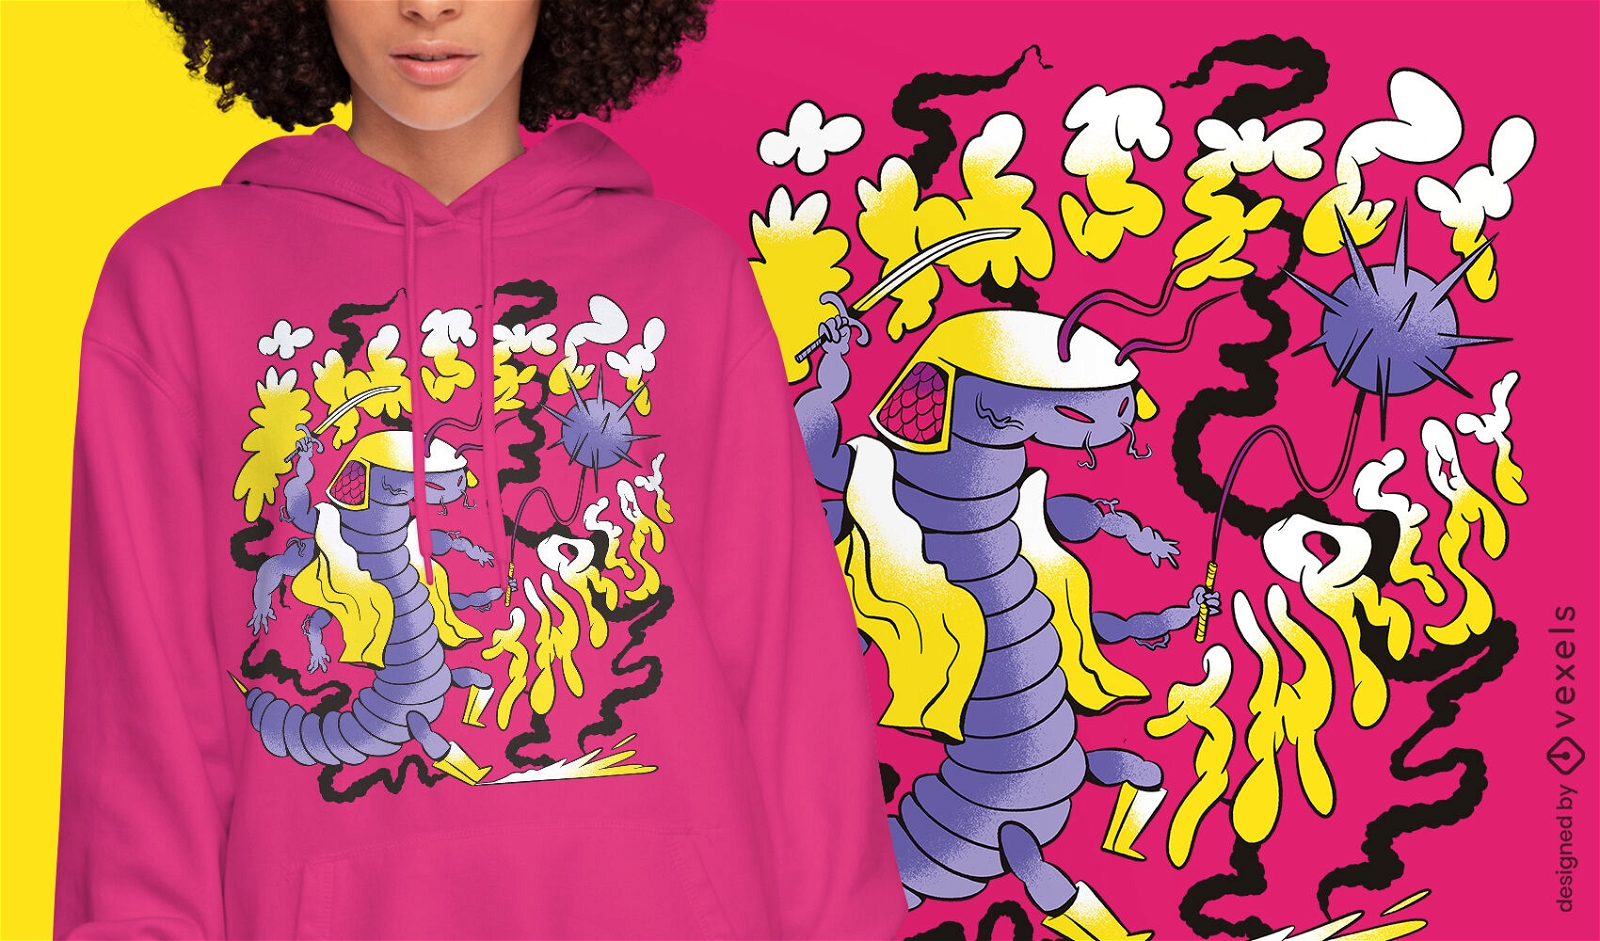
Camiseta Caterpillar inseto guerreiro psd
Escolha uma pasta
Todos os favoritos
Criar novo
Salvar
Camiseta Caterpillar inseto guerreiro psd
Pronto para imprimir
para Merch
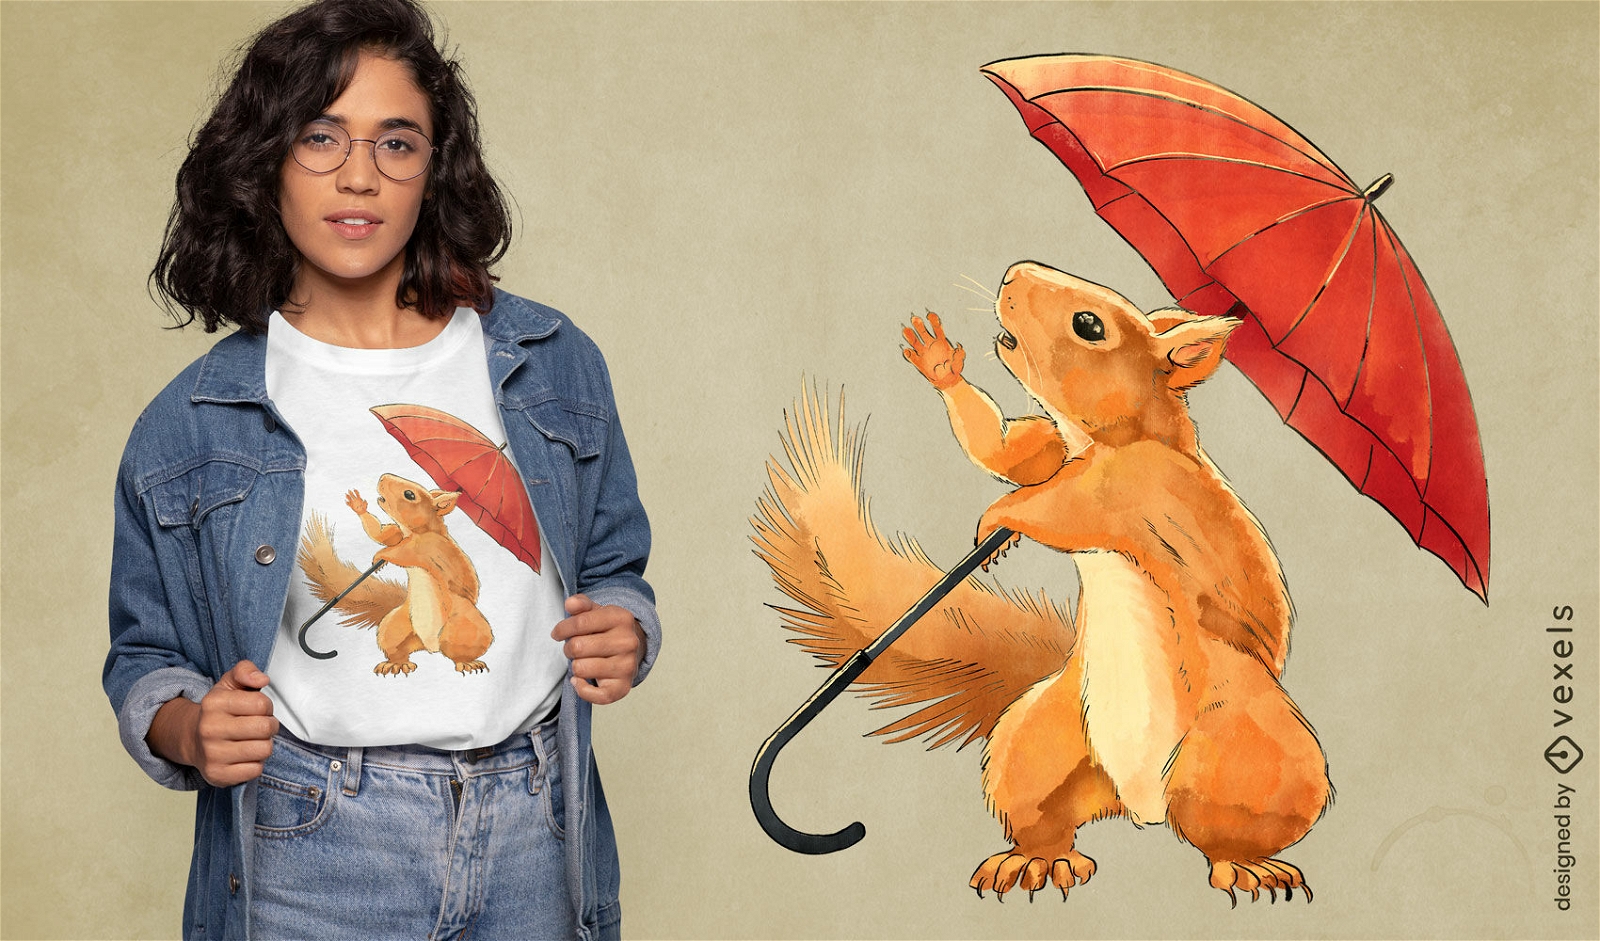
Esquilo aquarela segurando design de camiseta de guarda-chuva
Escolha uma pasta
Todos os favoritos
Criar novo
Salvar
Esquilo aquarela segurando design de camiseta de guarda-chuva
Pronto para imprimir
para Merch
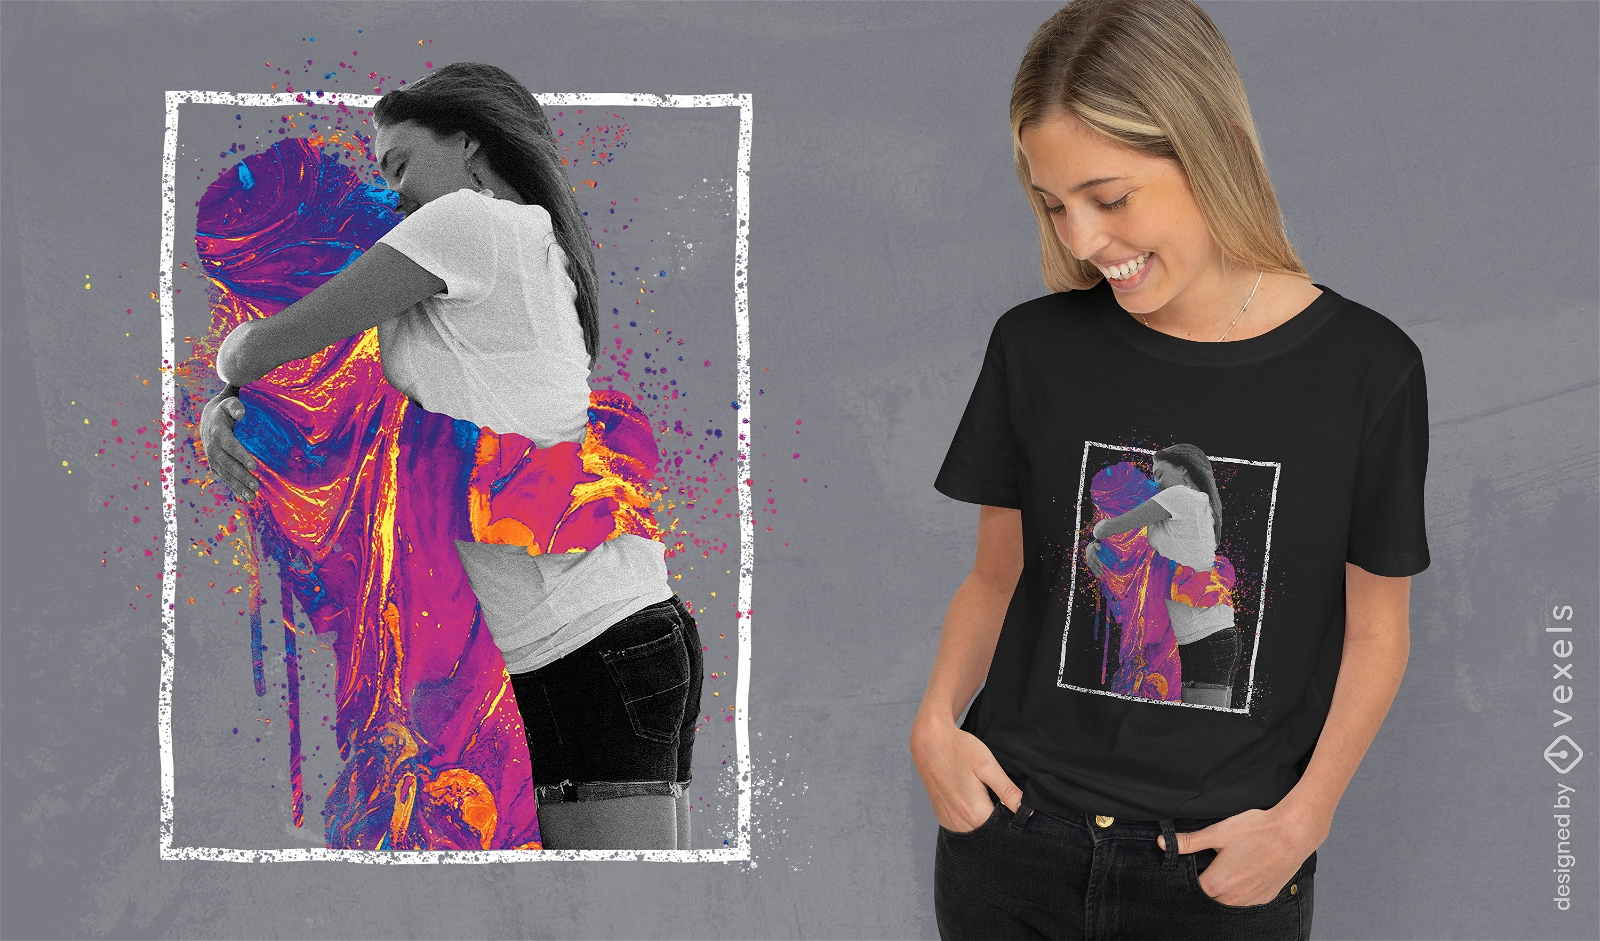
Casal se beijando com t-shirt de salpicos de tinta psd
Escolha uma pasta
Todos os favoritos
Criar novo
Salvar
Casal se beijando com t-shirt de salpicos de tinta psd
texto editável
Pronto para imprimir
para Merch
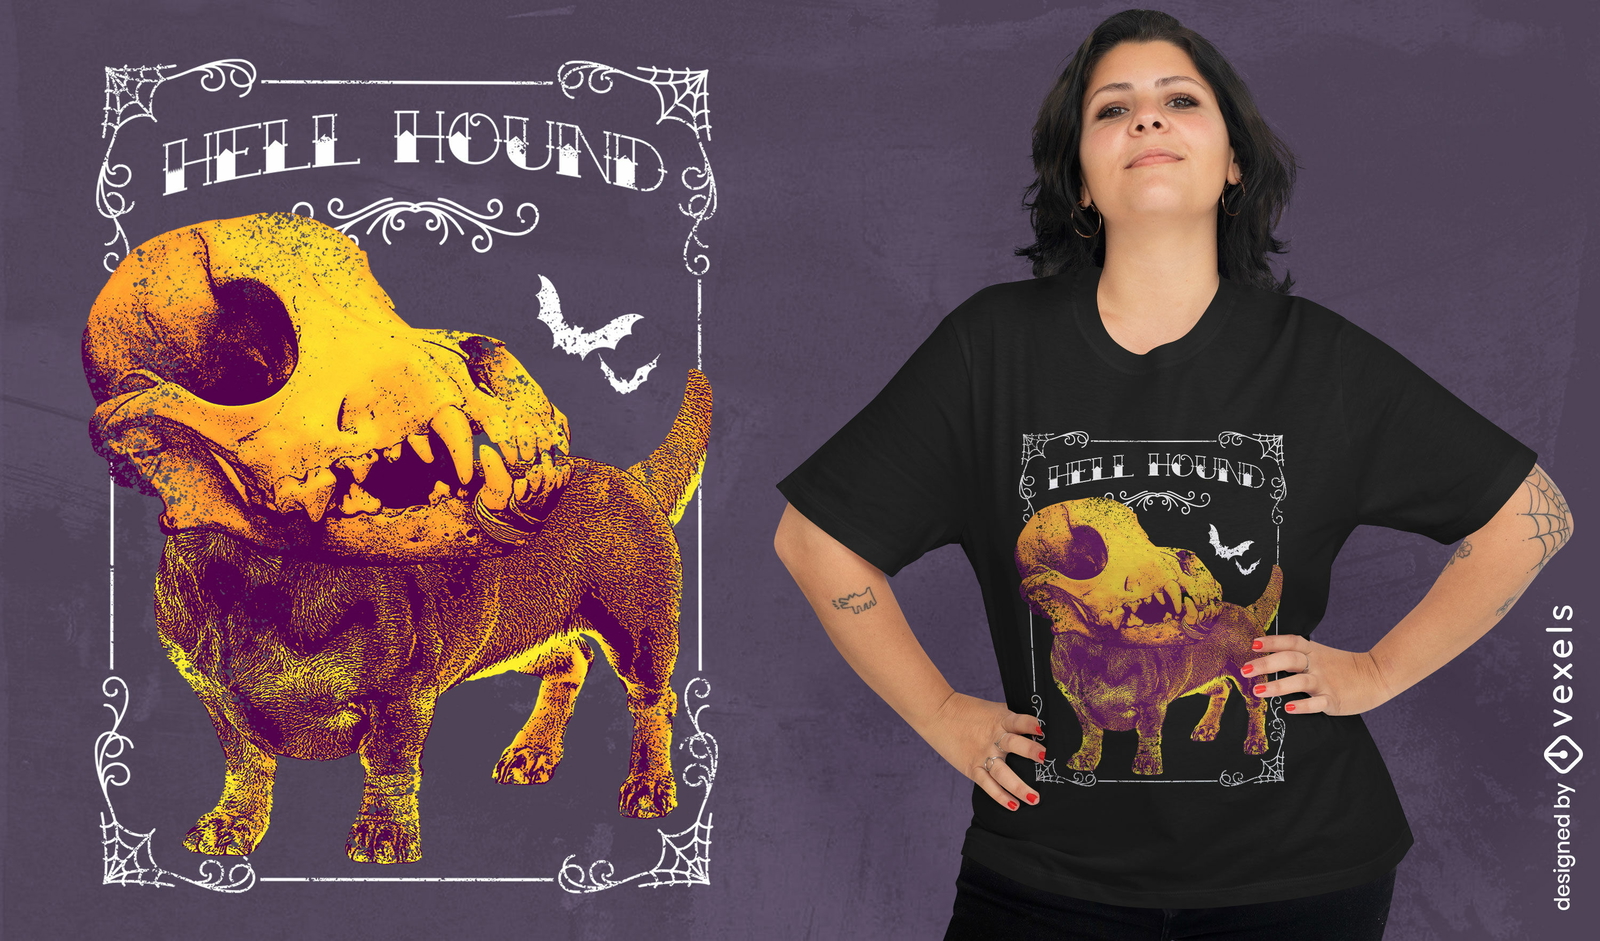
Cão com camiseta de caveira de dinossauro psd
Escolha uma pasta
Todos os favoritos
Criar novo
Salvar
Cão com camiseta de caveira de dinossauro psd
texto editável
Pronto para imprimir
para Merch
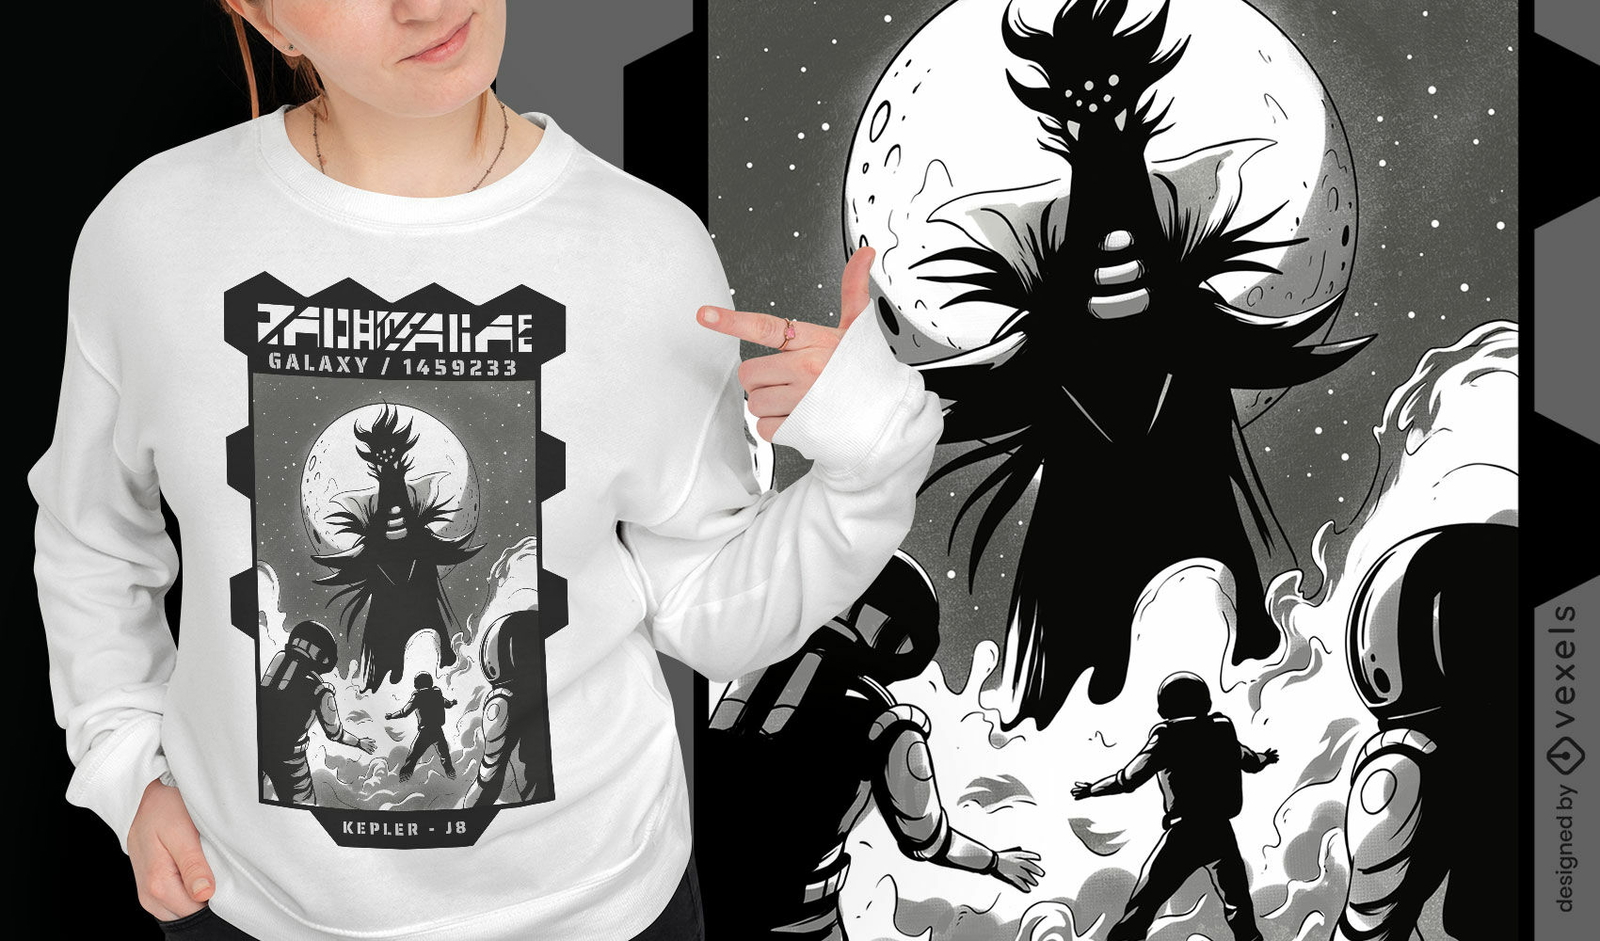
Design de camiseta de alienígenas e astronautas gigantes
Escolha uma pasta
Todos os favoritos
Criar novo
Salvar
Design de camiseta de alienígenas e astronautas gigantes
Pronto para imprimir
para Merch
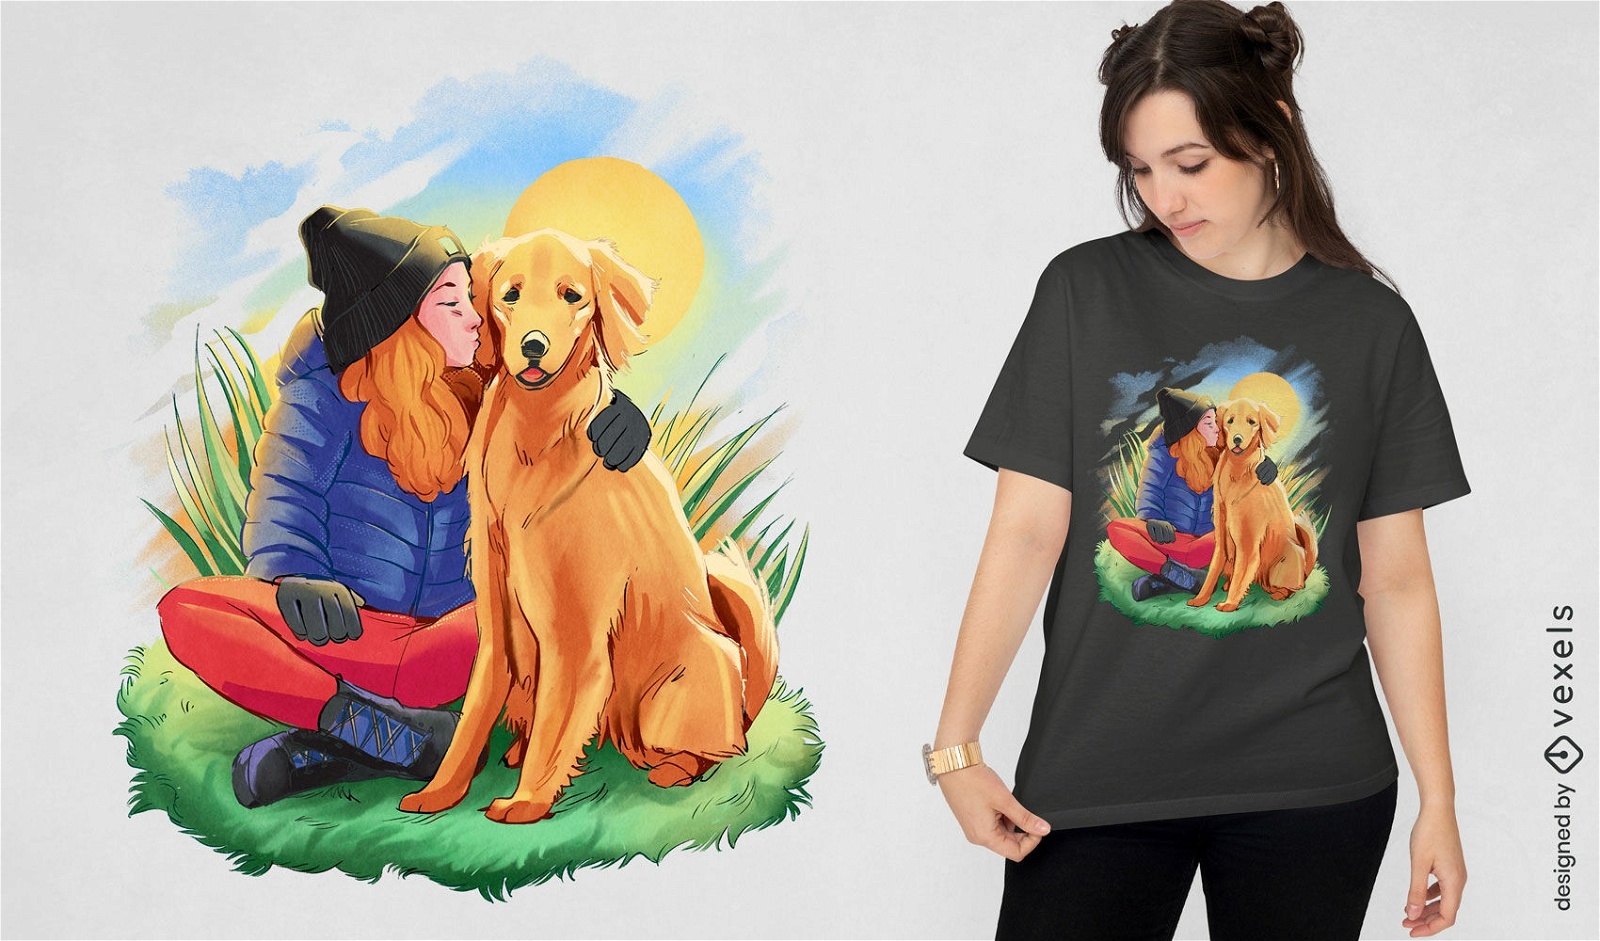
Garota com design de camiseta de cachorro golden retriever
Escolha uma pasta
Todos os favoritos
Criar novo
Salvar
Garota com design de camiseta de cachorro golden retriever
Pronto para imprimir
para Merch
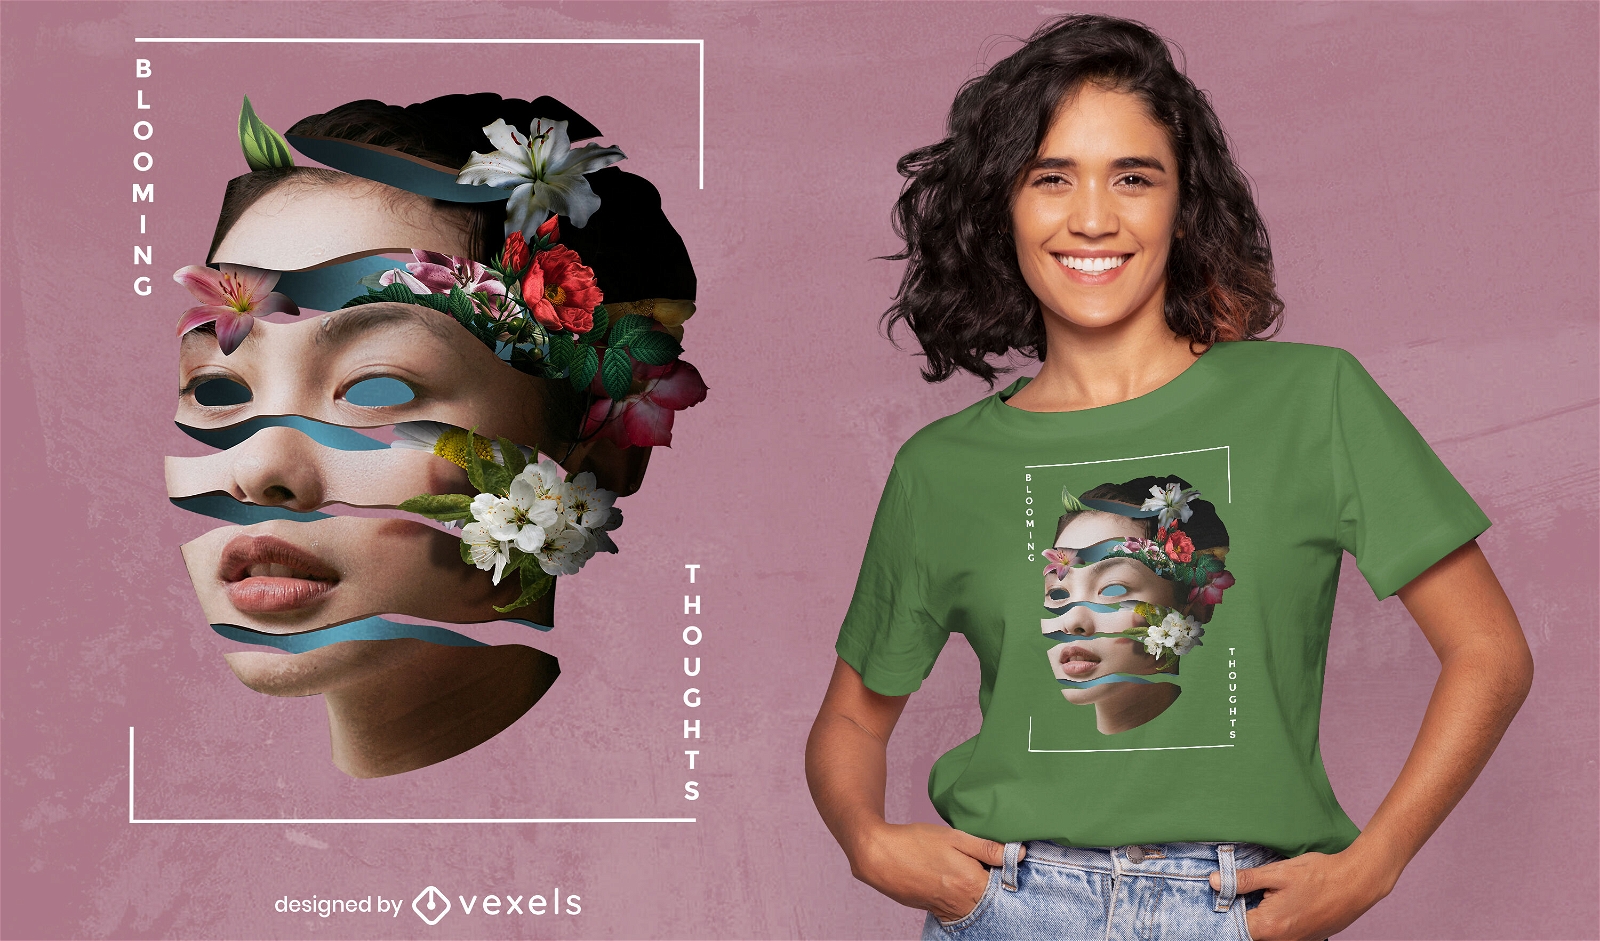
Camiseta feminina com rosto floral torcido psd
Escolha uma pasta
Todos os favoritos
Criar novo
Salvar
Camiseta feminina com rosto floral torcido psd
Pronto para imprimir
para Merch
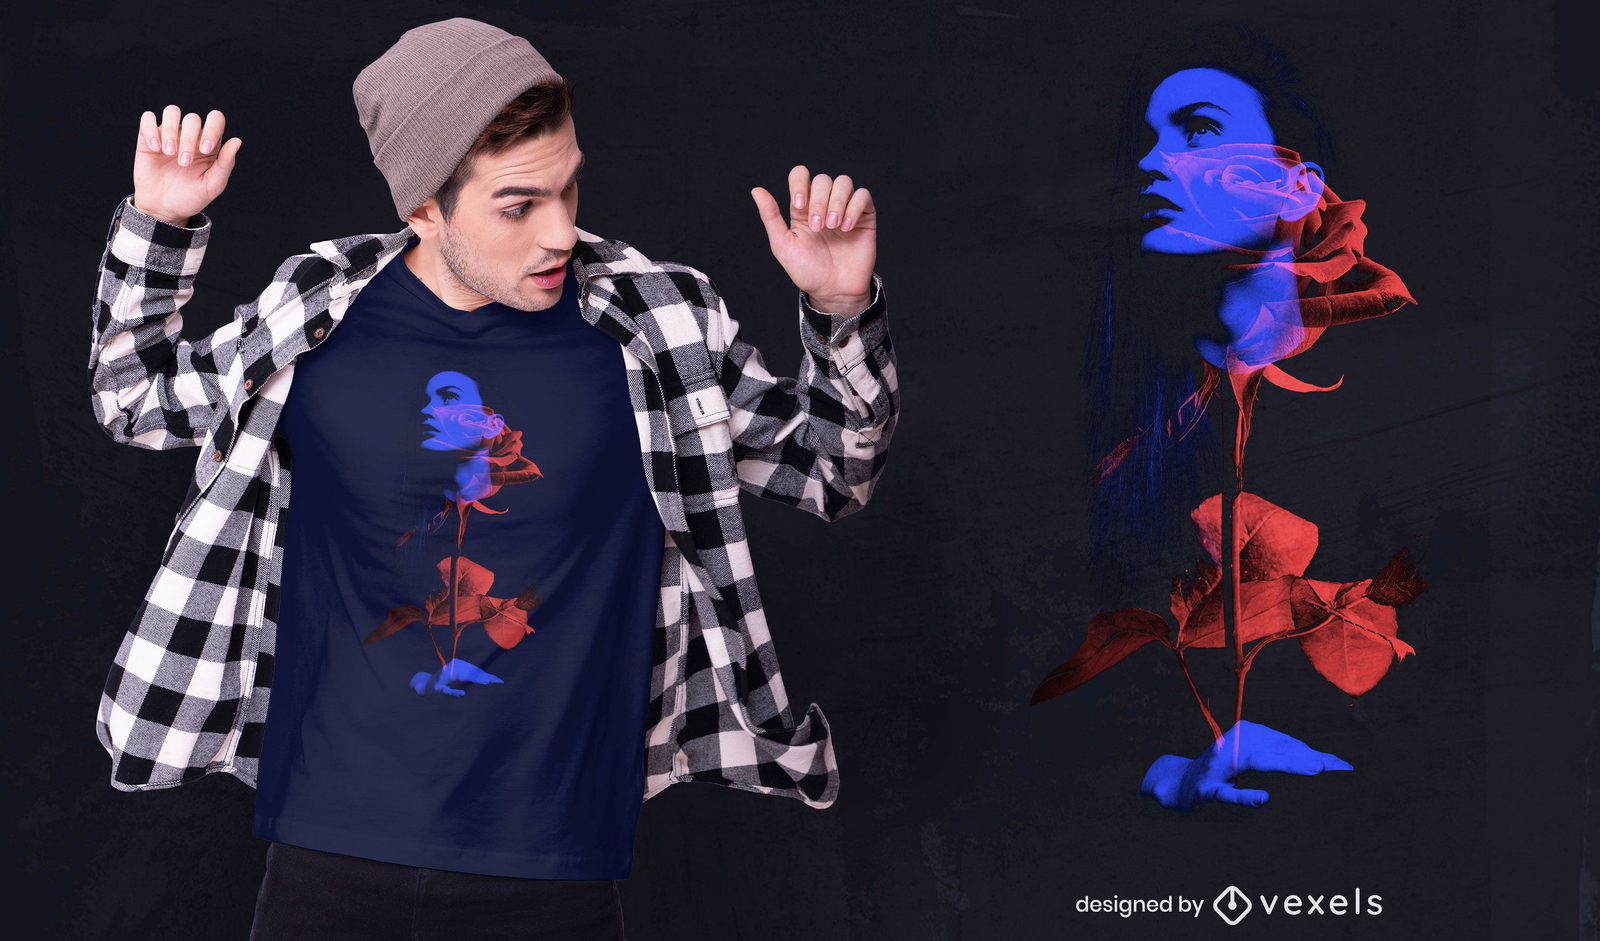
Design de t-shirt psd de dupla exposição feminina e rosa
Escolha uma pasta
Todos os favoritos
Criar novo
Salvar
Design de t-shirt psd de dupla exposição feminina e rosa
Pronto para imprimir
para Merch
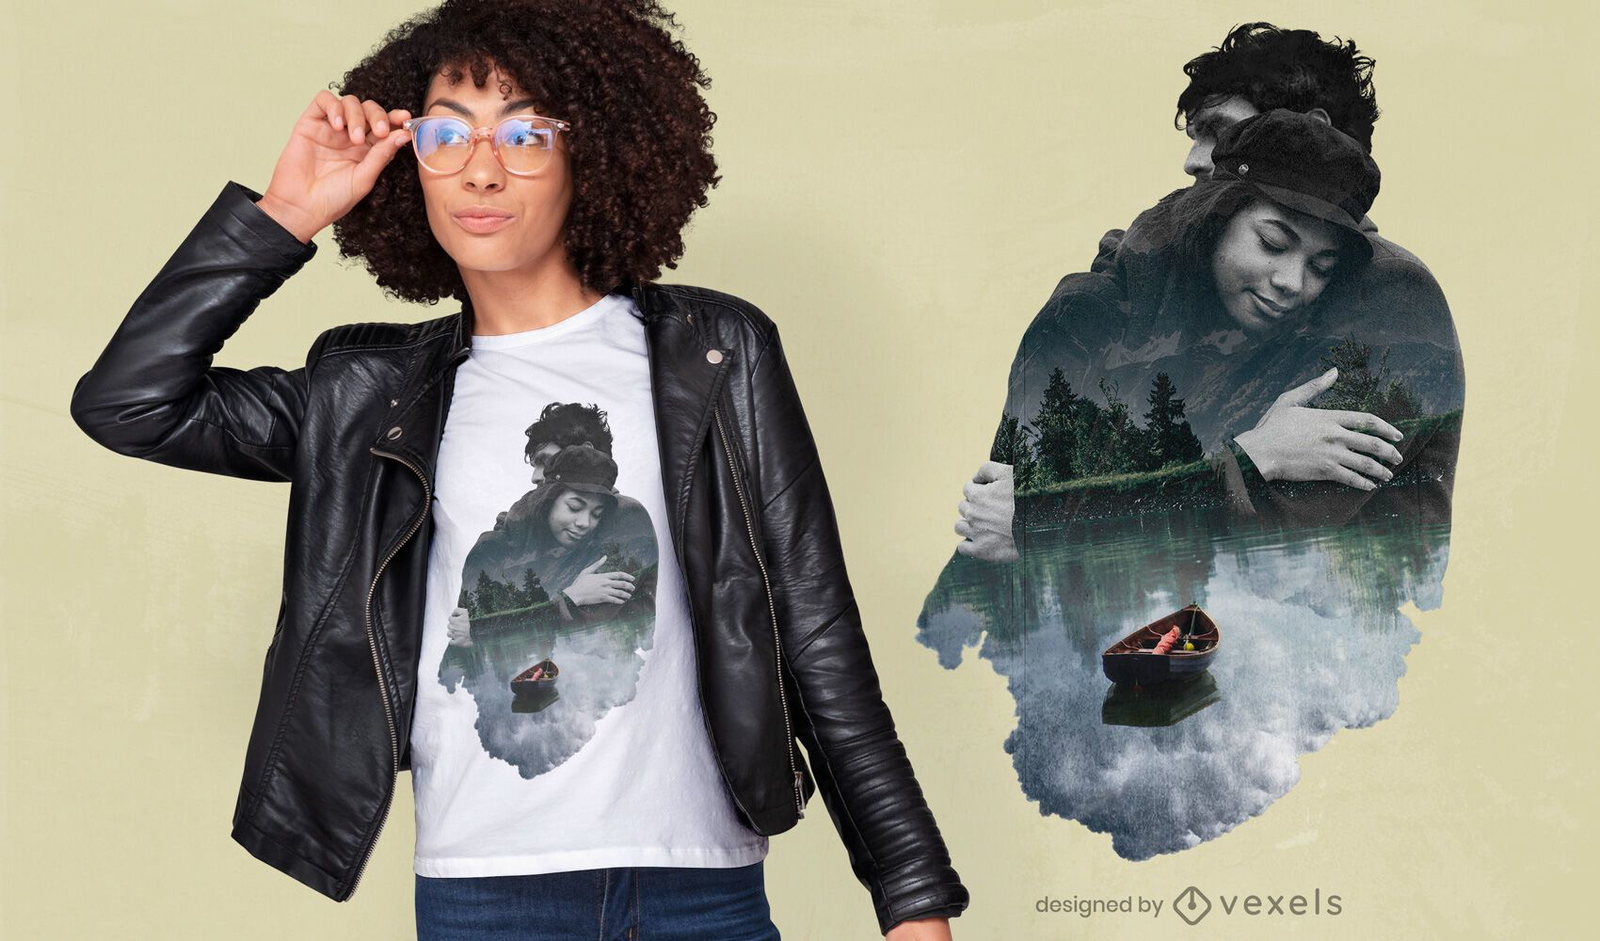
Casal abraçando t-shirt PSD de dupla exposição
Escolha uma pasta
Todos os favoritos
Criar novo
Salvar
Casal abraçando t-shirt PSD de dupla exposição
Camiseta PSD escalável
para Merch
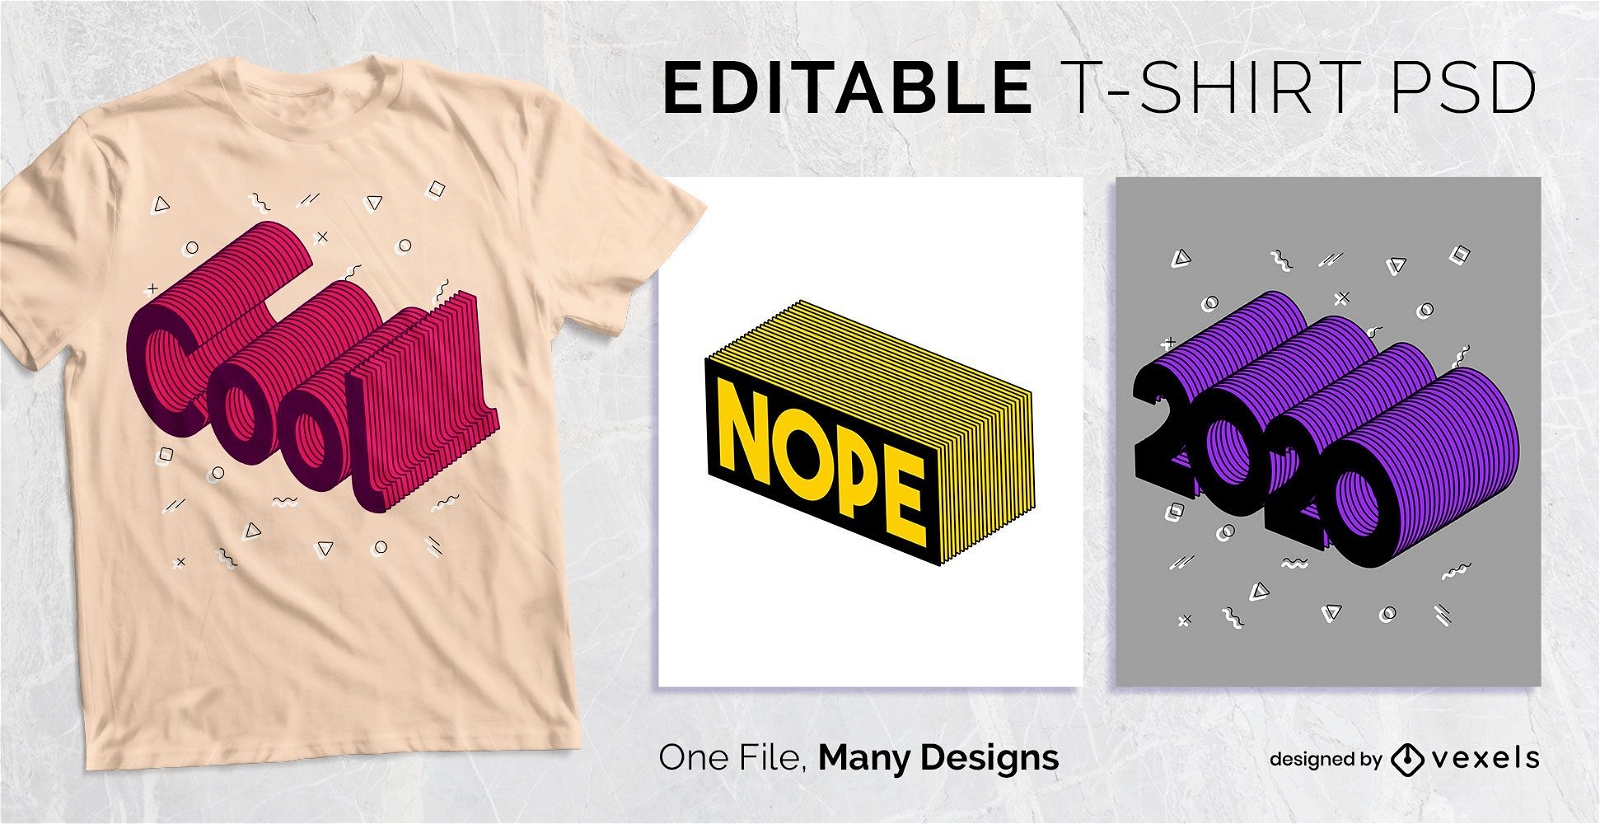
3D Stroke Text T-shirt Design PSD
Escolha uma pasta
Todos os favoritos
Criar novo
Salvar
3D Stroke Text T-shirt Design PSD
Pronto para imprimir
para Merch
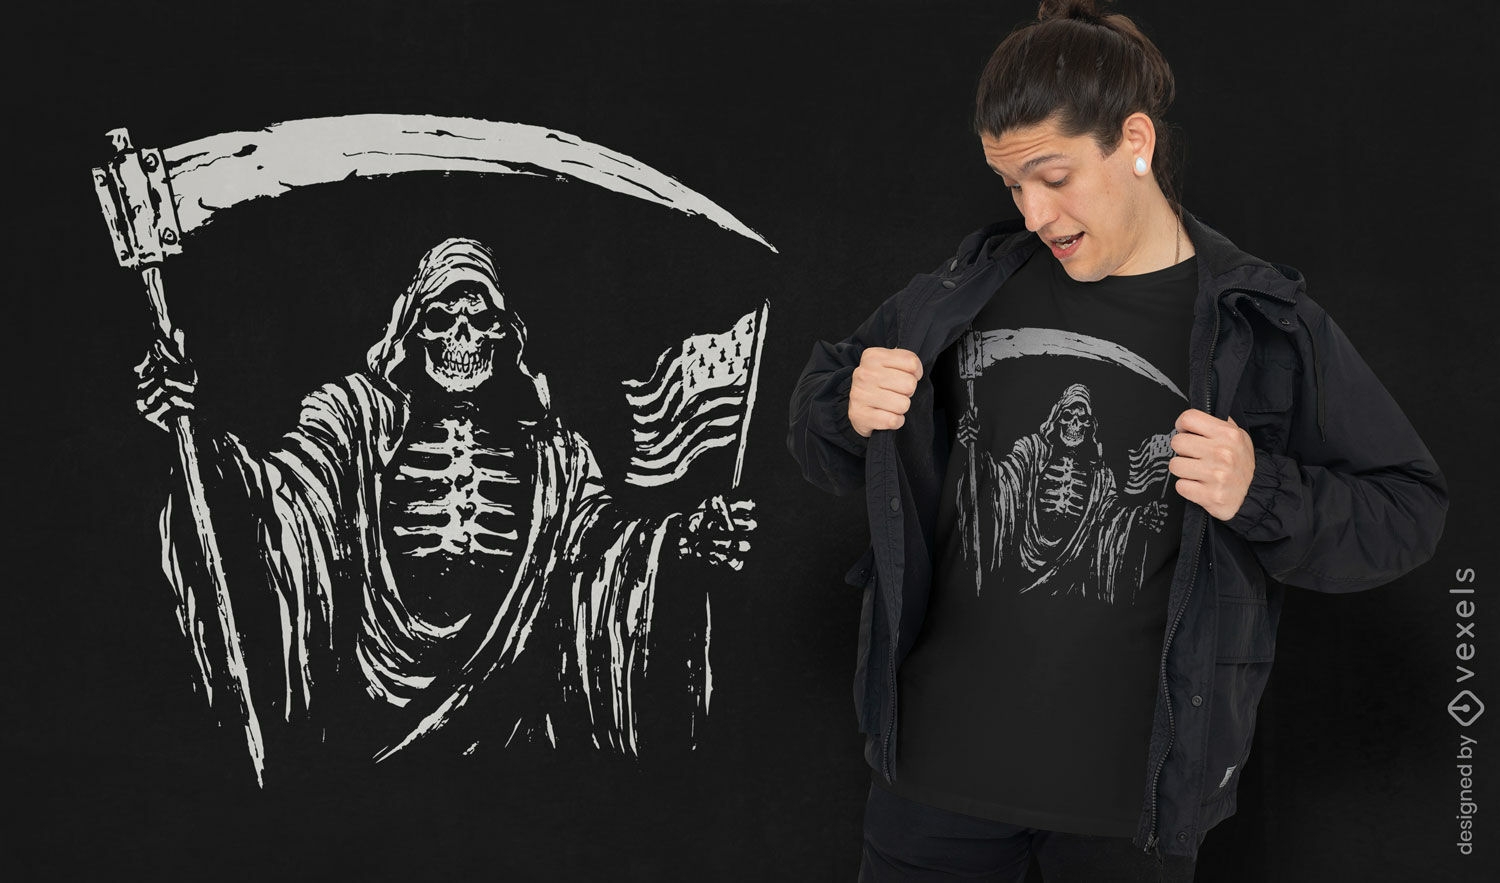
Design de camiseta com bandeira dos EUA do Grim Reaper
Escolha uma pasta
Todos os favoritos
Criar novo
Salvar
Design de camiseta com bandeira dos EUA do Grim Reaper
Pronto para imprimir
para Merch
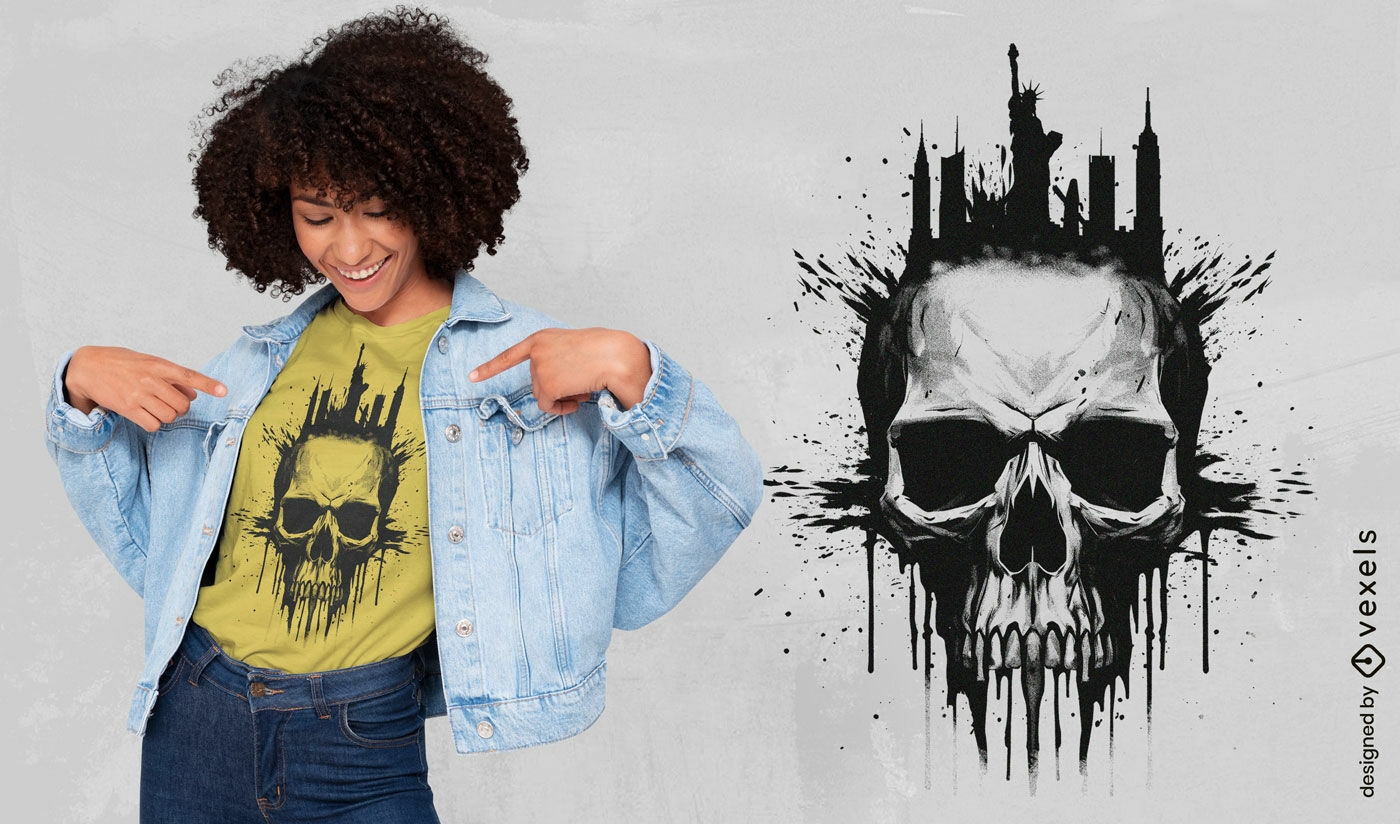
Design de camiseta com caveira da cidade de Nova York
Escolha uma pasta
Todos os favoritos
Criar novo
Salvar
Design de camiseta com caveira da cidade de Nova York
Pronto para imprimir
para Merch
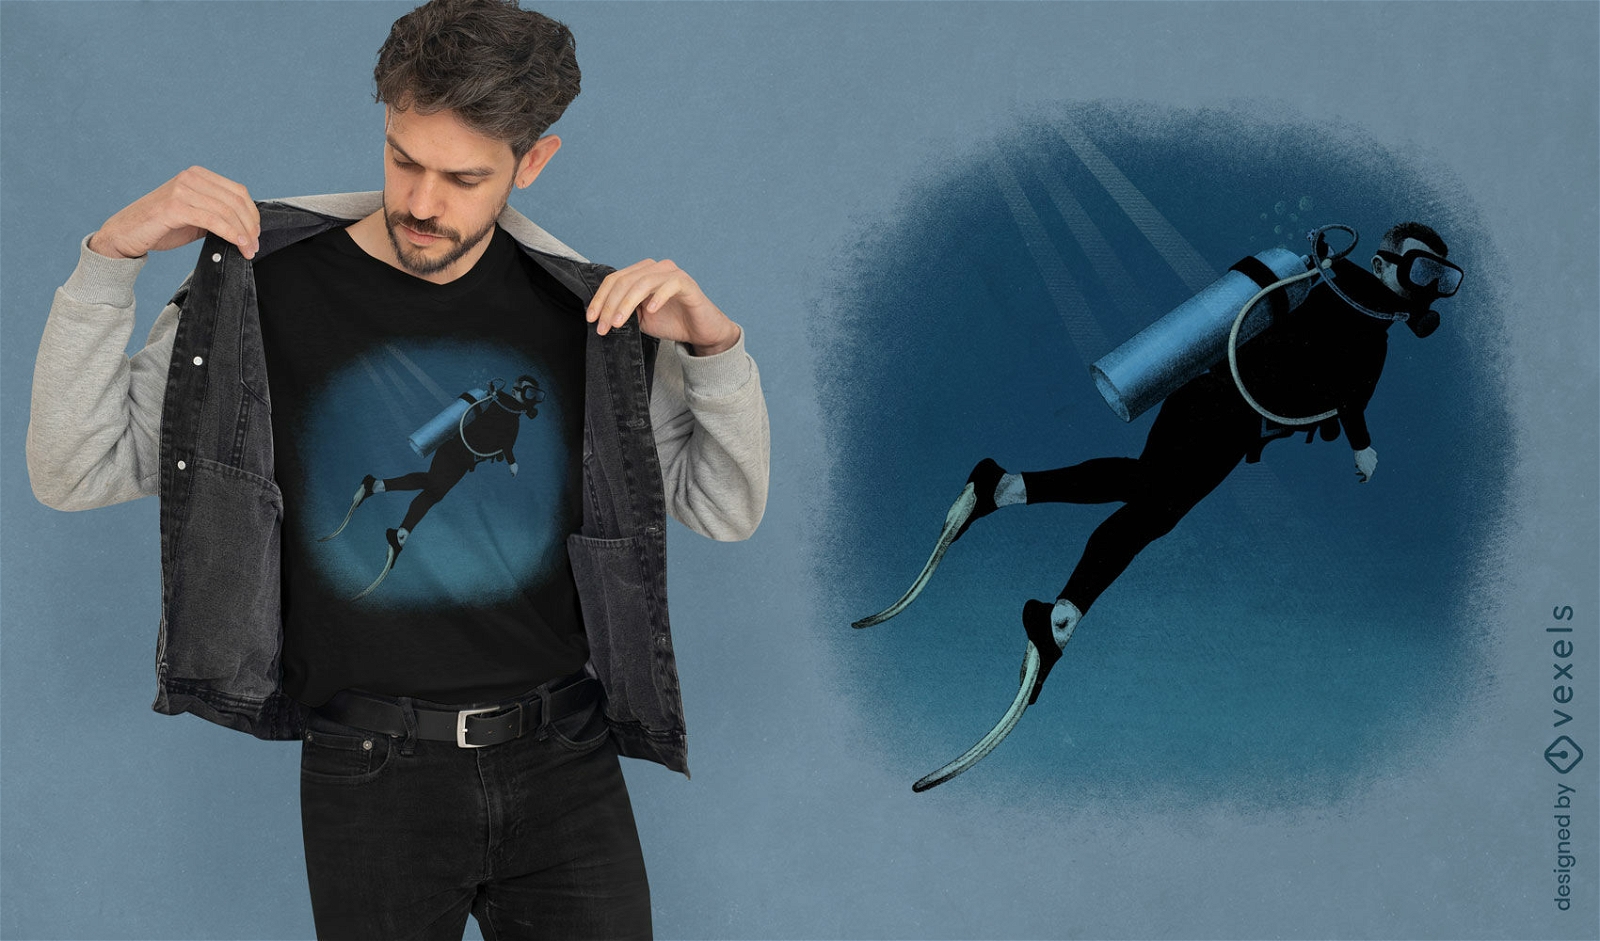
Design de camiseta de oceano de mergulhador realista
Escolha uma pasta
Todos os favoritos
Criar novo
Salvar
Design de camiseta de oceano de mergulhador realista
Pronto para imprimir
para Merch
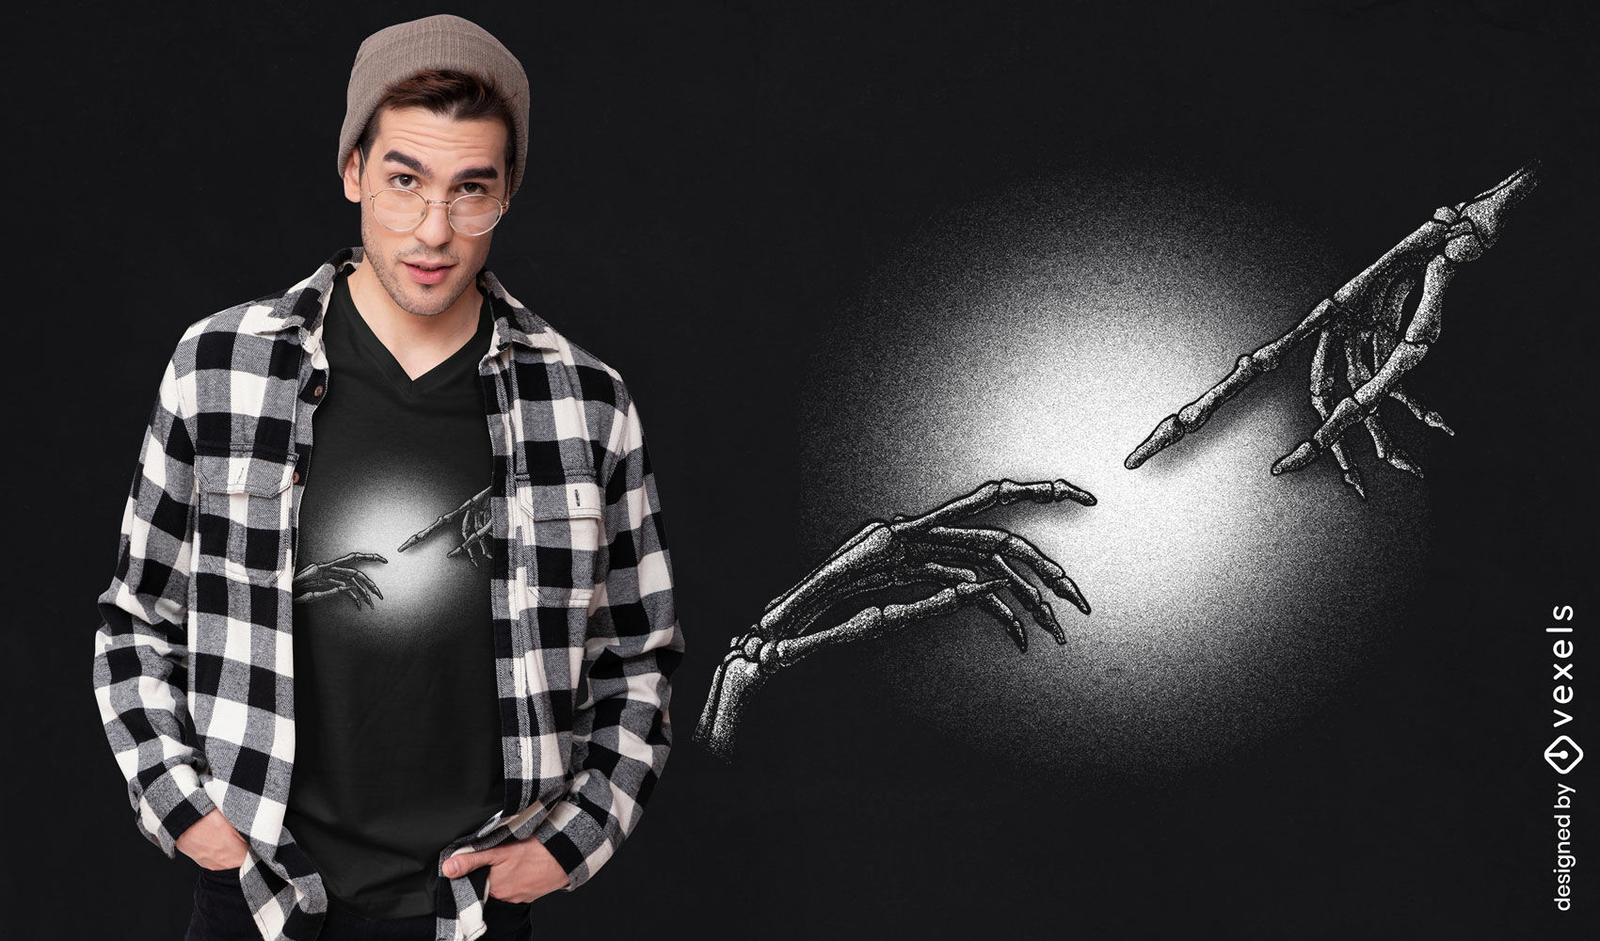
Design de camiseta do esqueleto A Criação de Adão
Escolha uma pasta
Todos os favoritos
Criar novo
Salvar
Design de camiseta do esqueleto A Criação de Adão
texto editável
Pronto para imprimir
para Merch
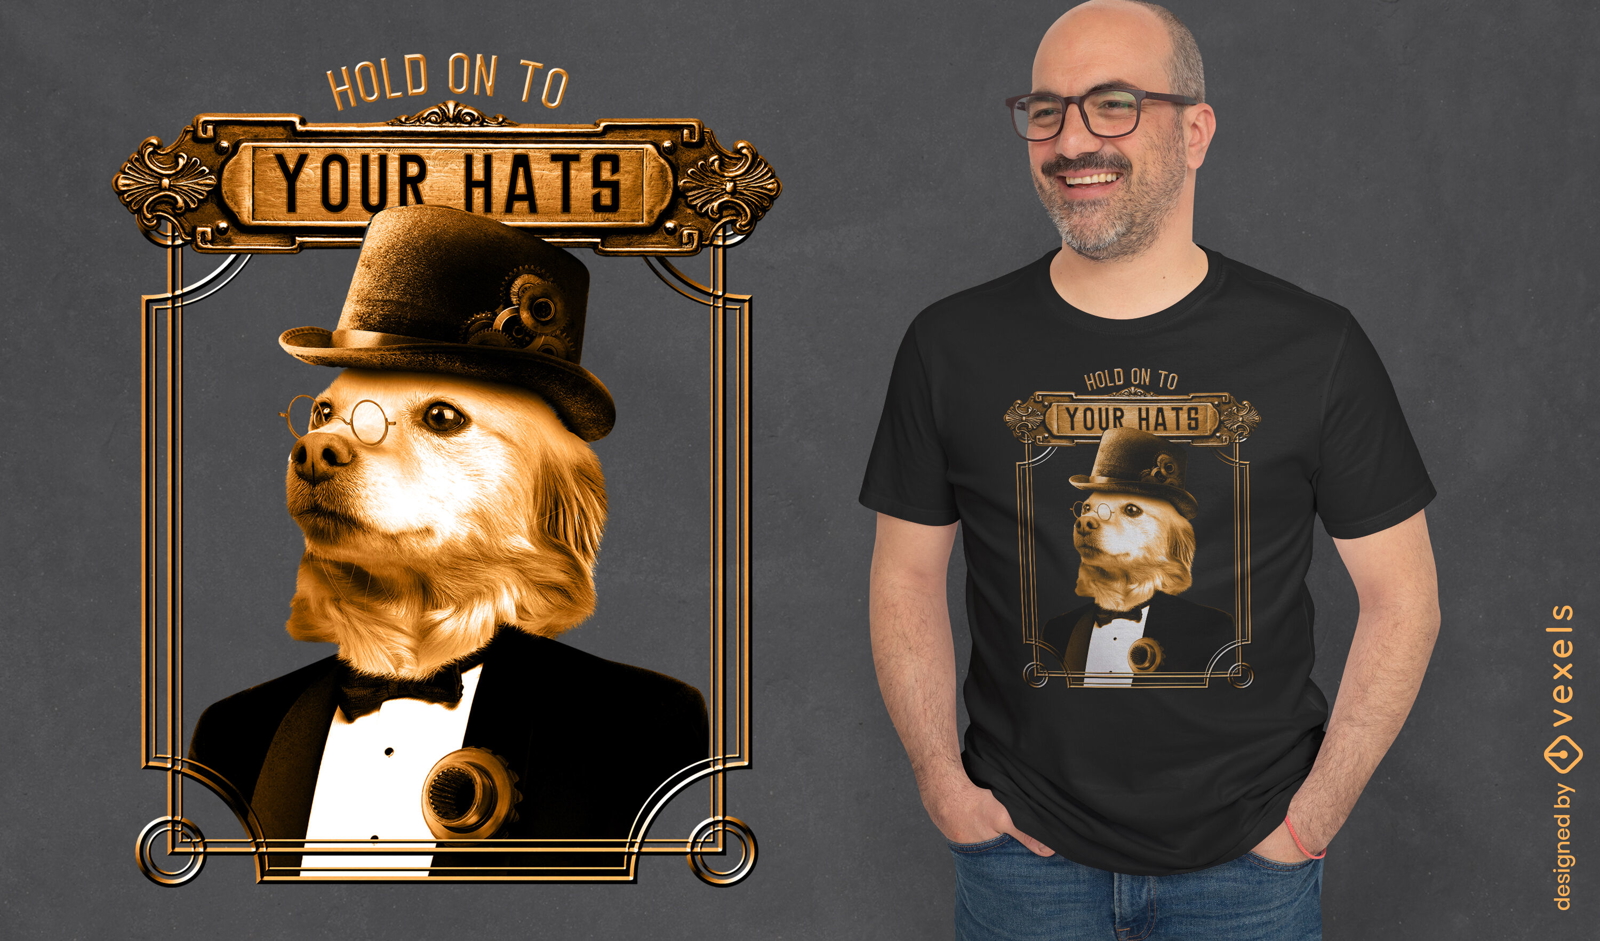
Camiseta steampunk de cachorro golden retriever psd
Escolha uma pasta
Todos os favoritos
Criar novo
Salvar
Camiseta steampunk de cachorro golden retriever psd
texto editável
Pronto para imprimir
para Merch
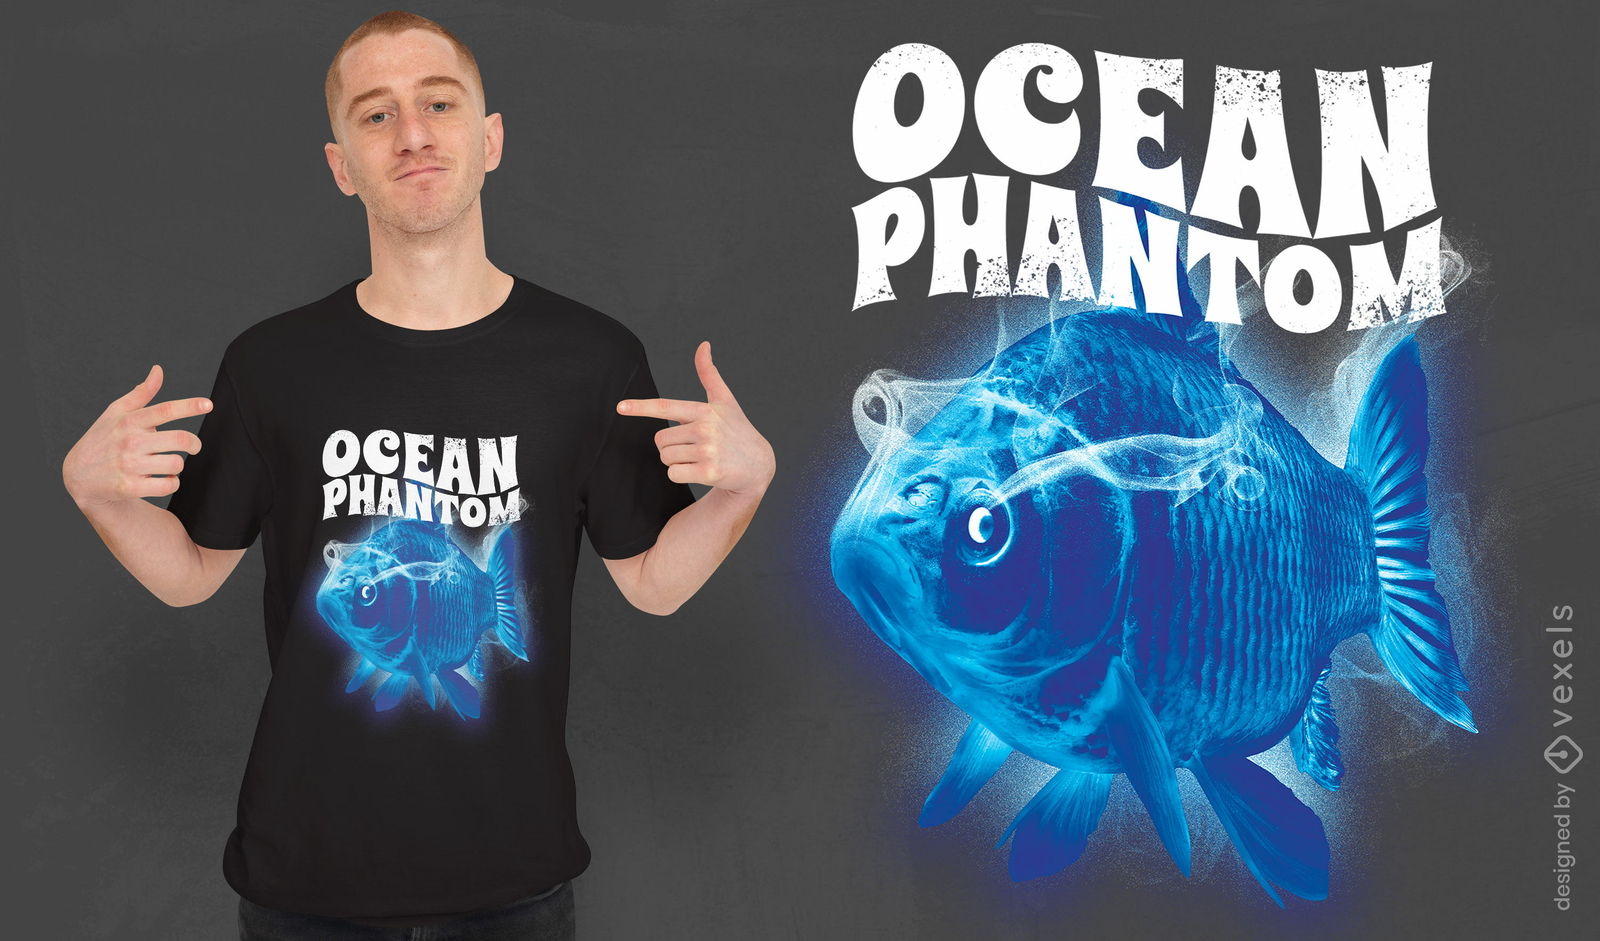
Camiseta psd espírito fantasma animal peixe
Escolha uma pasta
Todos os favoritos
Criar novo
Salvar
Camiseta psd espírito fantasma animal peixe
Pronto para imprimir
para Merch
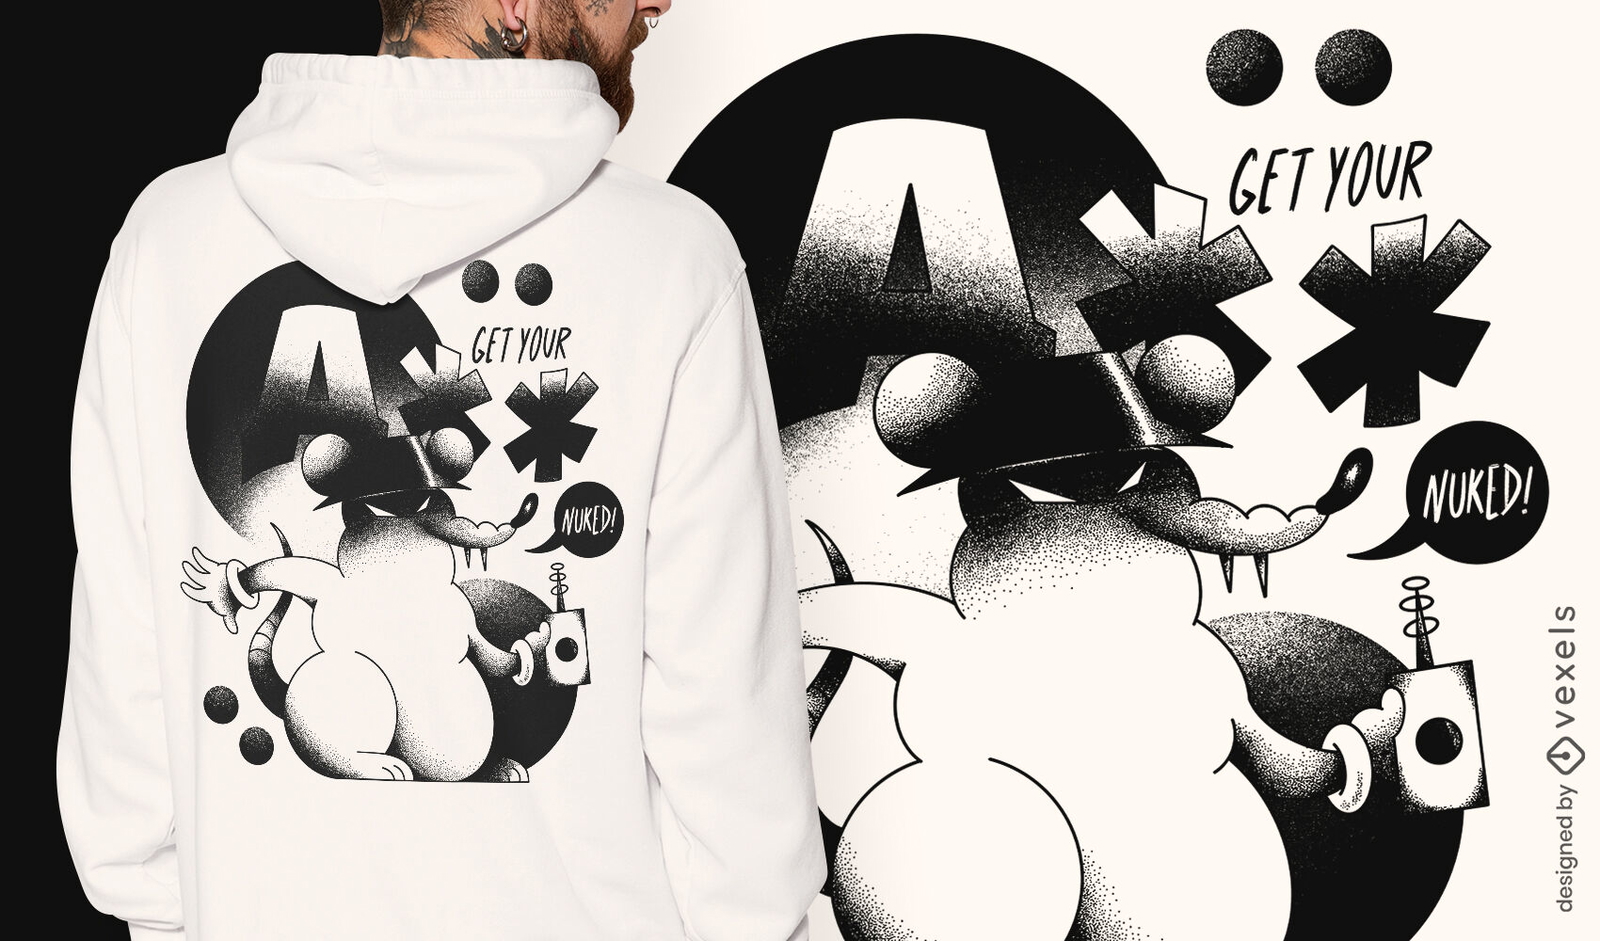
Design de camiseta de vilão retrô de rato
Escolha uma pasta
Todos os favoritos
Criar novo
Salvar
Design de camiseta de vilão retrô de rato
Pronto para imprimir
para Merch
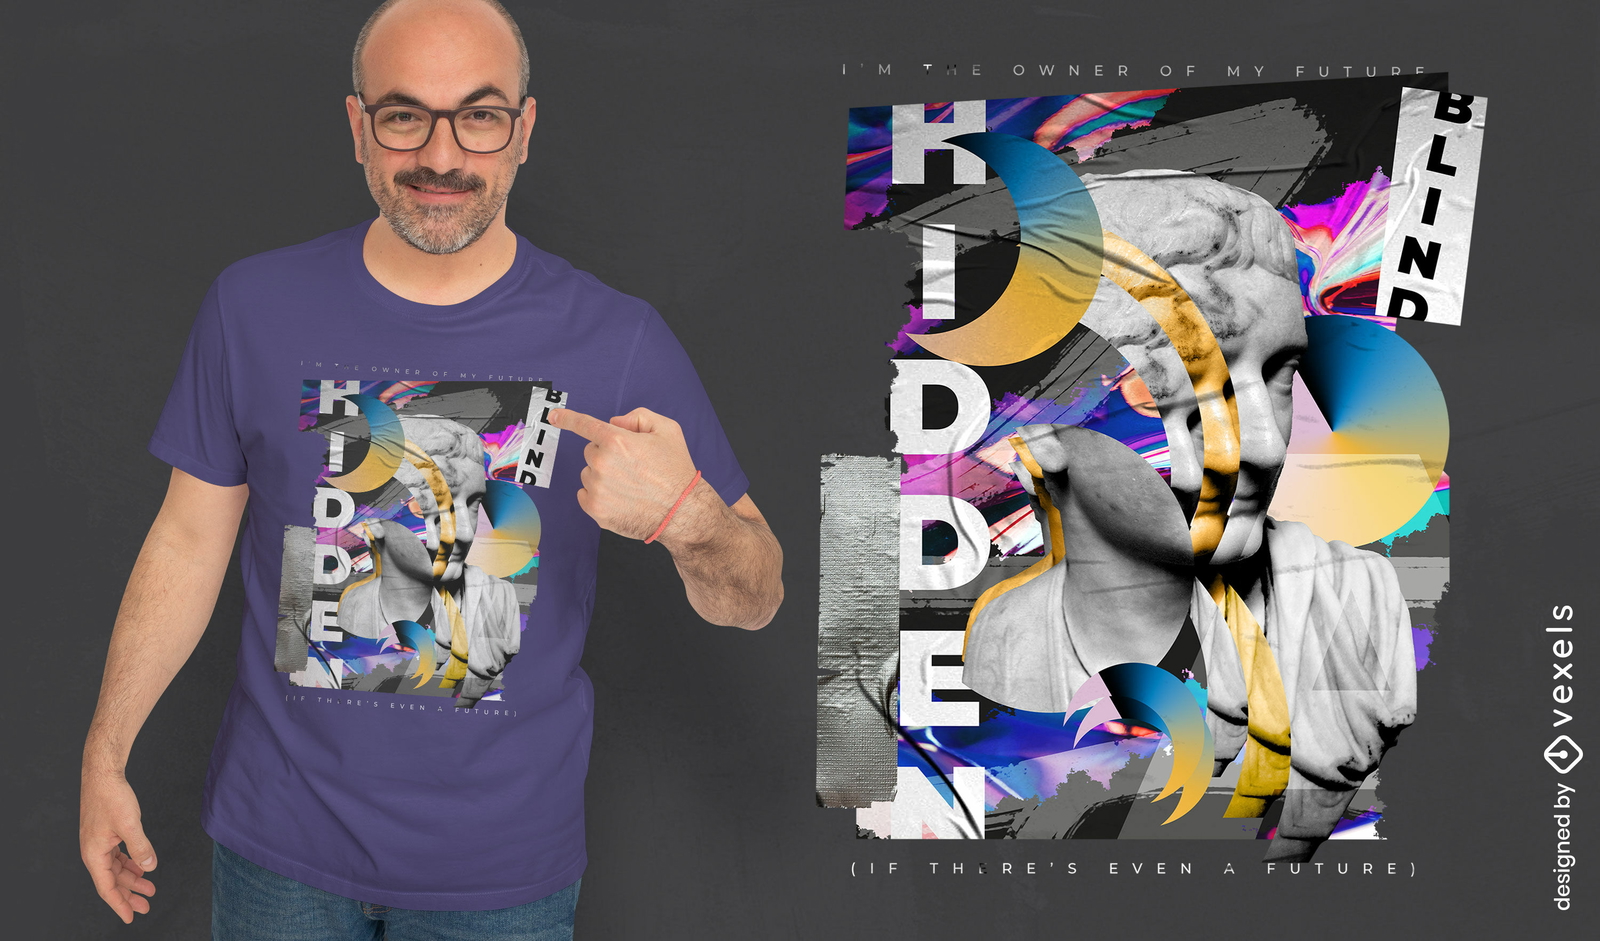
Colagem de estátua futura citação PSD design de camiseta
Escolha uma pasta
Todos os favoritos
Criar novo
Salvar
Colagem de estátua futura citação PSD design de camiseta
Pronto para imprimir
para Merch
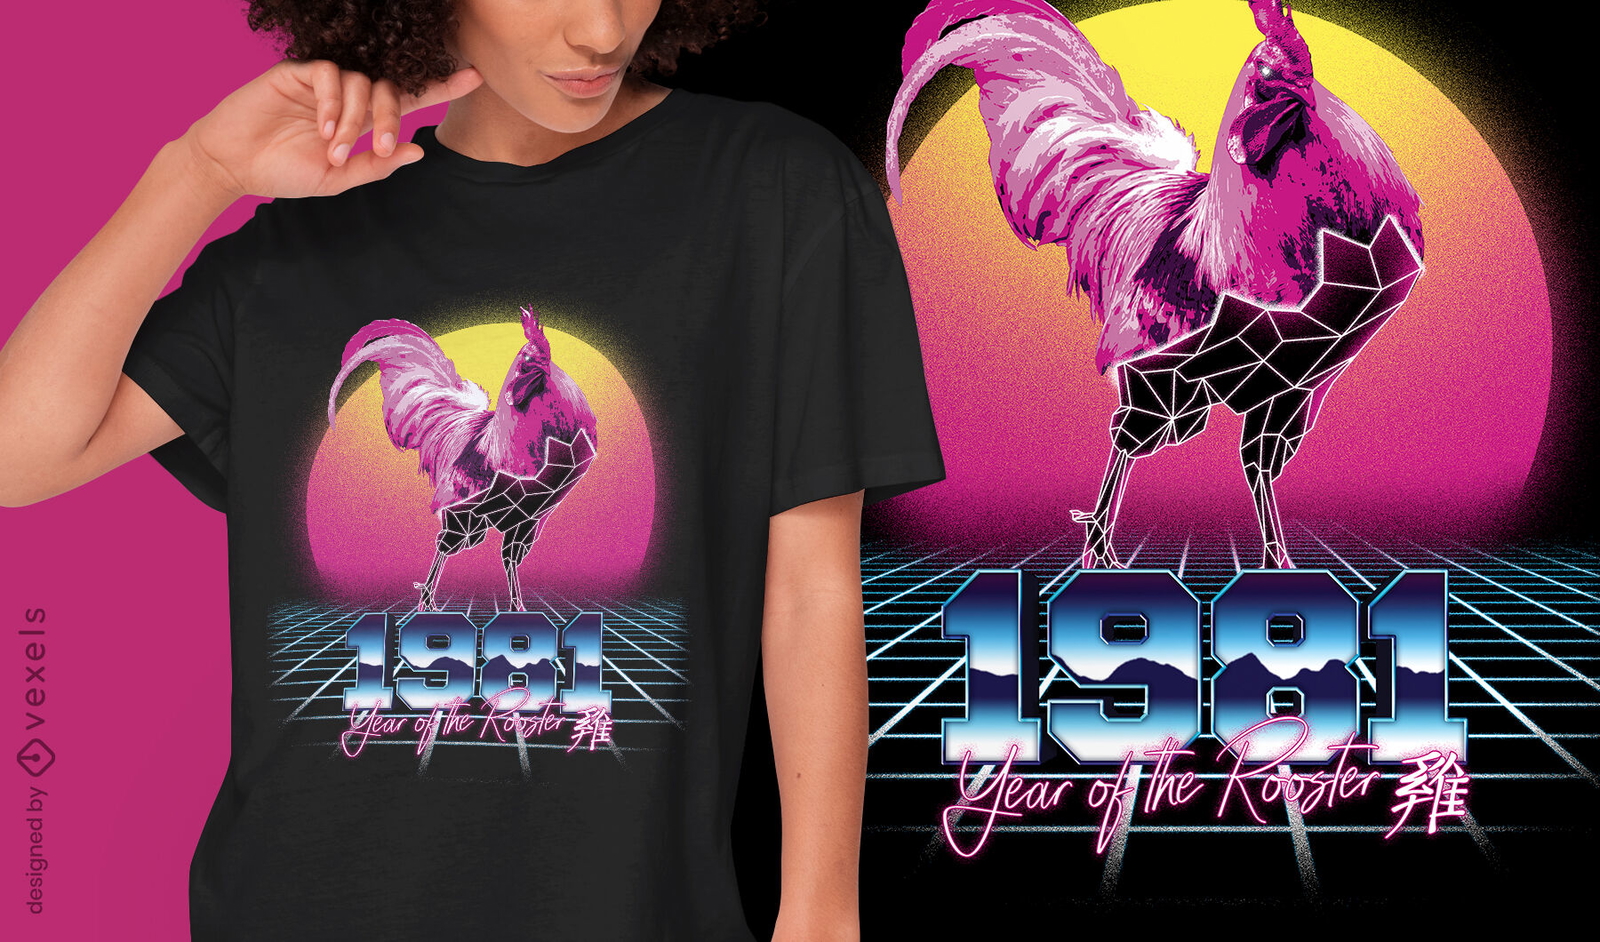
T-shirt do Zodíaco Chinês Retrowave Galo psd
Escolha uma pasta
Todos os favoritos
Criar novo
Salvar
T-shirt do Zodíaco Chinês Retrowave Galo psd
Camiseta PSD escalável
para Merch
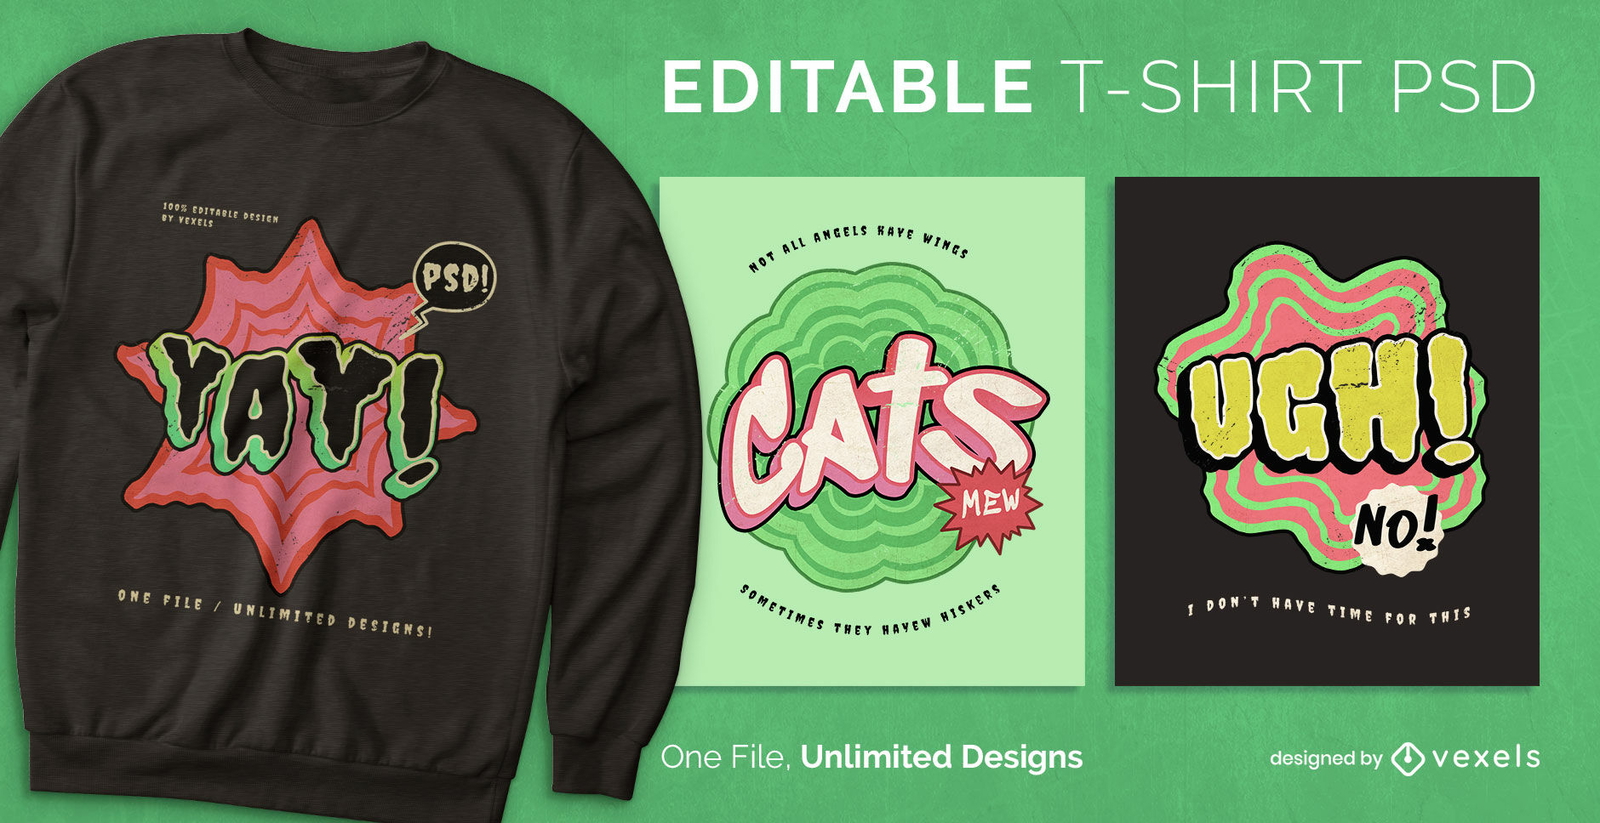
T-shirt escalável de texto em quadrinhos psd
Escolha uma pasta
Todos os favoritos
Criar novo
Salvar
T-shirt escalável de texto em quadrinhos psd
Impulsione seu negócio
Com a plataforma gráfica líder de mercado.
Ver planos
Próxima
do 67
prev page
next page