Biblioteca de design
Novos designs Merch
Camisetas
Vectores
Designs de Merch de Tendência
PNGs & SVGs
Mockups
Modelos de T-Shirt PSD
Explorar Desenhos
Designs KDP
Pôsteres
Canecas
Capas para celular
Sacos de compras
Almofadas
Ferramentas de desenho
Merch Designer
Novo!
Mockup Generator
Gerador de Design de AI
Vetorizador
Quote Generator
T-Shirt Maker (Antigo)
Ajuda
Merch Digest
Blog
Centro de Ajuda
Saiba mais sobre o Merch
Feedback
Soluções Corporativas
Empresa
Acesso à API
Estúdio de Design
Design em Lote
Preços
Carregando...
Inscrever-se
Conecte-se
PSD Templates
graficos
Biblioteca de design
Novos designs Merch
Camisetas
Vectores
Designs de Merch de Tendência
PNGs & SVGs
Mockups
Modelos de T-Shirt PSD
Explorar Desenhos
Designs KDP
Pôsteres
Canecas
Capas para celular
Sacos de compras
Almofadas
Ferramentas de desenho
Merch Designer
Novo!
Mockup Generator
Gerador de Design de AI
Vetorizador
Quote Generator
T-Shirt Maker (Antigo)
Ajuda
Merch Digest
Blog
Centro de Ajuda
Saiba mais sobre o Merch
Feedback
Soluções Corporativas
Empresa
Acesso à API
Estúdio de Design
Design em Lote
PLANOS
PSD Templates
graficos
3312 Designs de Camisetas e Mockups PSD de graficos
Baixar designs de camisetas ou mockups PSD editáveis de graficos
Relacionado:
graficos vetoriais
,
desenhos graficos de ações
,
graficos tridimensionais
Ordenar por
Mais relevante
Resultados patrocinados da
Ganhe 15% de desconto com o código: VEXELS15
veja mais detalhes
Pronto para imprimir
para Merch
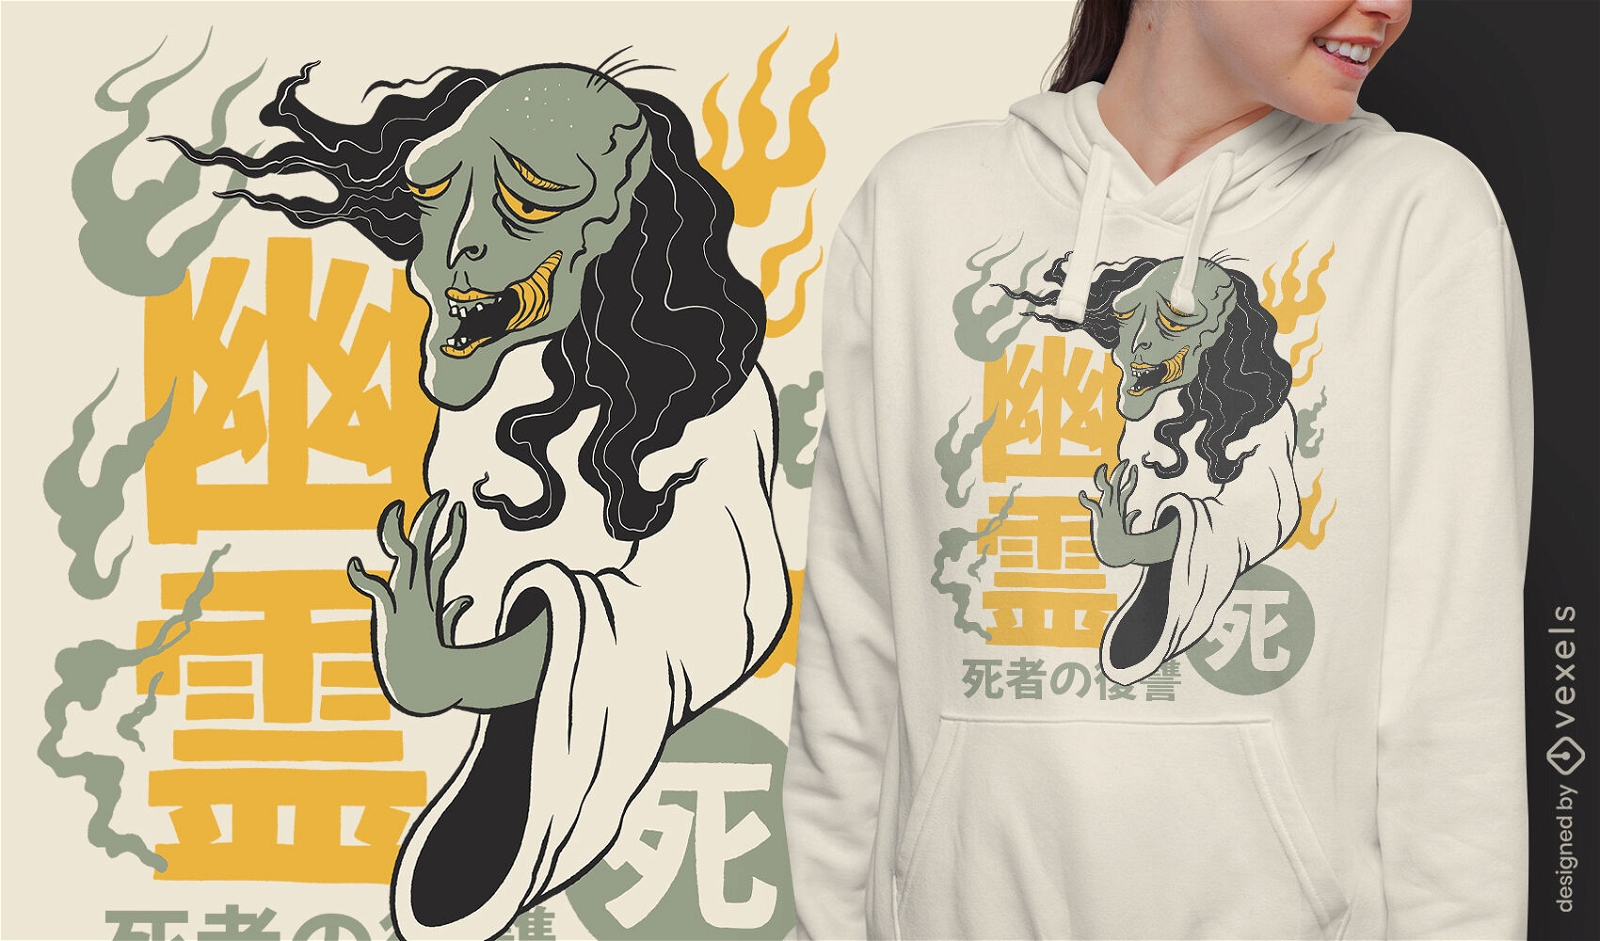
Design de camiseta japonesa de fantasma podre
Escolha uma pasta
Todos os favoritos
Criar novo
Salvar
Design de camiseta japonesa de fantasma podre
texto editável
Pronto para imprimir
para Merch
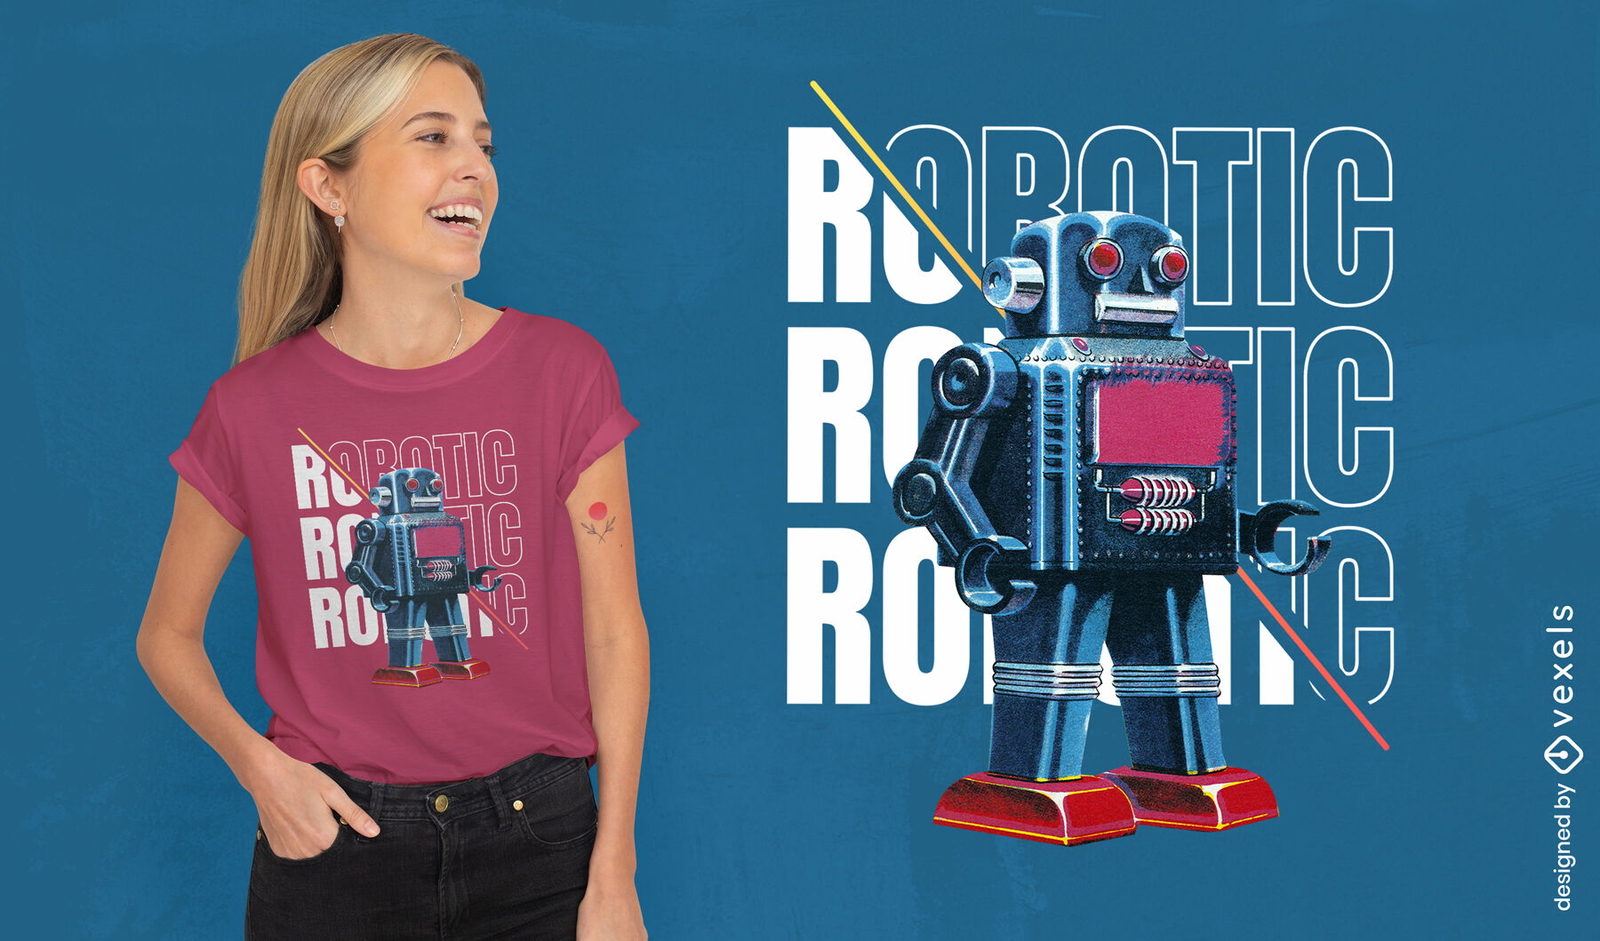
Design de camiseta psd de robô vintage
Escolha uma pasta
Todos os favoritos
Criar novo
Salvar
Design de camiseta psd de robô vintage
Pronto para imprimir
para Merch
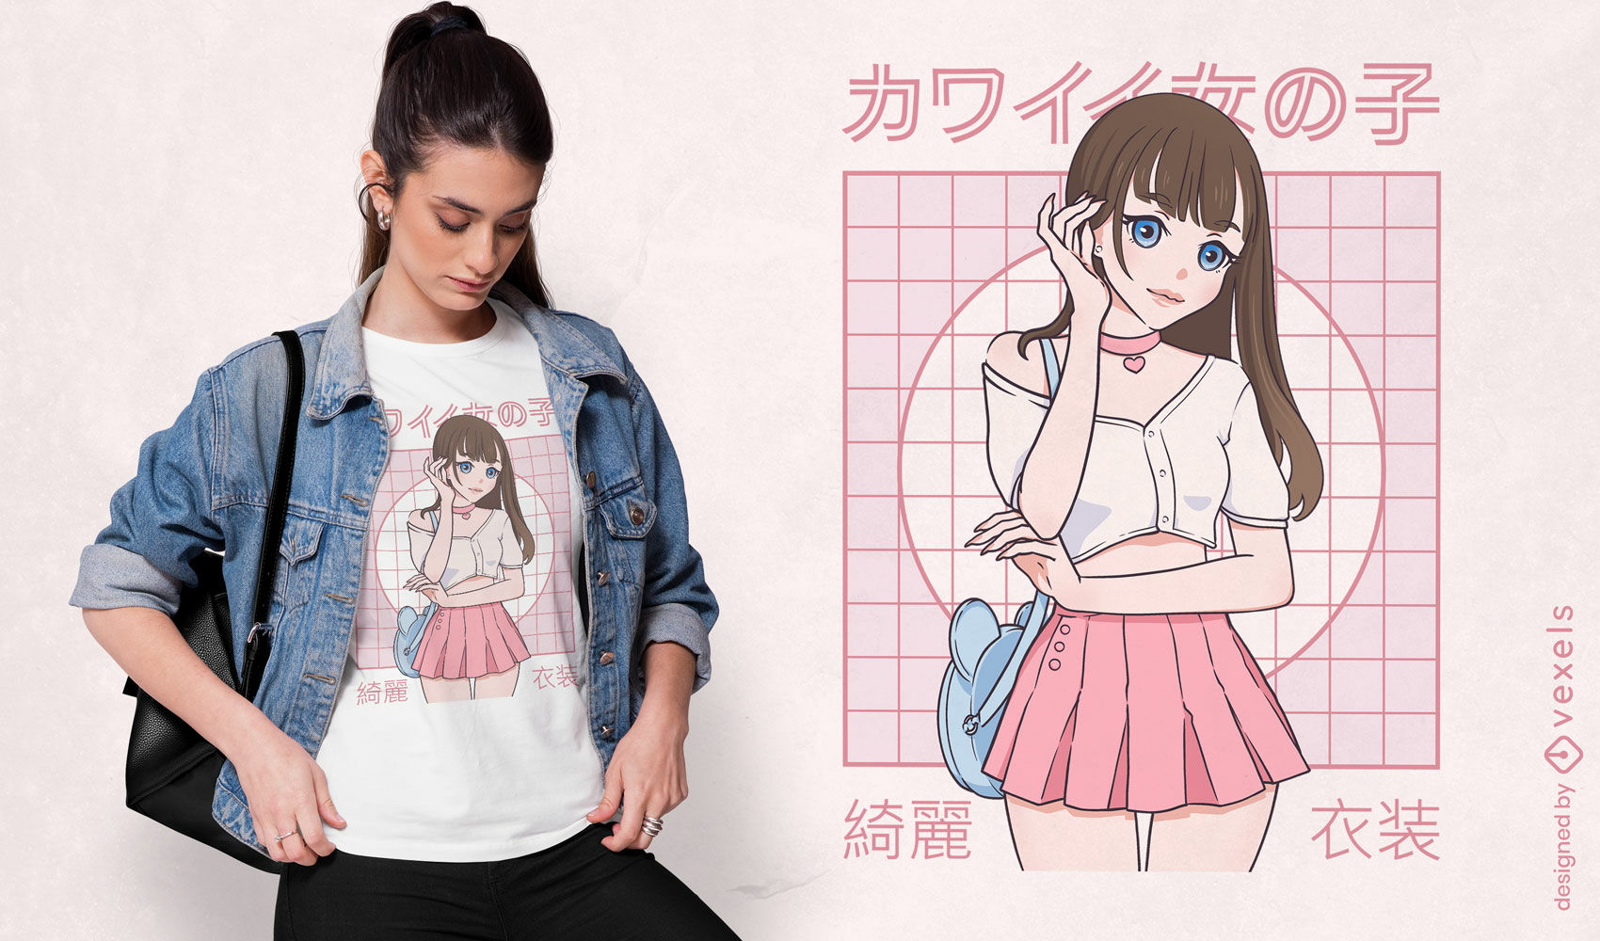
Design de camiseta de modelo de menina japonesa de anime
Escolha uma pasta
Todos os favoritos
Criar novo
Salvar
Design de camiseta de modelo de menina japonesa de anime
Pronto para imprimir
para Merch
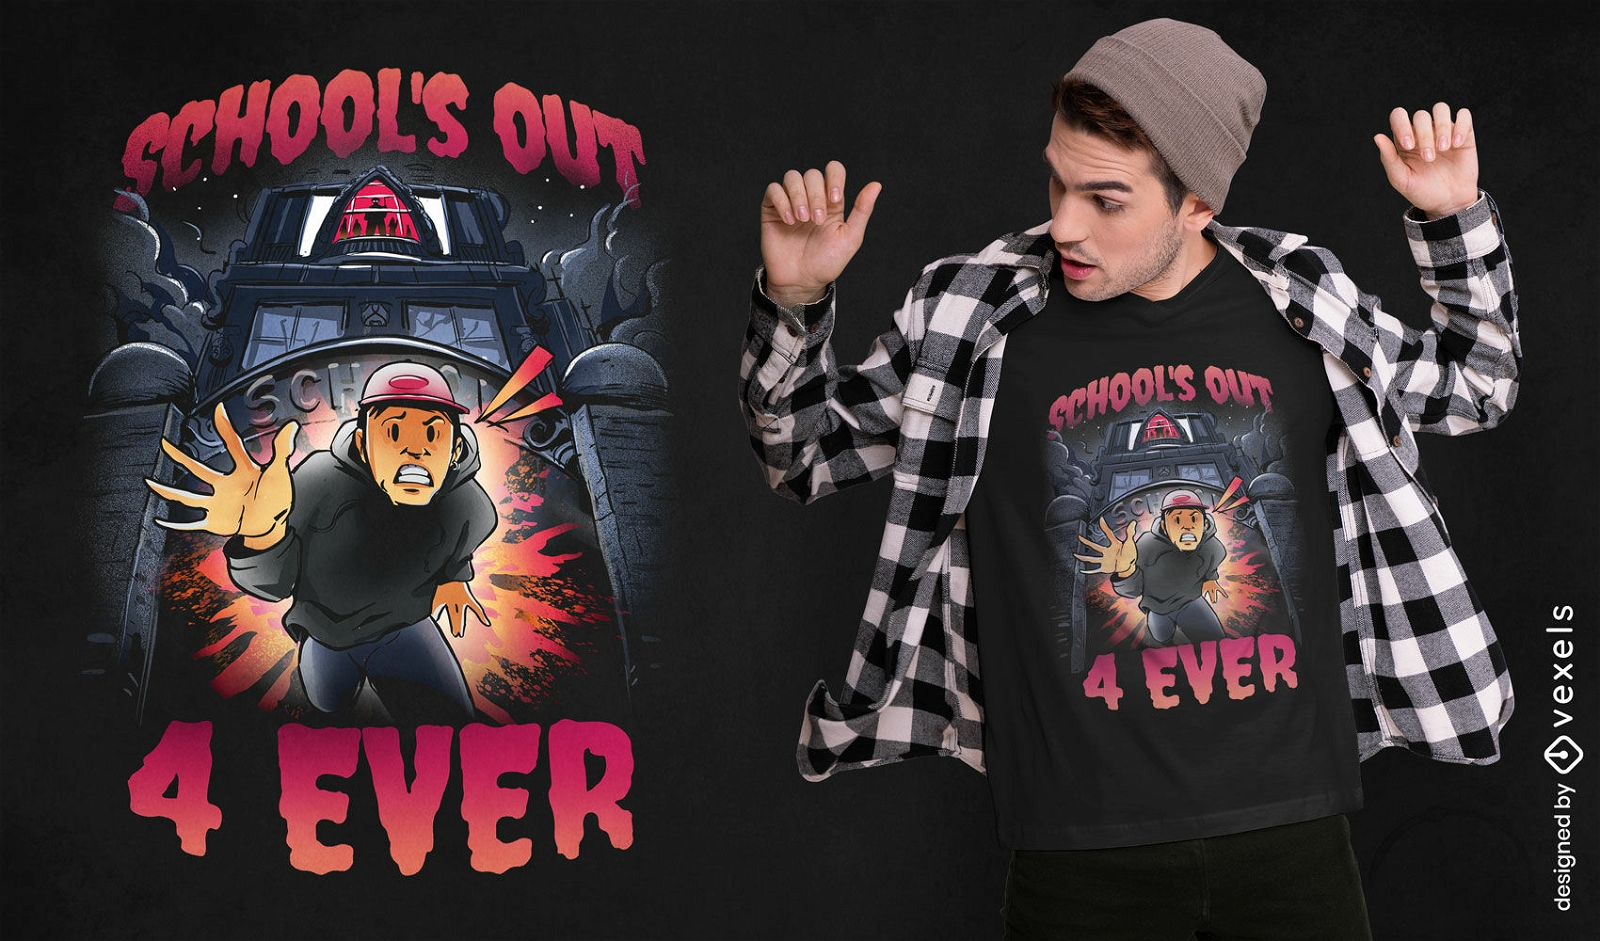
Design de camiseta de Halloween da escola
Escolha uma pasta
Todos os favoritos
Criar novo
Salvar
Design de camiseta de Halloween da escola
Pronto para imprimir
para Merch
Criança rainha absurda natureza psd design de camiseta
Escolha uma pasta
Todos os favoritos
Criar novo
Salvar
Criança rainha absurda natureza psd design de camiseta
Pronto para imprimir
para Merch
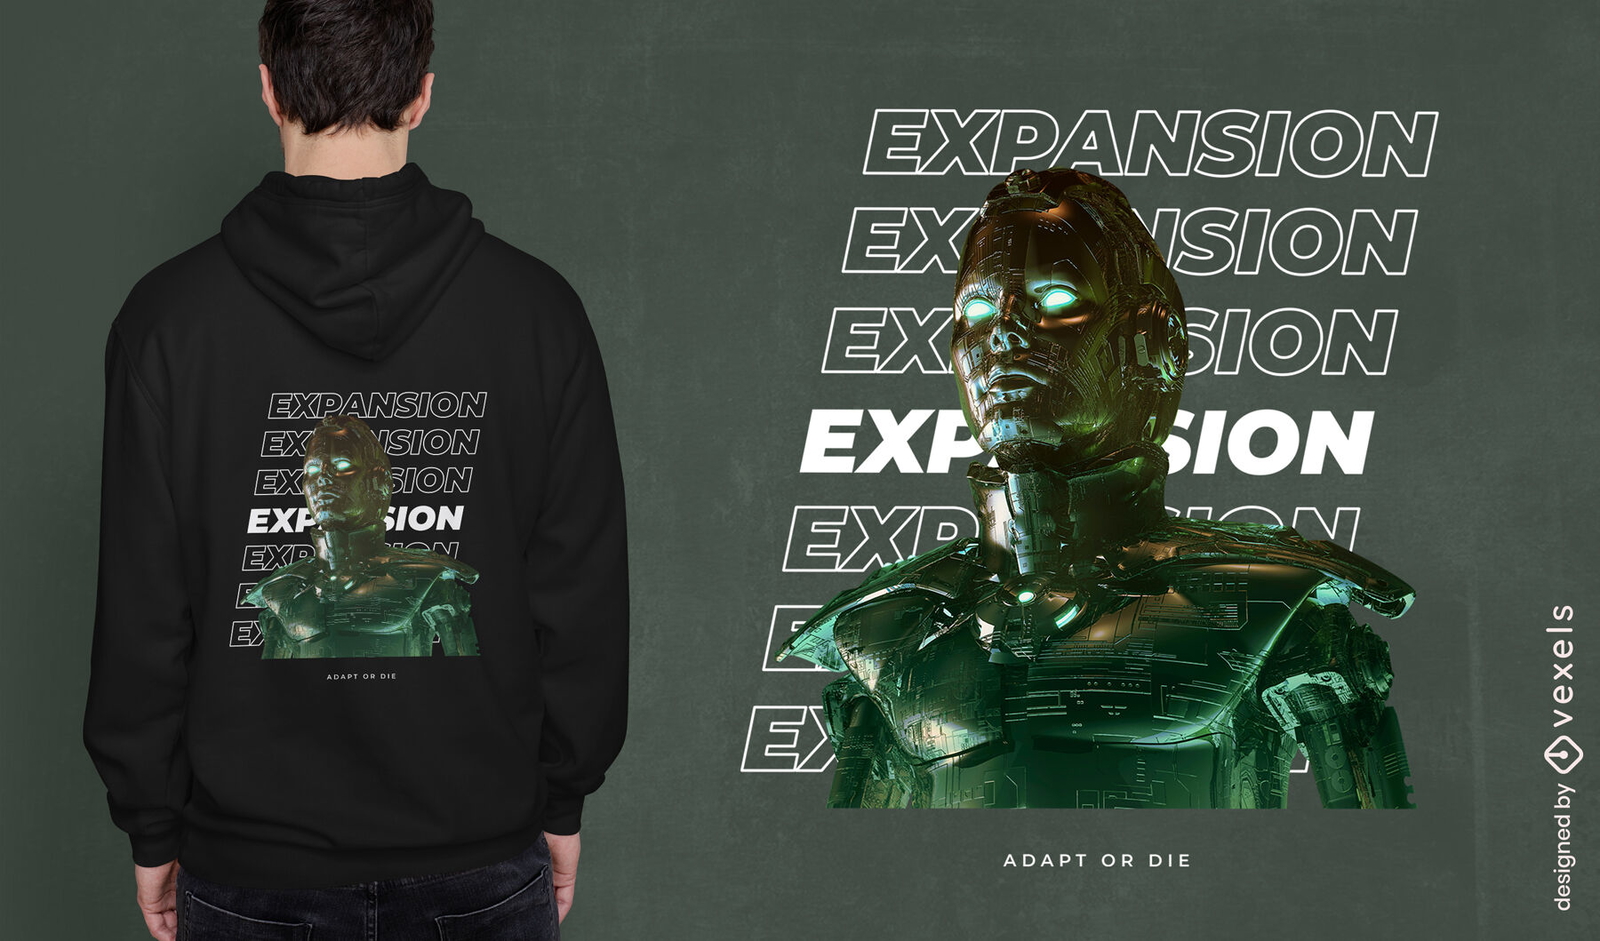
Design de camiseta psd de robô de expansão
Escolha uma pasta
Todos os favoritos
Criar novo
Salvar
Design de camiseta psd de robô de expansão
Pronto para imprimir
para Merch
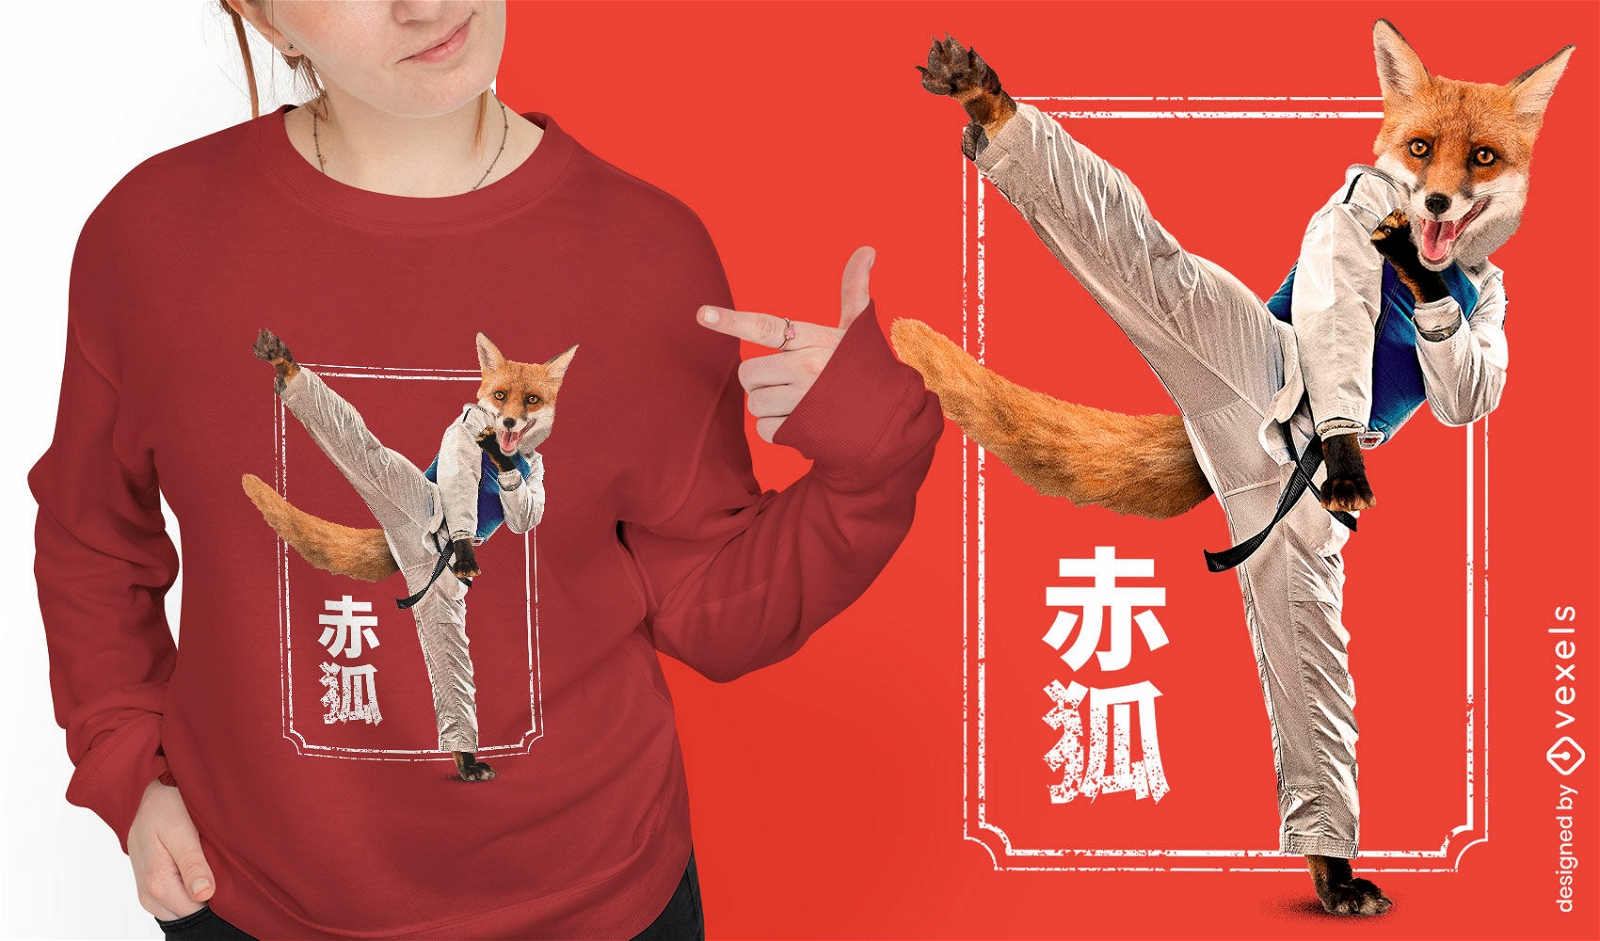
Design de camiseta de artes marciais de animais de raposa
Escolha uma pasta
Todos os favoritos
Criar novo
Salvar
Design de camiseta de artes marciais de animais de raposa
texto editável
para Merch
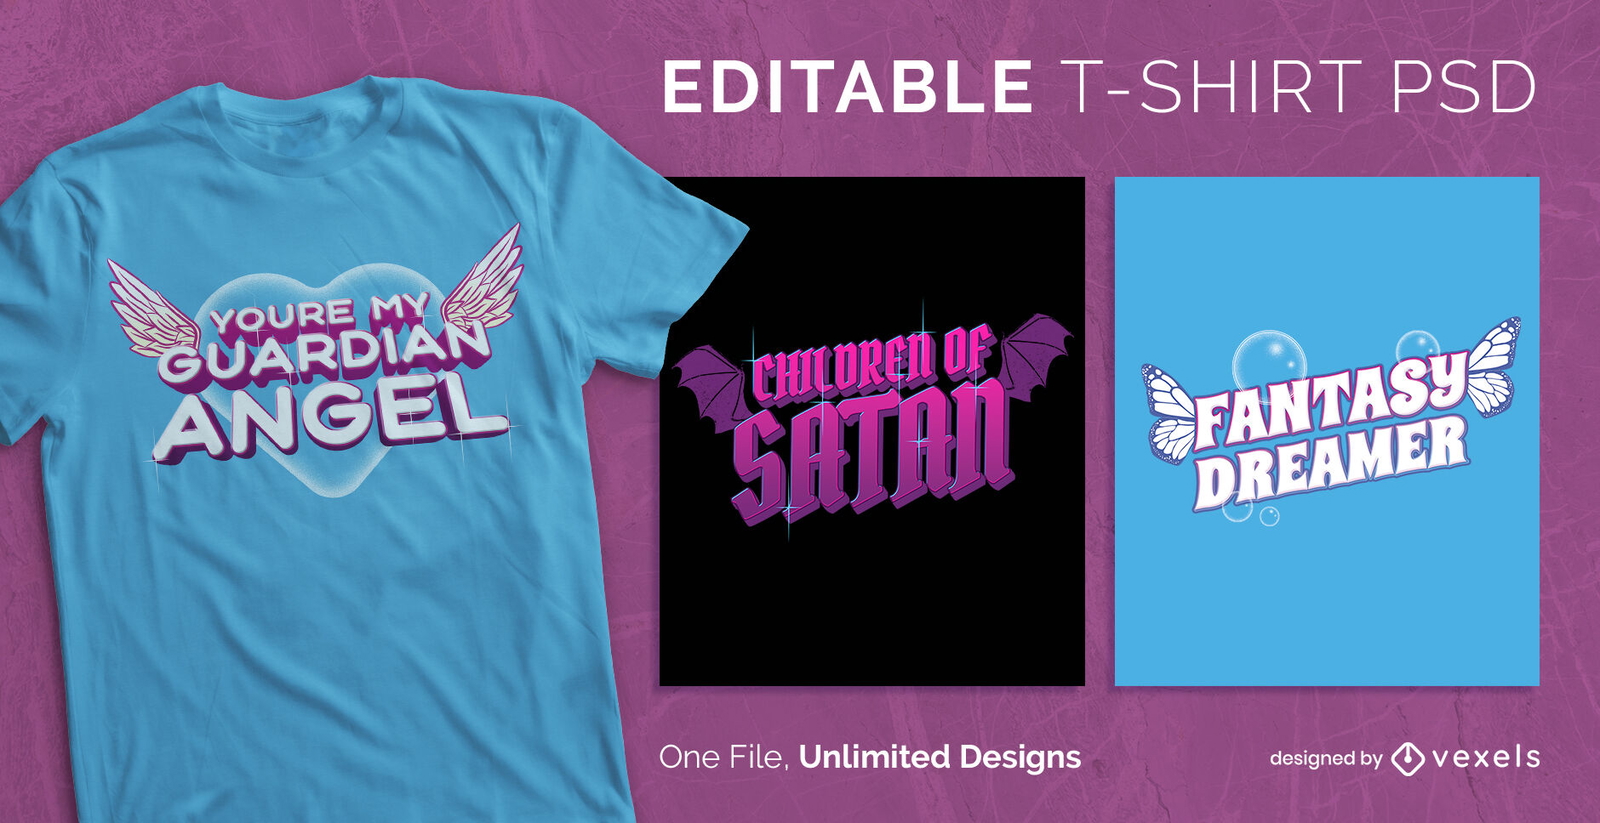
T-shirt escalável de textos alados de fantasia psd
Escolha uma pasta
Todos os favoritos
Criar novo
Salvar
T-shirt escalável de textos alados de fantasia psd
texto editável
Pronto para imprimir
para Merch
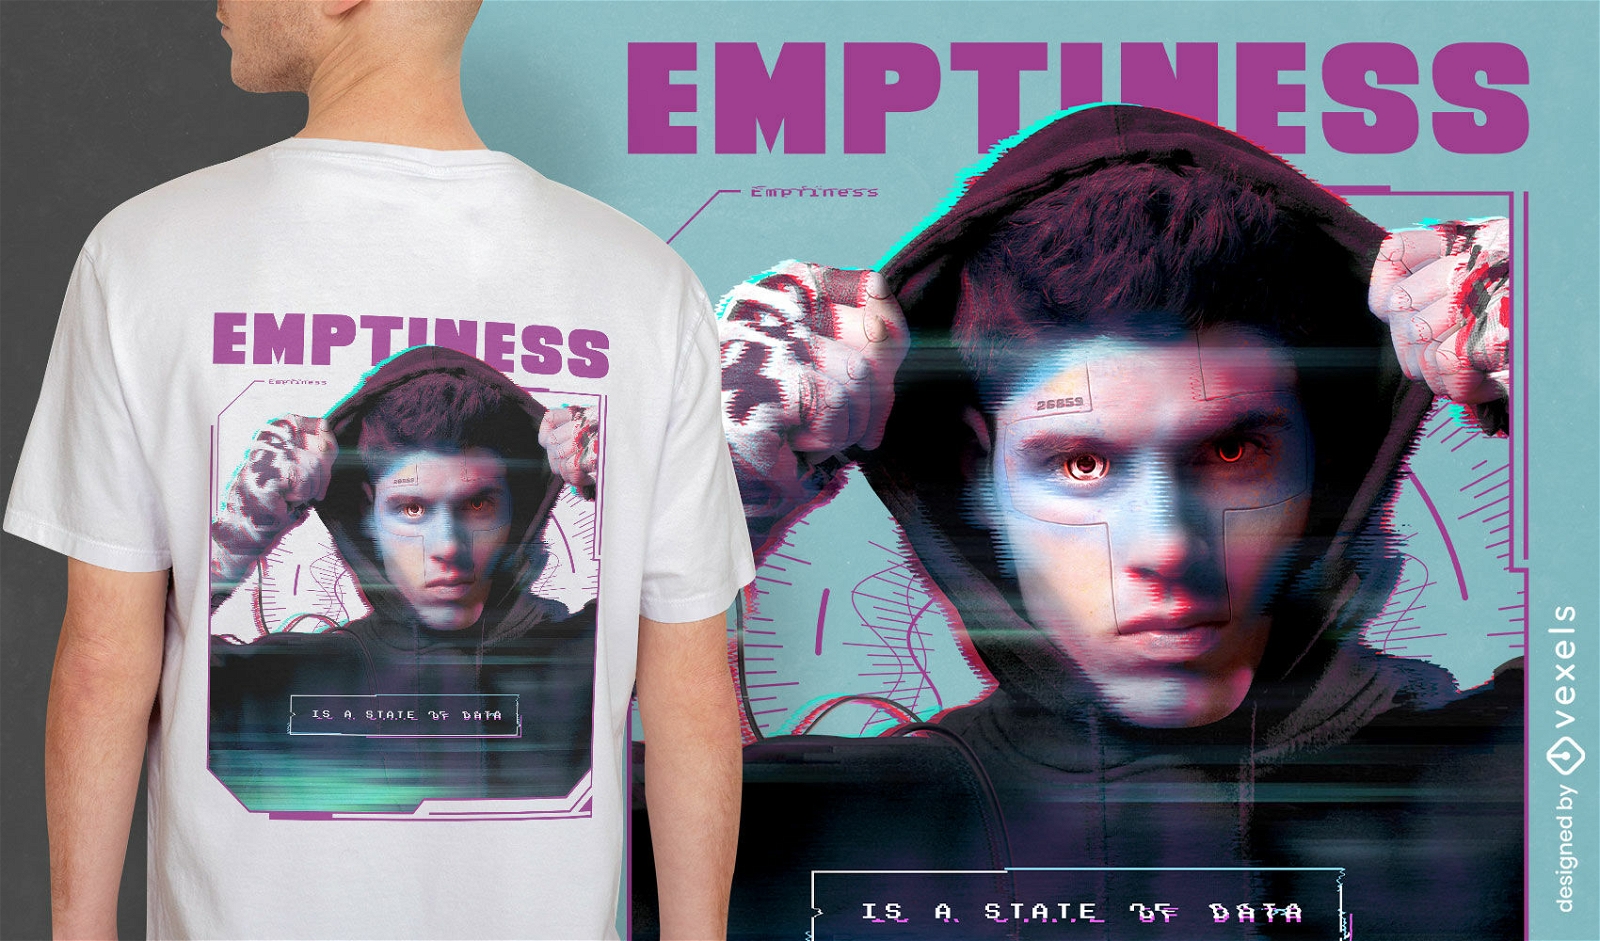
Design de camiseta de ciborgue com capuz
Escolha uma pasta
Todos os favoritos
Criar novo
Salvar
Design de camiseta de ciborgue com capuz
Pronto para imprimir
para Merch
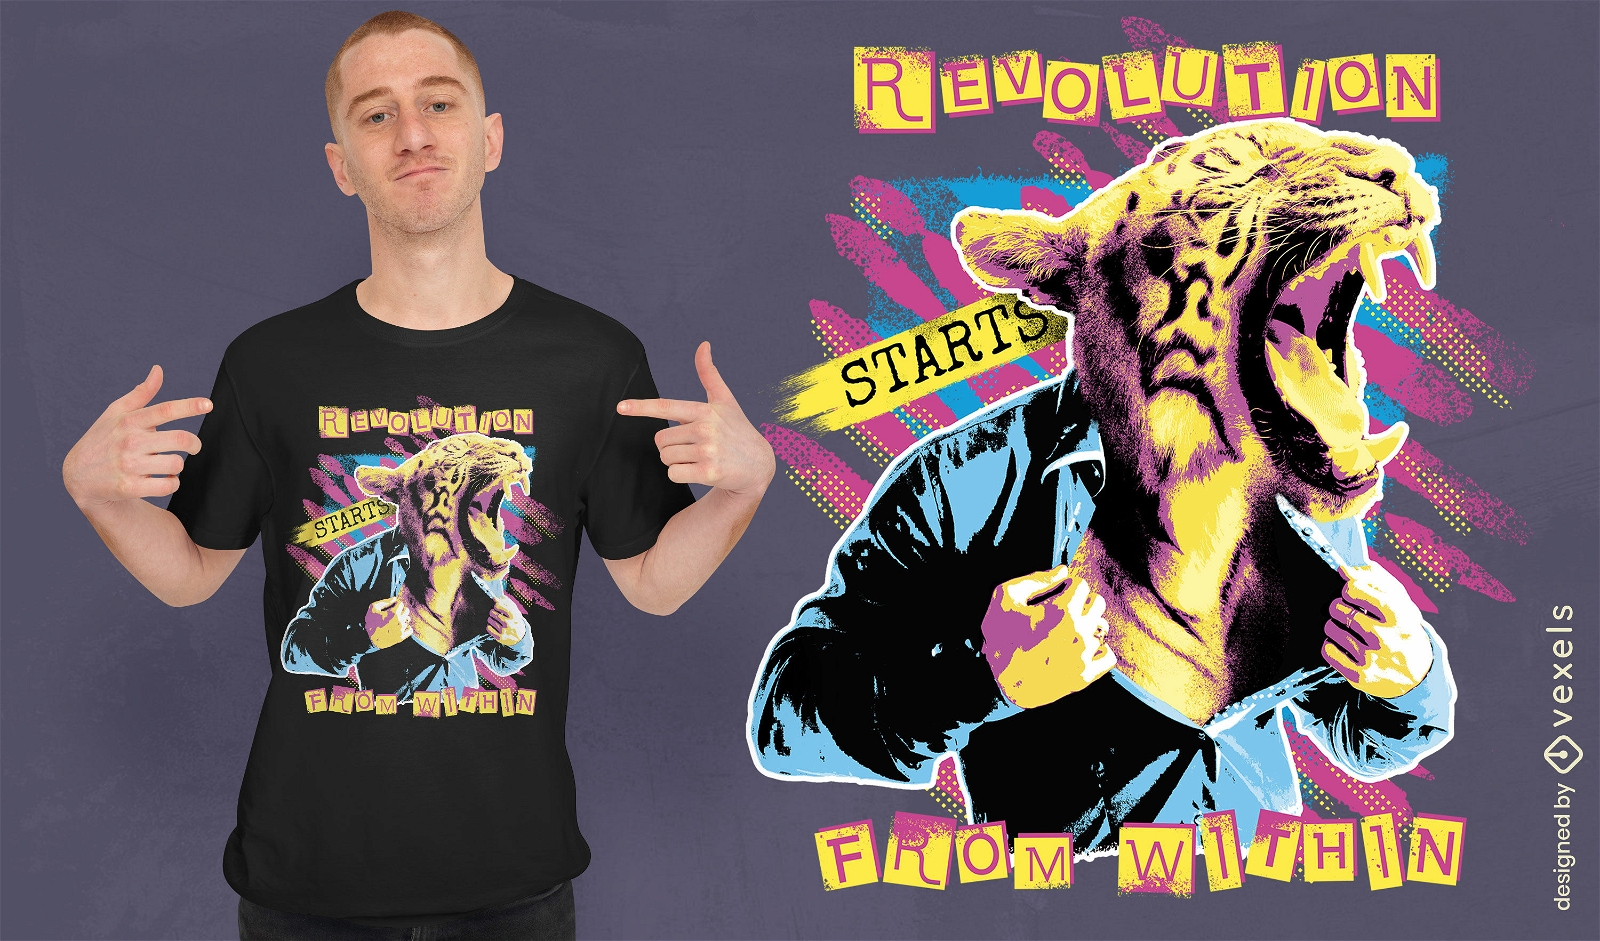
T-shirt do homem animal tigre rugindo psd
Escolha uma pasta
Todos os favoritos
Criar novo
Salvar
T-shirt do homem animal tigre rugindo psd
Pronto para imprimir
para Merch
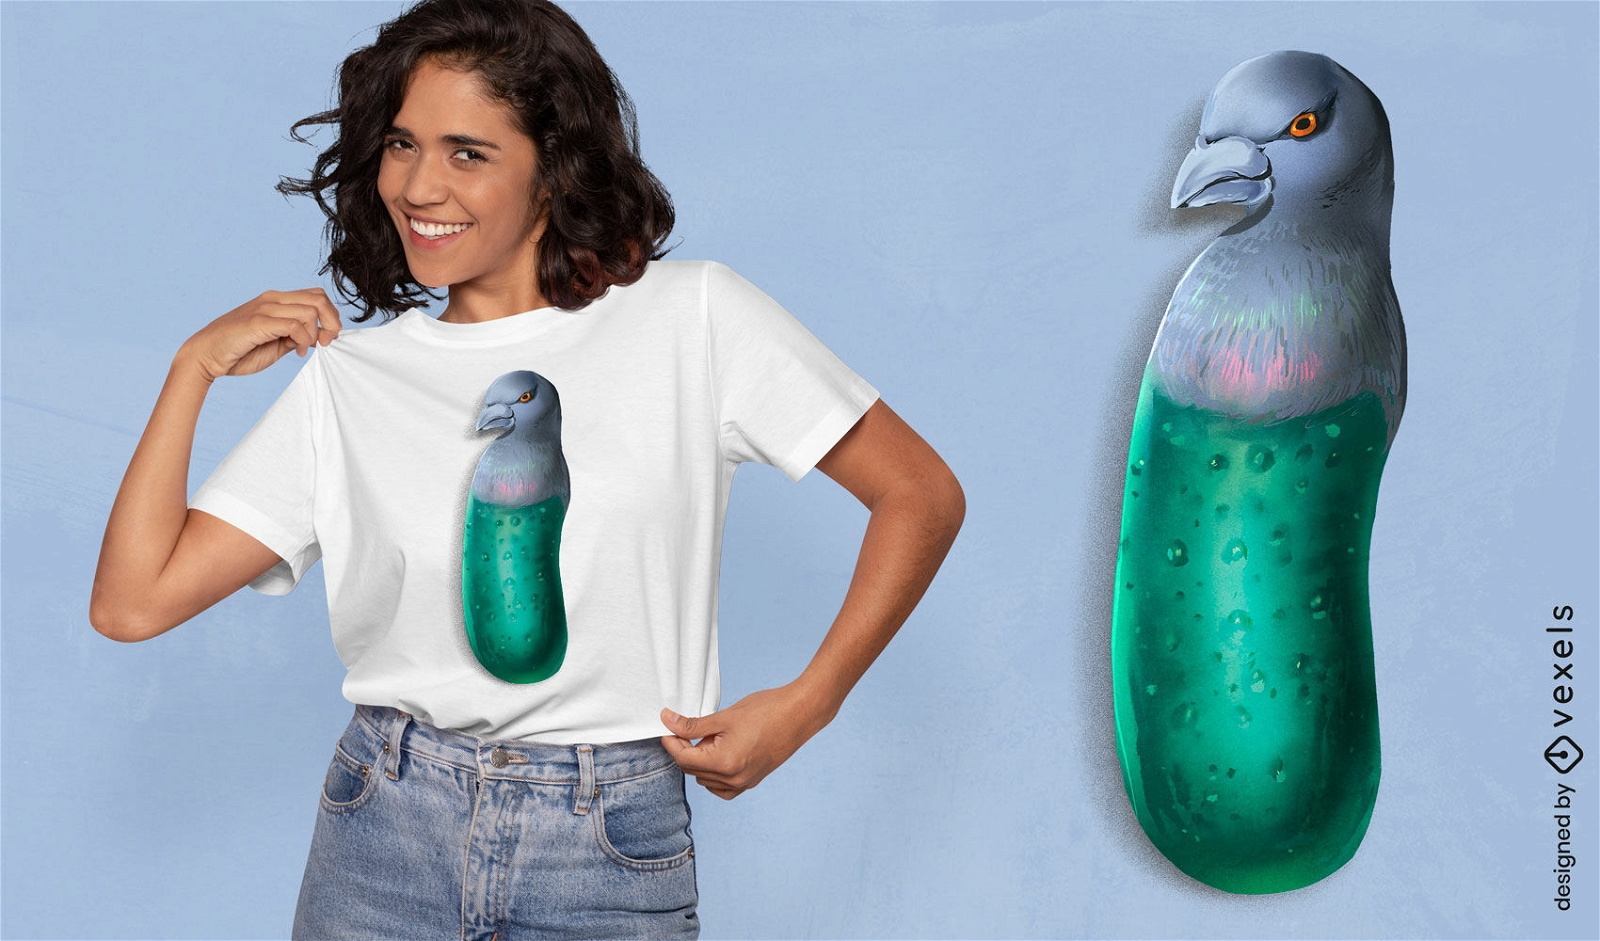
Design de camiseta de criatura de pepino de pombo
Escolha uma pasta
Todos os favoritos
Criar novo
Salvar
Design de camiseta de criatura de pepino de pombo
Pronto para imprimir
para Merch
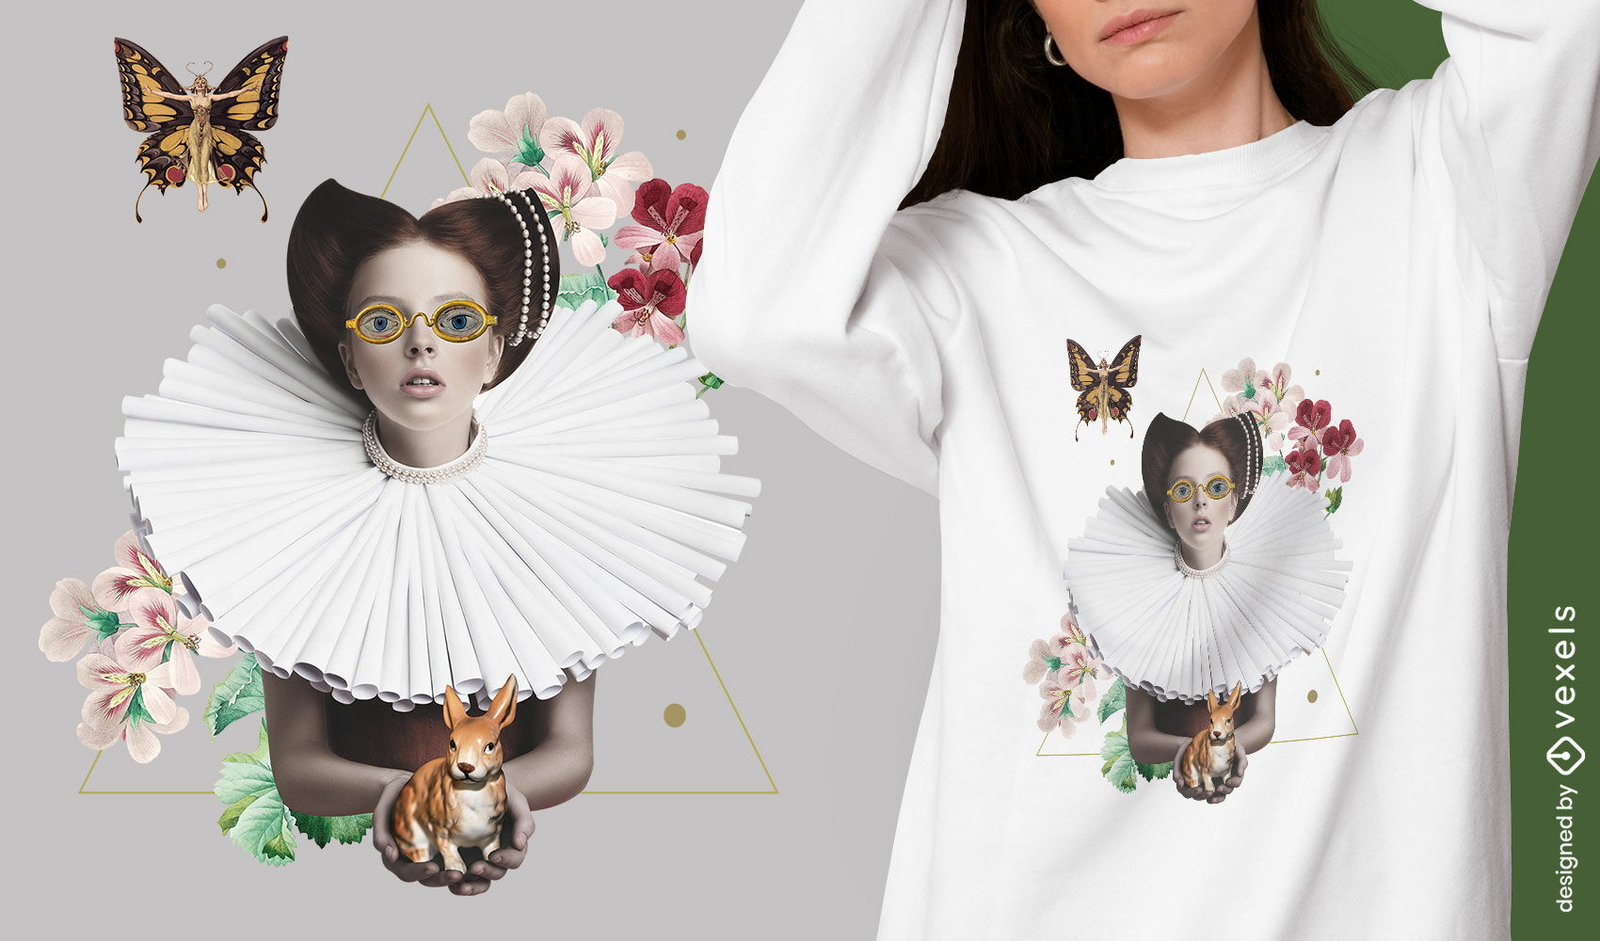
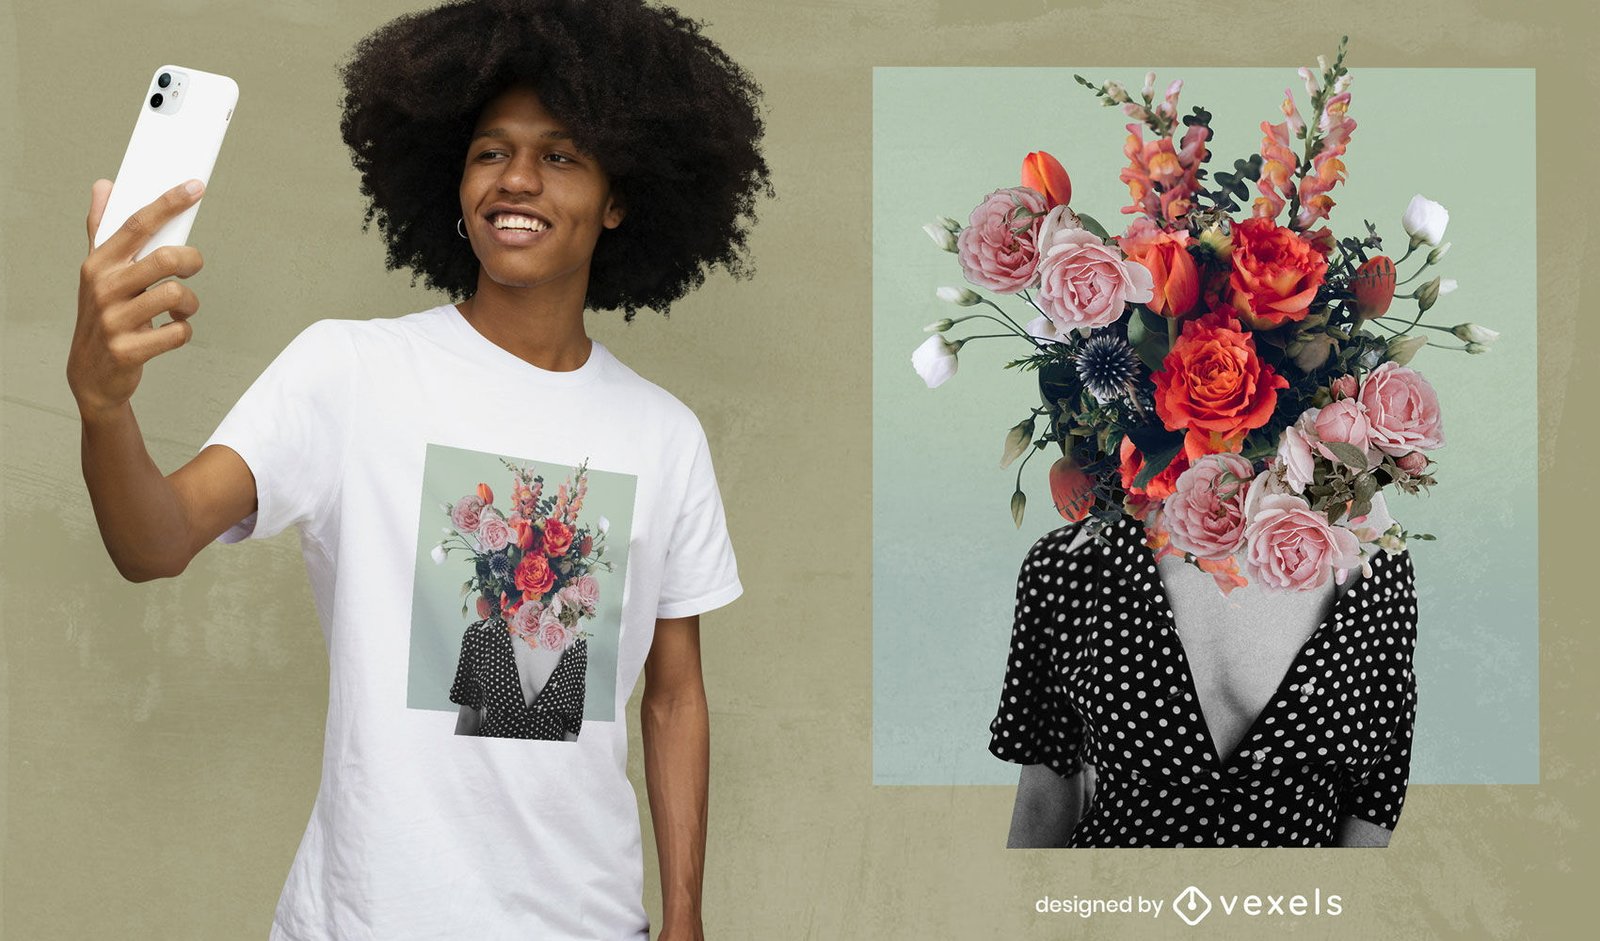
Flores desabrochando menina cabeça colagem psd design de t-shirt
Escolha uma pasta
Todos os favoritos
Criar novo
Salvar
Flores desabrochando menina cabeça colagem psd design de t-shirt
Pronto para imprimir
para Merch
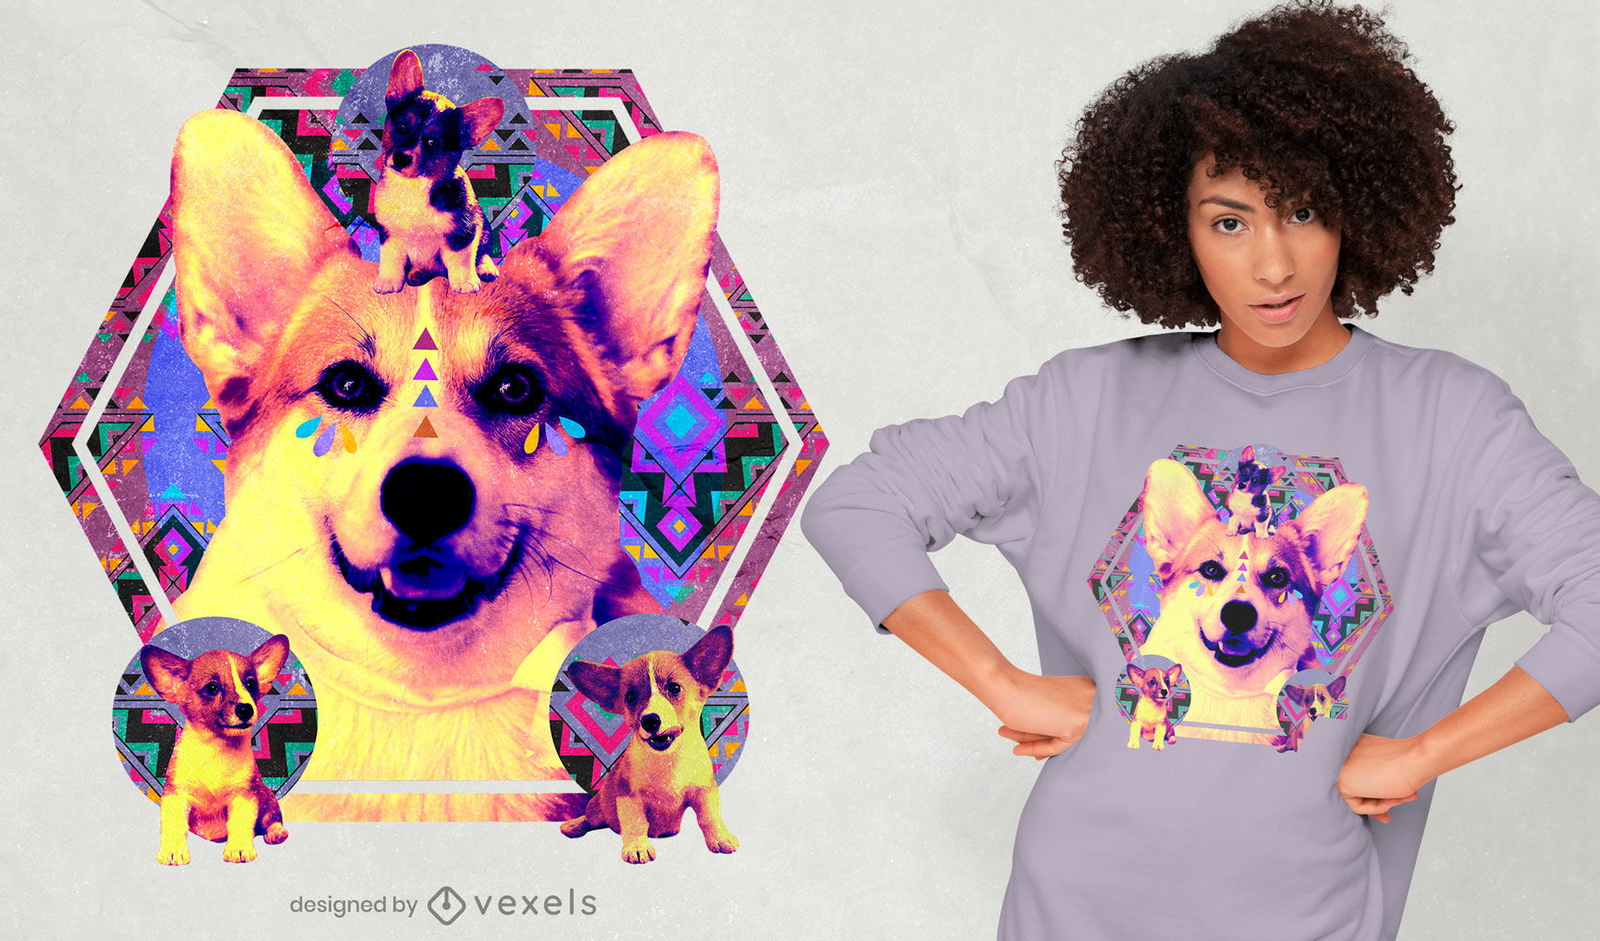
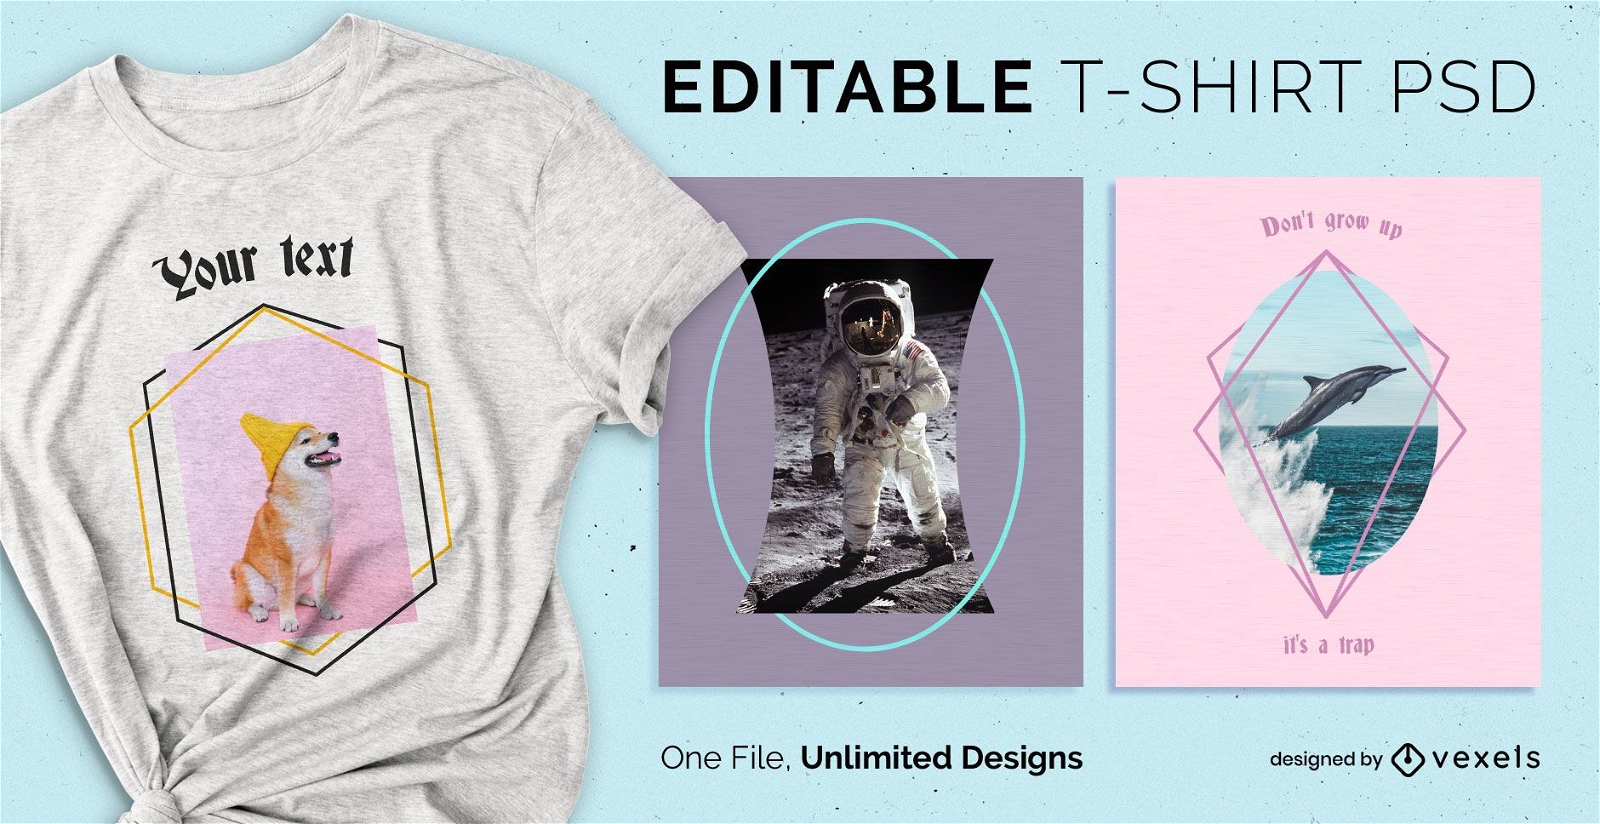
Design de t-shirt psd com colagem psicodélica Corgi
Escolha uma pasta
Todos os favoritos
Criar novo
Salvar
Design de t-shirt psd com colagem psicodélica Corgi
Pronto para imprimir
para Merch
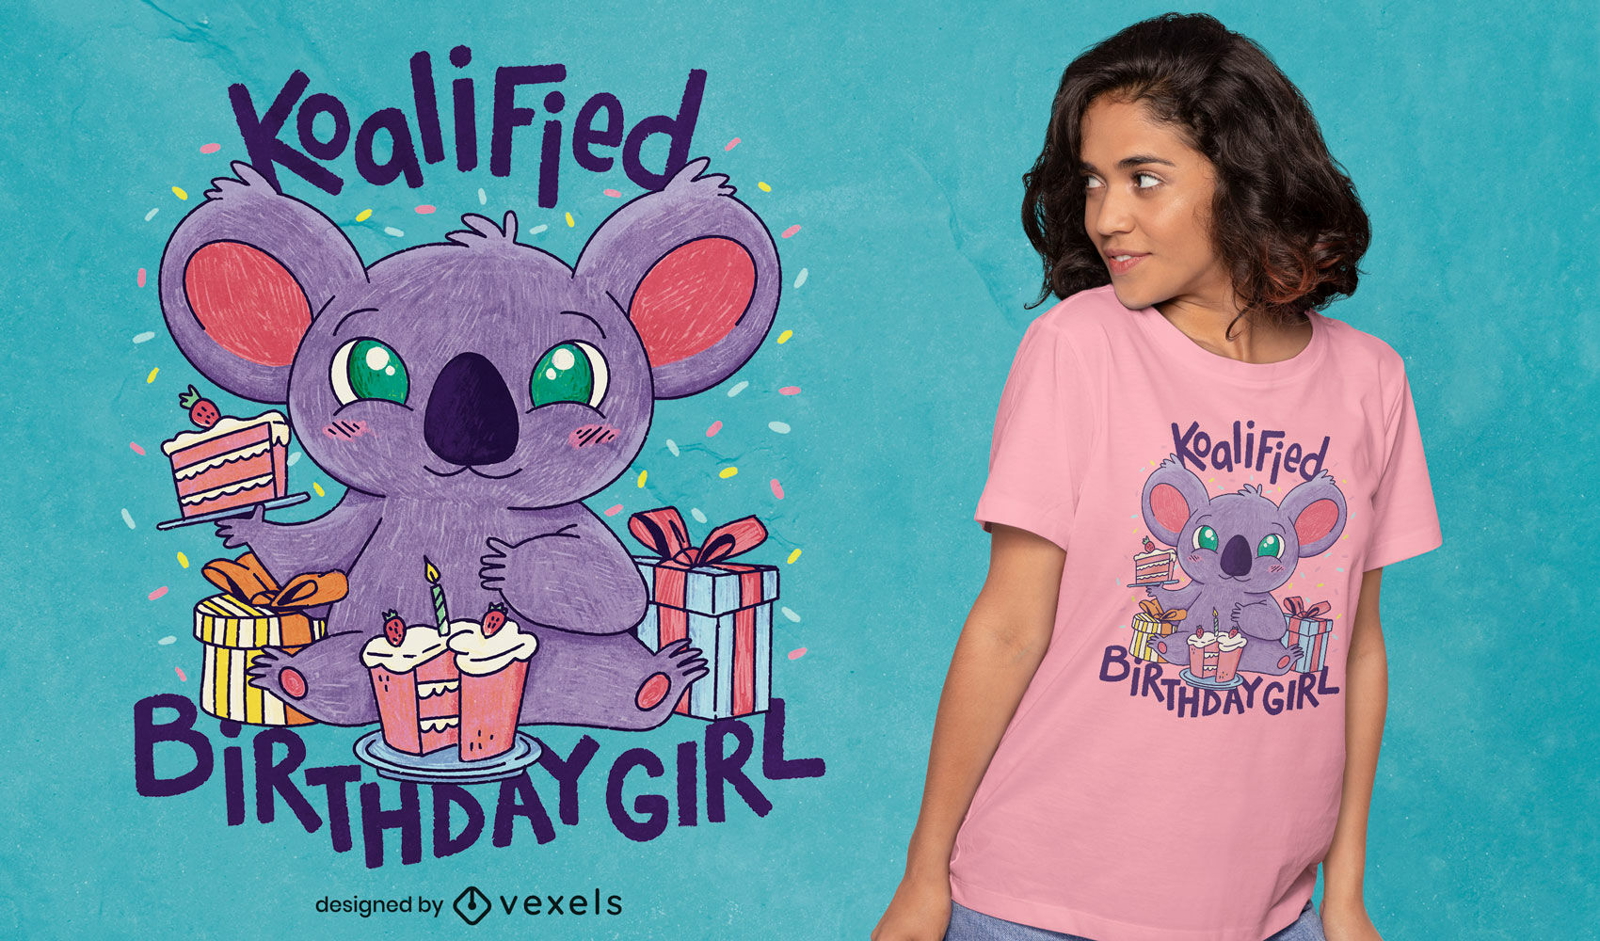
Design de t-shirt psd de aniversariante coala
Escolha uma pasta
Todos os favoritos
Criar novo
Salvar
Design de t-shirt psd de aniversariante coala
Pronto para imprimir
para Merch
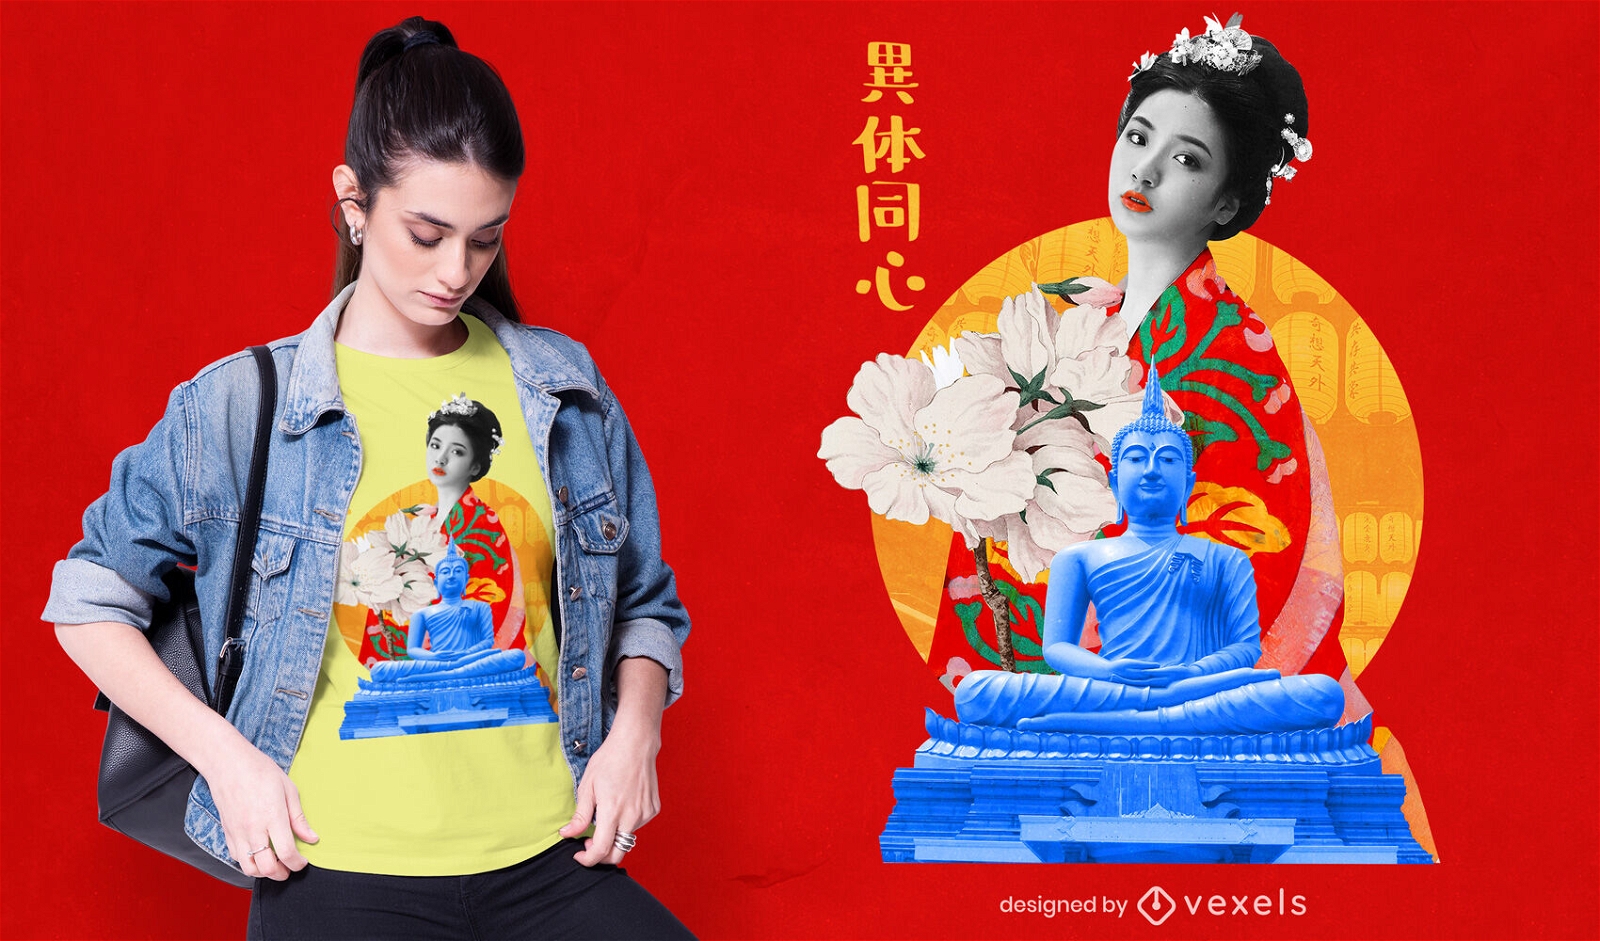
Camiseta feminina colagem japonesa psd
Escolha uma pasta
Todos os favoritos
Criar novo
Salvar
Camiseta feminina colagem japonesa psd
Camiseta PSD escalável
para Merch
T-shirt escalável Shadows psd
Escolha uma pasta
Todos os favoritos
Criar novo
Salvar
T-shirt escalável Shadows psd
Camiseta PSD escalável
para Merch
T-shirt PSD escalável frames geométricos
Escolha uma pasta
Todos os favoritos
Criar novo
Salvar
T-shirt PSD escalável frames geométricos
Camiseta PSD escalável
para Merch
Ícone escalável t-shirt psd
Escolha uma pasta
Todos os favoritos
Criar novo
Salvar
Ícone escalável t-shirt psd
Camiseta PSD escalável
para Merch
Camiseta colorida quadrada escalável psd
Escolha uma pasta
Todos os favoritos
Criar novo
Salvar
Camiseta colorida quadrada escalável psd
Pronto para imprimir
para Merch
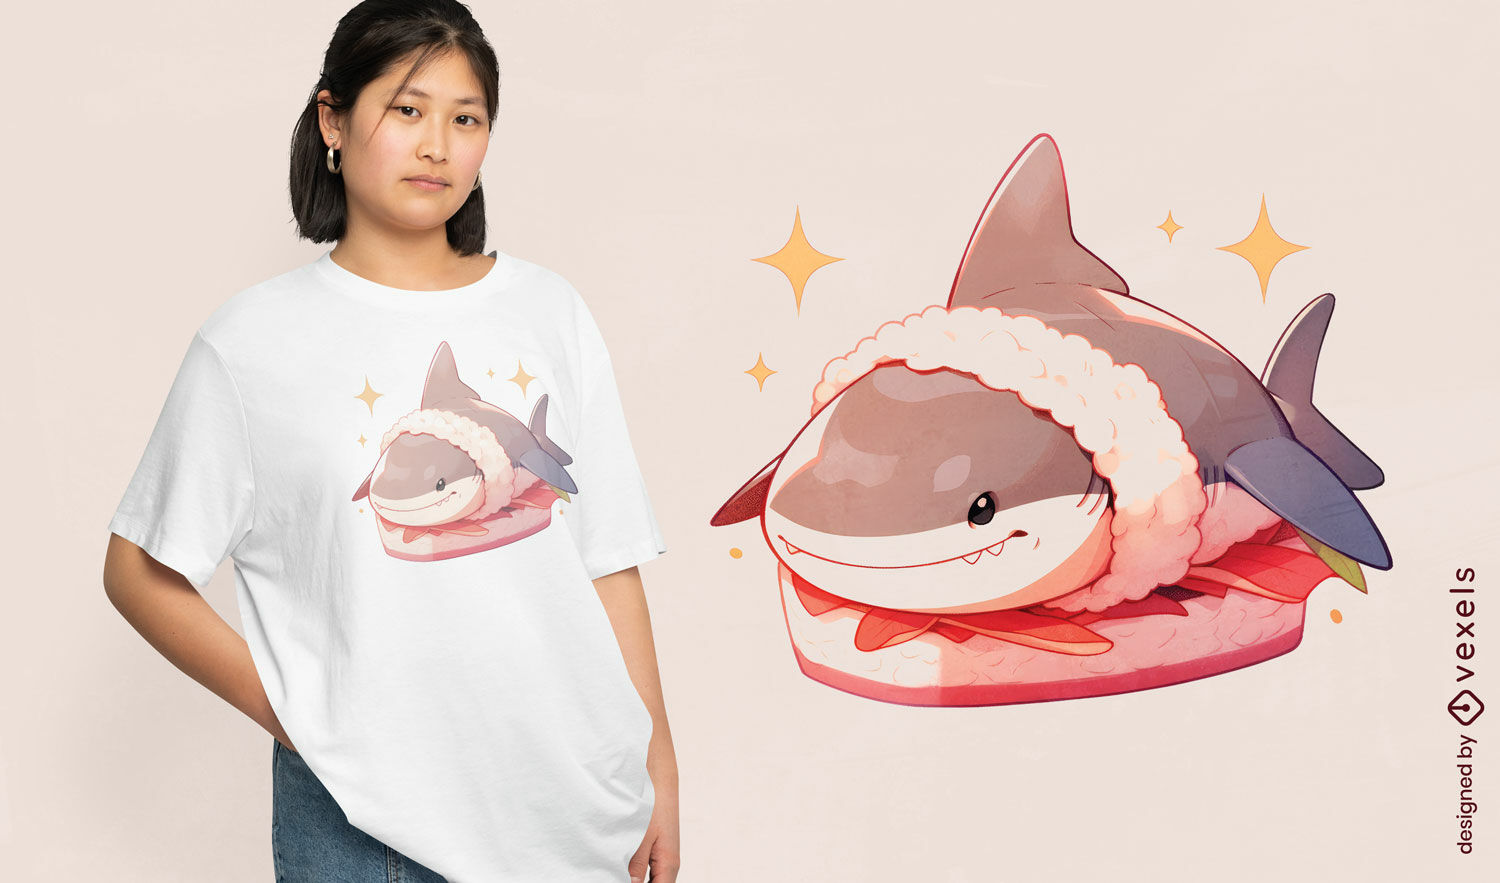
Design de camiseta de sushi de tubar?o
Escolha uma pasta
Todos os favoritos
Criar novo
Salvar
Design de camiseta de sushi de tubar?o
texto editável
Pronto para imprimir
para Merch
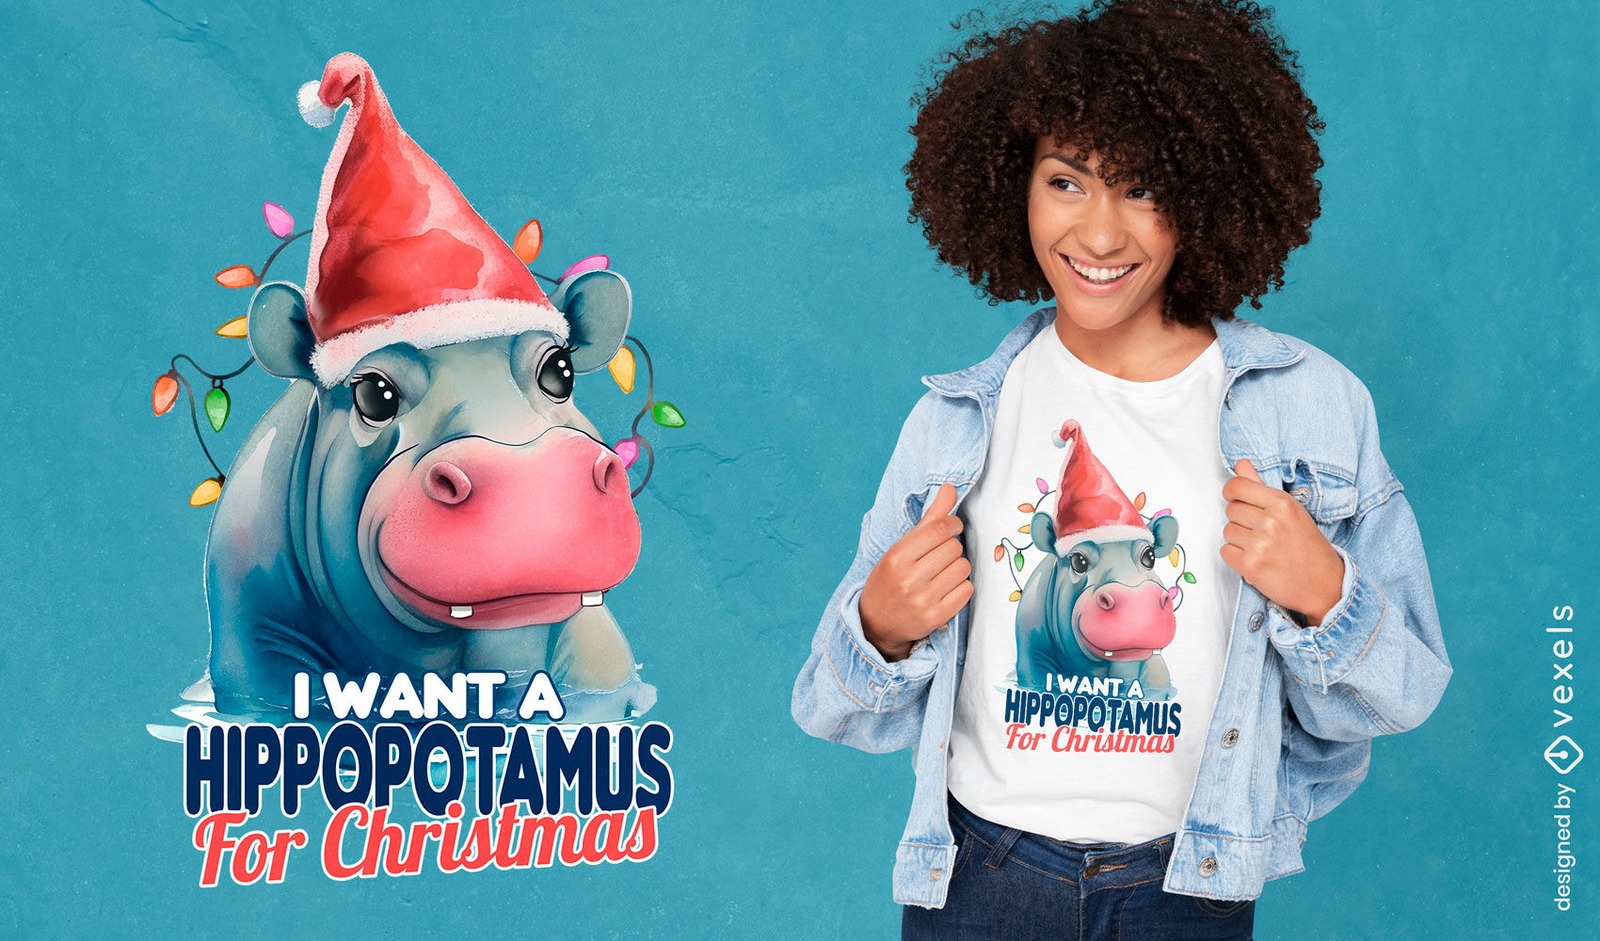
Hipopótamo para design de camiseta de Natal
Escolha uma pasta
Todos os favoritos
Criar novo
Salvar
Hipopótamo para design de camiseta de Natal
Pronto para imprimir
para Merch
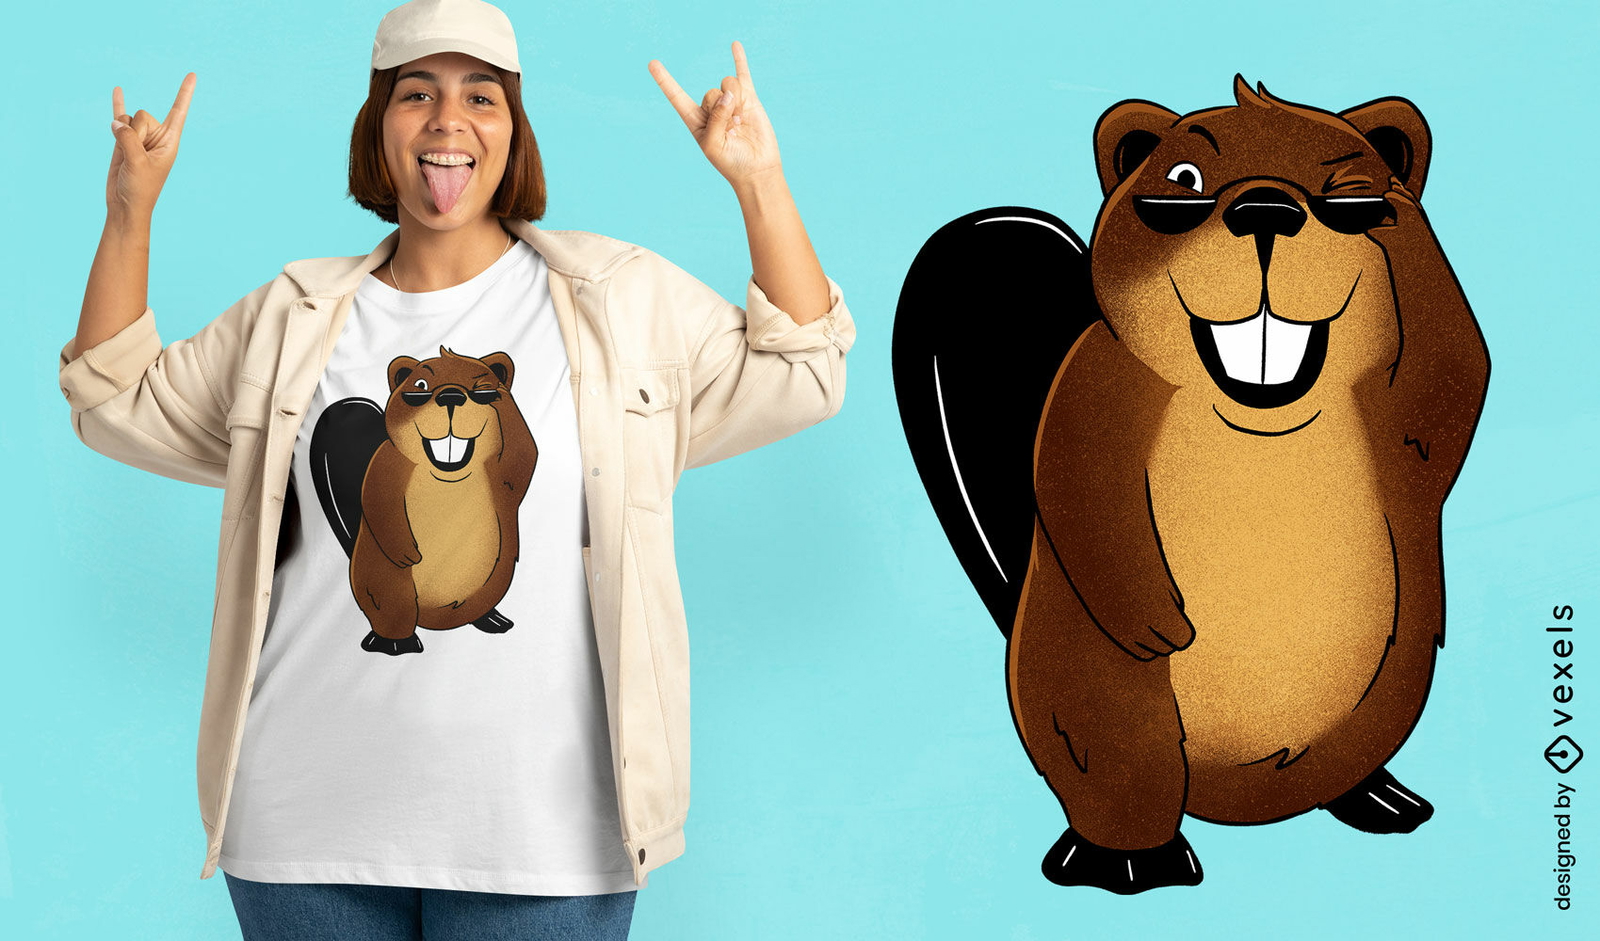
Beaver com design de camiseta de óculos de sol
Escolha uma pasta
Todos os favoritos
Criar novo
Salvar
Beaver com design de camiseta de óculos de sol
Pronto para imprimir
para Merch
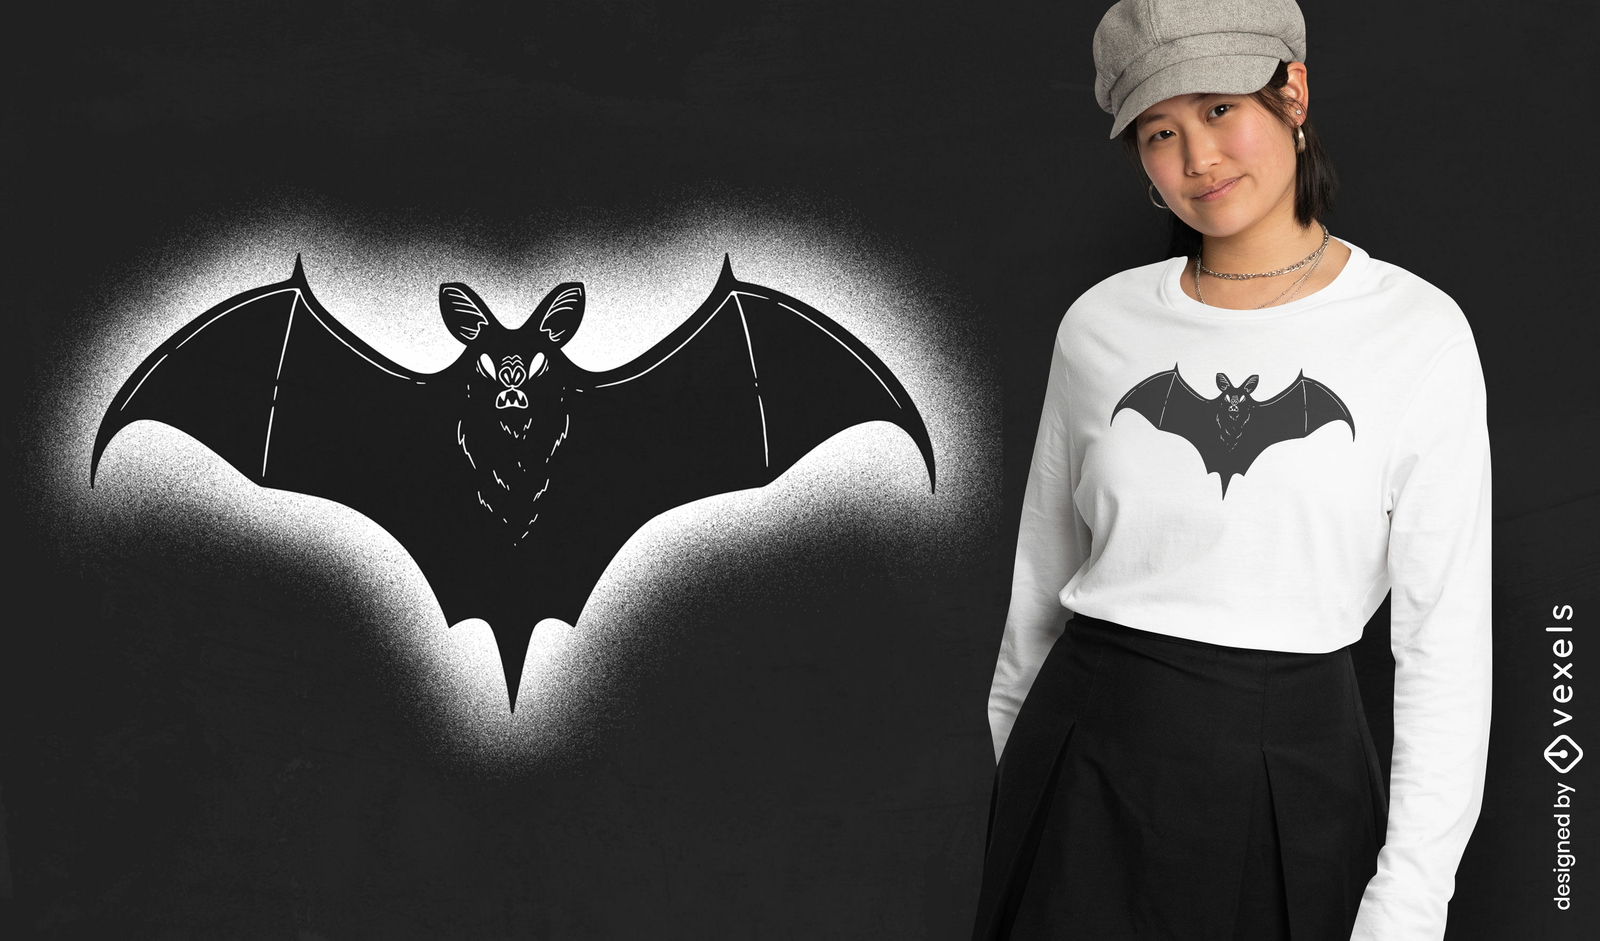
Design de camiseta com destaque de morcego gótico
Escolha uma pasta
Todos os favoritos
Criar novo
Salvar
Design de camiseta com destaque de morcego gótico
Pronto para imprimir
para Merch
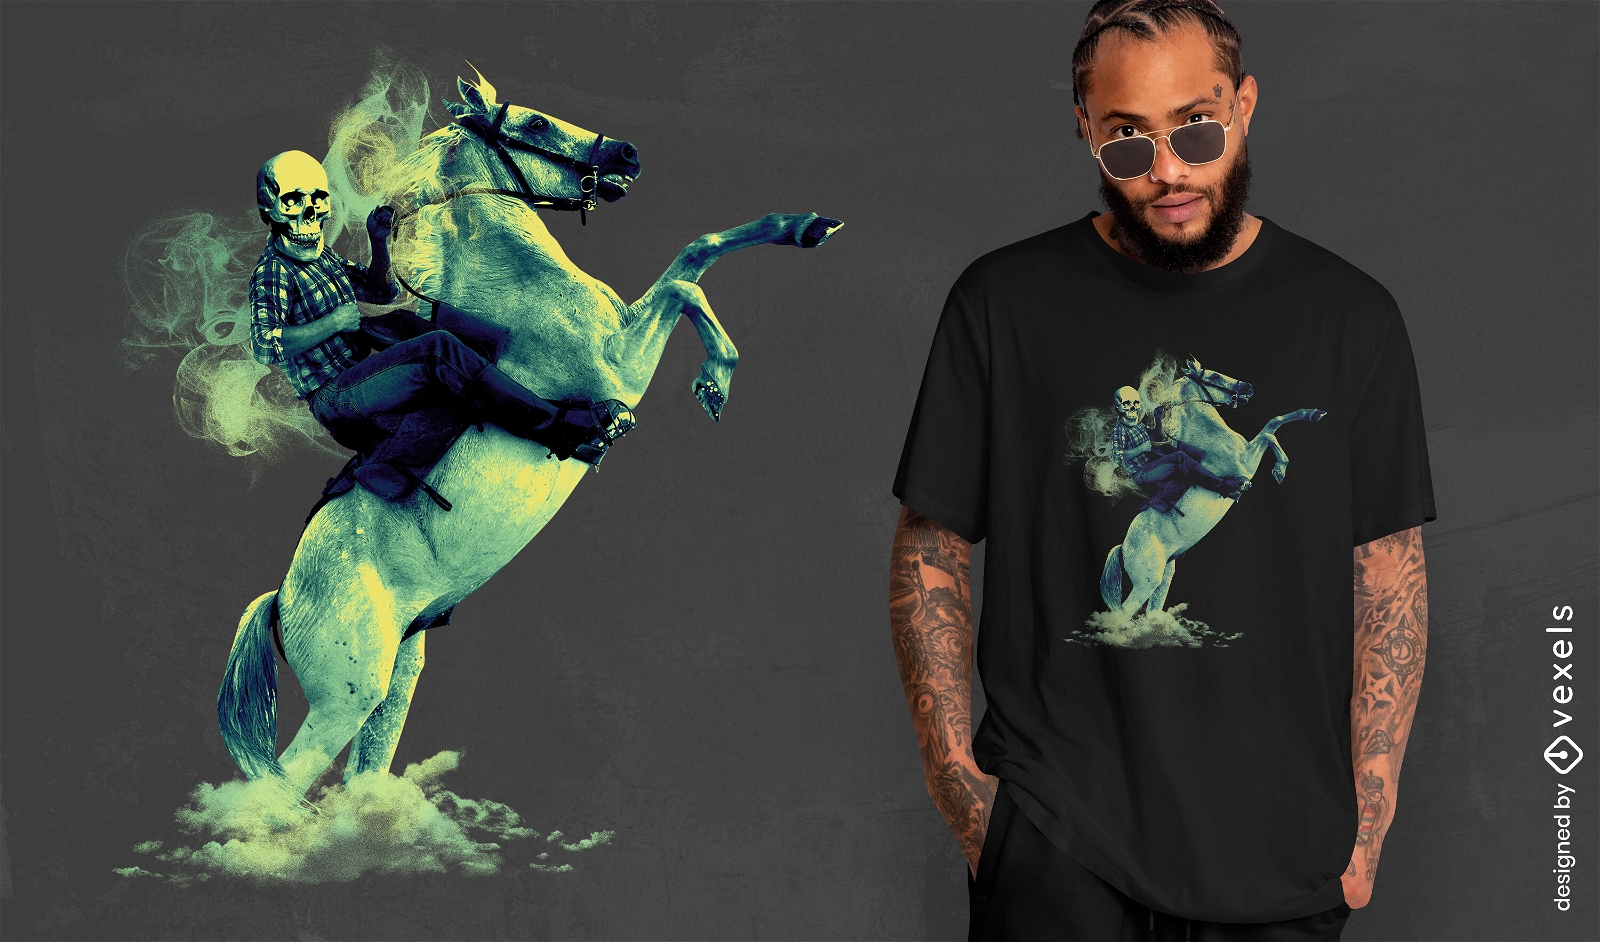
Design de camiseta PSD de fantasma de cowboy
Escolha uma pasta
Todos os favoritos
Criar novo
Salvar
Design de camiseta PSD de fantasma de cowboy
texto editável
Pronto para imprimir
para Merch
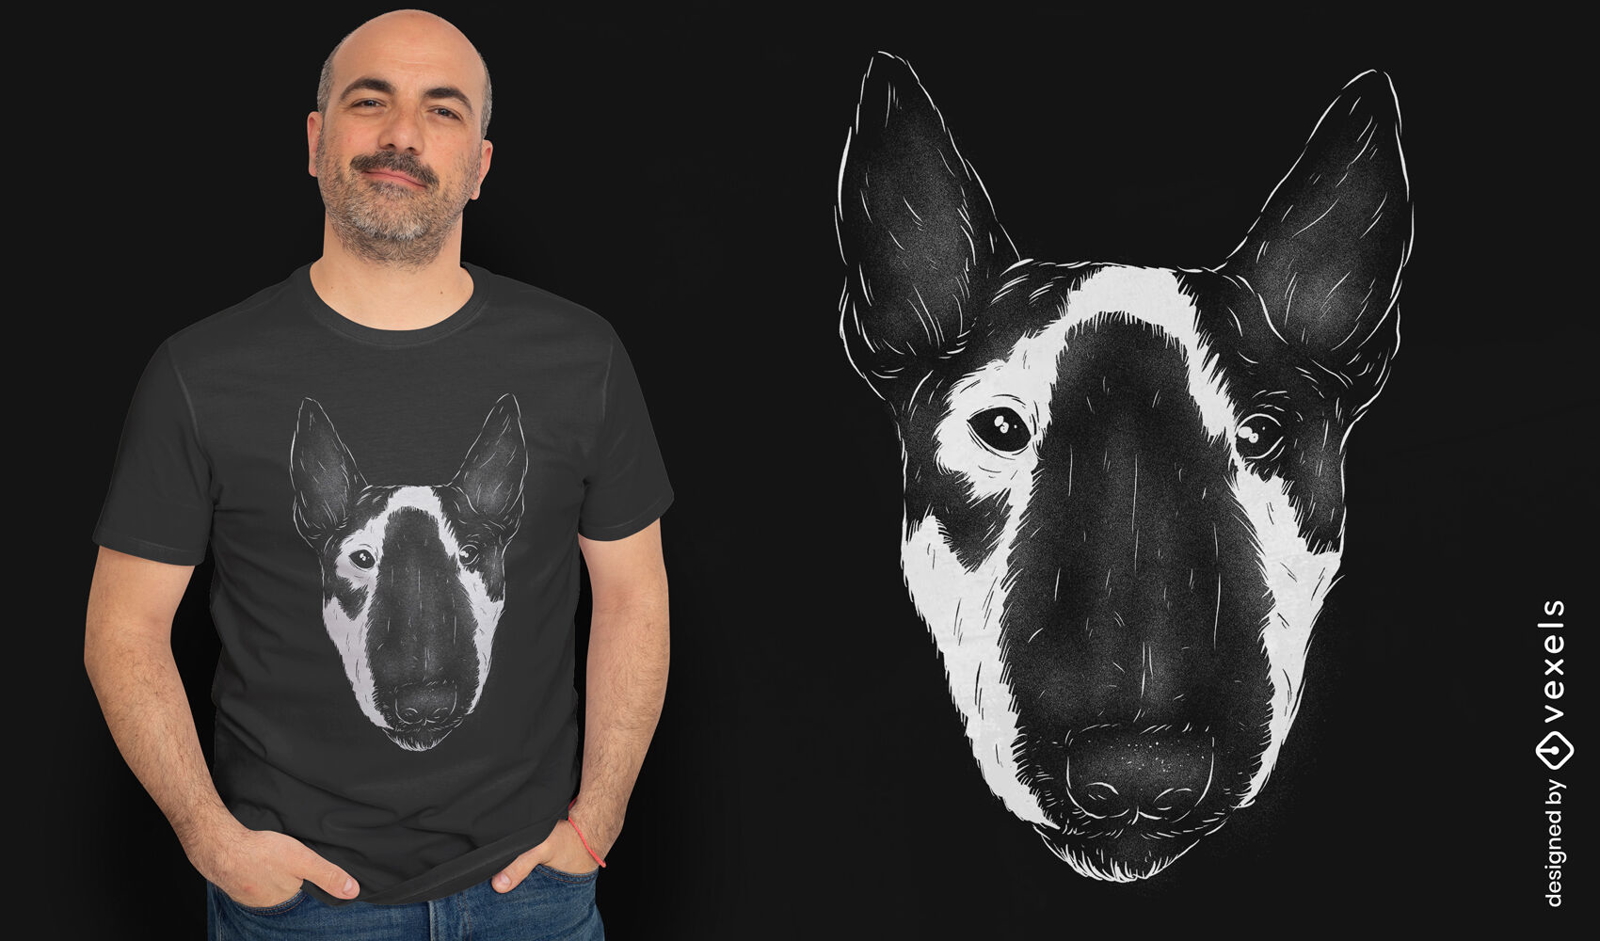
Design de camiseta realista de cachorro bull terrier
Escolha uma pasta
Todos os favoritos
Criar novo
Salvar
Design de camiseta realista de cachorro bull terrier
Pronto para imprimir
para Merch
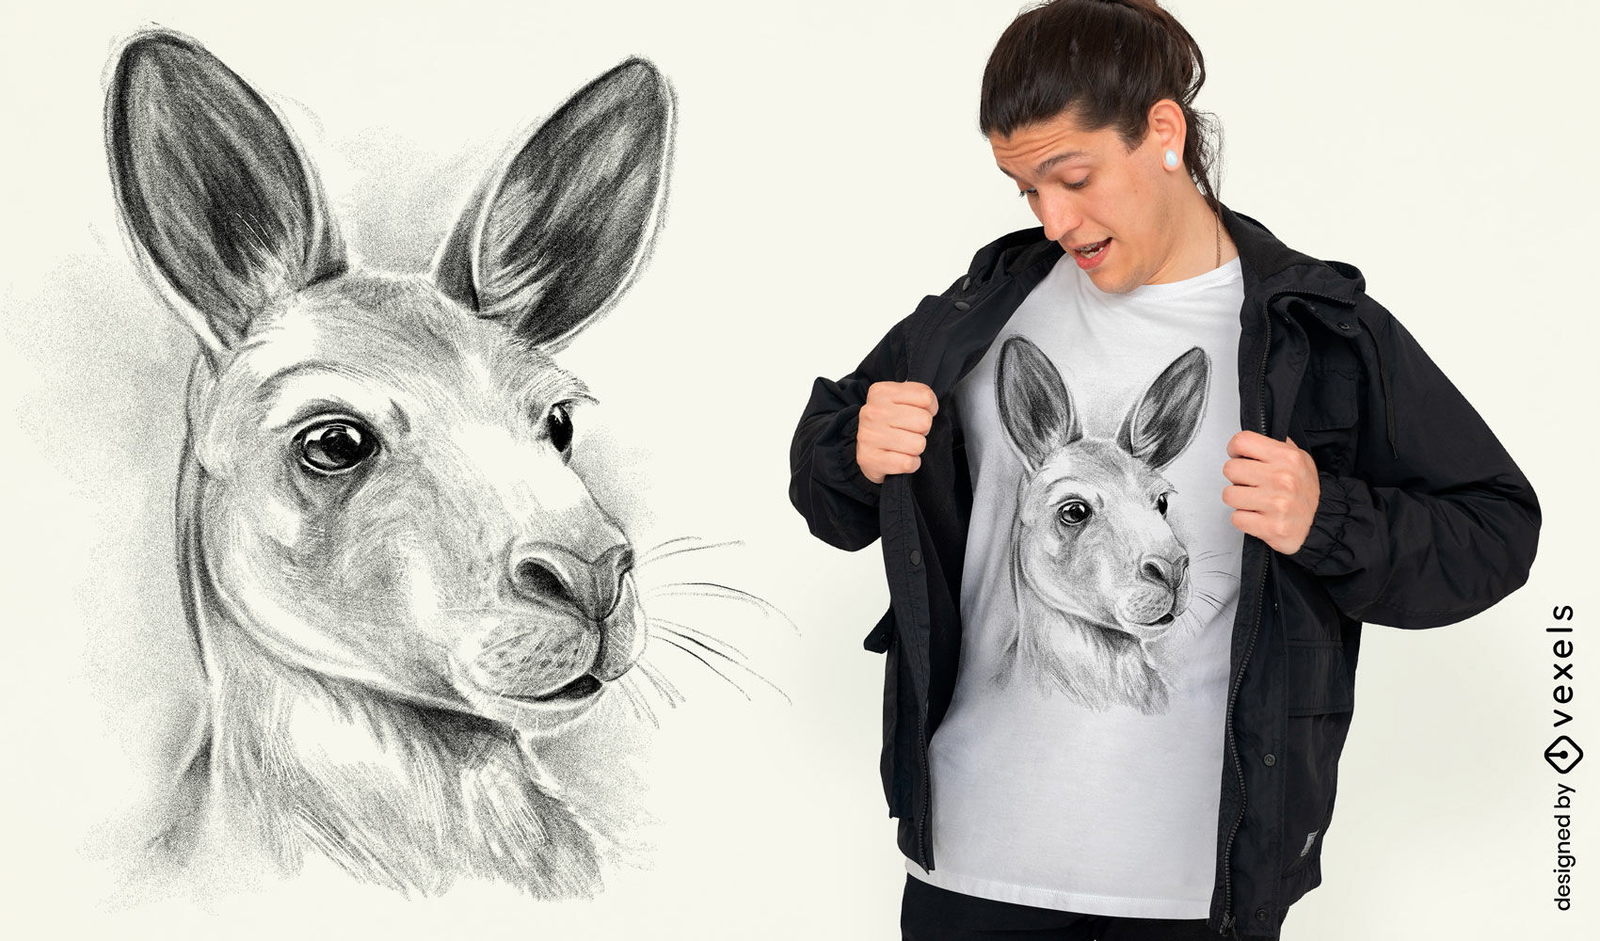
Design de camiseta de ilustração de canguru
Escolha uma pasta
Todos os favoritos
Criar novo
Salvar
Design de camiseta de ilustração de canguru
Pronto para imprimir
para Merch
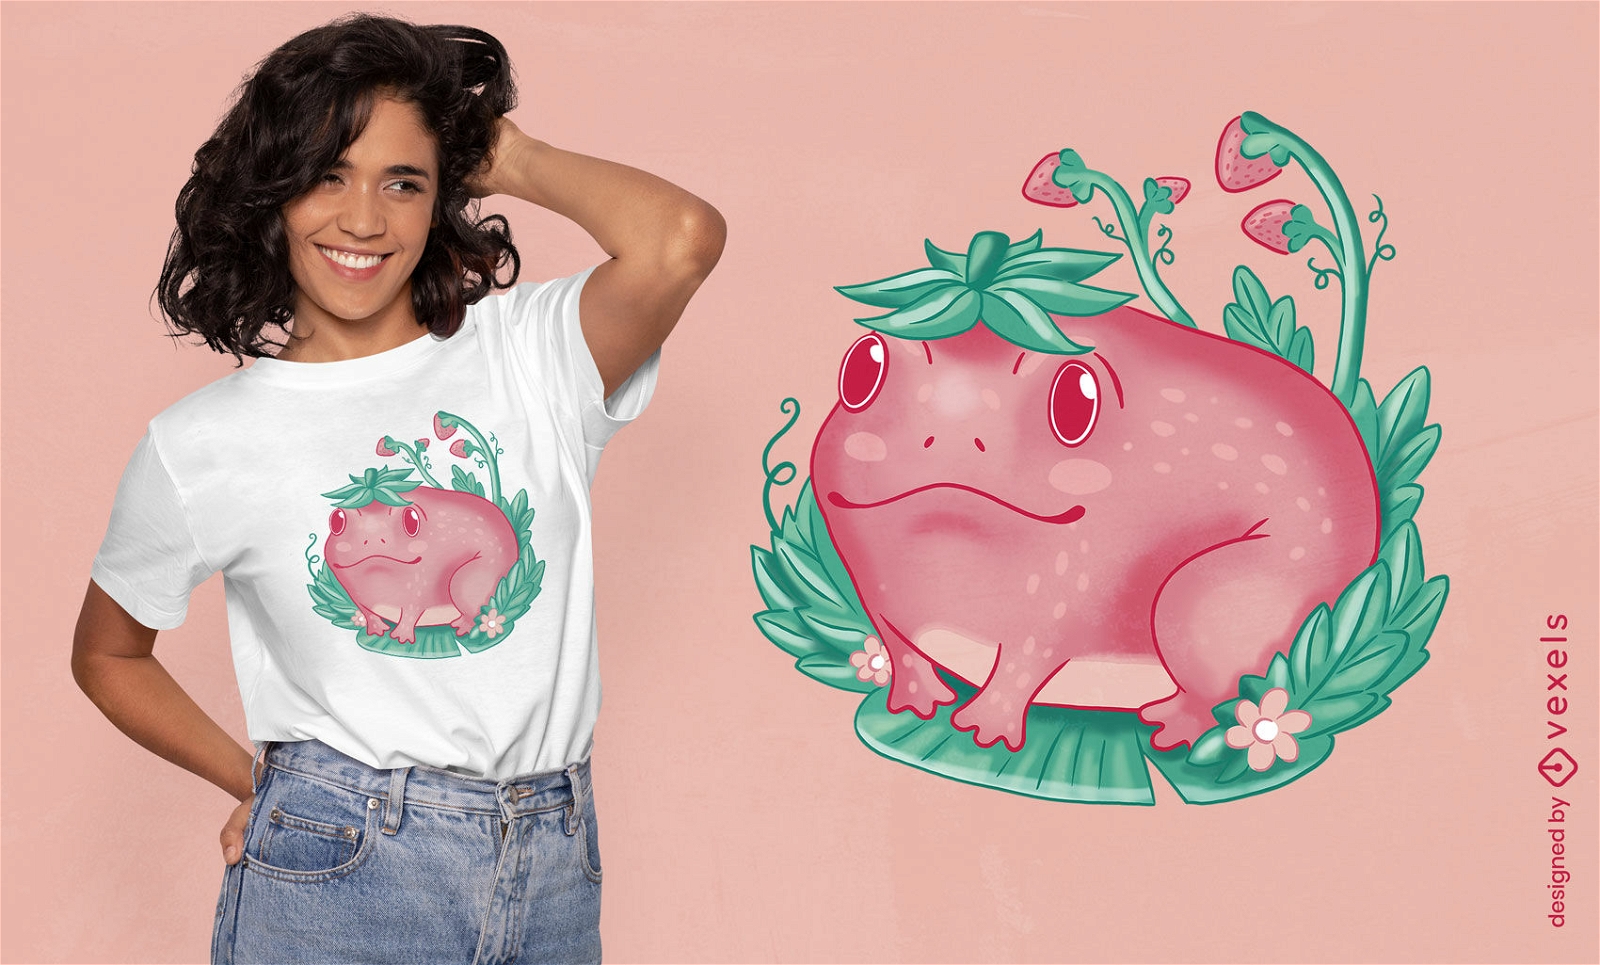
Design de camiseta de sapo feliz de morango kawaii
Escolha uma pasta
Todos os favoritos
Criar novo
Salvar
Design de camiseta de sapo feliz de morango kawaii
Pronto para imprimir
para Merch
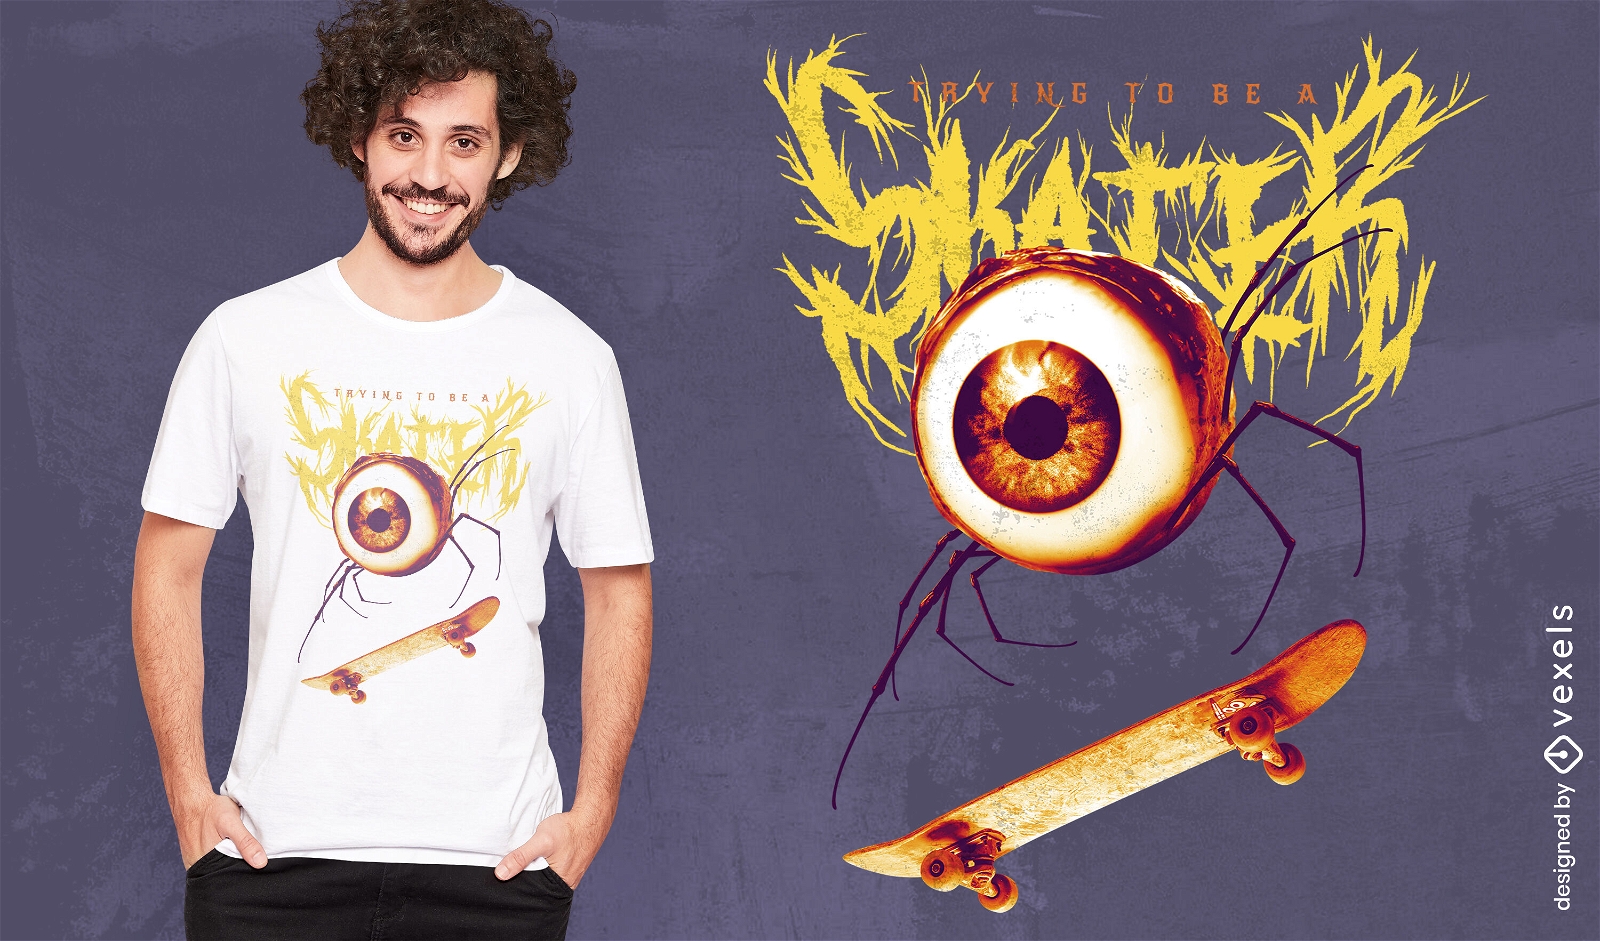
Olho no design de camiseta bizarra de skate
Escolha uma pasta
Todos os favoritos
Criar novo
Salvar
Olho no design de camiseta bizarra de skate
Pronto para imprimir
para Merch
Mulher com cabelo curto e t-shirt de óculos de sol psd
Escolha uma pasta
Todos os favoritos
Criar novo
Salvar
Mulher com cabelo curto e t-shirt de óculos de sol psd
Pronto para imprimir
para Merch
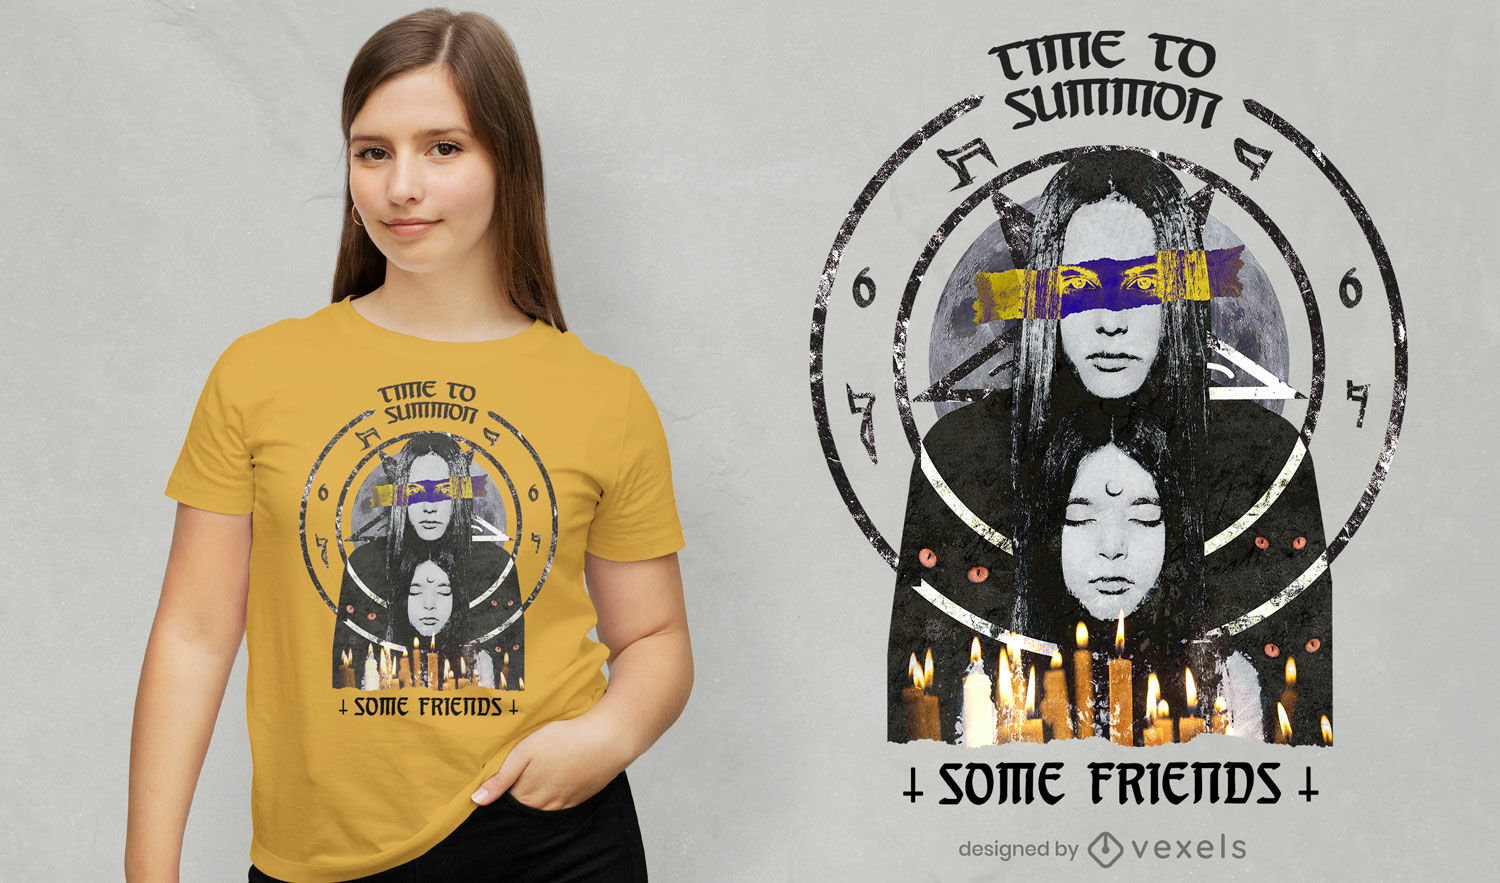
Halloween convocando camiseta fotográfica psd
Escolha uma pasta
Todos os favoritos
Criar novo
Salvar
Halloween convocando camiseta fotográfica psd
Pronto para imprimir
para Merch
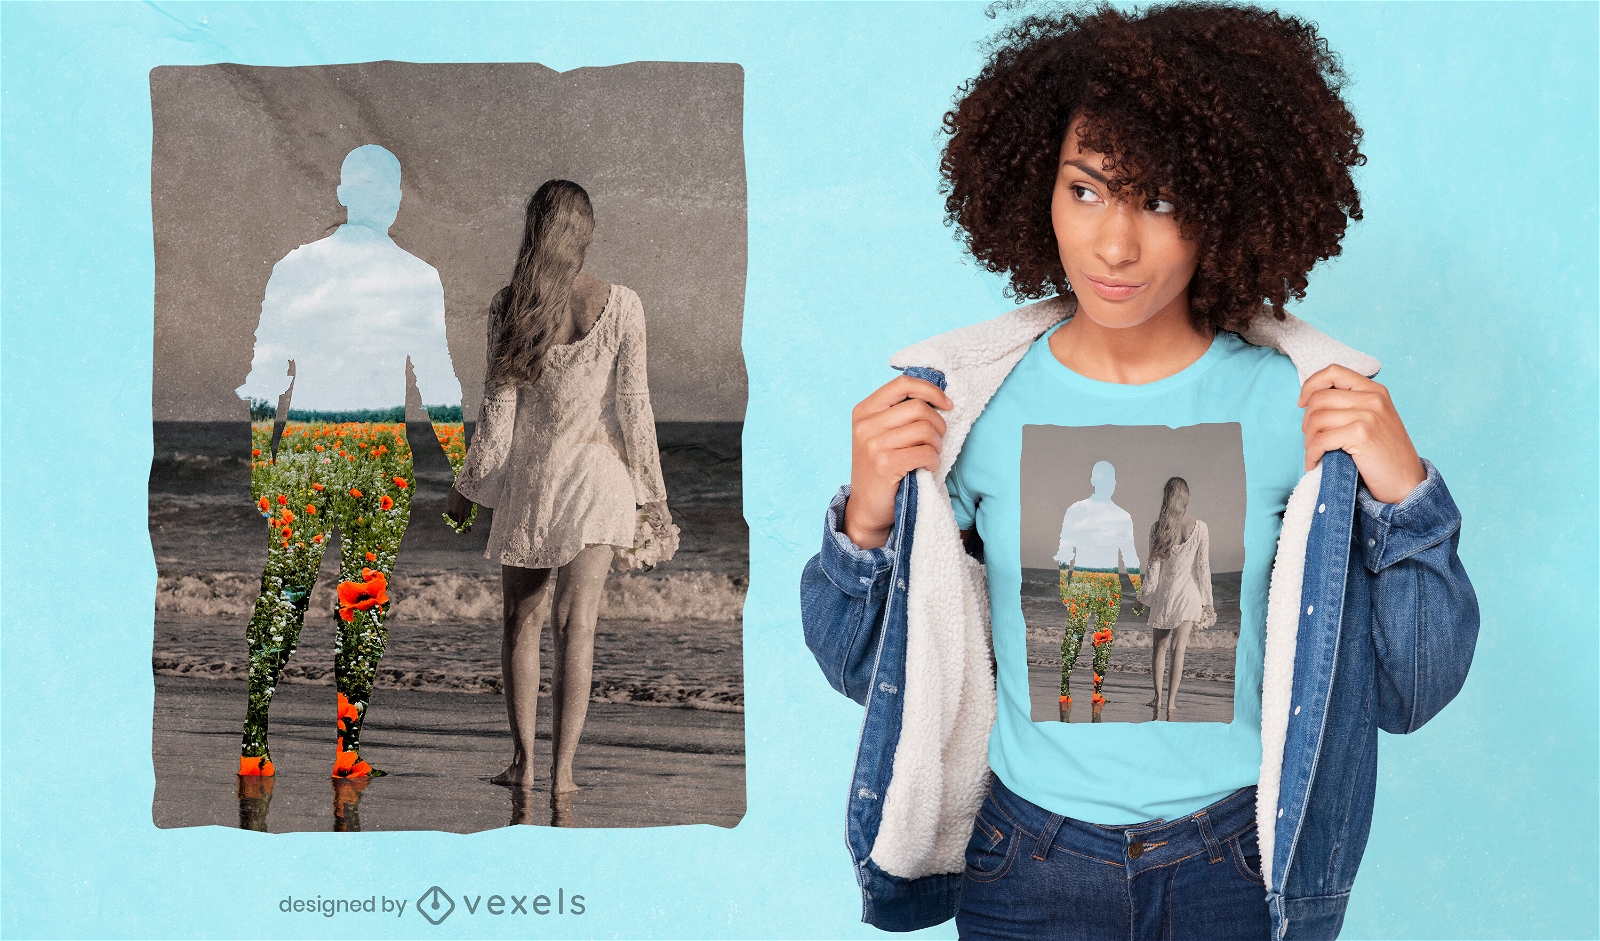
Casal na praia recortou camiseta colada em psd
Escolha uma pasta
Todos os favoritos
Criar novo
Salvar
Casal na praia recortou camiseta colada em psd
Camiseta PSD escalável
para Merch
Cube t-shirt design psd
Escolha uma pasta
Todos os favoritos
Criar novo
Salvar
Cube t-shirt design psd
Camiseta PSD escalável
para Merch
Design de t-shirt psd de máscara de corte
Escolha uma pasta
Todos os favoritos
Criar novo
Salvar
Design de t-shirt psd de máscara de corte
Camiseta PSD escalável
para Merch
Resumo de curvas t-shirt design psd
Escolha uma pasta
Todos os favoritos
Criar novo
Salvar
Resumo de curvas t-shirt design psd
Camiseta PSD escalável
para Merch
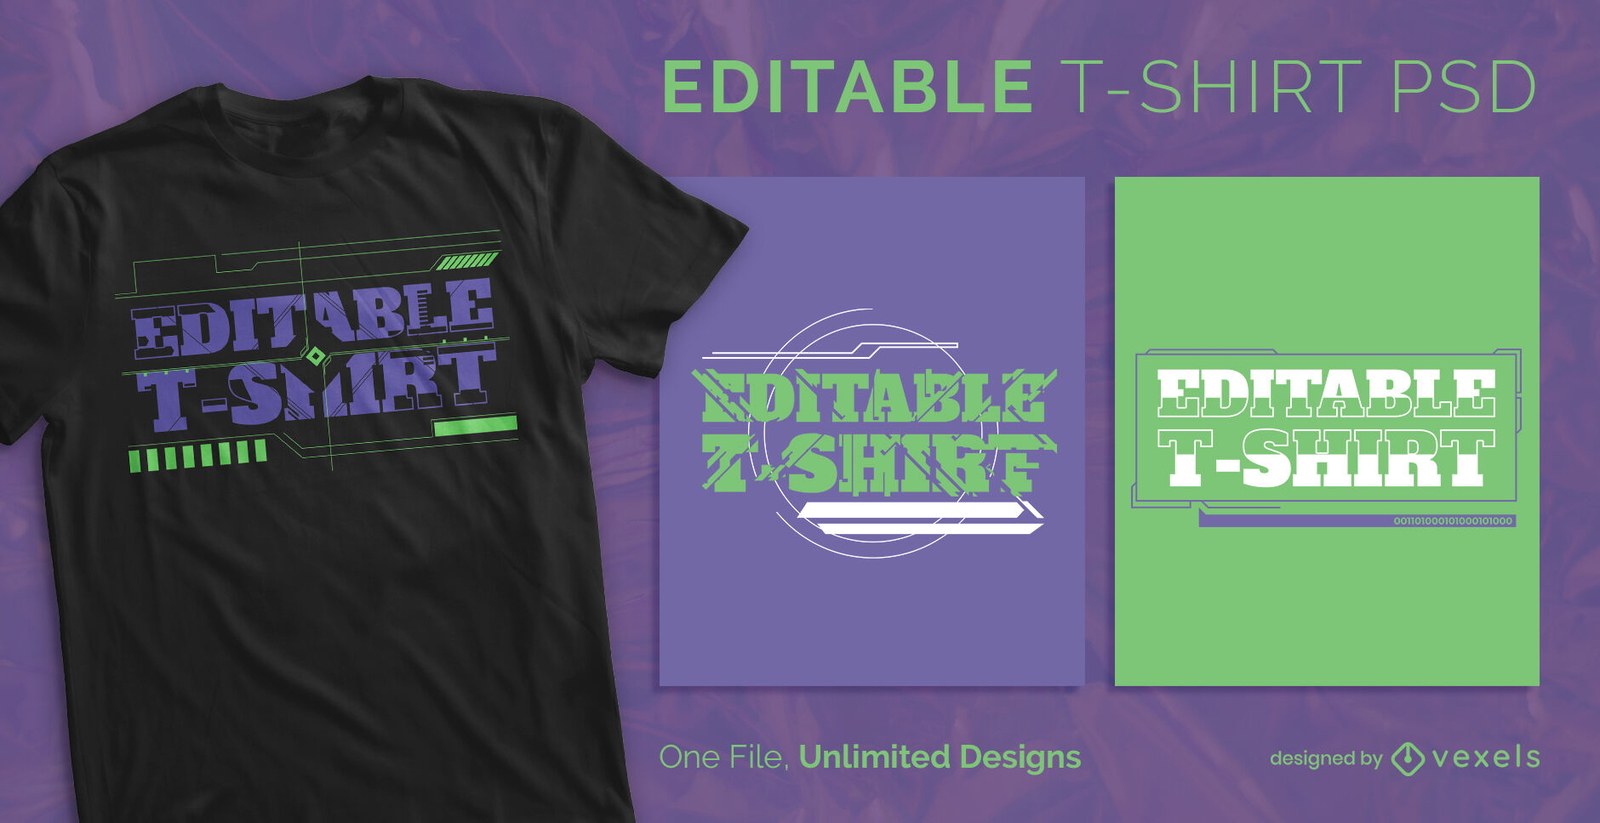
Design de t-shirt com moldura de texto simples PSD
Escolha uma pasta
Todos os favoritos
Criar novo
Salvar
Design de t-shirt com moldura de texto simples PSD
Gerado por IA, selecionado por nossos designers.
para Merch
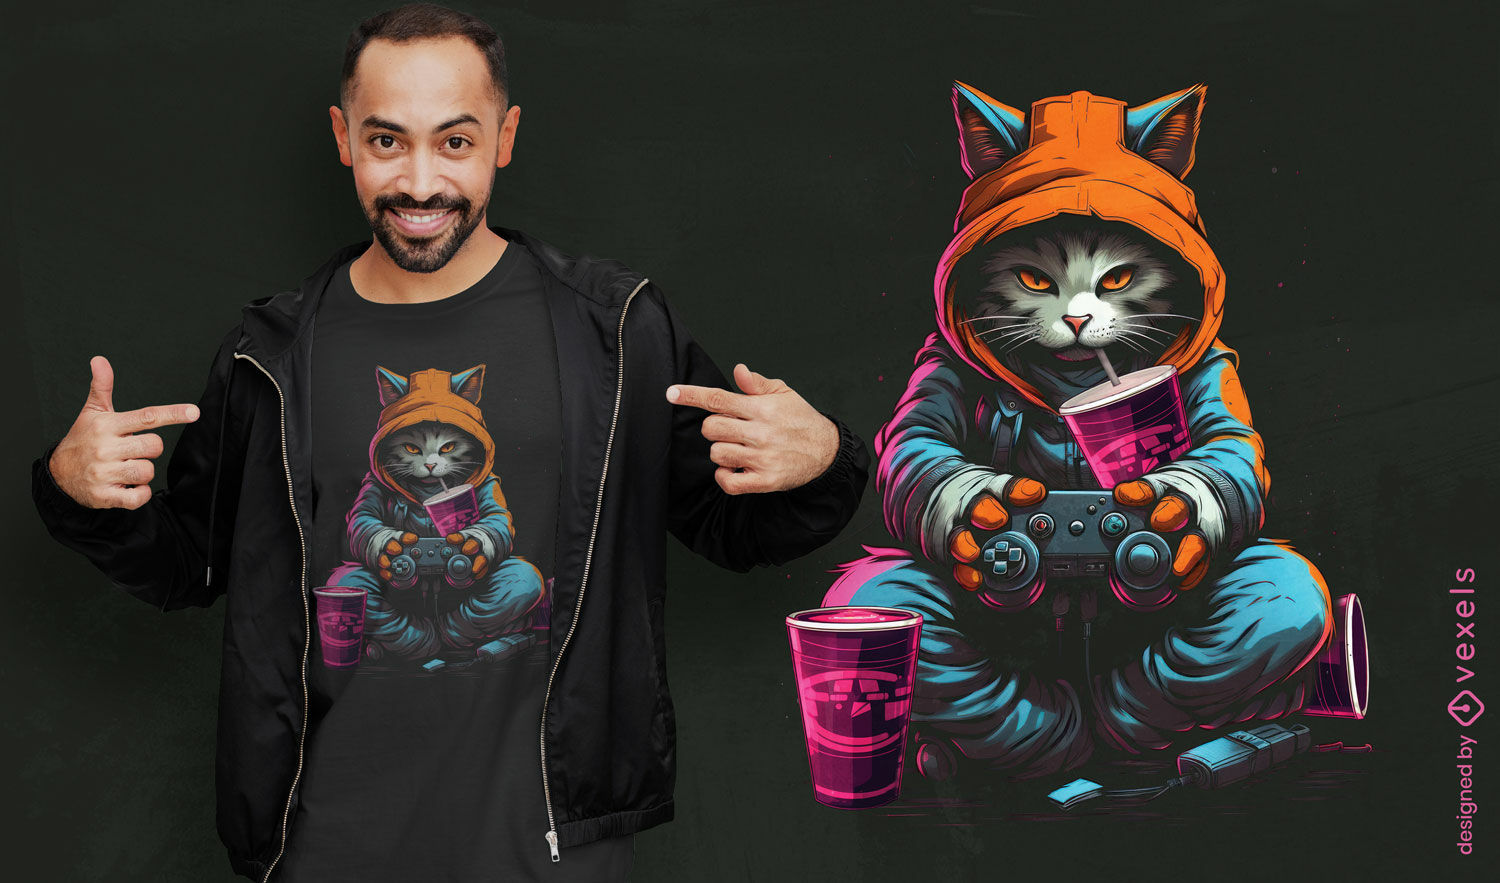
Design de camiseta com ilustra??o de gato gamer
Escolha uma pasta
Todos os favoritos
Criar novo
Salvar
Design de camiseta com ilustra??o de gato gamer
Gerado por IA, selecionado por nossos designers.
para Merch
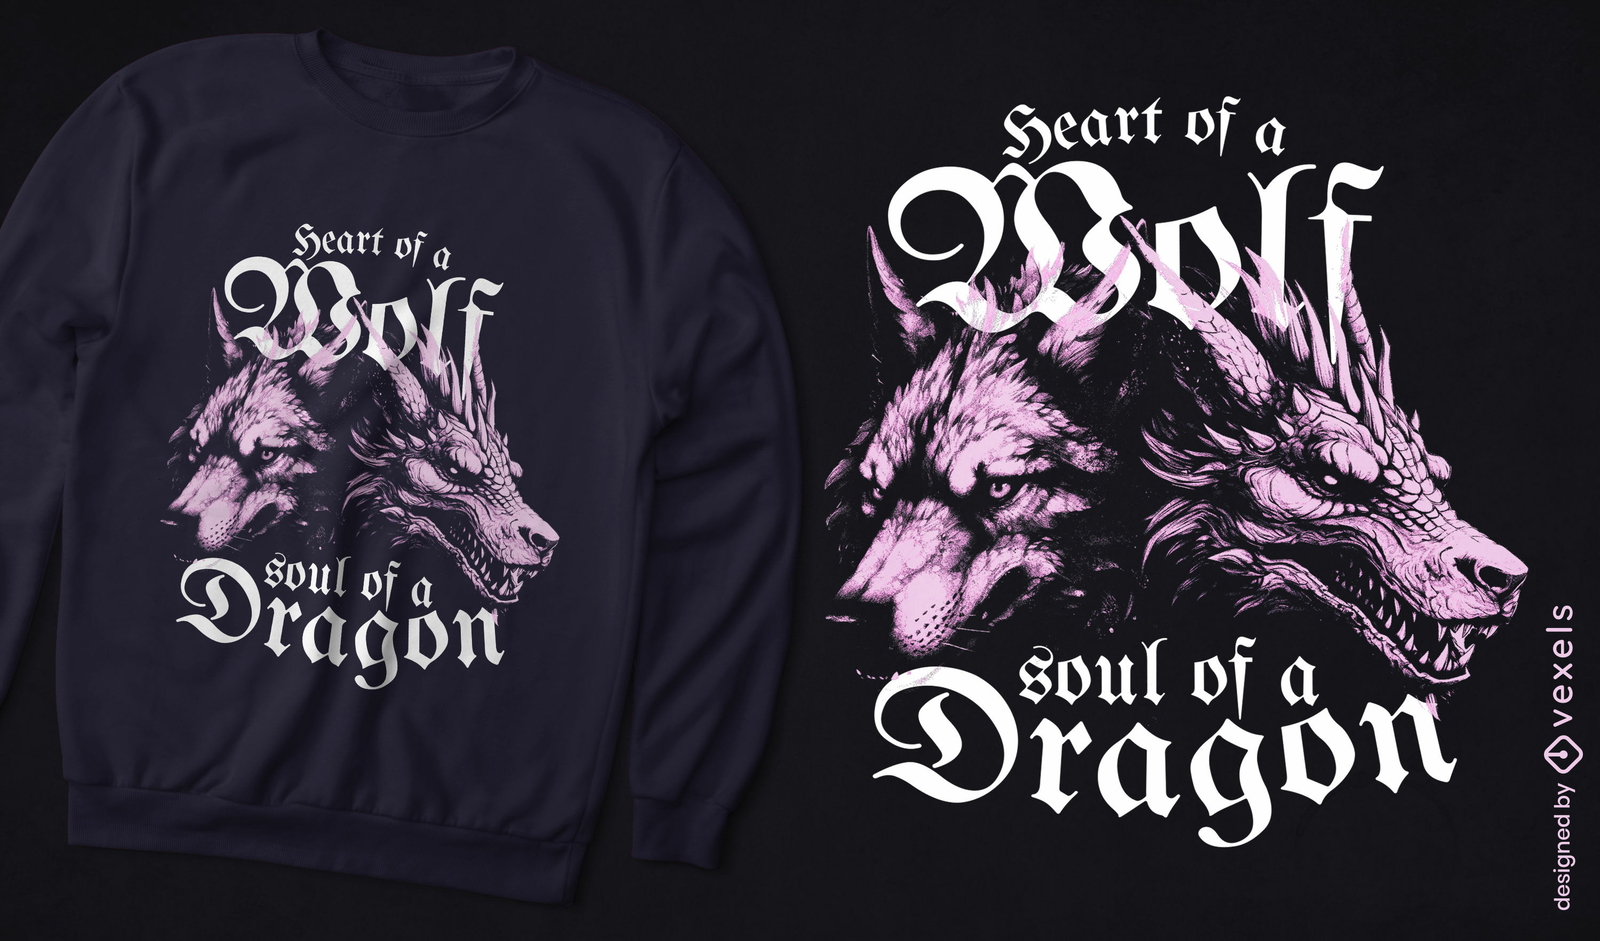
Design de camiseta com espírito de lobo e dragão
Escolha uma pasta
Todos os favoritos
Criar novo
Salvar
Design de camiseta com espírito de lobo e dragão
Pronto para imprimir
para Merch
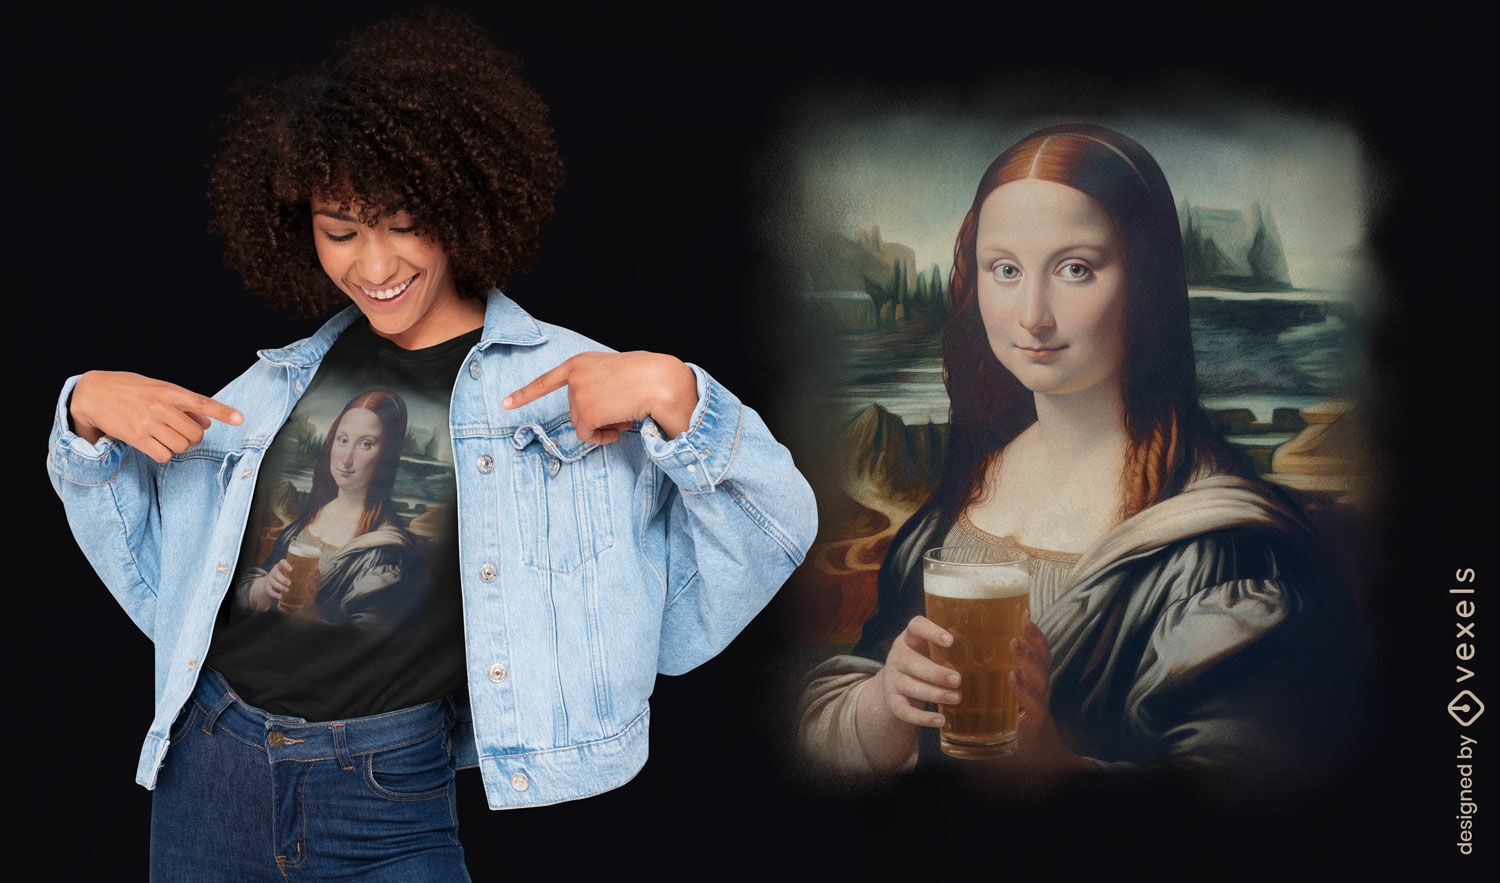
Design de camiseta da cerveja Mona Lisa
Escolha uma pasta
Todos os favoritos
Criar novo
Salvar
Design de camiseta da cerveja Mona Lisa
Pronto para imprimir
para Merch
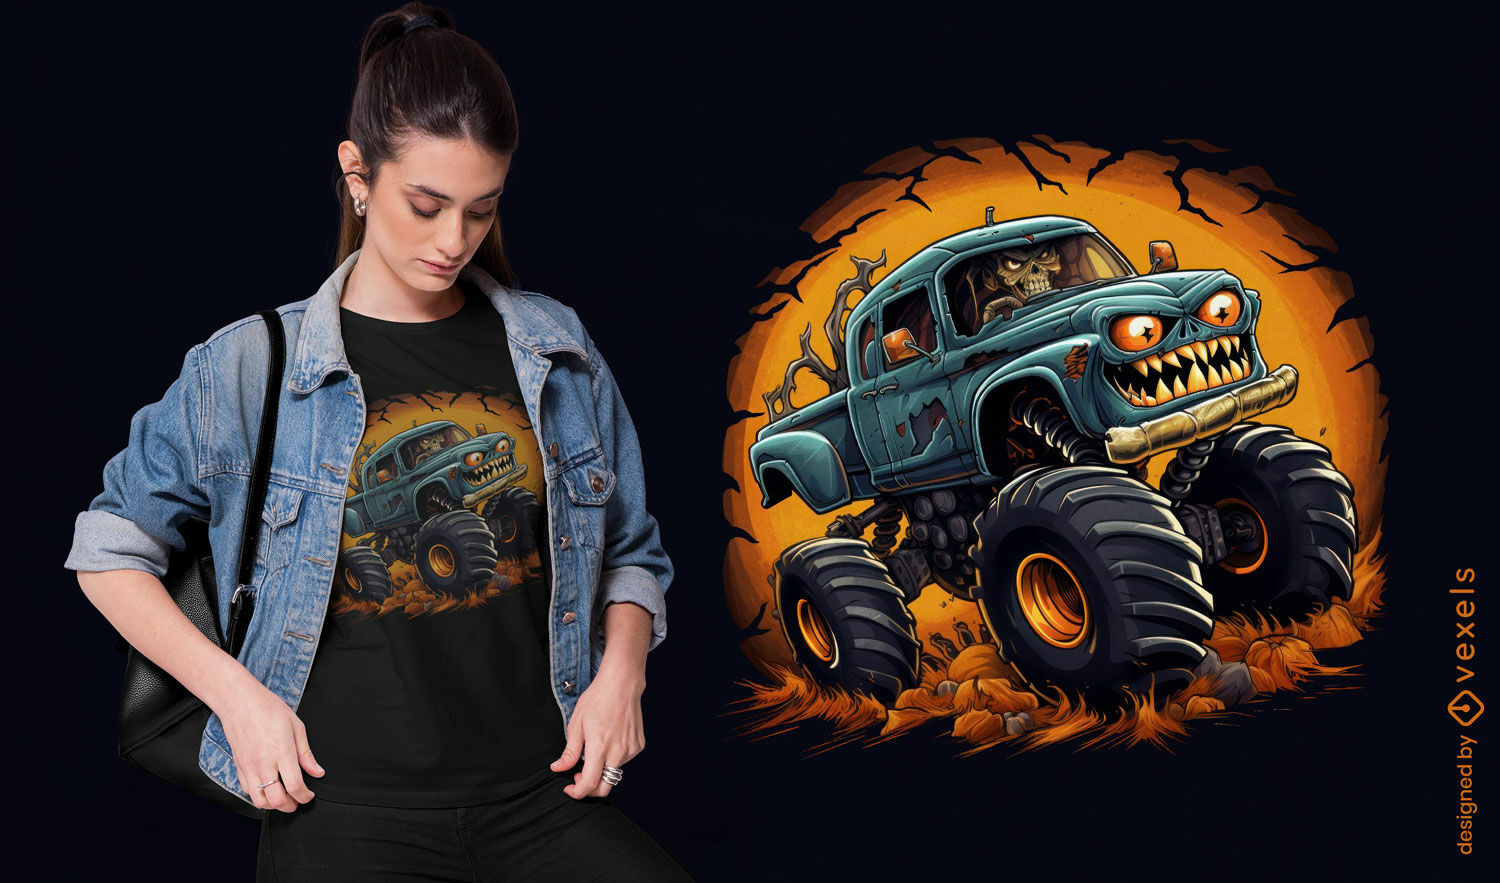
Design de camiseta de Halloween para caminhão monstro
Escolha uma pasta
Todos os favoritos
Criar novo
Salvar
Design de camiseta de Halloween para caminhão monstro
Pronto para imprimir
para Merch
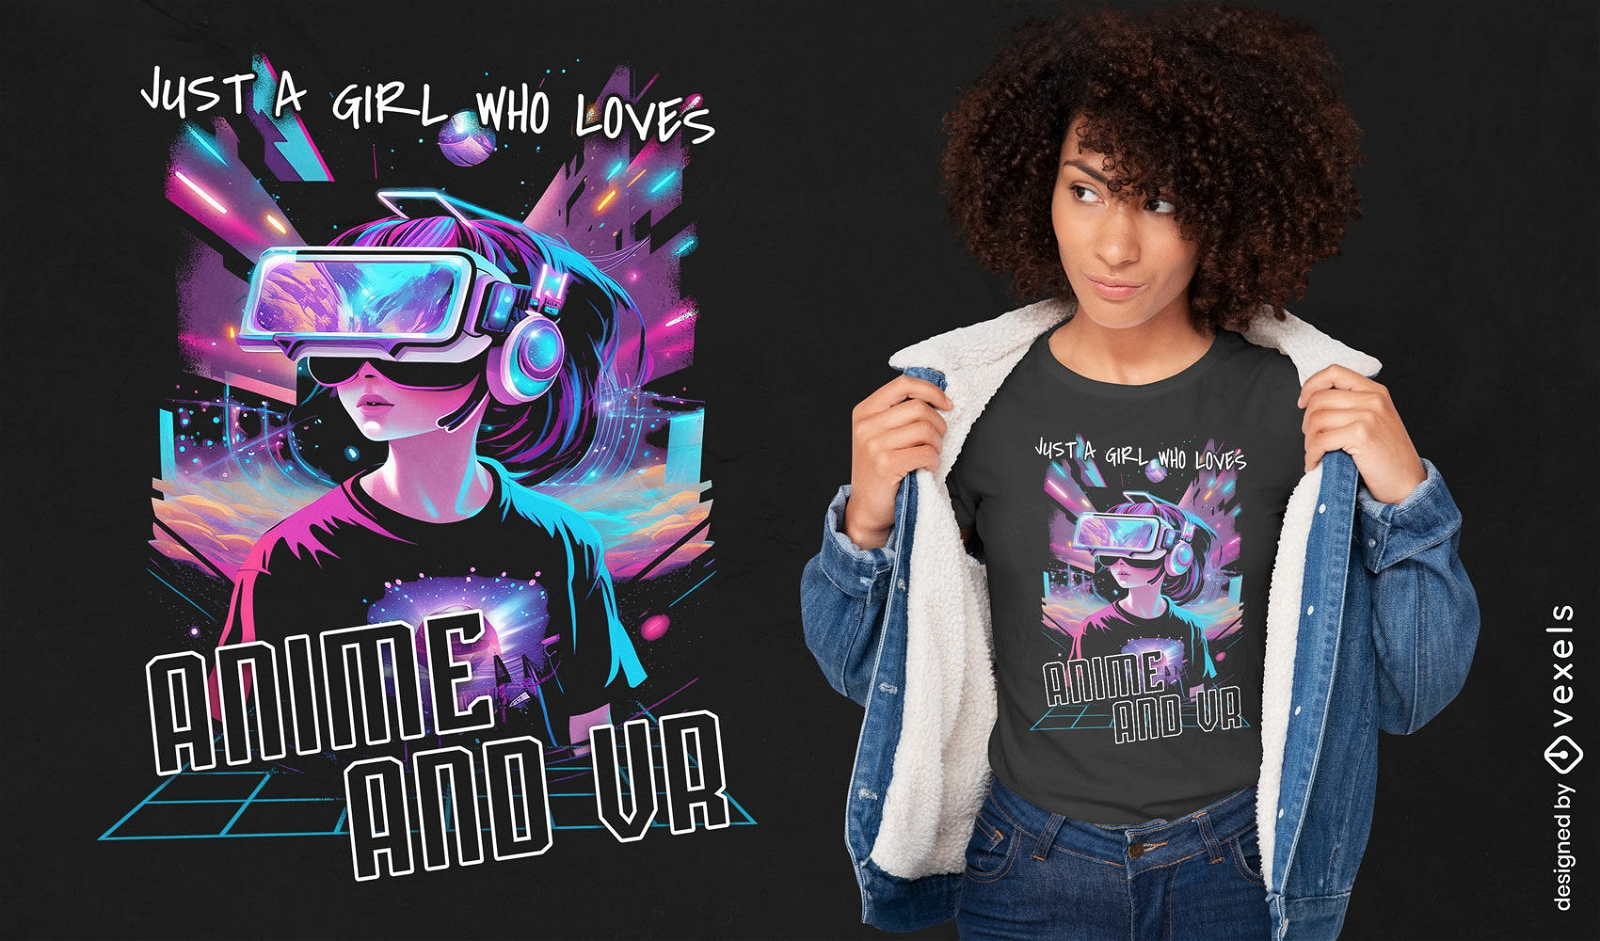
Garota de anime e design de camiseta VR
Escolha uma pasta
Todos os favoritos
Criar novo
Salvar
Garota de anime e design de camiseta VR
Pronto para imprimir
para Merch
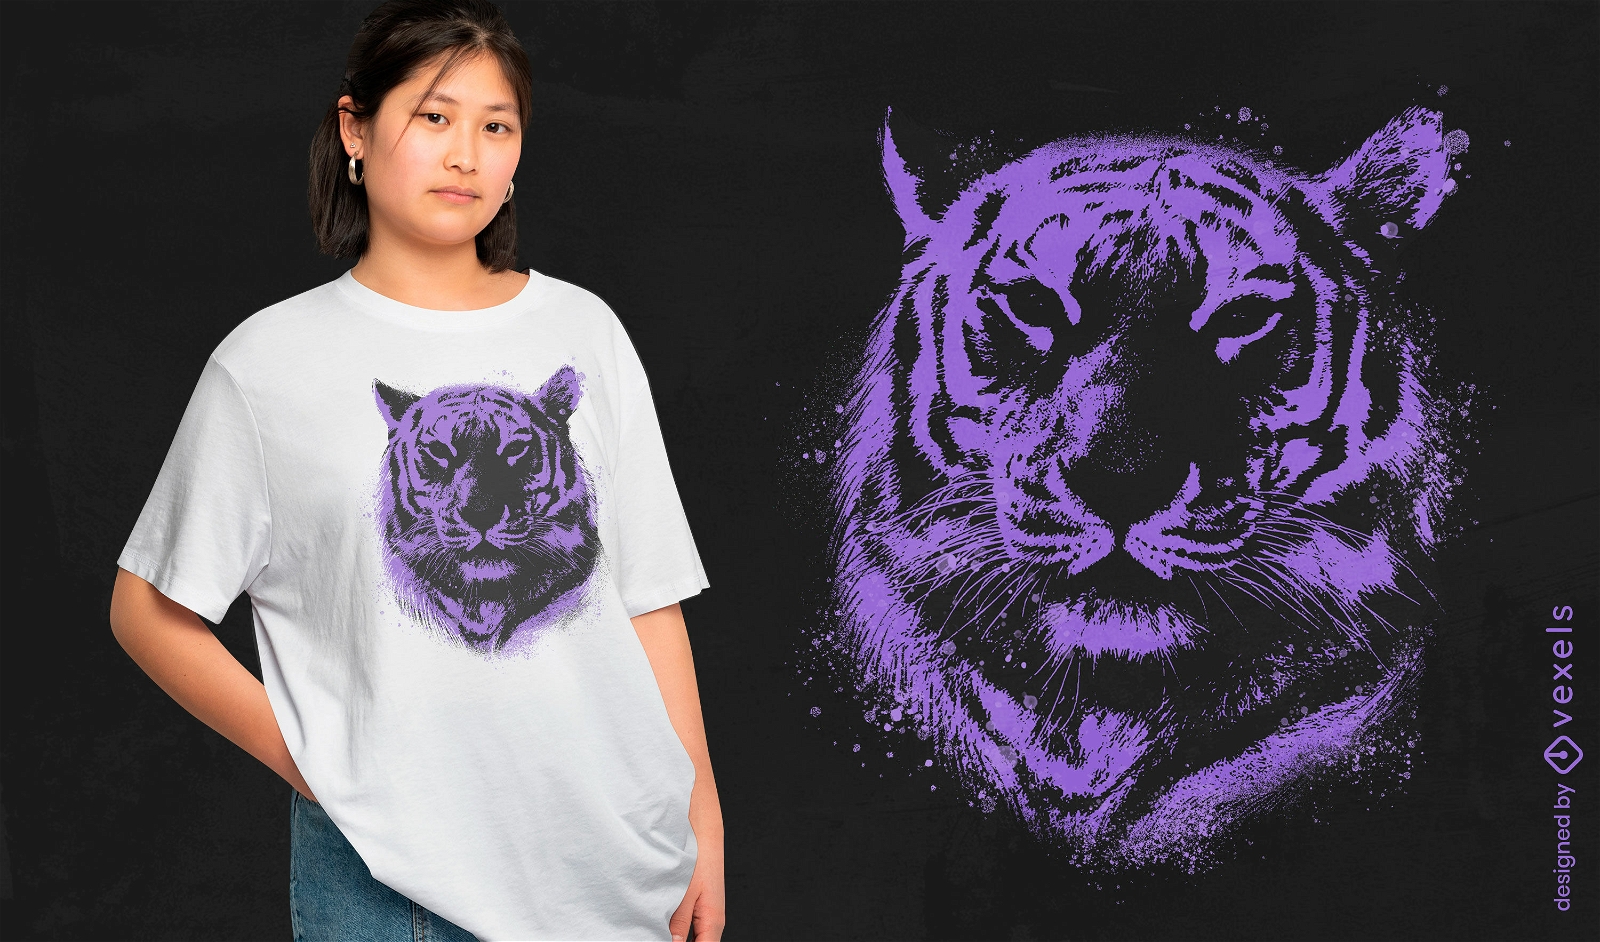
Design realista de camiseta de tigre
Escolha uma pasta
Todos os favoritos
Criar novo
Salvar
Design realista de camiseta de tigre
texto editável
Pronto para imprimir
para Merch
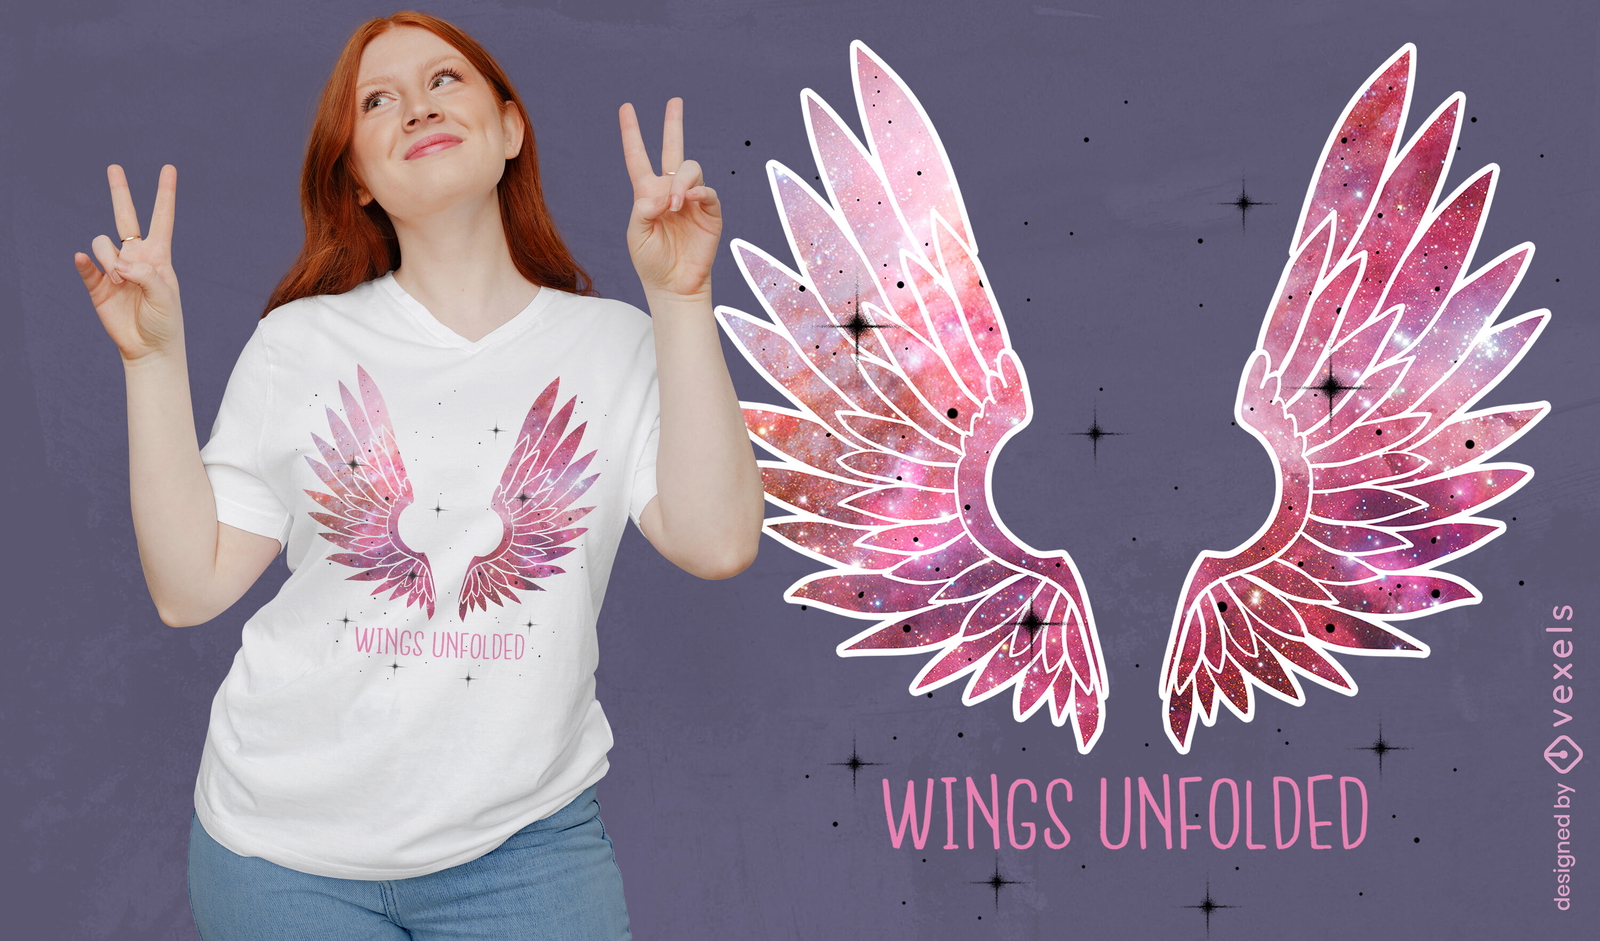
Camiseta com textura de galáxia de asas de anjo psd
Escolha uma pasta
Todos os favoritos
Criar novo
Salvar
Camiseta com textura de galáxia de asas de anjo psd
texto editável
para Merch
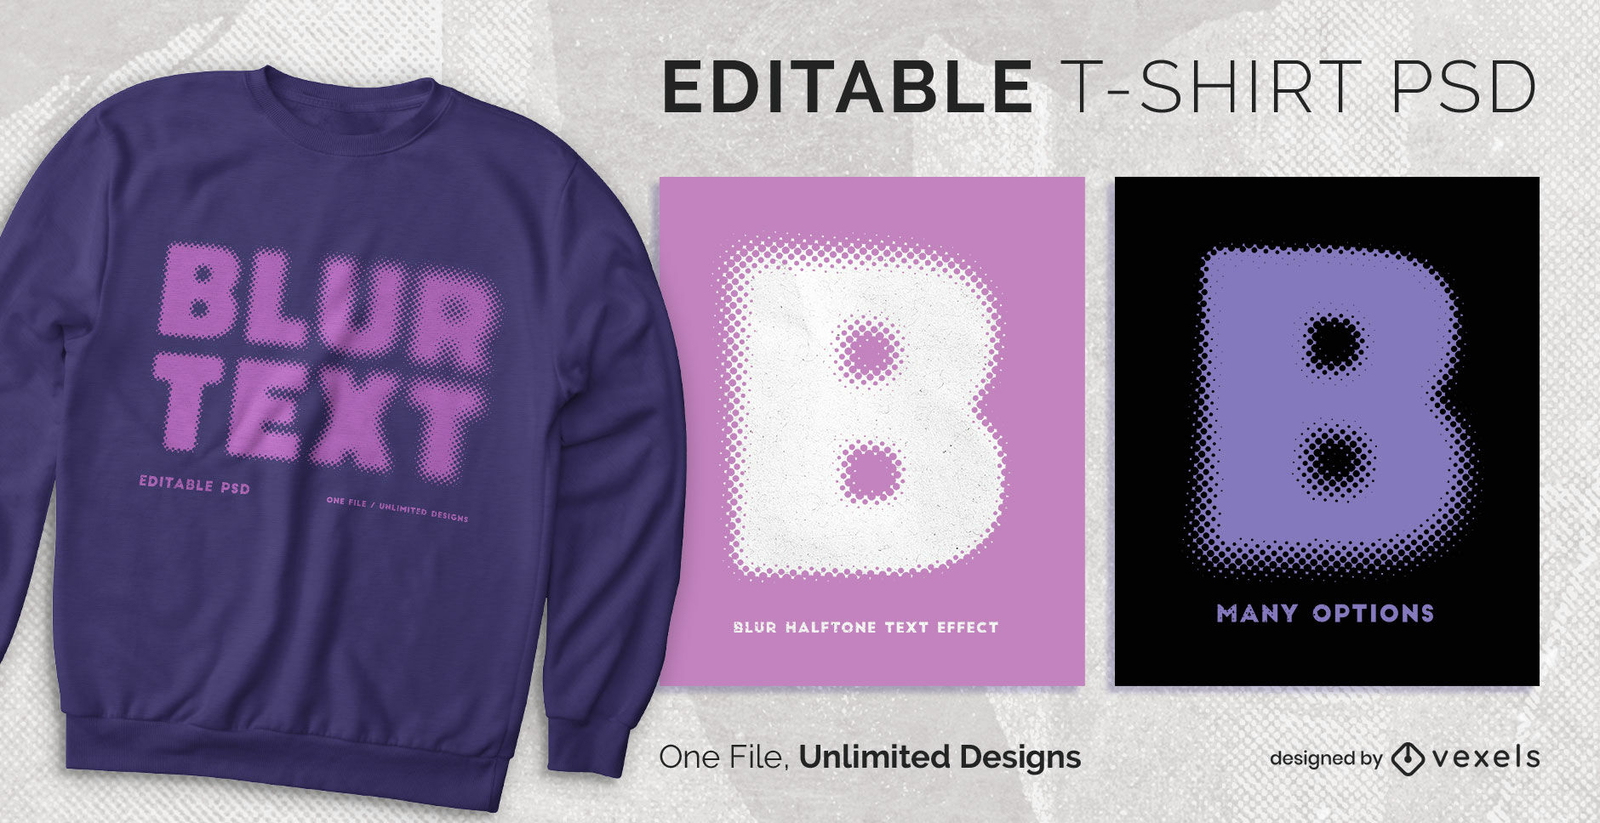
Blur halfone t-shirt escalável psd
Escolha uma pasta
Todos os favoritos
Criar novo
Salvar
Blur halfone t-shirt escalável psd
texto editável
para Merch
Camiseta escalável com efeito de robô Cybrpubnk psd
Escolha uma pasta
Todos os favoritos
Criar novo
Salvar
Camiseta escalável com efeito de robô Cybrpubnk psd
texto editável
Pronto para imprimir
para Merch
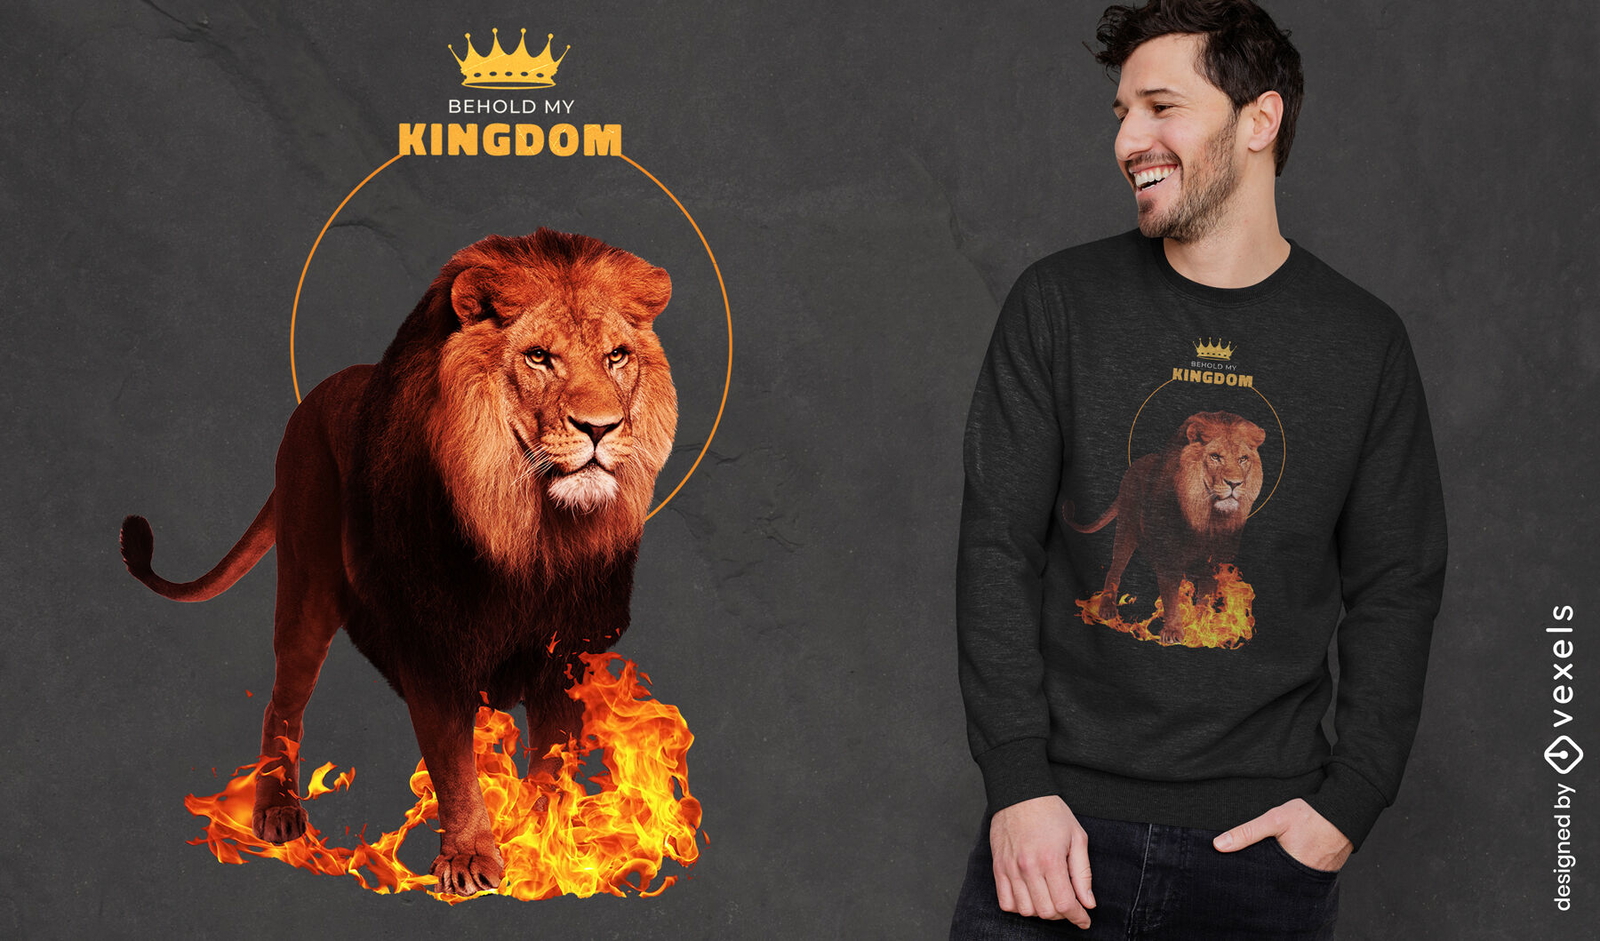
Camiseta leão animal selvagem em chamas psd
Escolha uma pasta
Todos os favoritos
Criar novo
Salvar
Camiseta leão animal selvagem em chamas psd
texto editável
Pronto para imprimir
para Merch
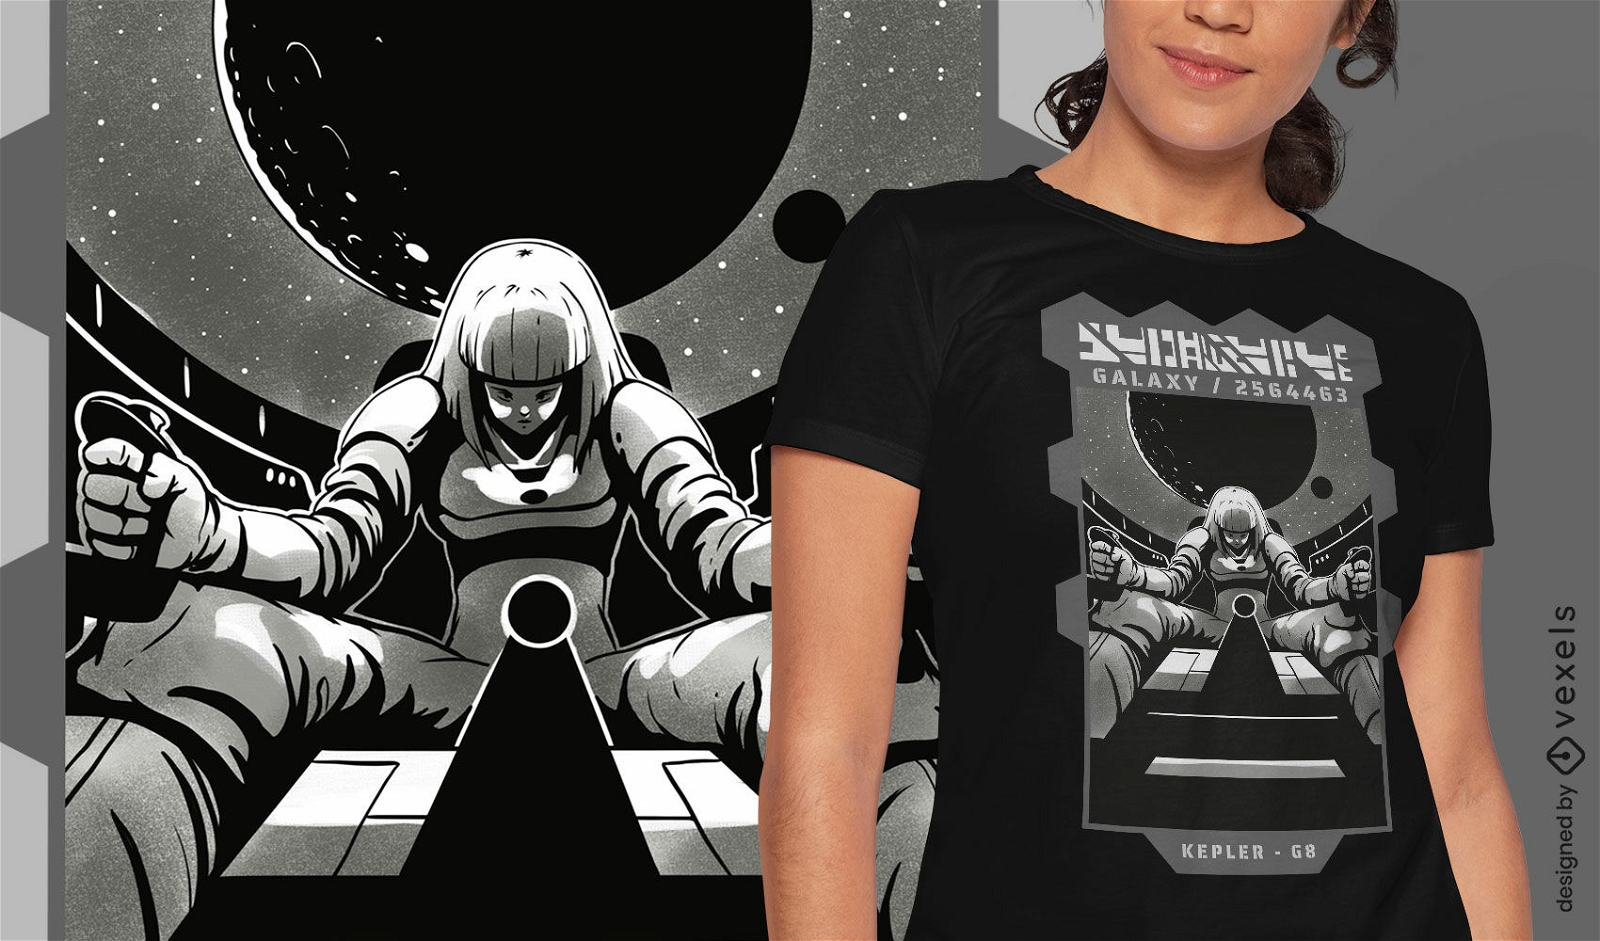
Design de camiseta de astronauta de nave espacial
Escolha uma pasta
Todos os favoritos
Criar novo
Salvar
Design de camiseta de astronauta de nave espacial
texto editável
Pronto para imprimir
para Merch
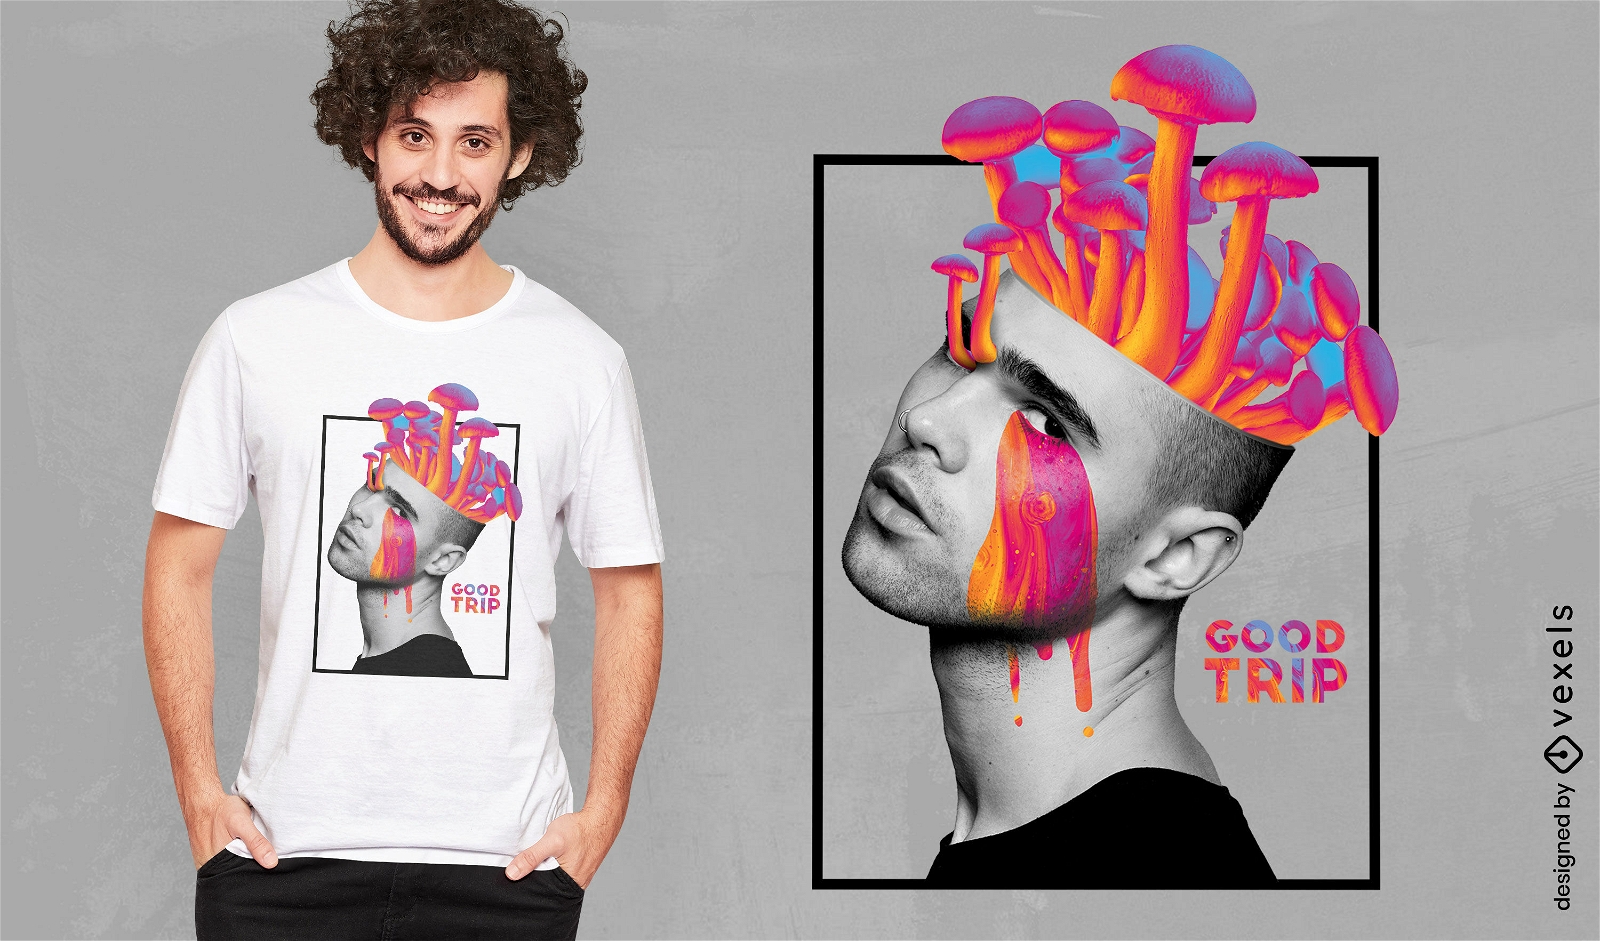
Design de camiseta PSD de fungos de boa viagem
Escolha uma pasta
Todos os favoritos
Criar novo
Salvar
Design de camiseta PSD de fungos de boa viagem
Pronto para imprimir
para Merch
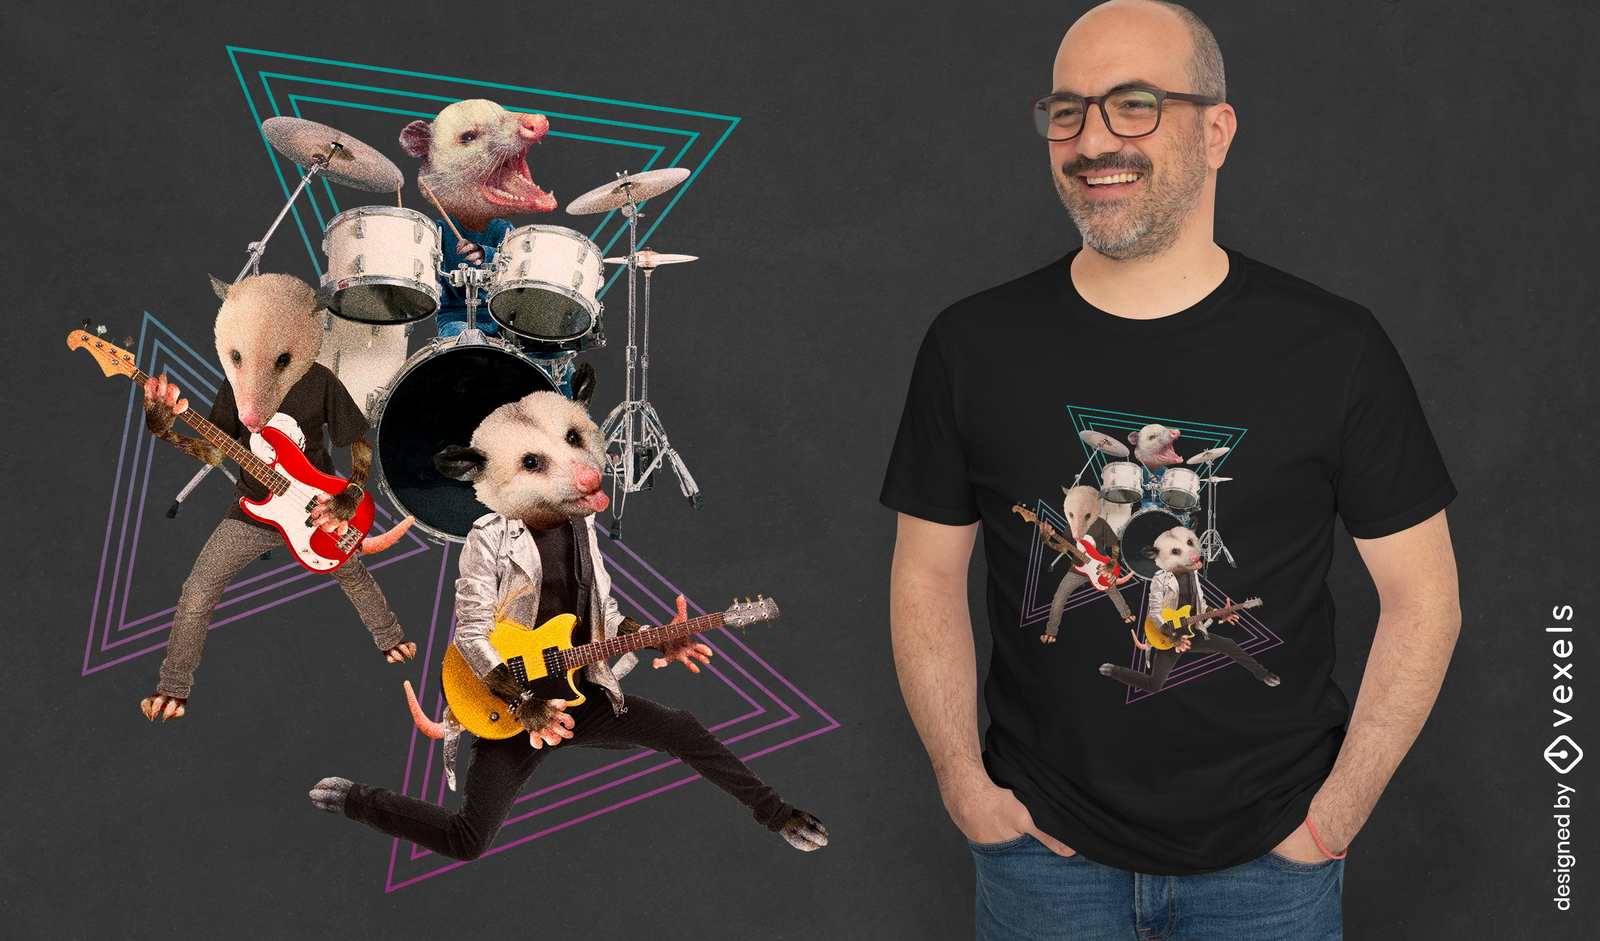
Design de camiseta de banda de rock animal gambá
Escolha uma pasta
Todos os favoritos
Criar novo
Salvar
Design de camiseta de banda de rock animal gambá
texto editável
Pronto para imprimir
para Merch
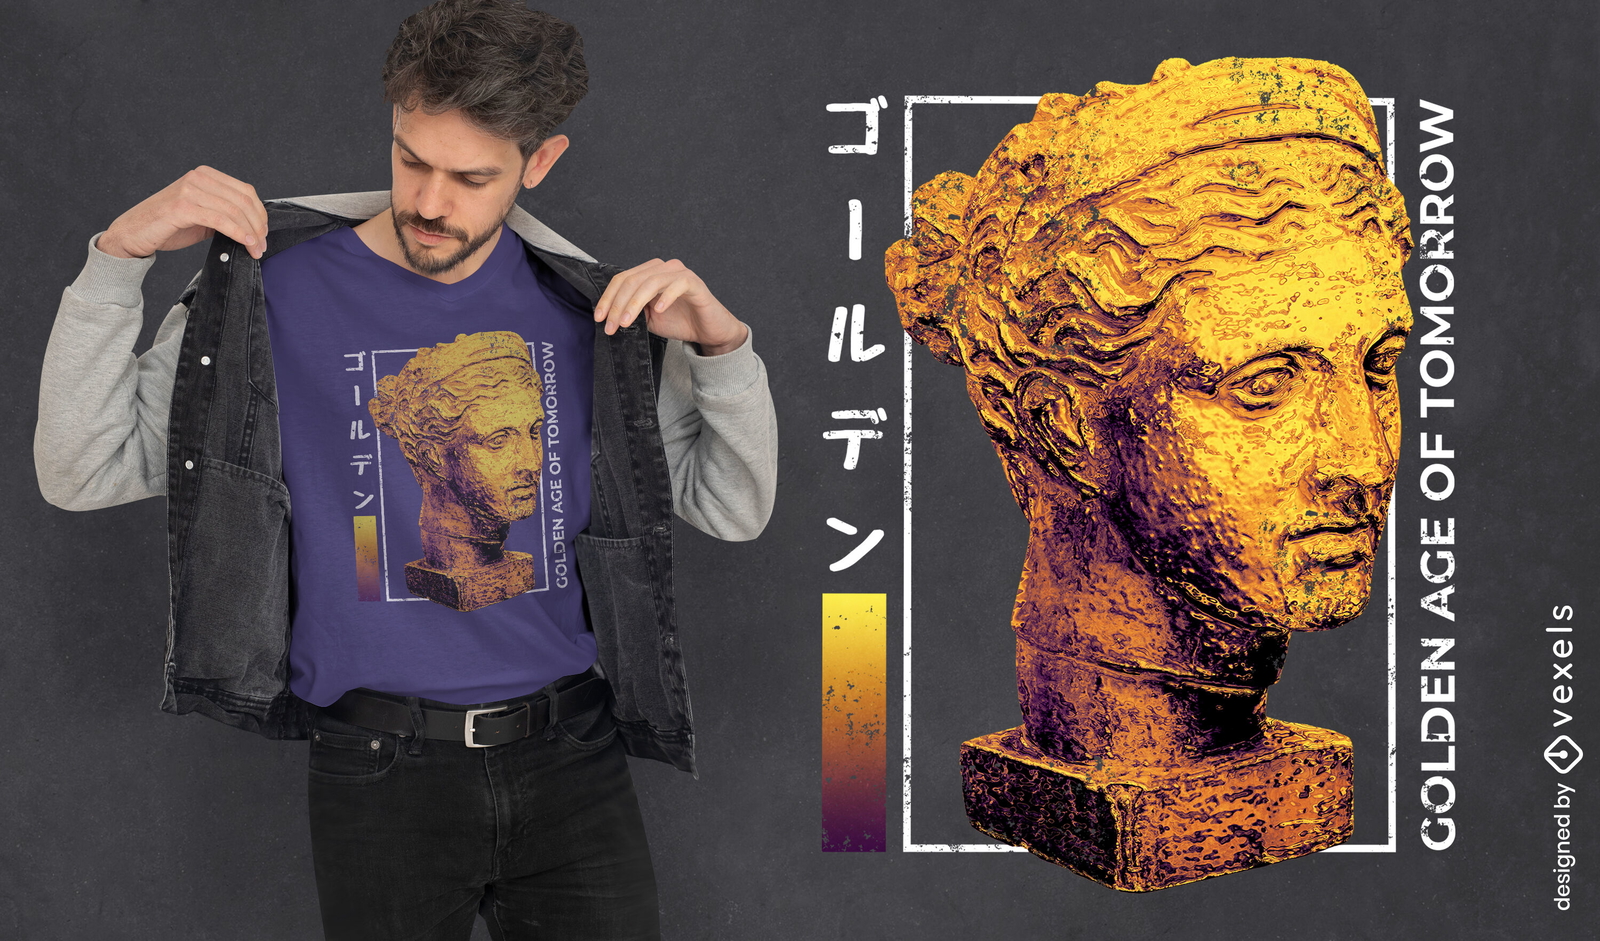
Design de camiseta artística de cabeça de estátua grega
Escolha uma pasta
Todos os favoritos
Criar novo
Salvar
Design de camiseta artística de cabeça de estátua grega
Pronto para imprimir
para Merch
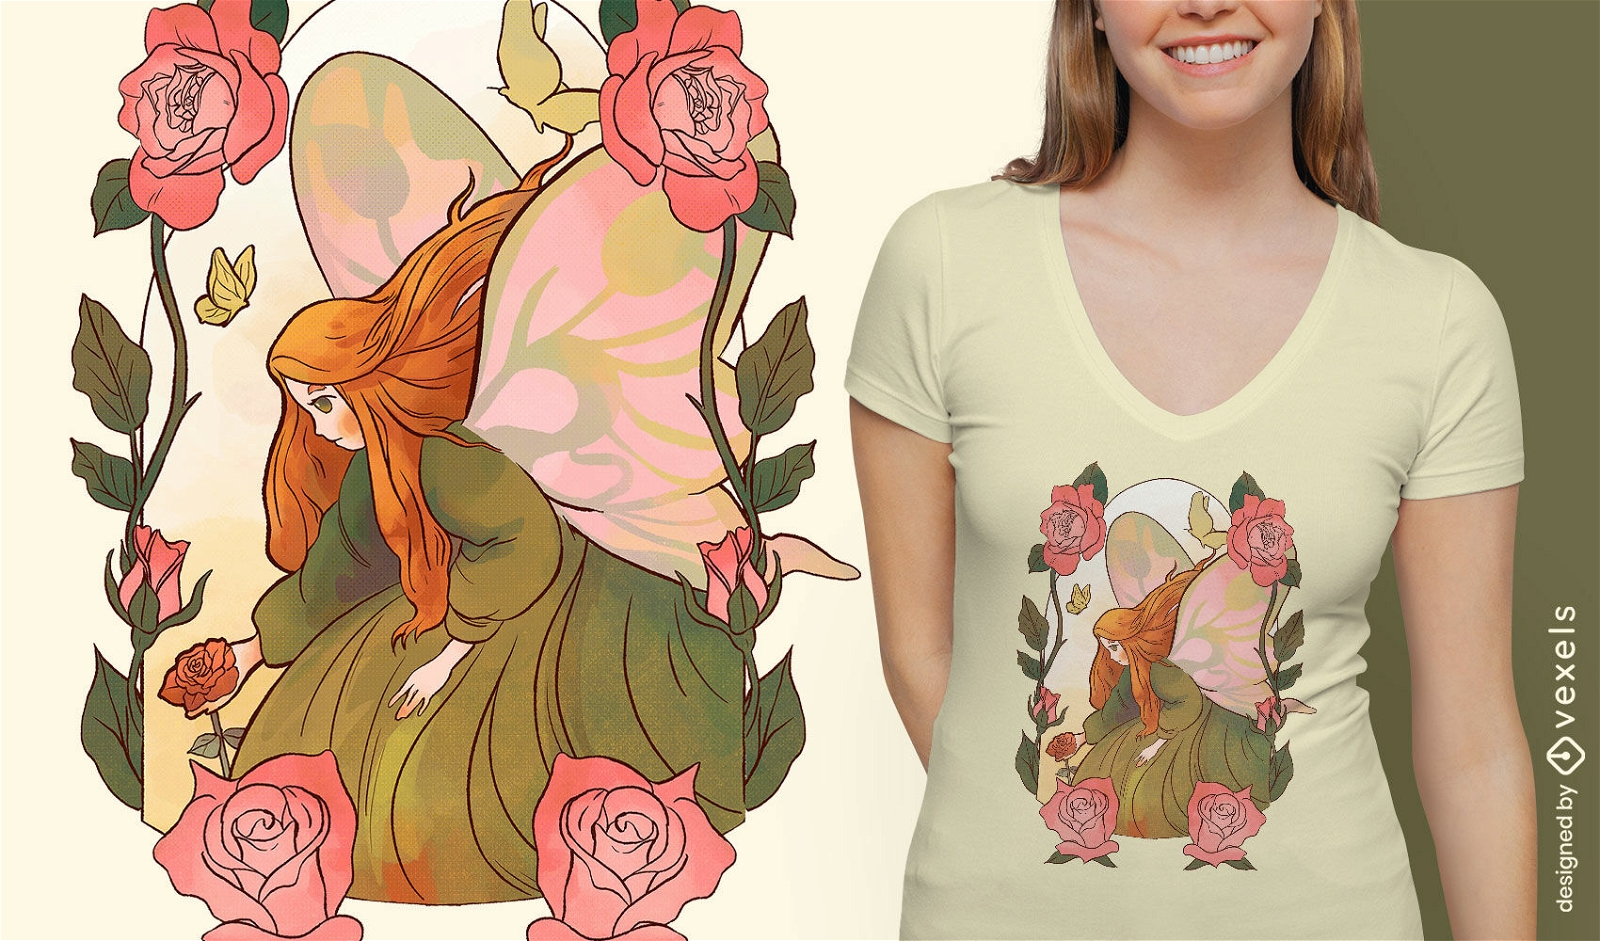
Design de camiseta de personagem de fada rosa
Escolha uma pasta
Todos os favoritos
Criar novo
Salvar
Design de camiseta de personagem de fada rosa
Impulsione seu negócio
Com a plataforma gráfica líder de mercado.
Ver planos
Próxima
do 67
prev page
next page