Biblioteca de design
Novos designs Merch
Camisetas
Vectores
Designs de Merch de Tendência
PNGs & SVGs
Mockups
Modelos de T-Shirt PSD
Explorar Desenhos
Designs KDP
Pôsteres
Canecas
Capas para celular
Sacos de compras
Almofadas
Ferramentas de desenho
Merch Designer
Novo!
Mockup Generator
Gerador de Design de AI
Vetorizador
Quote Generator
T-Shirt Maker (Antigo)
Ajuda
Merch Digest
Blog
Centro de Ajuda
Saiba mais sobre o Merch
Feedback
Soluções Corporativas
Empresa
Acesso à API
Estúdio de Design
Design em Lote
Preços
Carregando...
Inscrever-se
Conecte-se
PSD Templates
graficos
Biblioteca de design
Novos designs Merch
Camisetas
Vectores
Designs de Merch de Tendência
PNGs & SVGs
Mockups
Modelos de T-Shirt PSD
Explorar Desenhos
Designs KDP
Pôsteres
Canecas
Capas para celular
Sacos de compras
Almofadas
Ferramentas de desenho
Merch Designer
Novo!
Mockup Generator
Gerador de Design de AI
Vetorizador
Quote Generator
T-Shirt Maker (Antigo)
Ajuda
Merch Digest
Blog
Centro de Ajuda
Saiba mais sobre o Merch
Feedback
Soluções Corporativas
Empresa
Acesso à API
Estúdio de Design
Design em Lote
PLANOS
PSD Templates
graficos
3312 Designs de Camisetas e Mockups PSD de graficos
Baixar designs de camisetas ou mockups PSD editáveis de graficos
Relacionado:
graficos vetoriais
,
desenhos graficos de ações
,
graficos tridimensionais
Ordenar por
Mais relevante
Resultados patrocinados da
Ganhe 15% de desconto com o código: VEXELS15
veja mais detalhes
Pronto para imprimir
para Merch
Design de camiseta de monstro de coelho assustador
Escolha uma pasta
Todos os favoritos
Criar novo
Salvar
Design de camiseta de monstro de coelho assustador
texto editável
Pronto para imprimir
para Merch
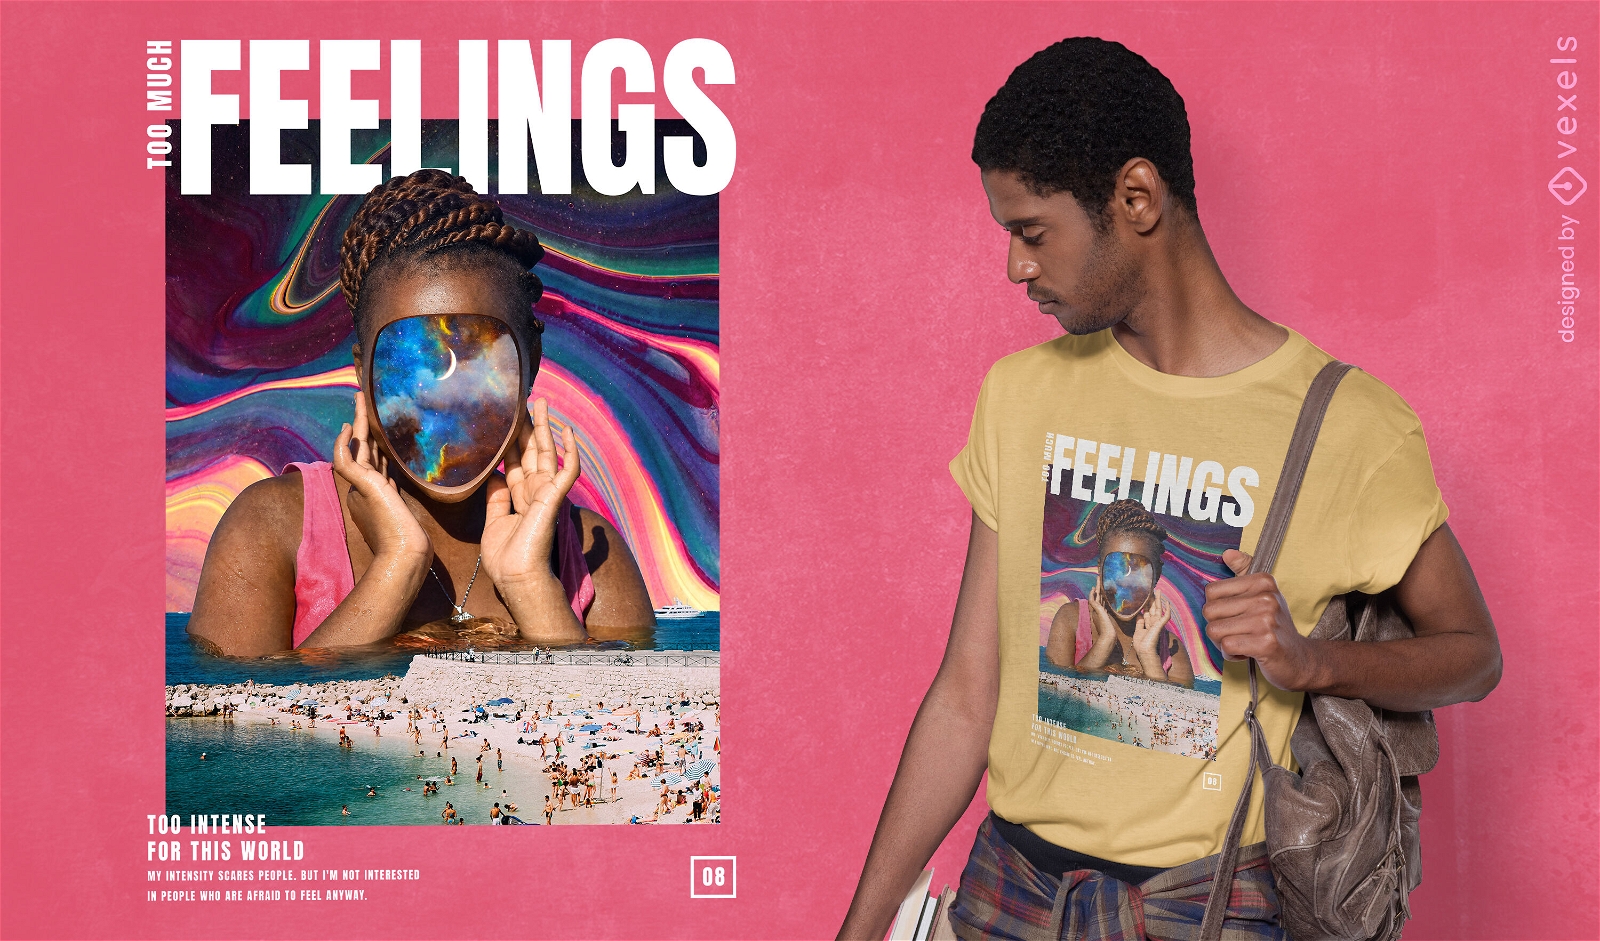
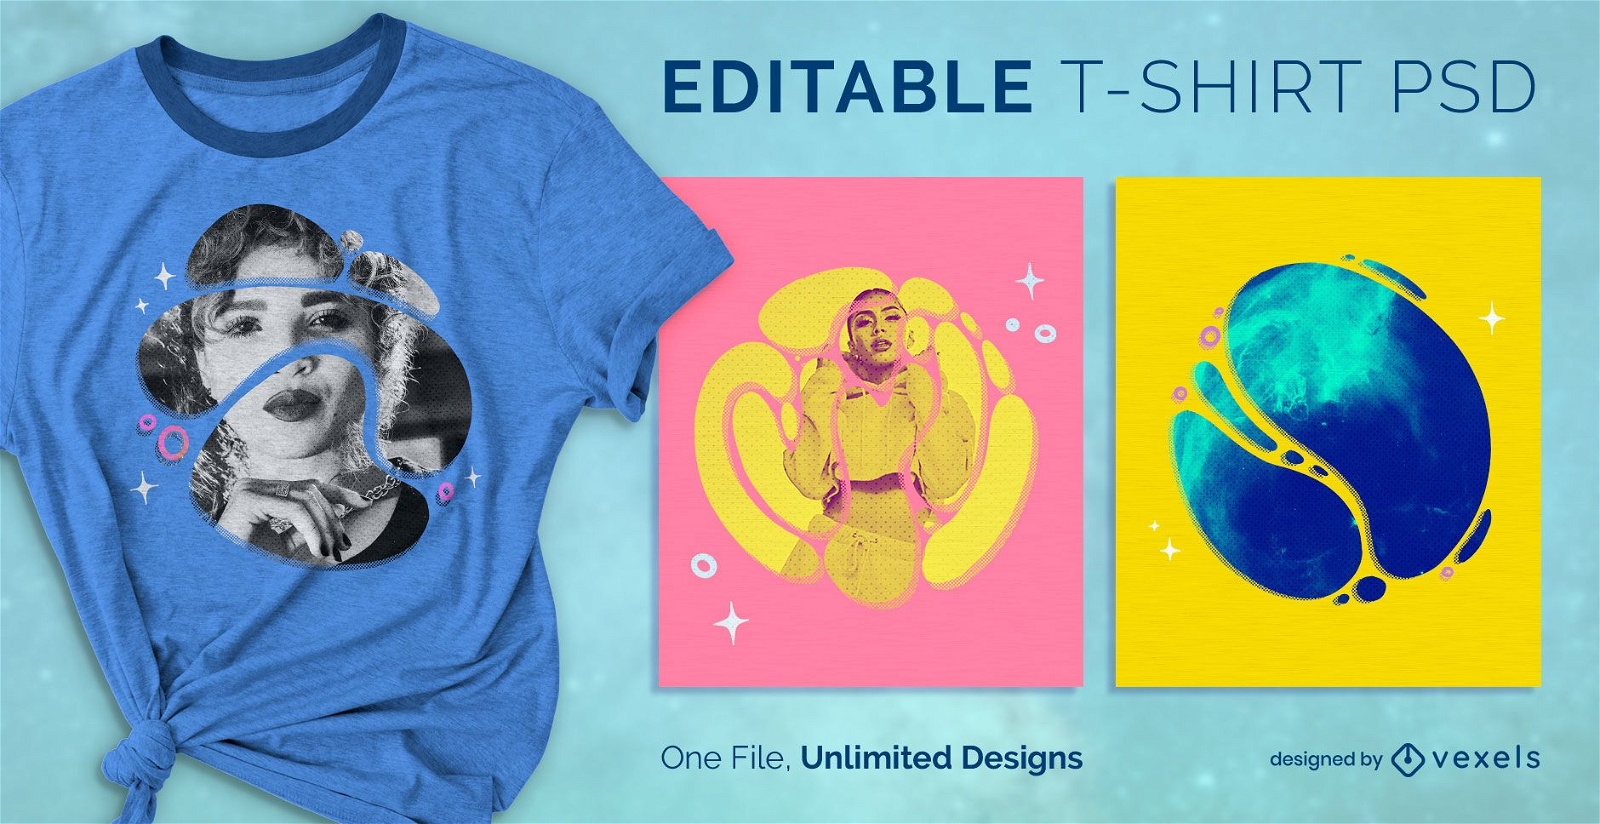
Design de t-shirt psd de sentimentos intensos
Escolha uma pasta
Todos os favoritos
Criar novo
Salvar
Design de t-shirt psd de sentimentos intensos
Pronto para imprimir
para Merch
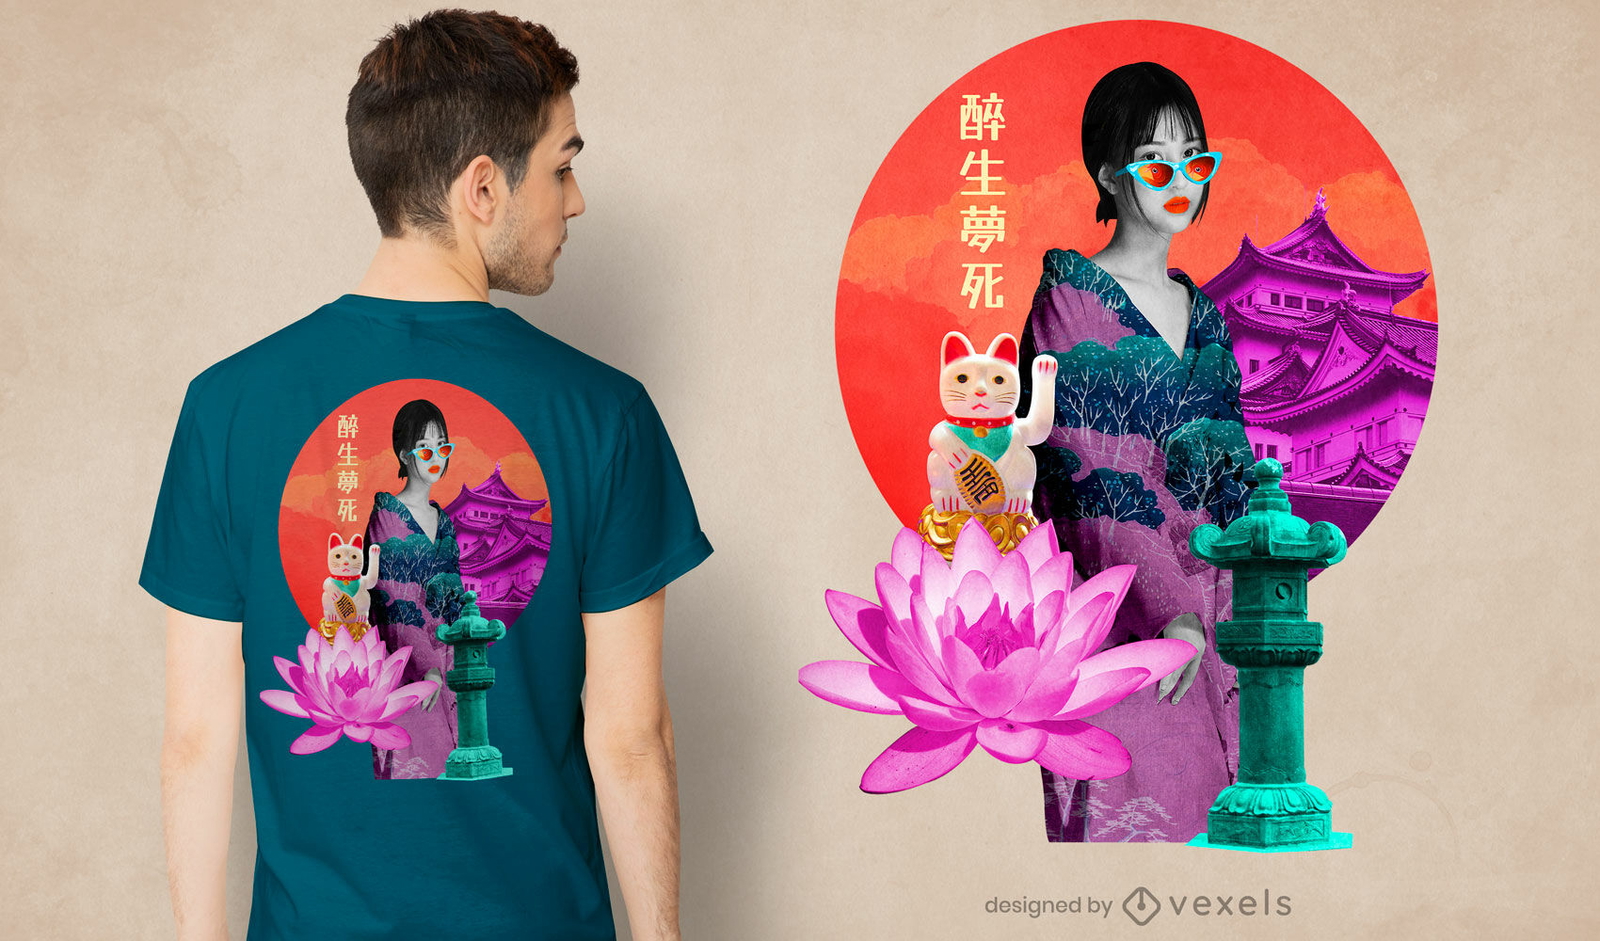
Camiseta de colagem fotográfica japonesa psd
Escolha uma pasta
Todos os favoritos
Criar novo
Salvar
Camiseta de colagem fotográfica japonesa psd
Pronto para imprimir
para Merch
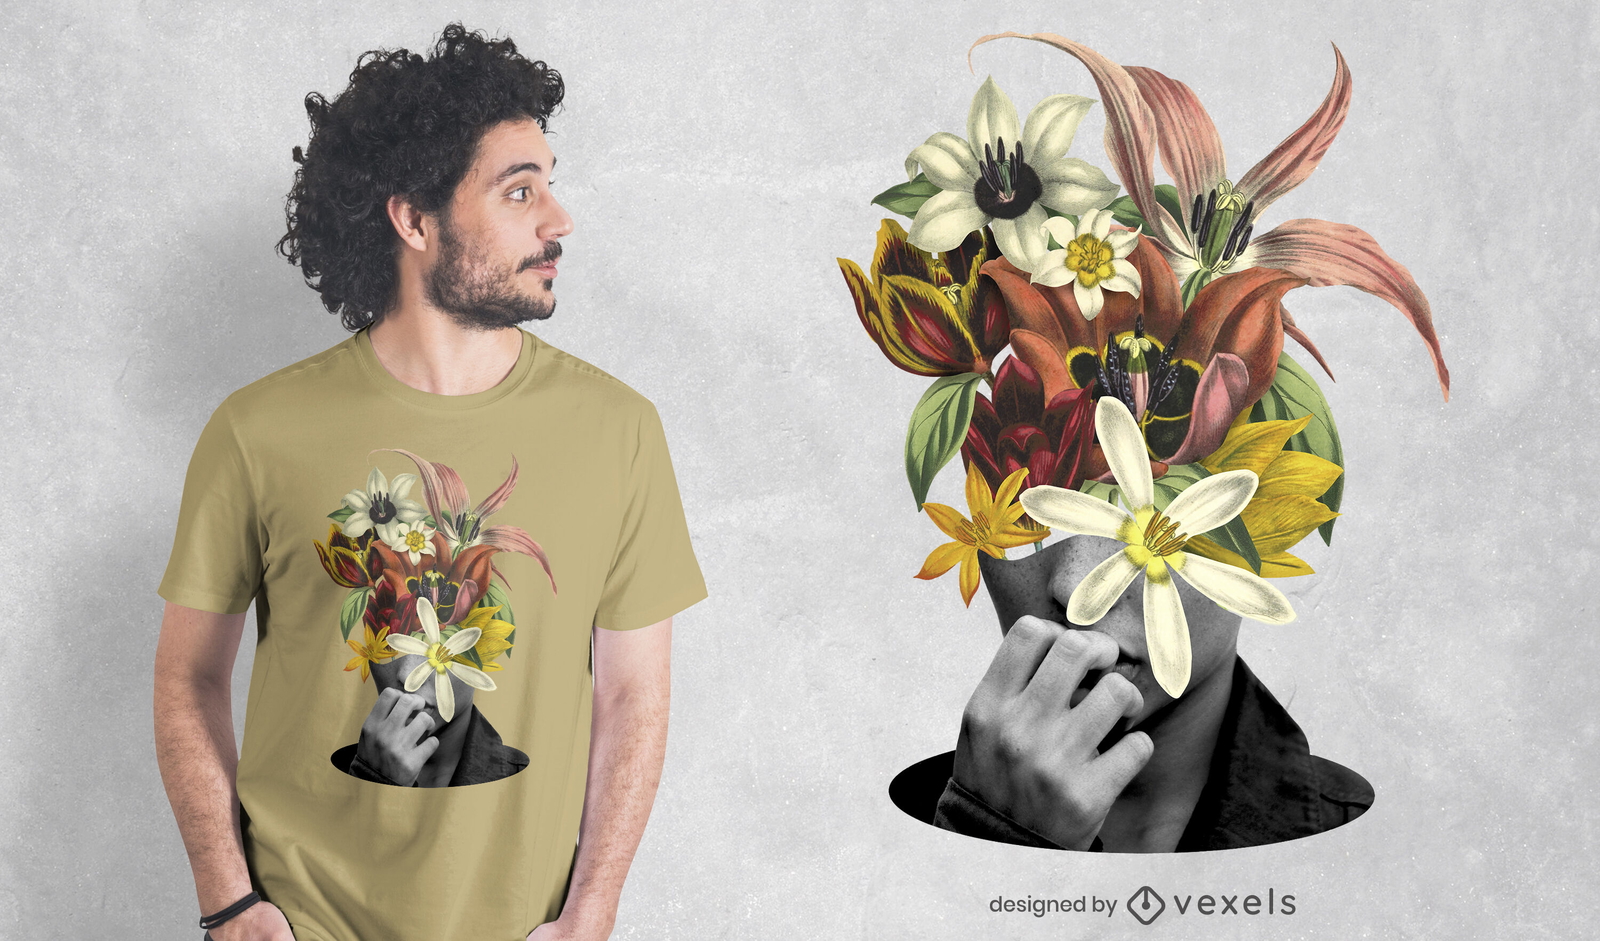
Flores na cabeça design de t-shirt PSD
Escolha uma pasta
Todos os favoritos
Criar novo
Salvar
Flores na cabeça design de t-shirt PSD
Pronto para imprimir
para Merch
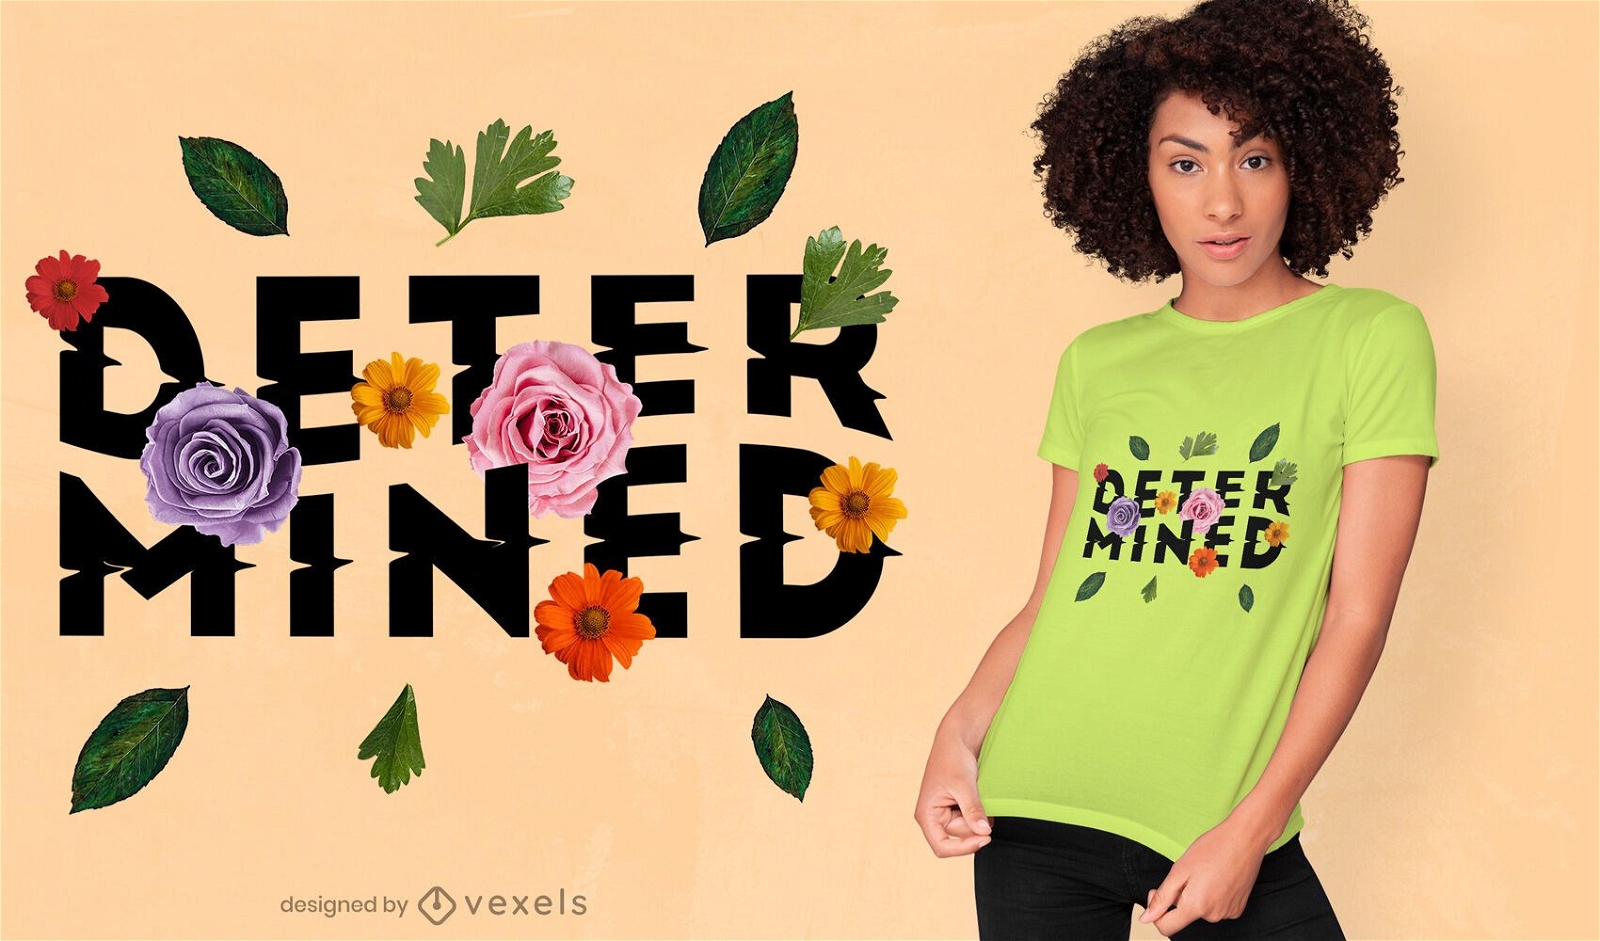
Flowers determined PSD t-shirt design
Escolha uma pasta
Todos os favoritos
Criar novo
Salvar
Flowers determined PSD t-shirt design
Pronto para imprimir
para Merch
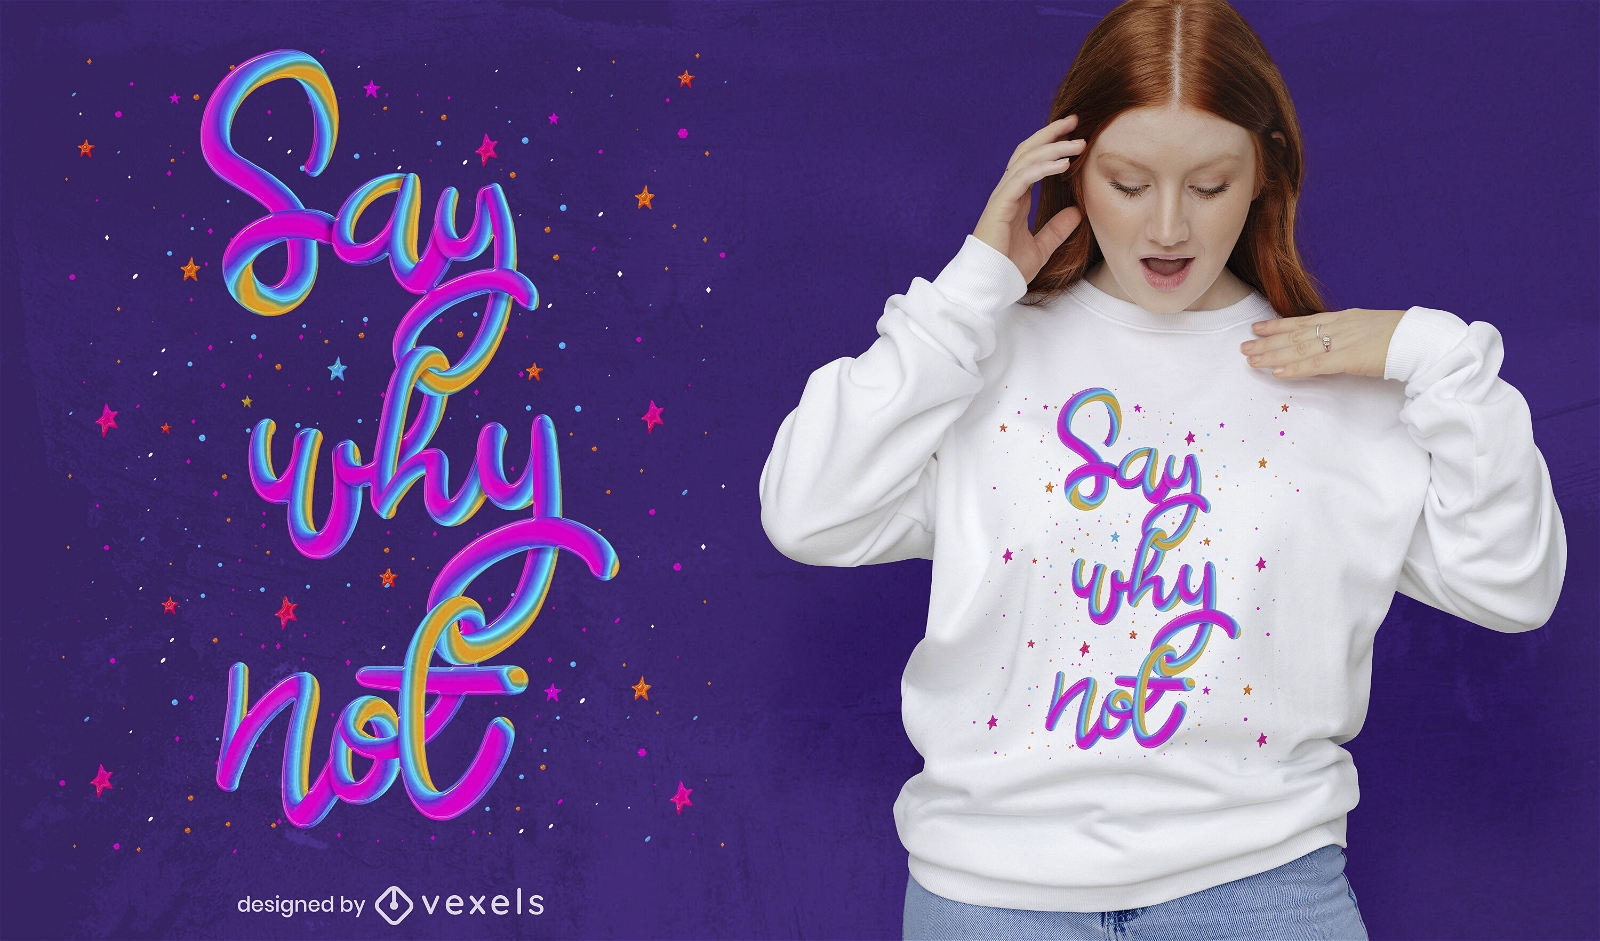
Diga porque noy t-shirt psd
Escolha uma pasta
Todos os favoritos
Criar novo
Salvar
Diga porque noy t-shirt psd
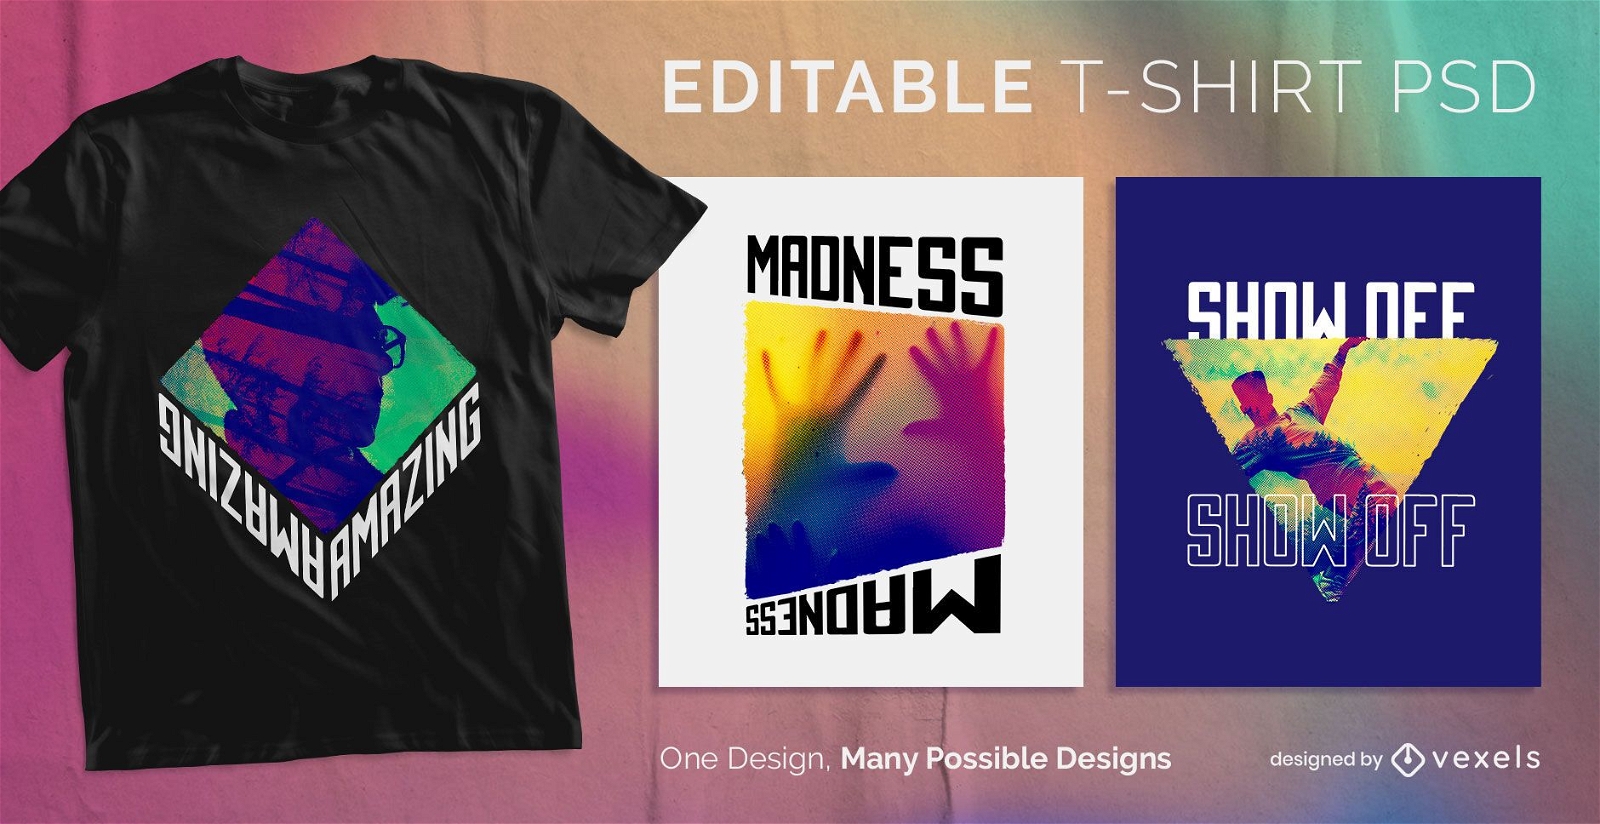
Camiseta PSD escalável
para Merch
PSD de camiseta escalável CMYK
Escolha uma pasta
Todos os favoritos
Criar novo
Salvar
PSD de camiseta escalável CMYK
Gerado por IA, selecionado por nossos designers.
para Merch
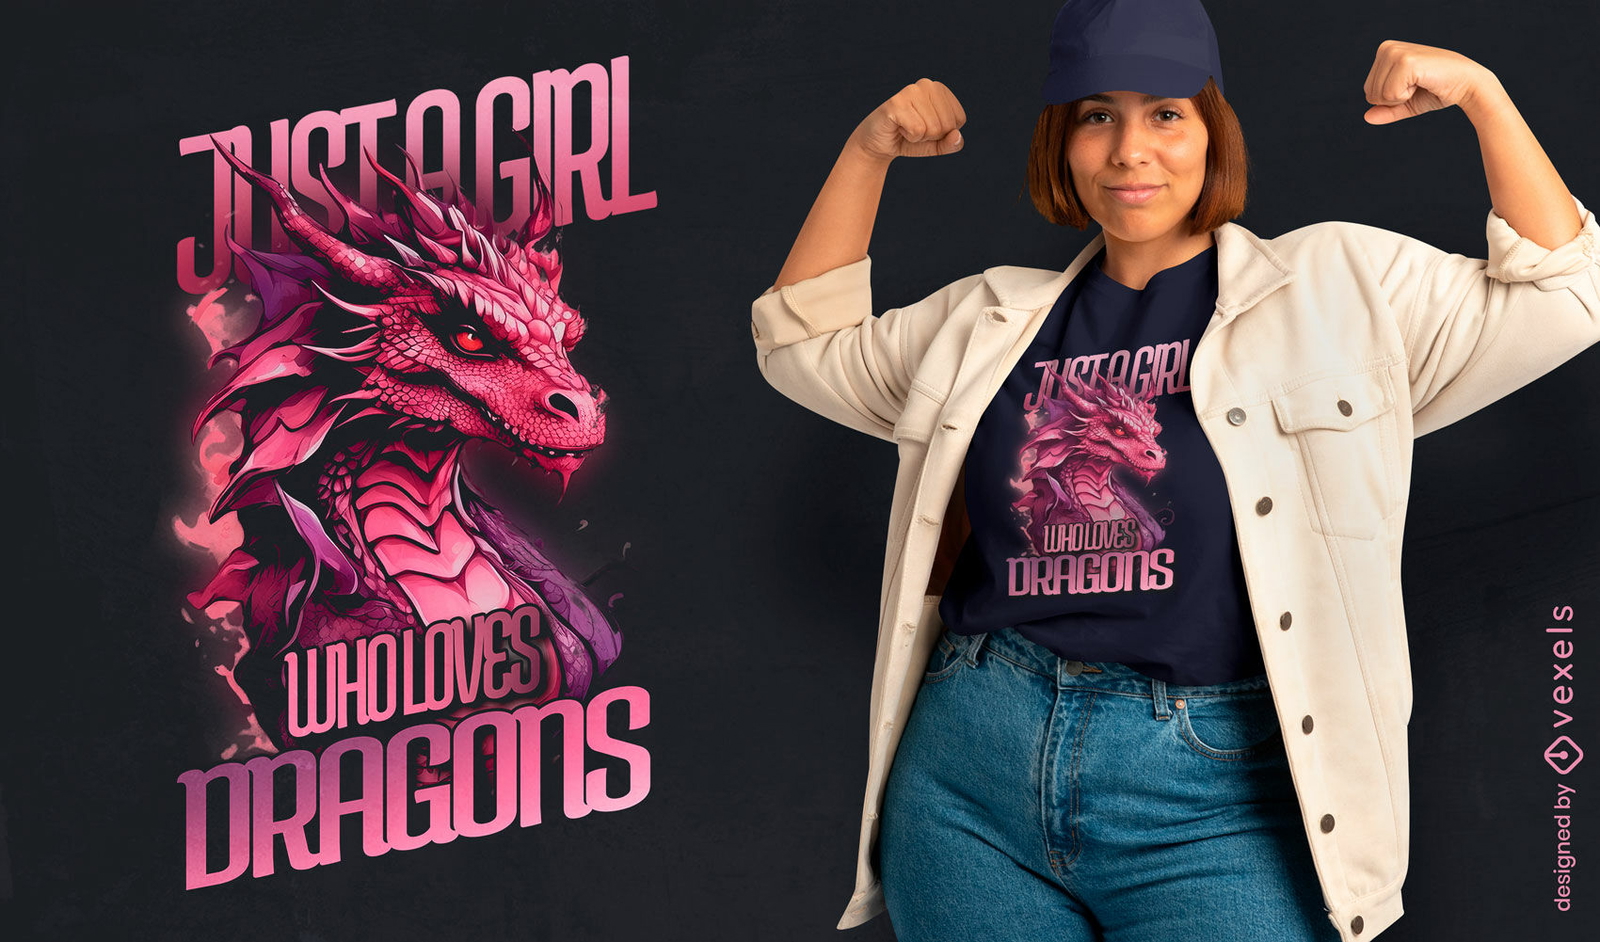
Design de camiseta de drag?o e menina
Escolha uma pasta
Todos os favoritos
Criar novo
Salvar
Design de camiseta de drag?o e menina
texto editável
Pronto para imprimir
para Merch
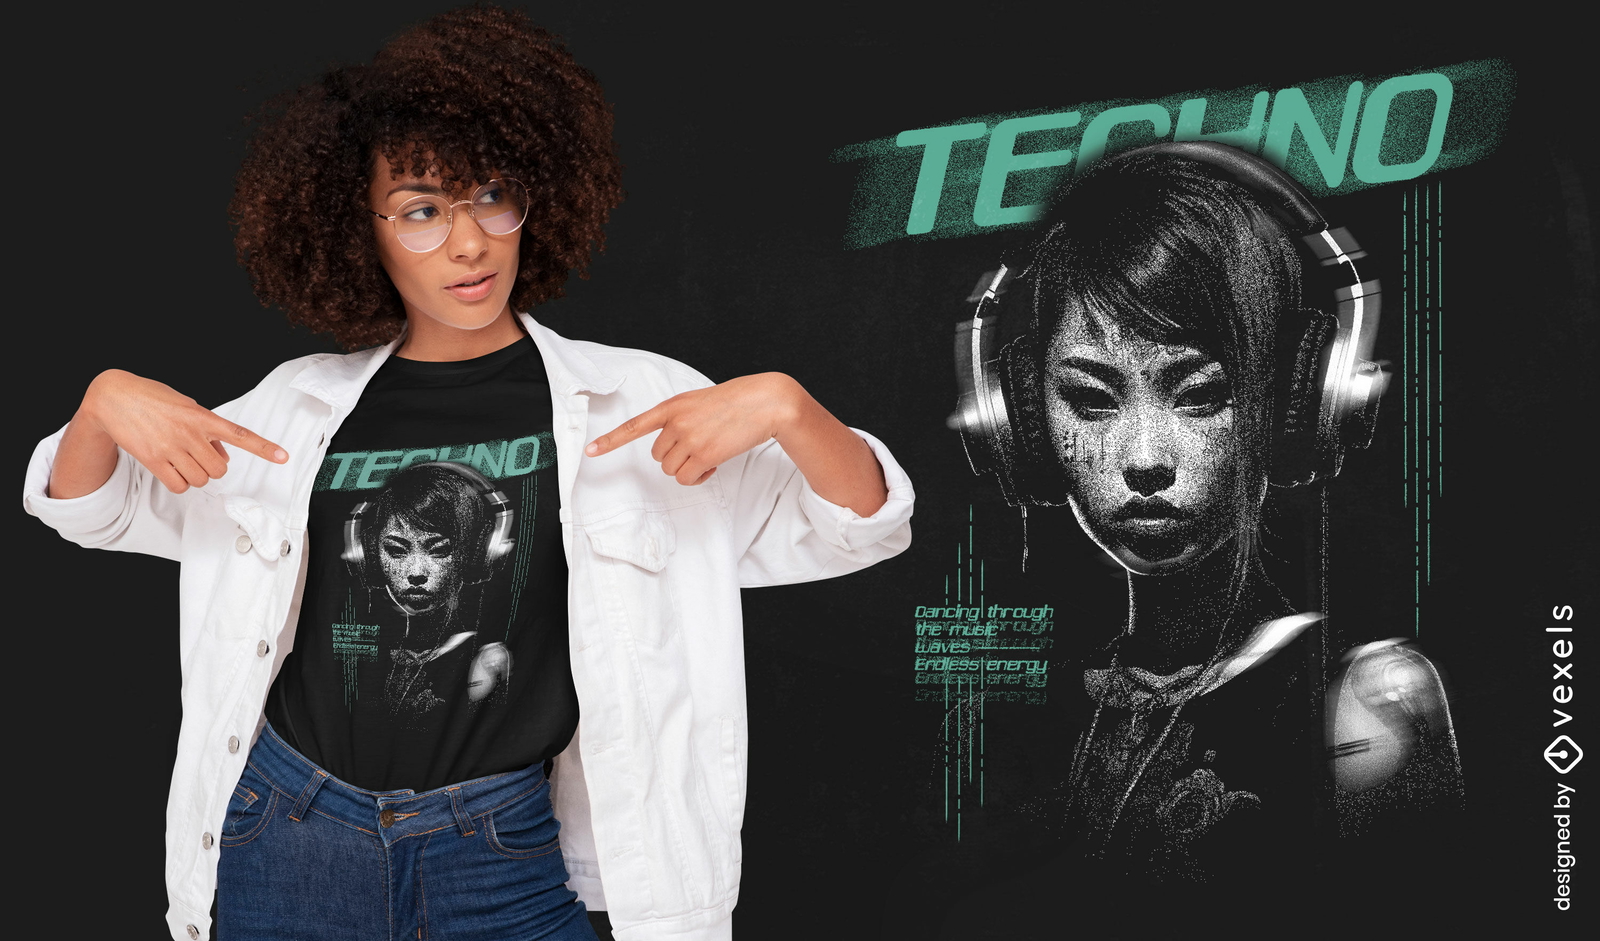
Design futurista de camisetas de música techno
Escolha uma pasta
Todos os favoritos
Criar novo
Salvar
Design futurista de camisetas de música techno
texto editável
Pronto para imprimir
para Merch
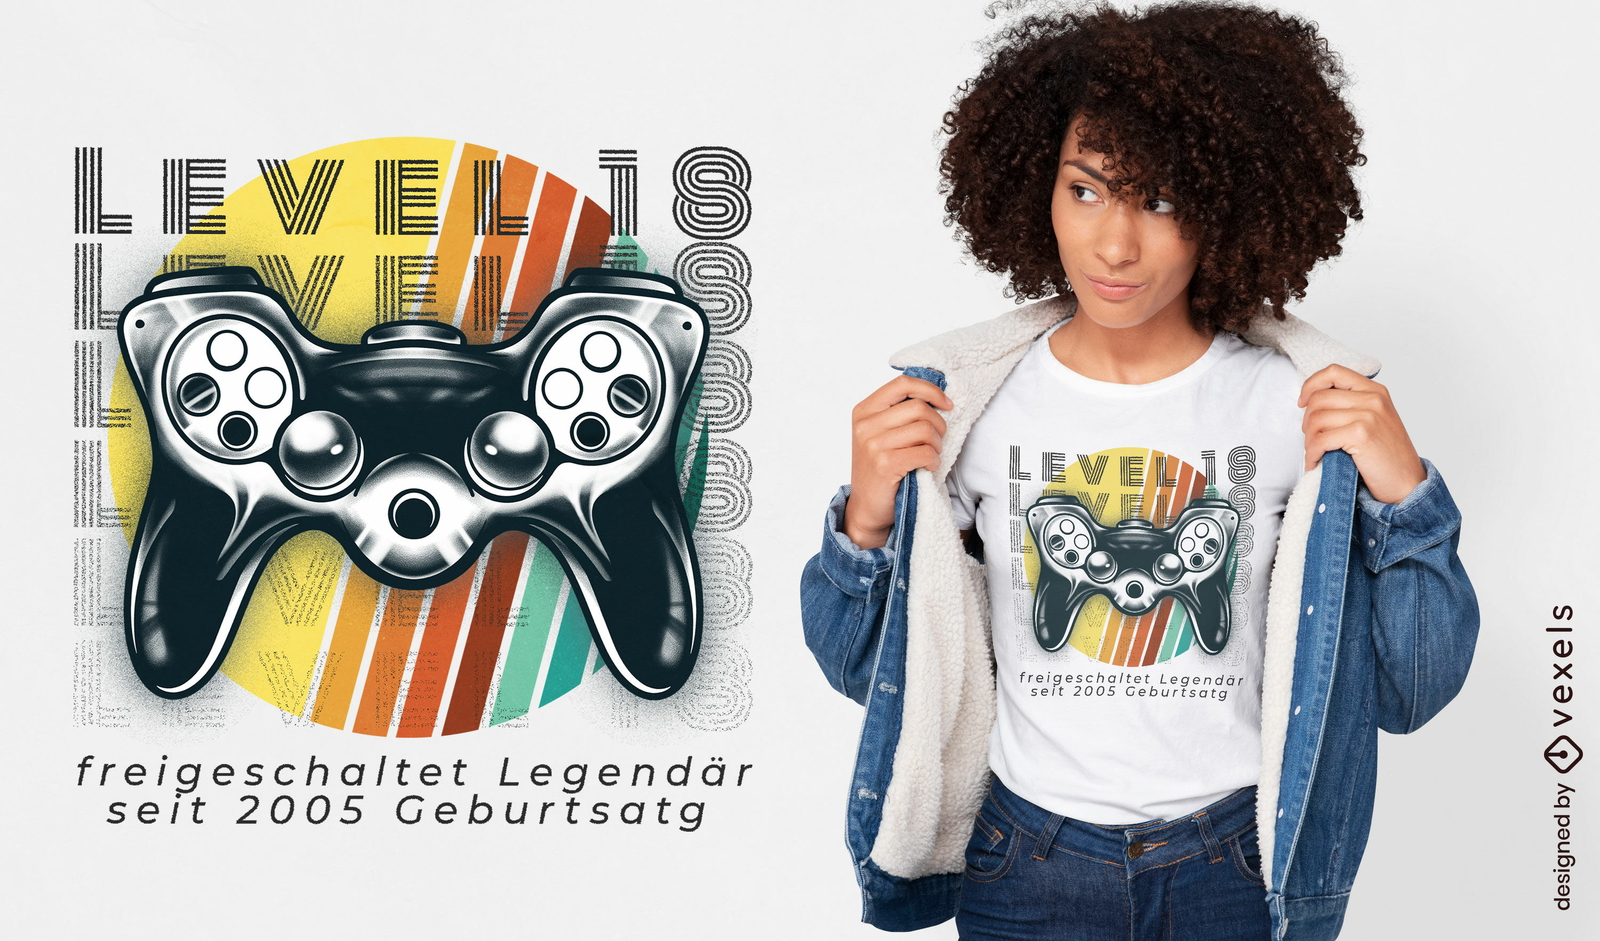
Design de camiseta de aniversário de jogos retrô
Escolha uma pasta
Todos os favoritos
Criar novo
Salvar
Design de camiseta de aniversário de jogos retrô
Pronto para imprimir
para Merch
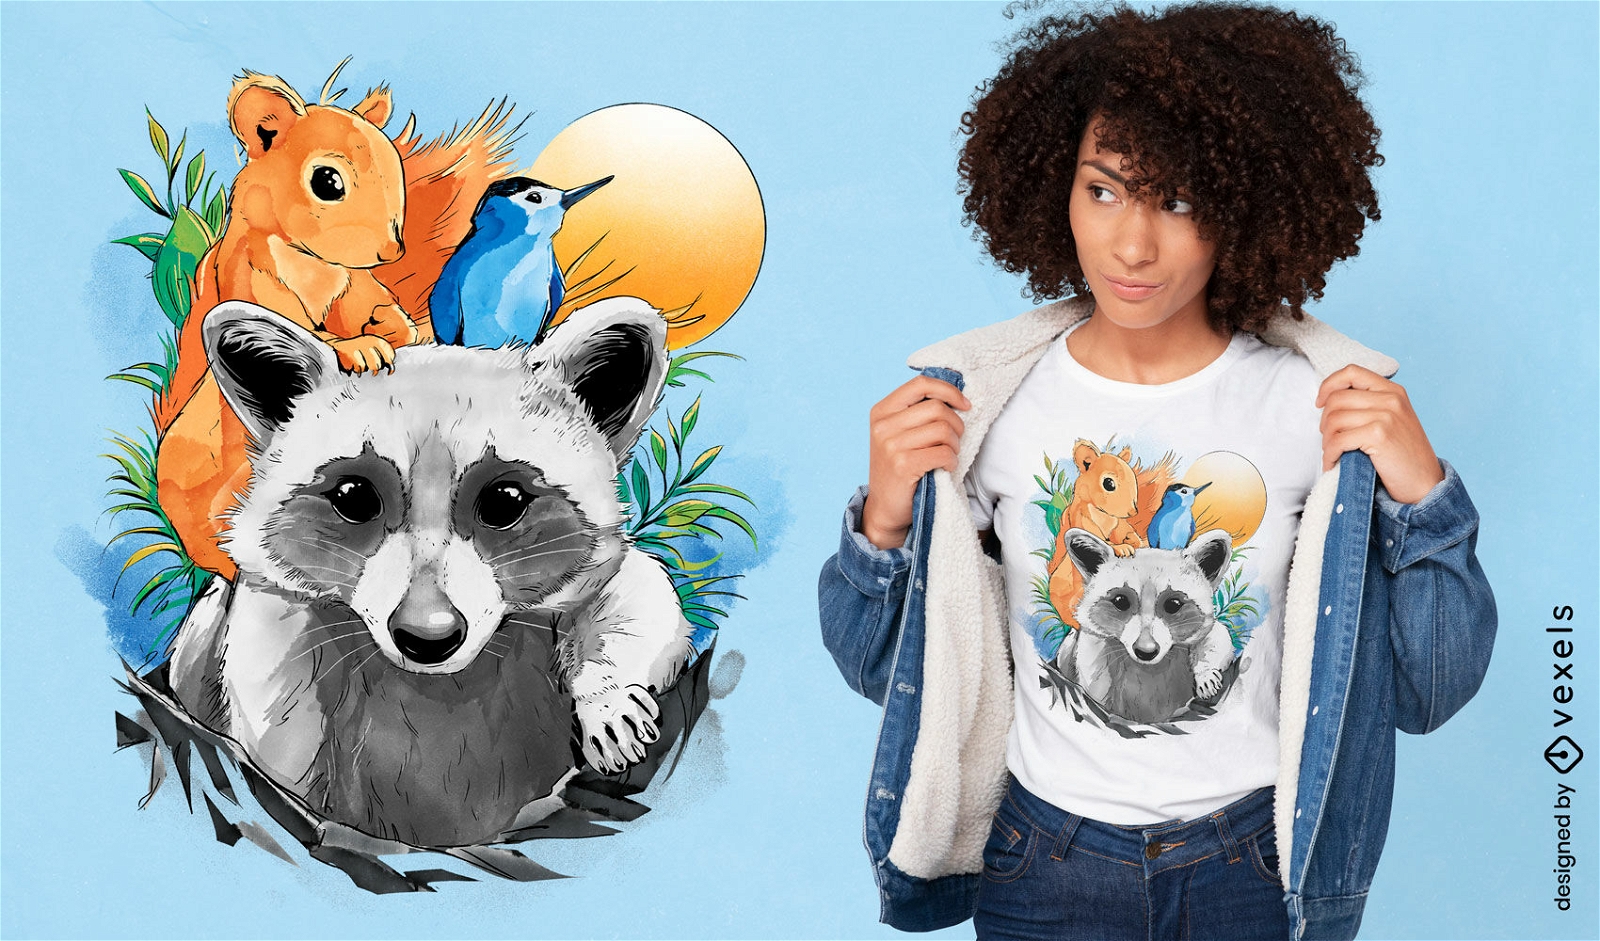
Design de camiseta de guaxinim e esquilo
Escolha uma pasta
Todos os favoritos
Criar novo
Salvar
Design de camiseta de guaxinim e esquilo
Pronto para imprimir
para Merch
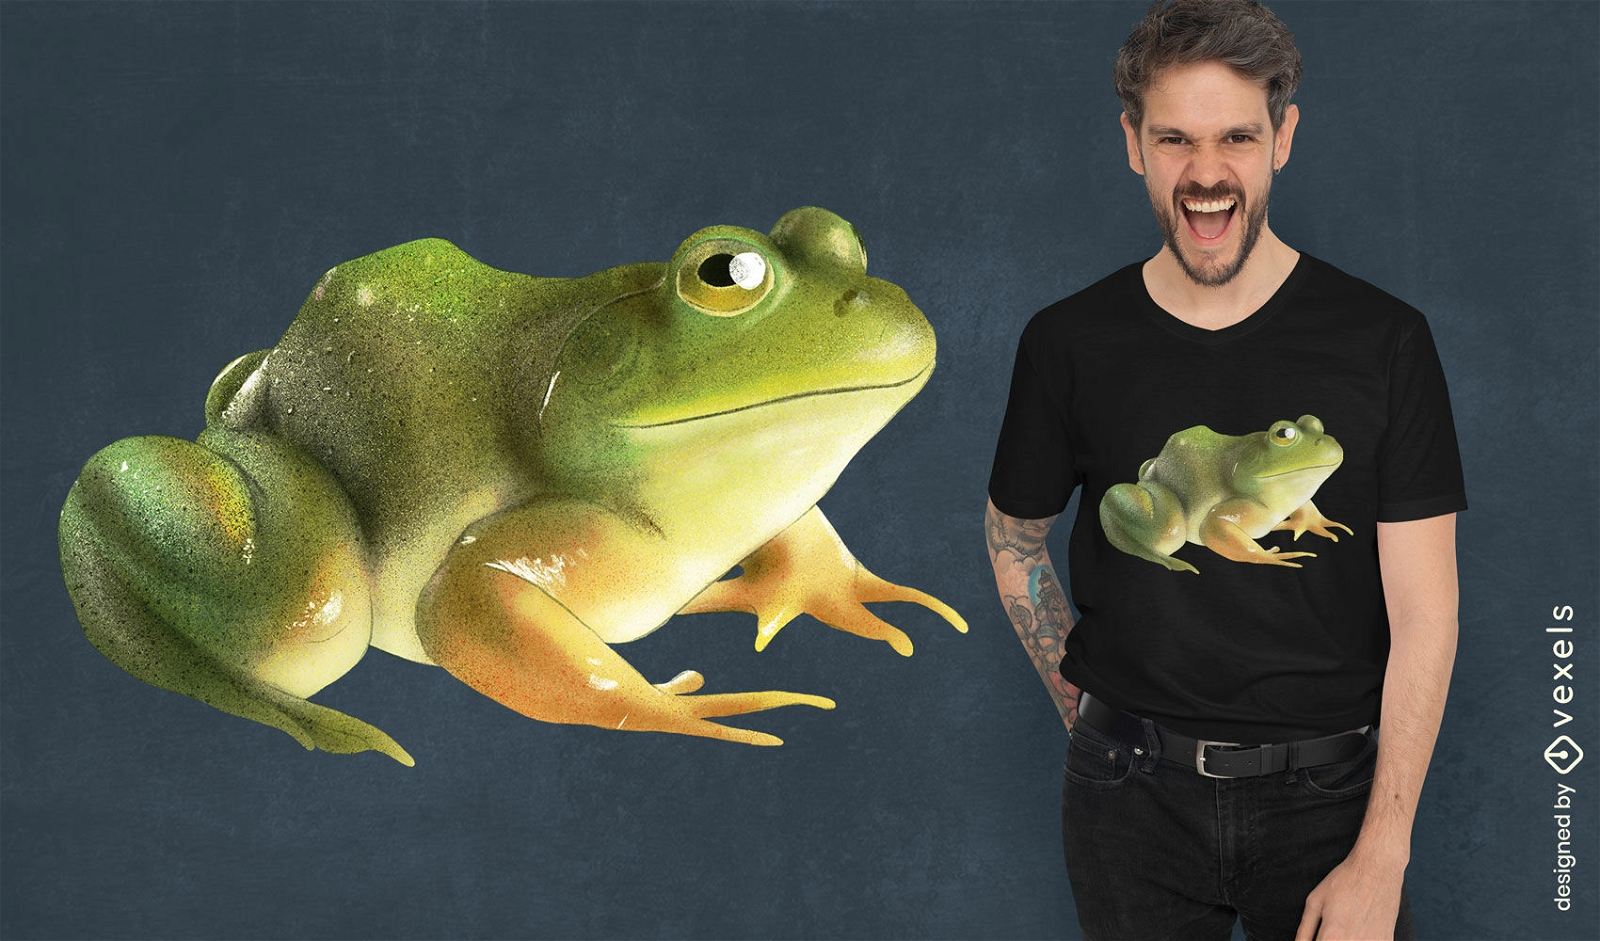
Design de camiseta de sapo realista
Escolha uma pasta
Todos os favoritos
Criar novo
Salvar
Design de camiseta de sapo realista
Pronto para imprimir
para Merch
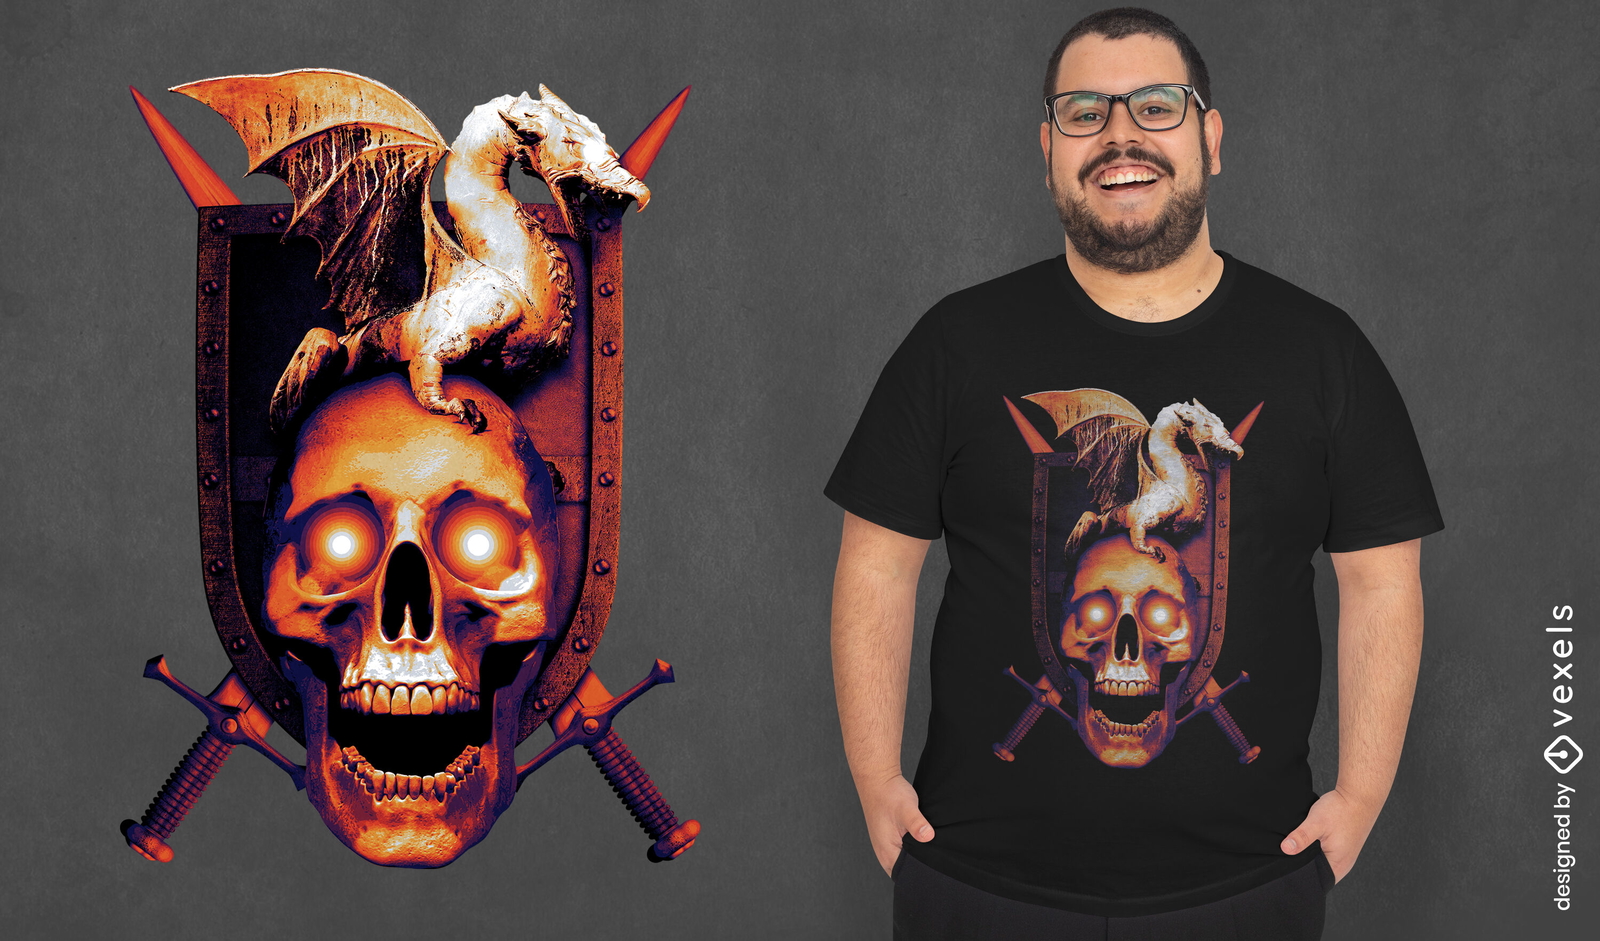
Crânio de escudo e design de camiseta psd dragão
Escolha uma pasta
Todos os favoritos
Criar novo
Salvar
Crânio de escudo e design de camiseta psd dragão
Pronto para imprimir
para Merch
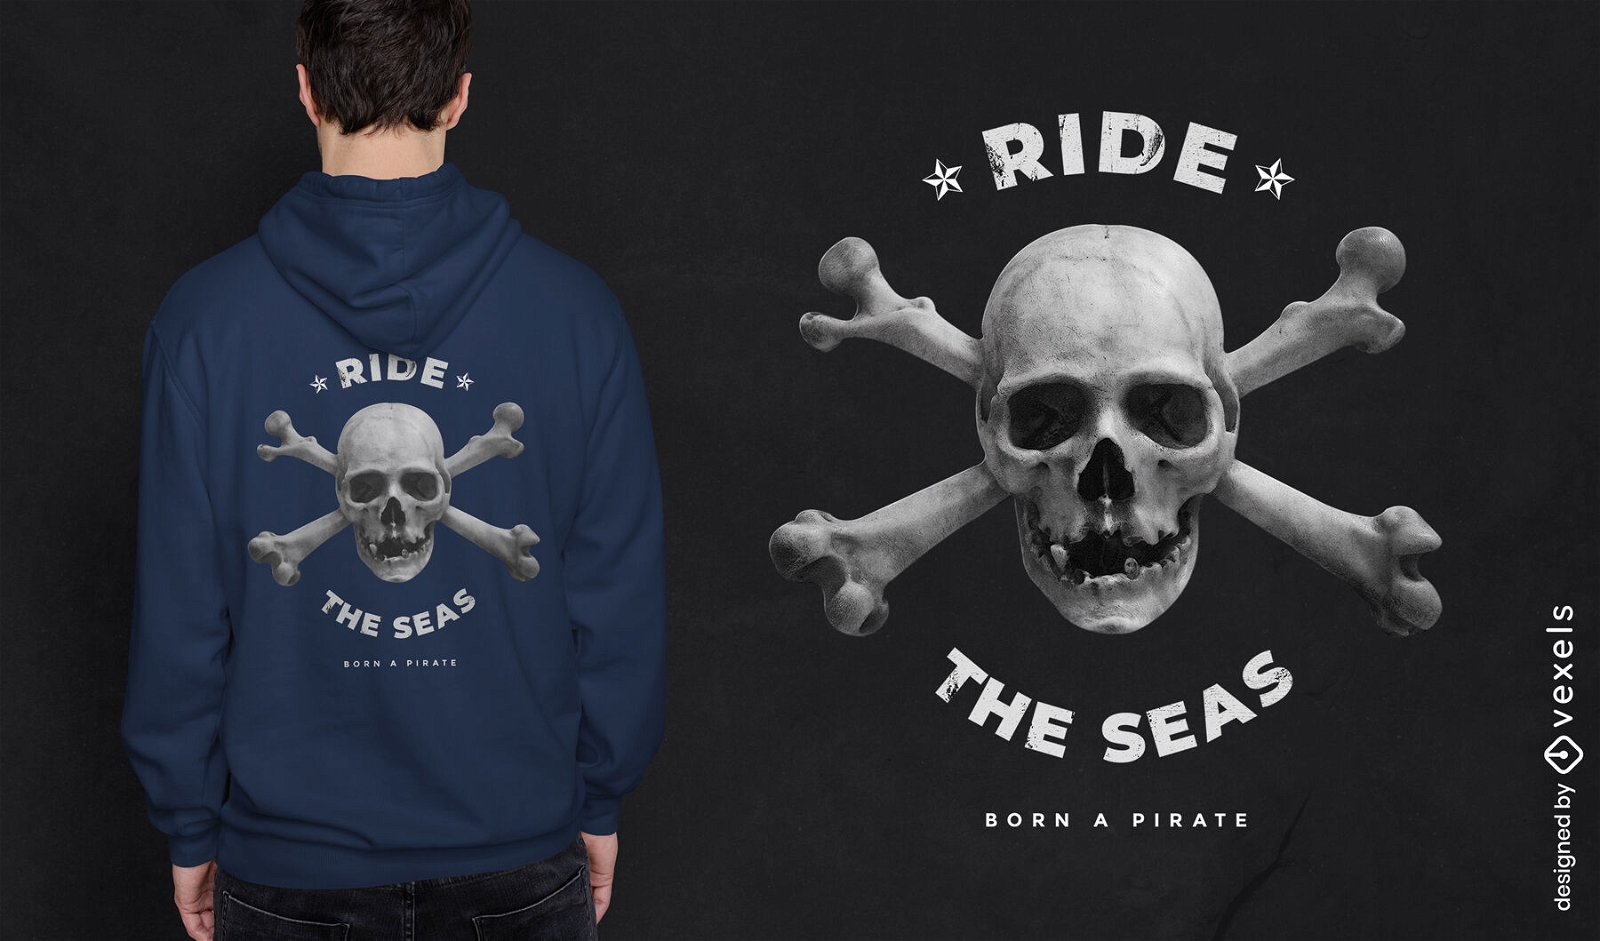
Design de camiseta de pirata de caveira e ossos
Escolha uma pasta
Todos os favoritos
Criar novo
Salvar
Design de camiseta de pirata de caveira e ossos
texto editável
Pronto para imprimir
para Merch
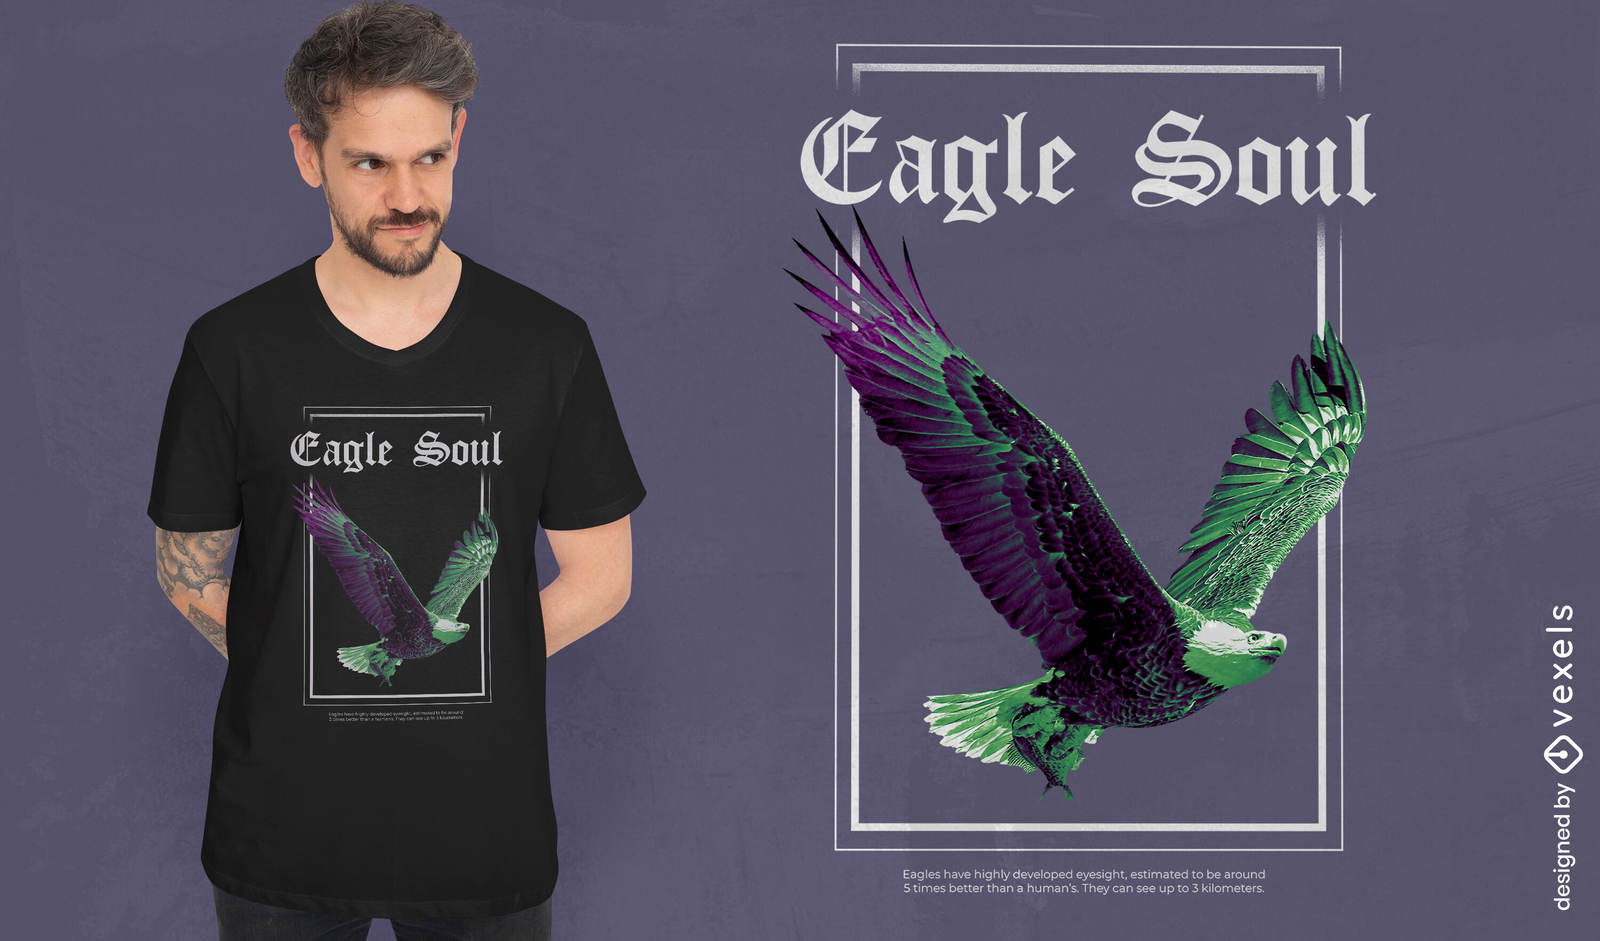
T-shirt psd de águia pássaro selvagem voando
Escolha uma pasta
Todos os favoritos
Criar novo
Salvar
T-shirt psd de águia pássaro selvagem voando
Pronto para imprimir
para Merch
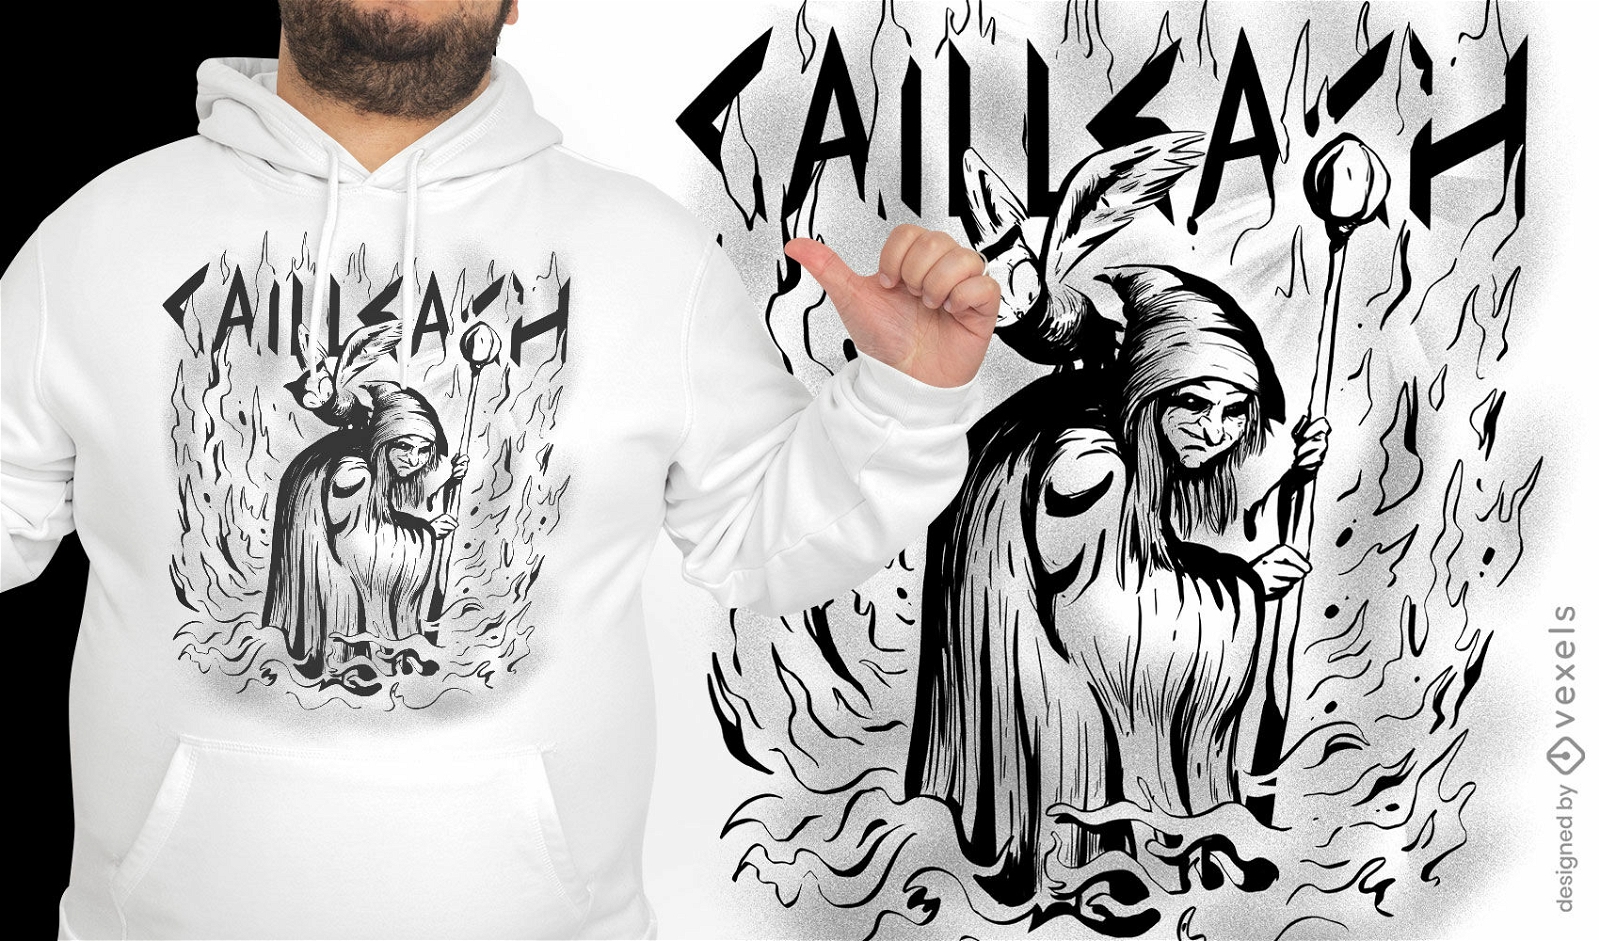
Design de camiseta de criatura celta de fantasia
Escolha uma pasta
Todos os favoritos
Criar novo
Salvar
Design de camiseta de criatura celta de fantasia
Pronto para imprimir
para Merch
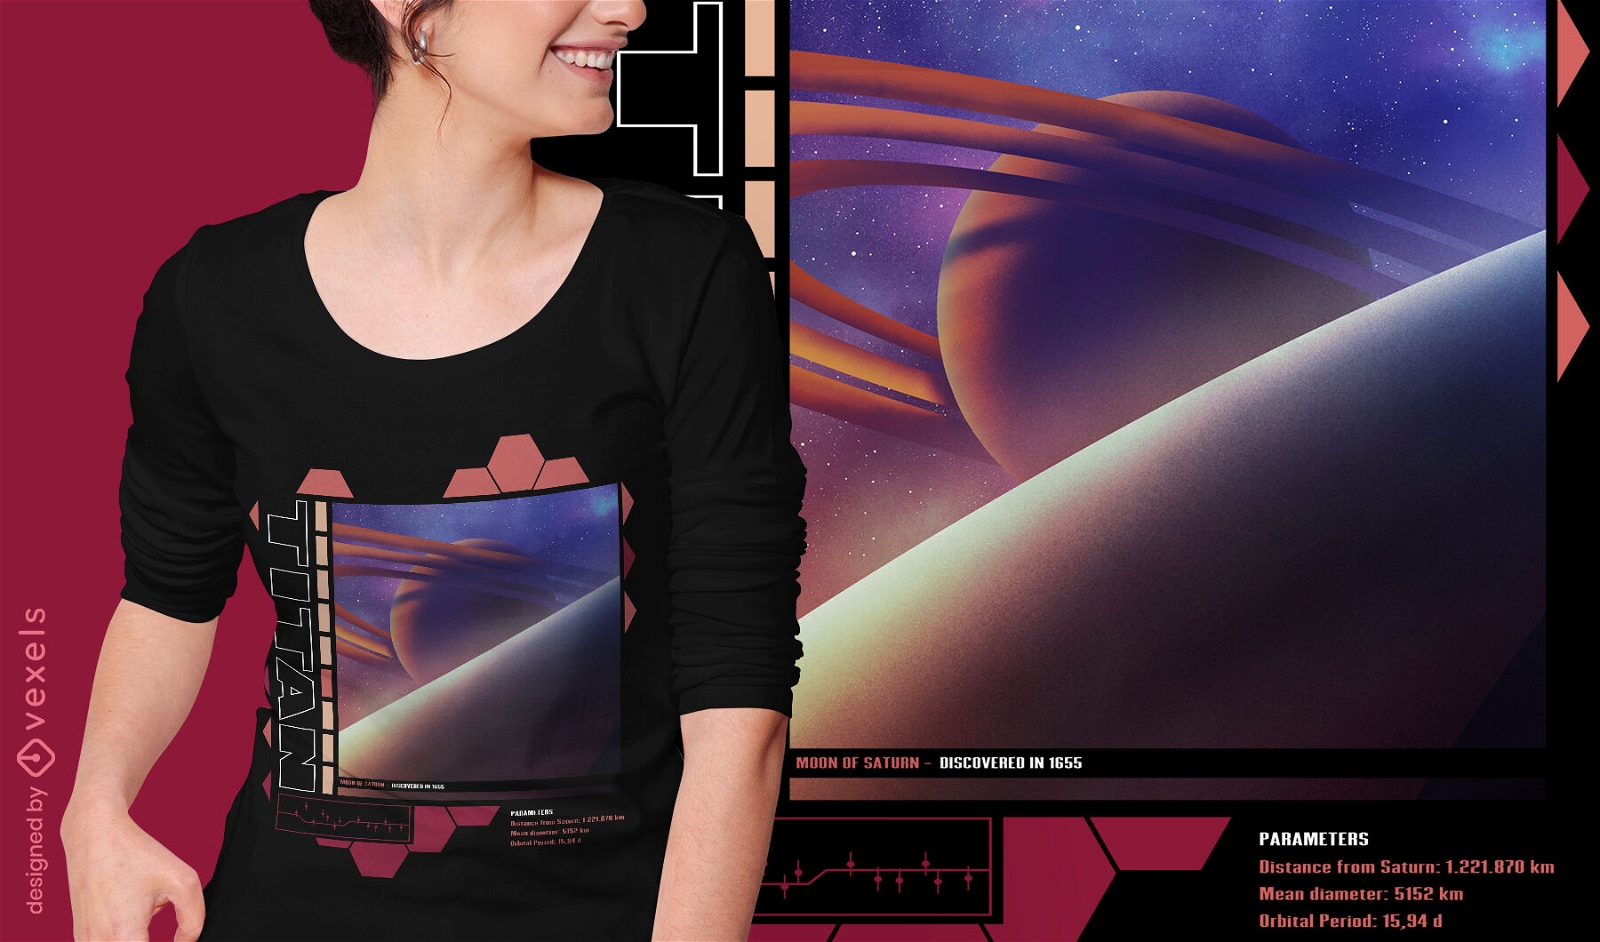
Titan lua de Saturno design de camiseta psd
Escolha uma pasta
Todos os favoritos
Criar novo
Salvar
Titan lua de Saturno design de camiseta psd
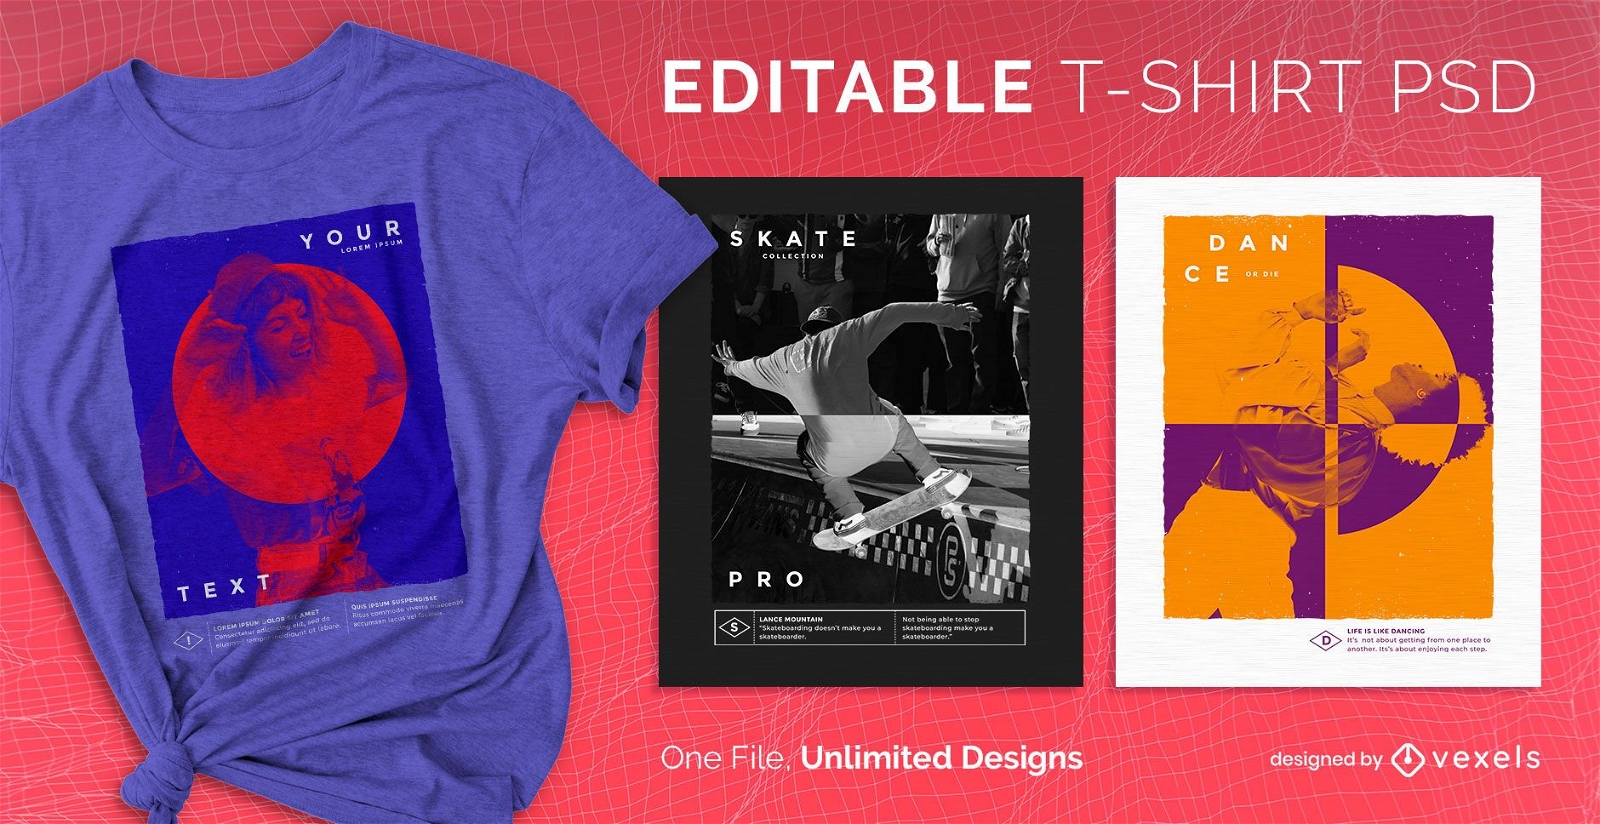
Camiseta PSD escalável
para Merch
Gradient map escalável t-shirt psd
Escolha uma pasta
Todos os favoritos
Criar novo
Salvar
Gradient map escalável t-shirt psd
Pronto para imprimir
para Merch
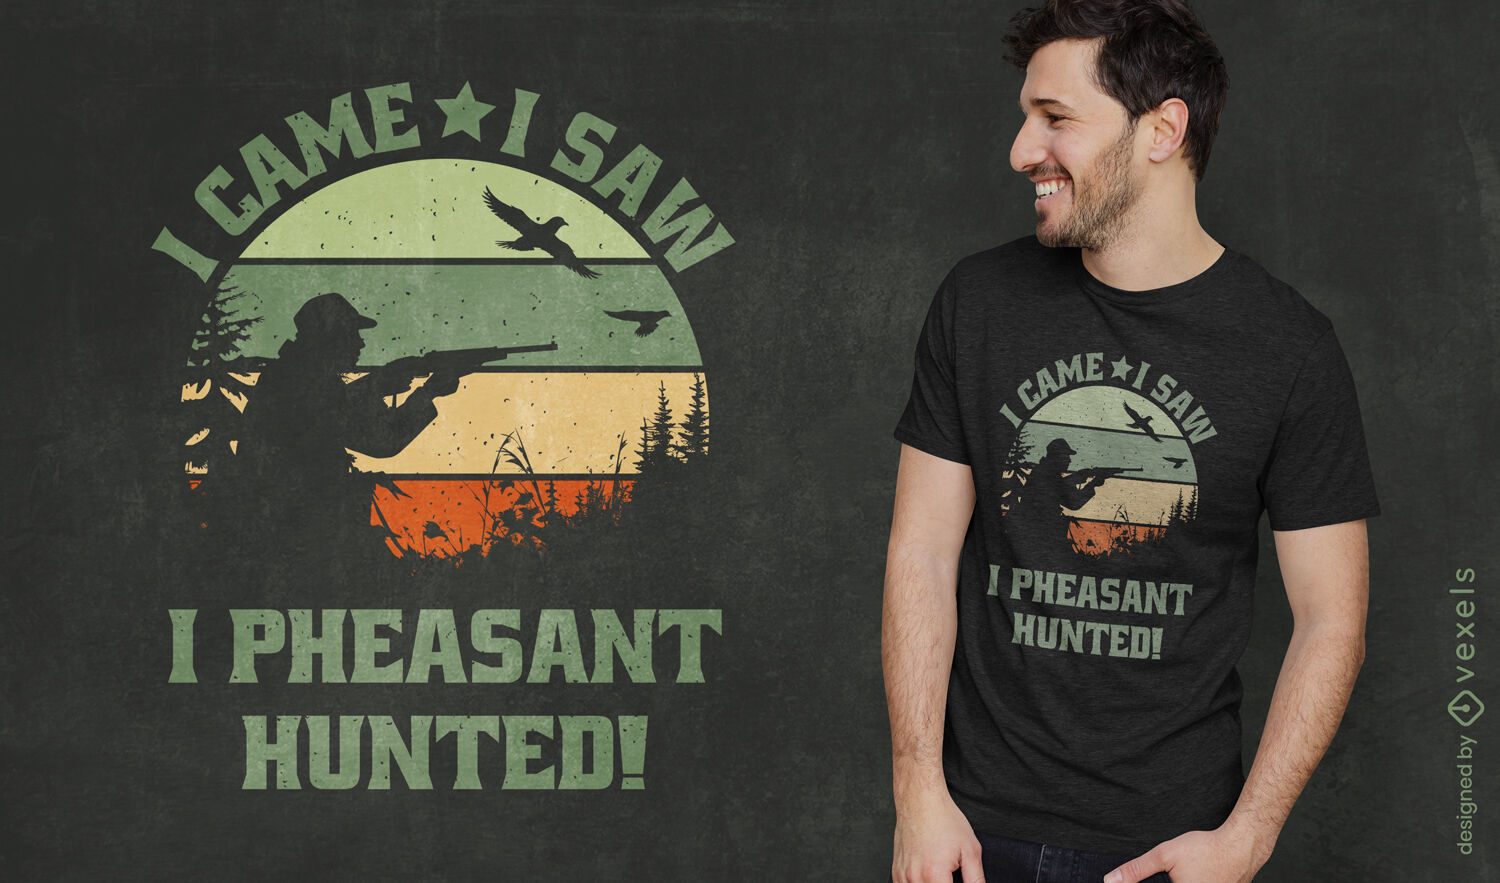
Design de camiseta retrô do pôr do sol com citação de Hunter
Escolha uma pasta
Todos os favoritos
Criar novo
Salvar
Design de camiseta retrô do pôr do sol com citação de Hunter
texto editável
Pronto para imprimir
para Merch
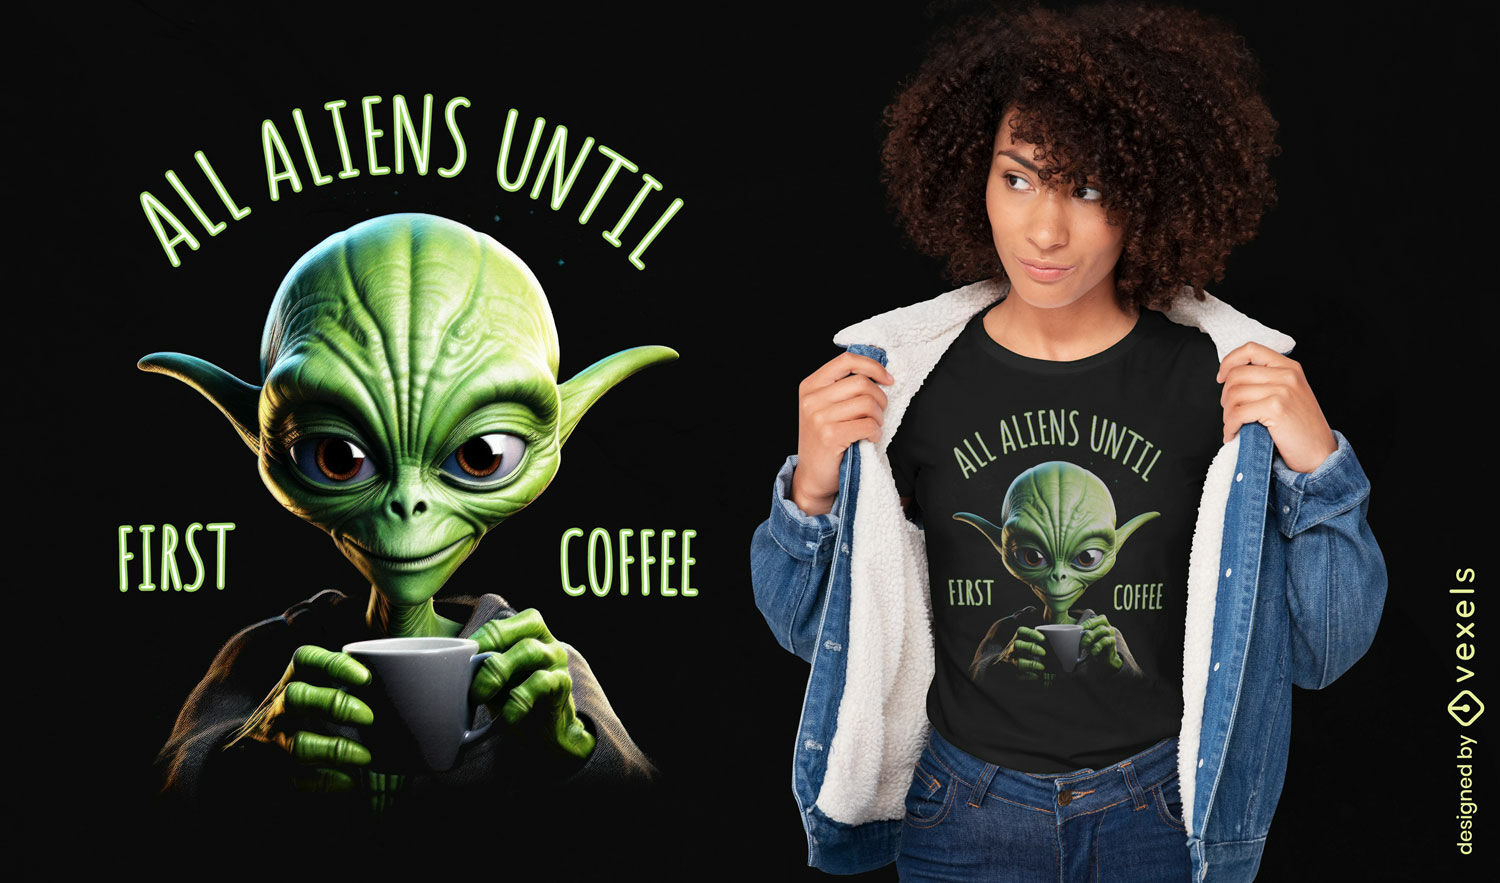
Todos os alienígenas até o design da camiseta do primeiro café
Escolha uma pasta
Todos os favoritos
Criar novo
Salvar
Todos os alienígenas até o design da camiseta do primeiro café
texto editável
Pronto para imprimir
para Merch
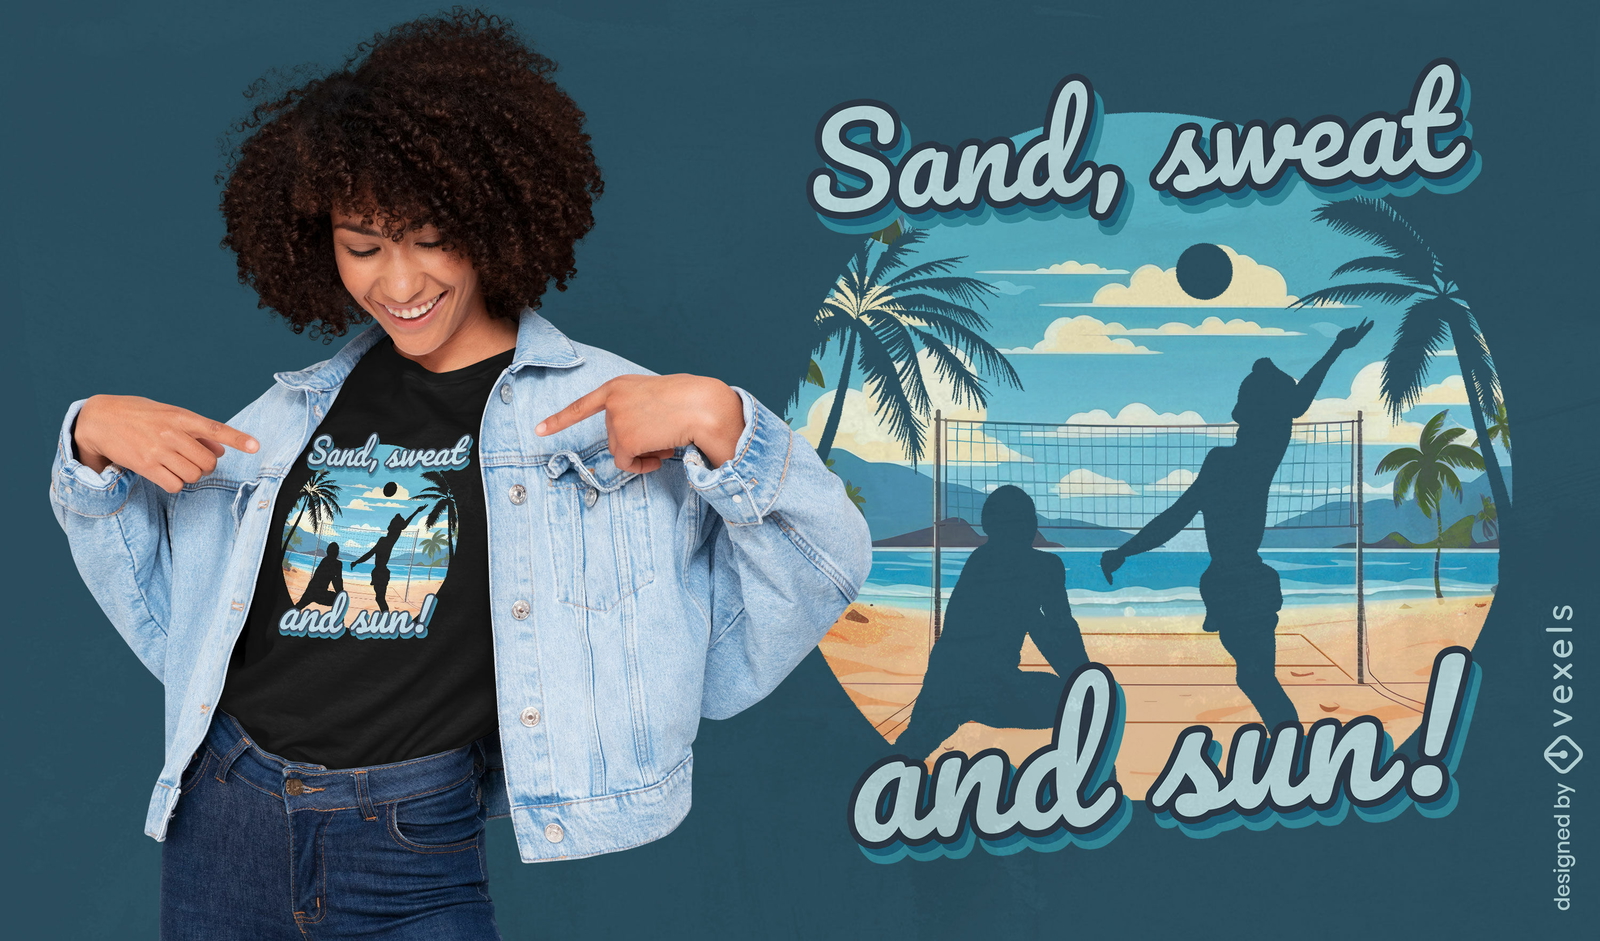
Design de camiseta de verão de vôlei
Escolha uma pasta
Todos os favoritos
Criar novo
Salvar
Design de camiseta de verão de vôlei
Pronto para imprimir
para Merch
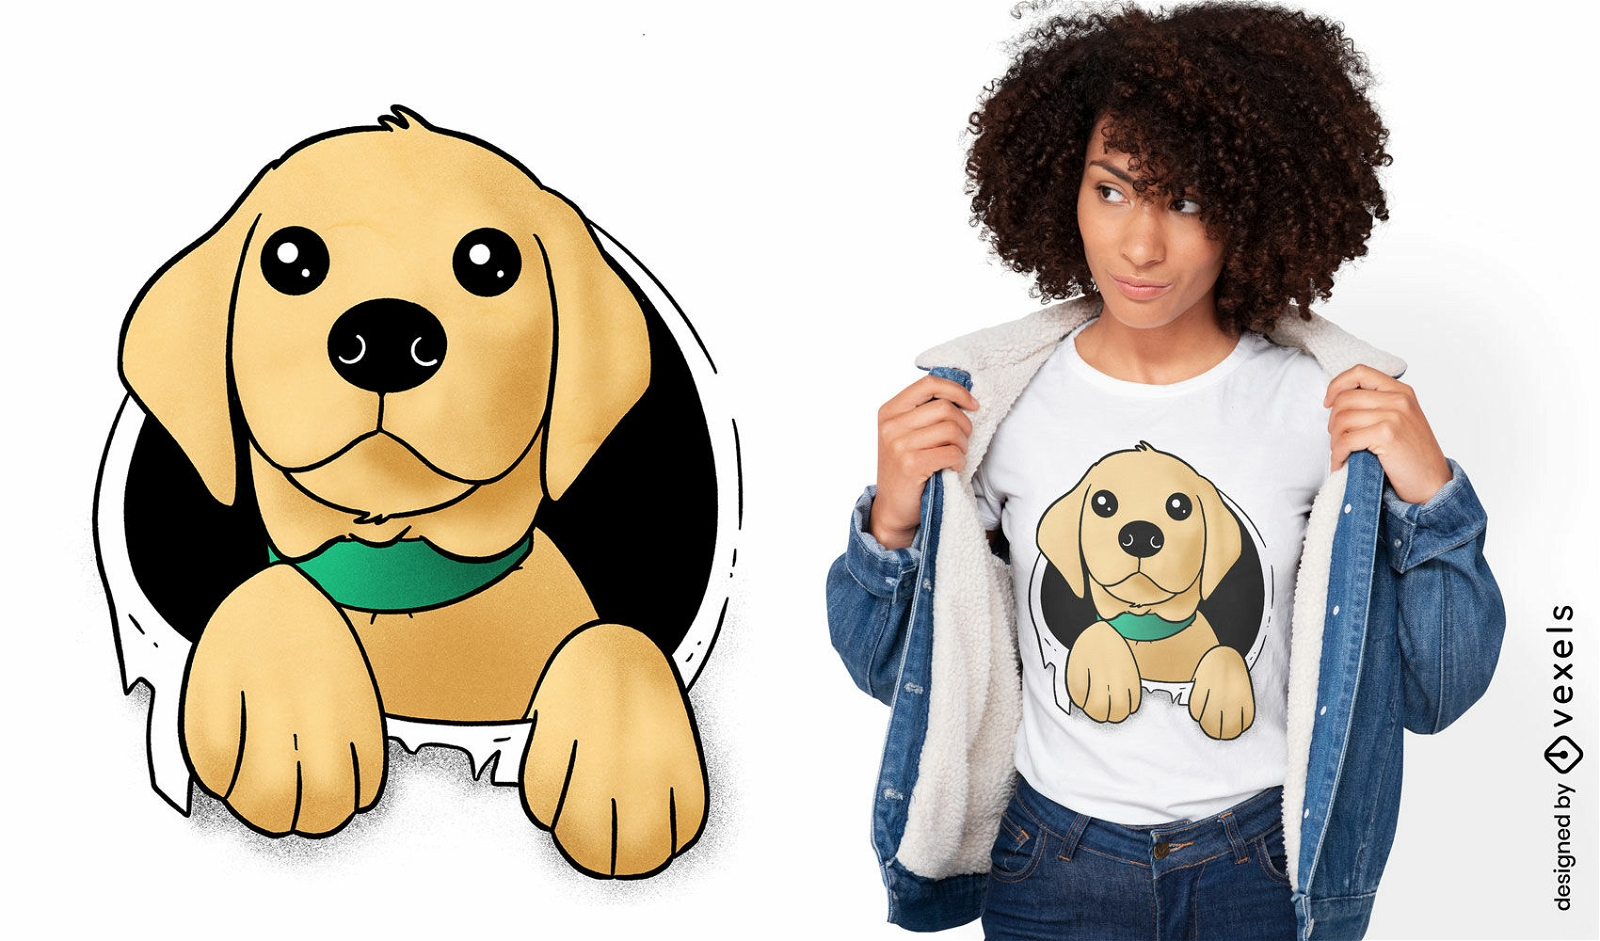
Design de camiseta de filhote de labrador
Escolha uma pasta
Todos os favoritos
Criar novo
Salvar
Design de camiseta de filhote de labrador
Pronto para imprimir
para Merch
Design de camiseta de cobra com borboletas azuis
Escolha uma pasta
Todos os favoritos
Criar novo
Salvar
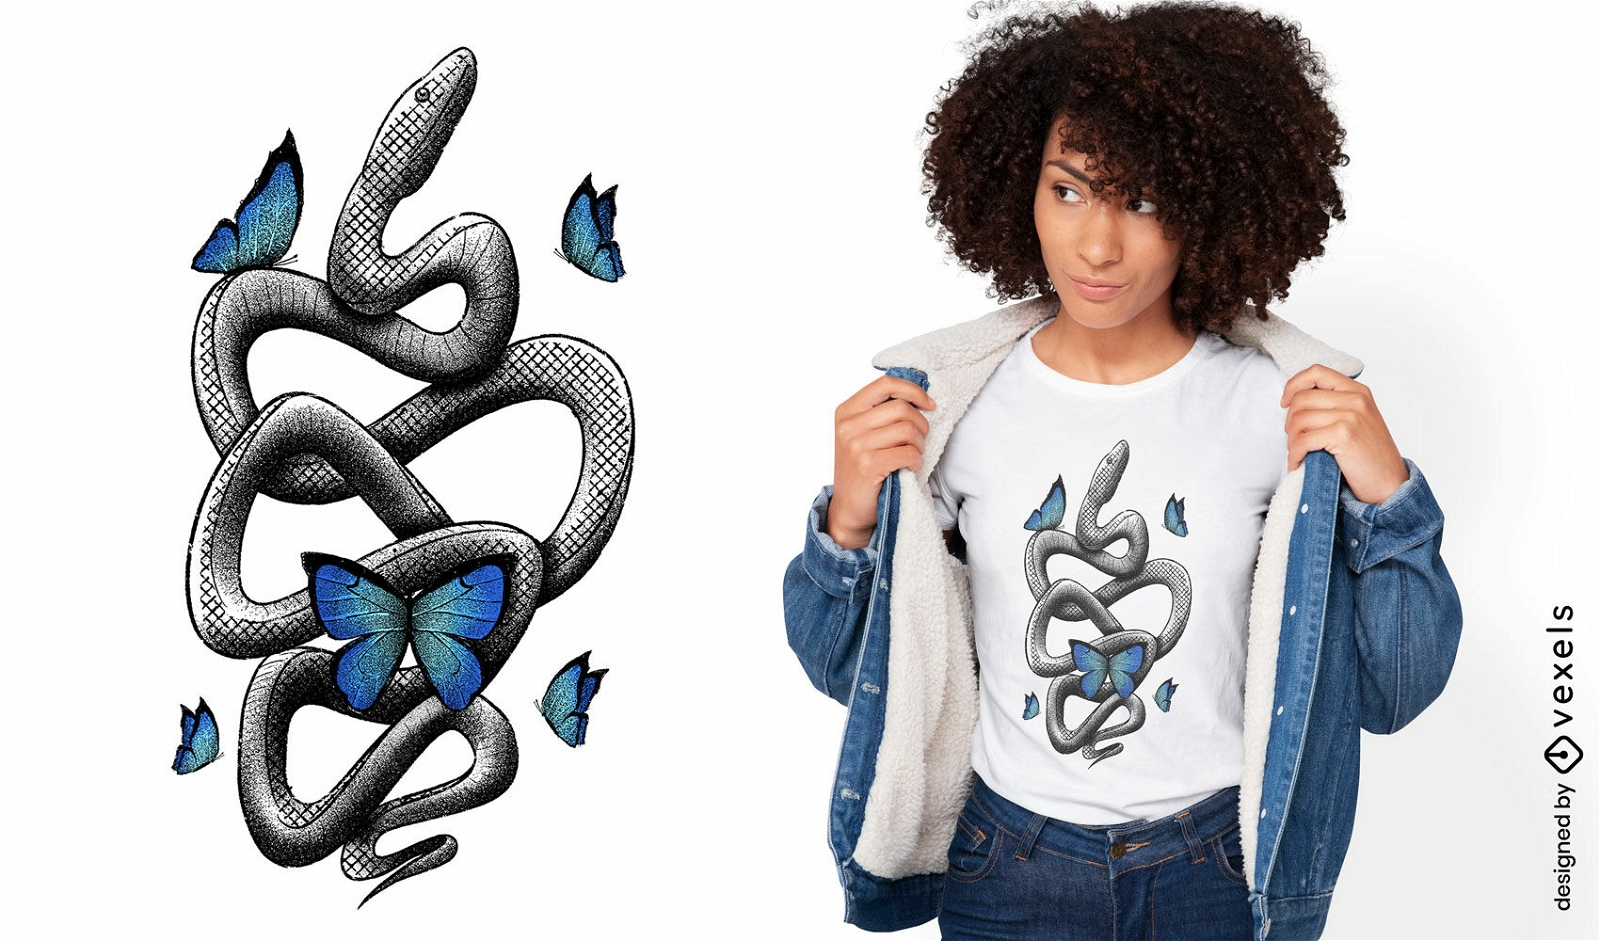
Design de camiseta de cobra com borboletas azuis
Pronto para imprimir
para Merch
Design de camiseta de cozinha de polvo chef
Escolha uma pasta
Todos os favoritos
Criar novo
Salvar
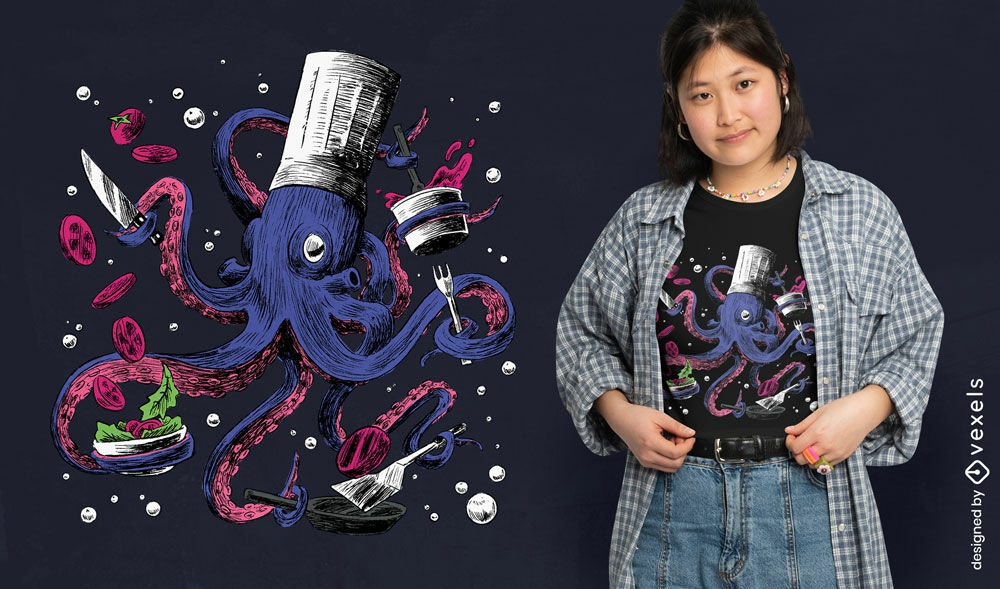
Design de camiseta de cozinha de polvo chef
texto editável
Pronto para imprimir
para Merch
Design de camiseta PSD da glória do futebol mundial
Escolha uma pasta
Todos os favoritos
Criar novo
Salvar
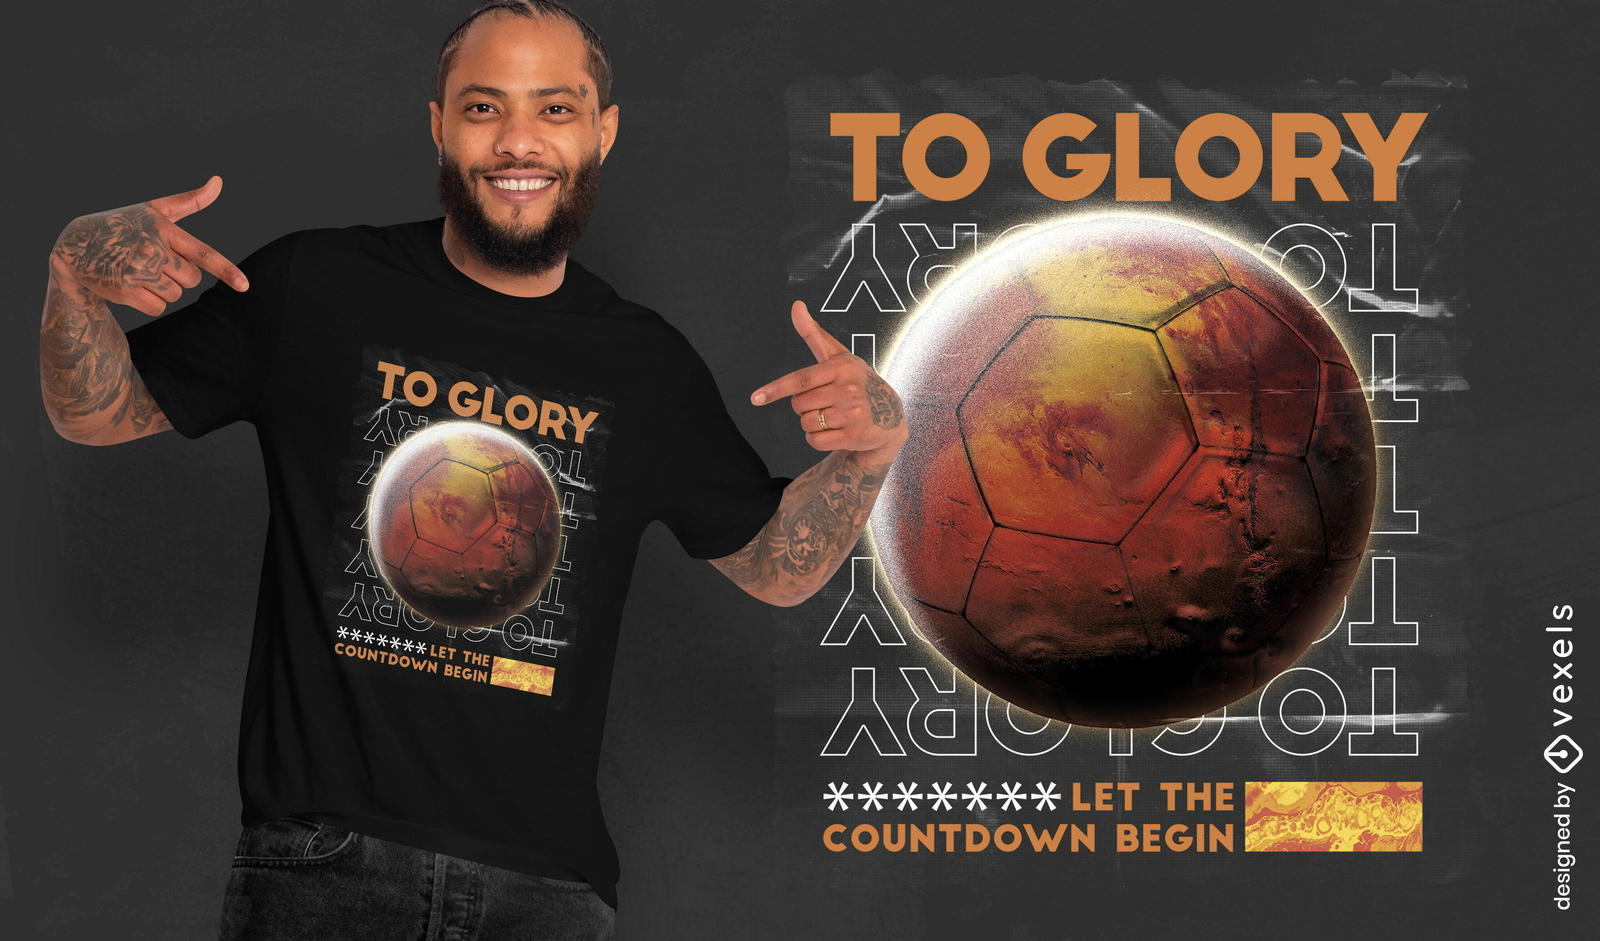
Design de camiseta PSD da glória do futebol mundial
Pronto para imprimir
para Merch
T-shirt do guerreiro do inseto da mariposa gigante psd
Escolha uma pasta
Todos os favoritos
Criar novo
Salvar
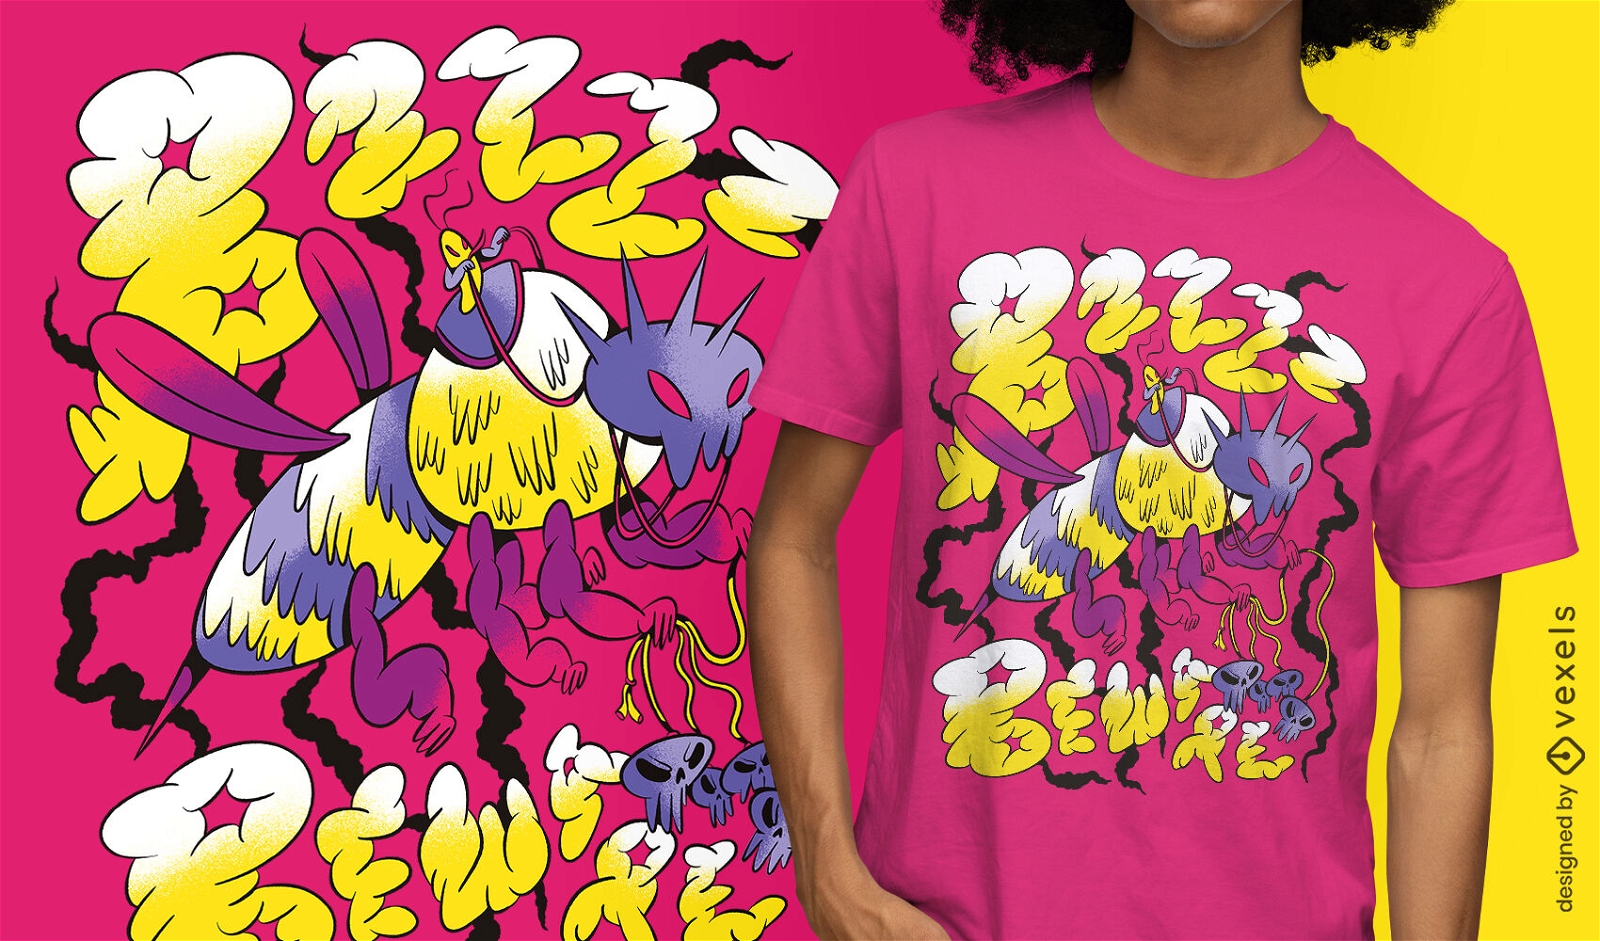
T-shirt do guerreiro do inseto da mariposa gigante psd
texto editável
Pronto para imprimir
para Merch
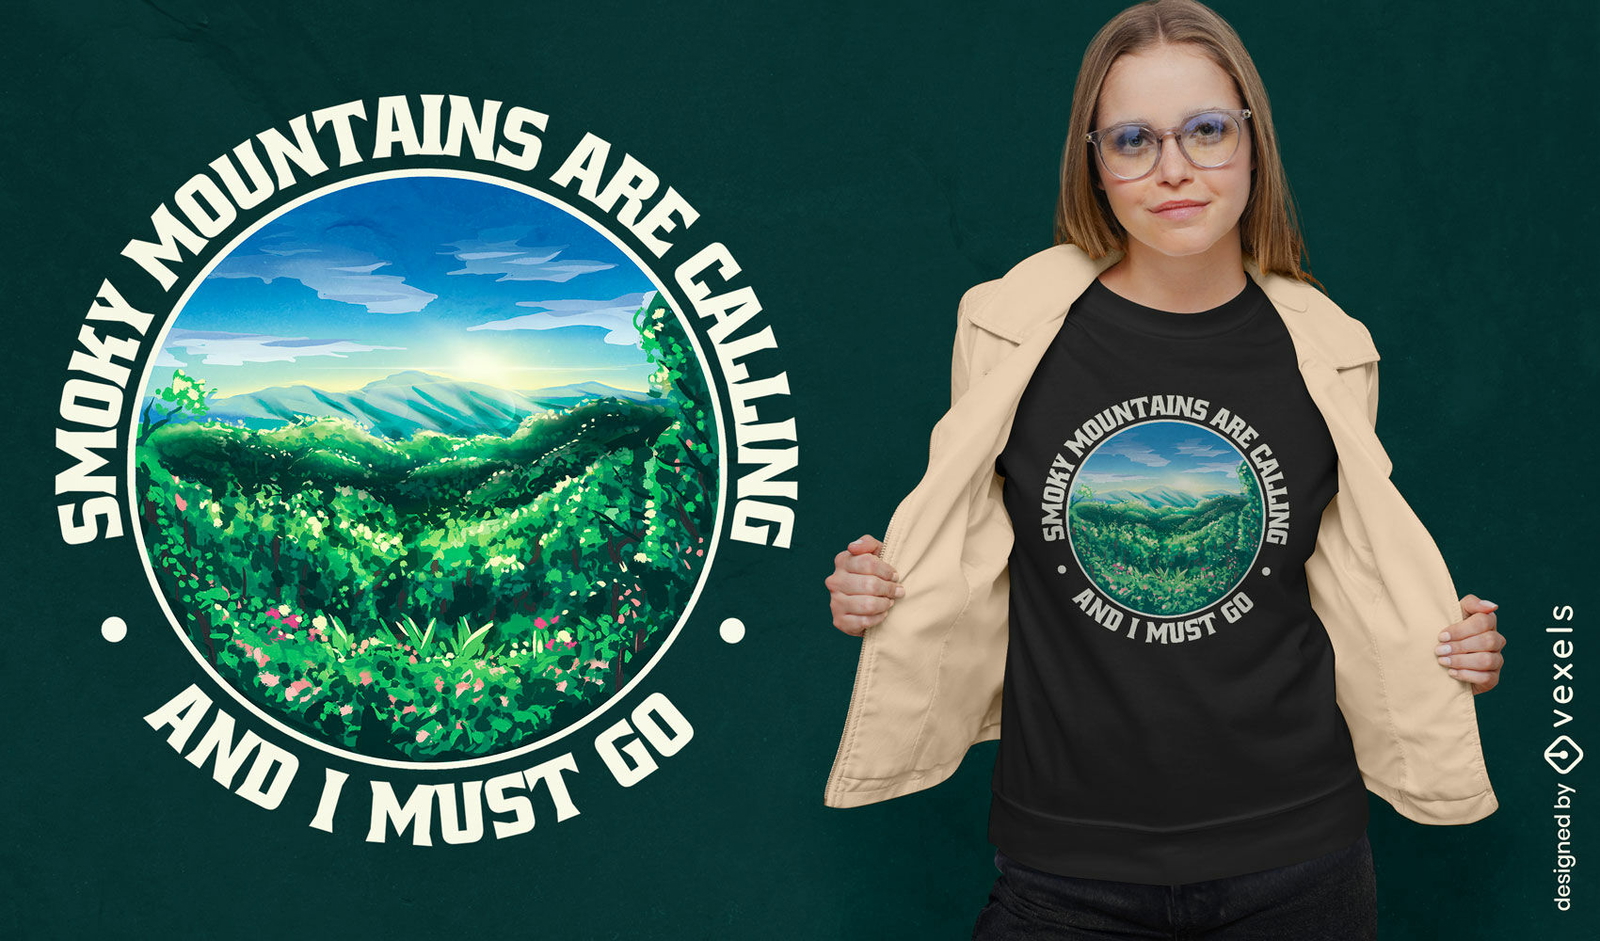
Montanhas esfumaçadas estão chamando o design de camisetas
Escolha uma pasta
Todos os favoritos
Criar novo
Salvar
Montanhas esfumaçadas estão chamando o design de camisetas
Pronto para imprimir
para Merch
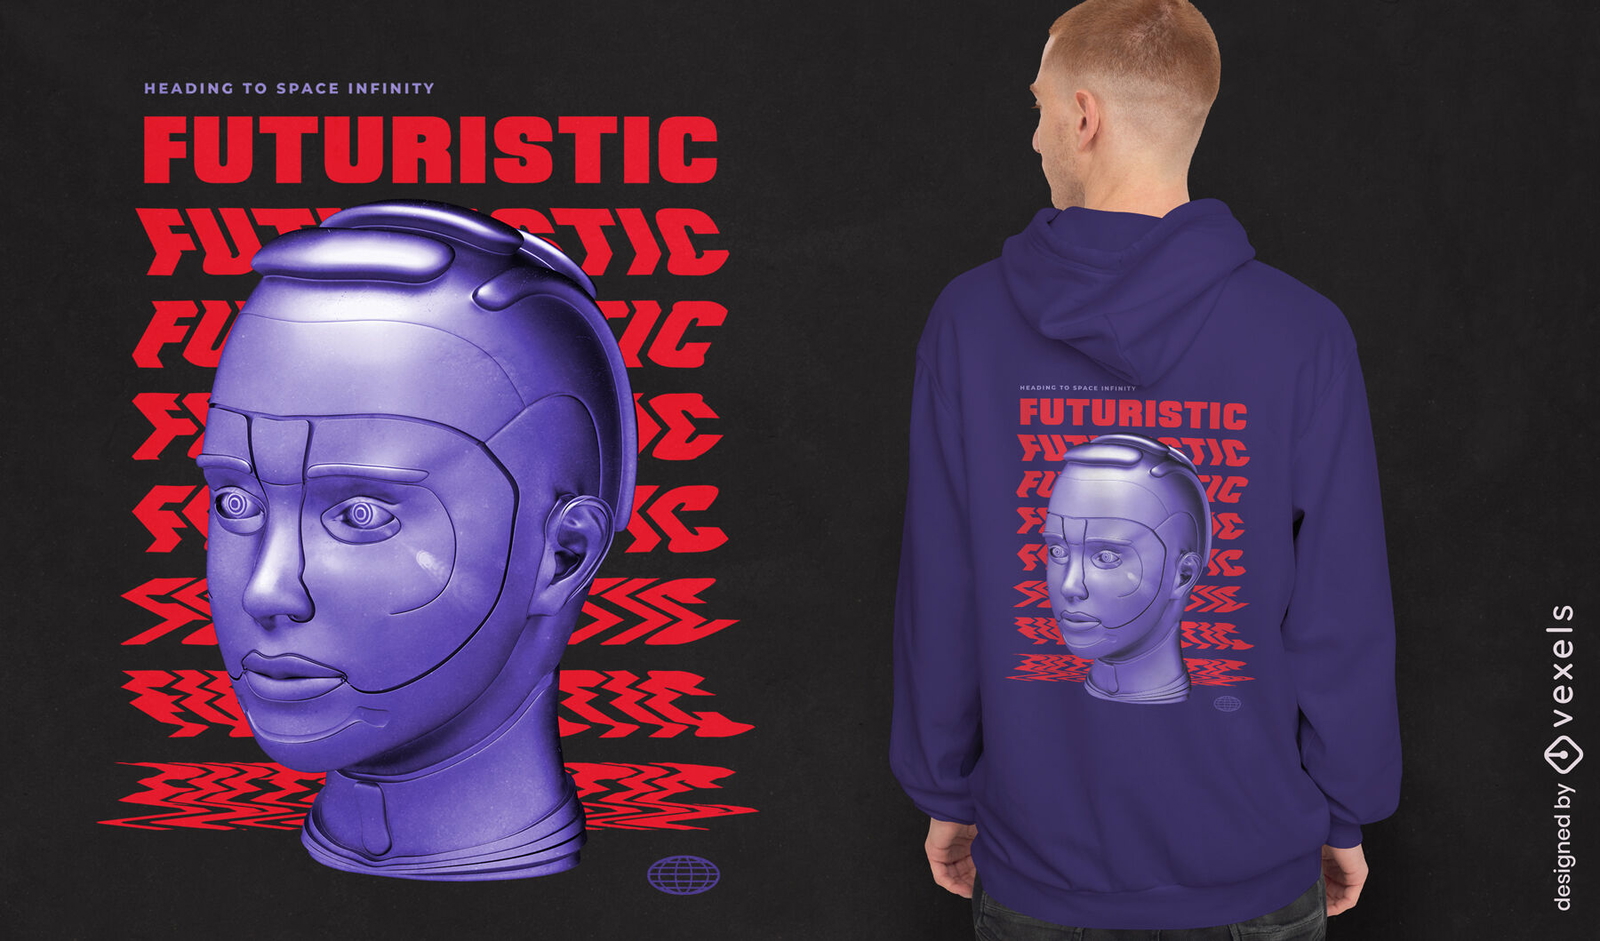
Design de camiseta PSD de cabeça de robô futurista
Escolha uma pasta
Todos os favoritos
Criar novo
Salvar
Design de camiseta PSD de cabeça de robô futurista
Pronto para imprimir
para Merch
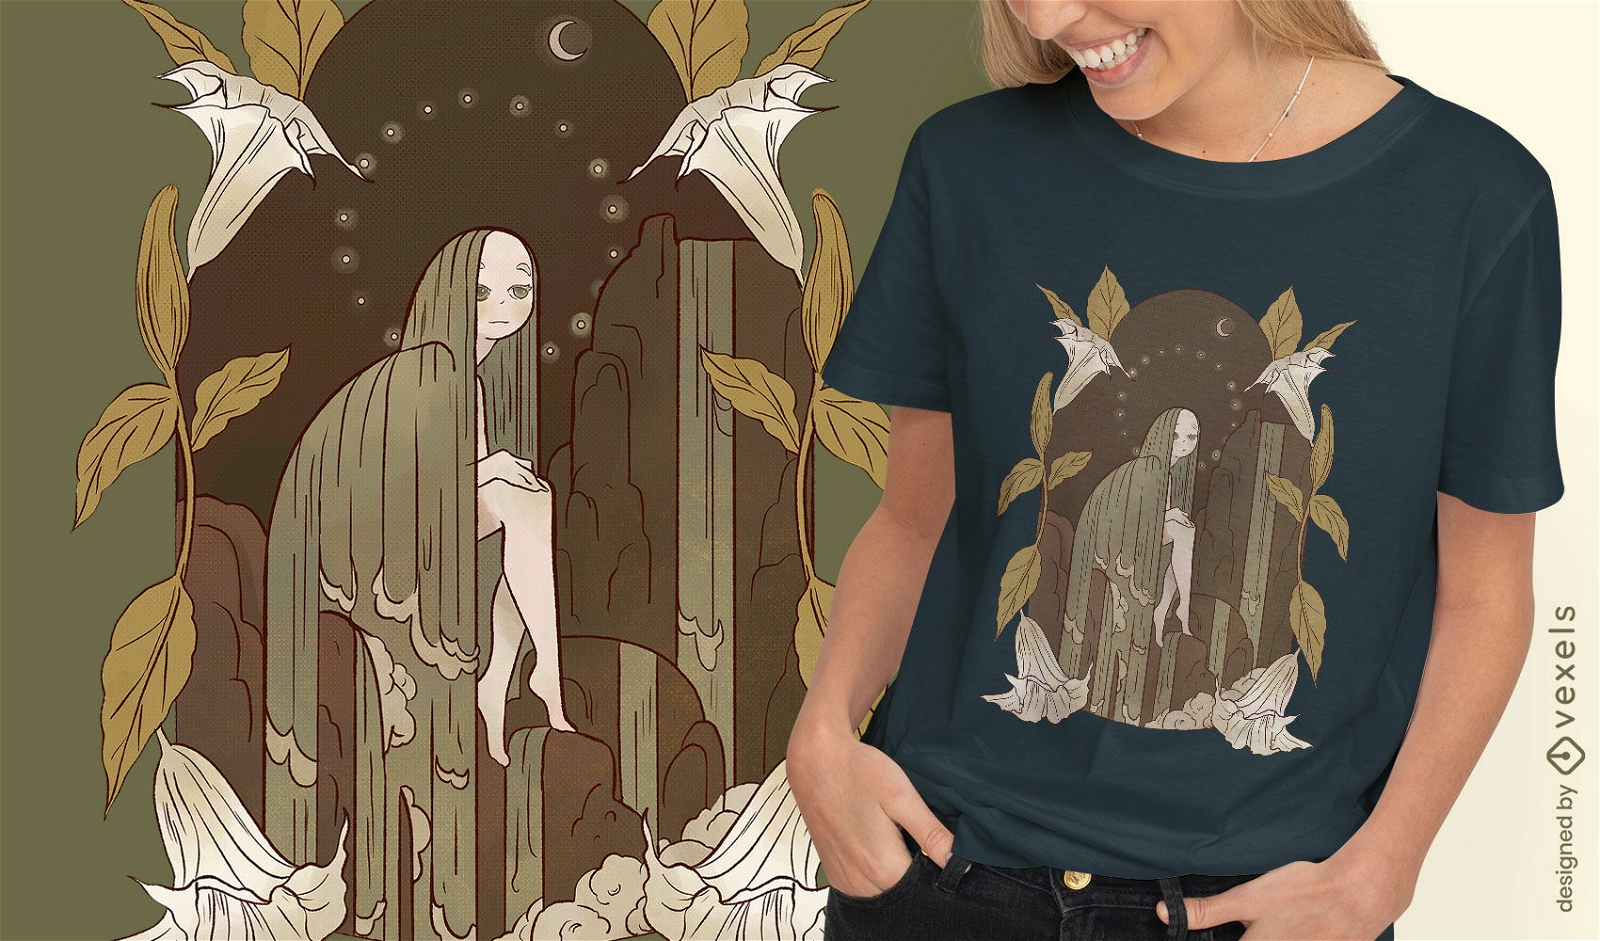
Design de camiseta de fada da cachoeira escura
Escolha uma pasta
Todos os favoritos
Criar novo
Salvar
Design de camiseta de fada da cachoeira escura
Pronto para imprimir
para Merch
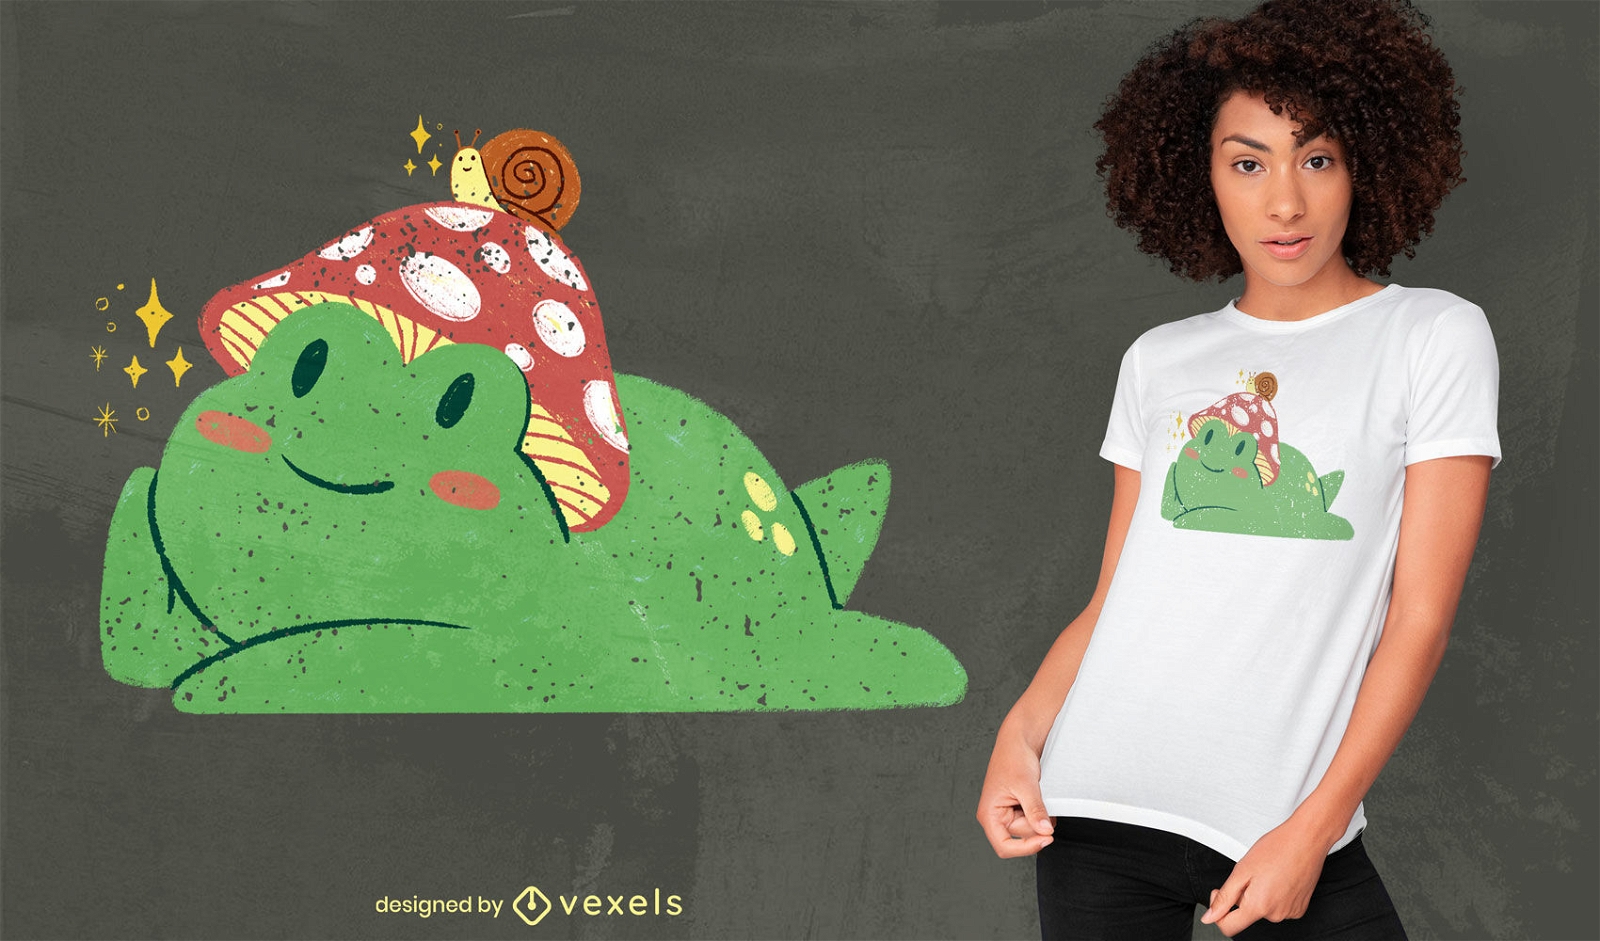
Sapo fofo com design de camiseta psd de cogumelo e caracol
Escolha uma pasta
Todos os favoritos
Criar novo
Salvar
Sapo fofo com design de camiseta psd de cogumelo e caracol
Pronto para imprimir
para Merch
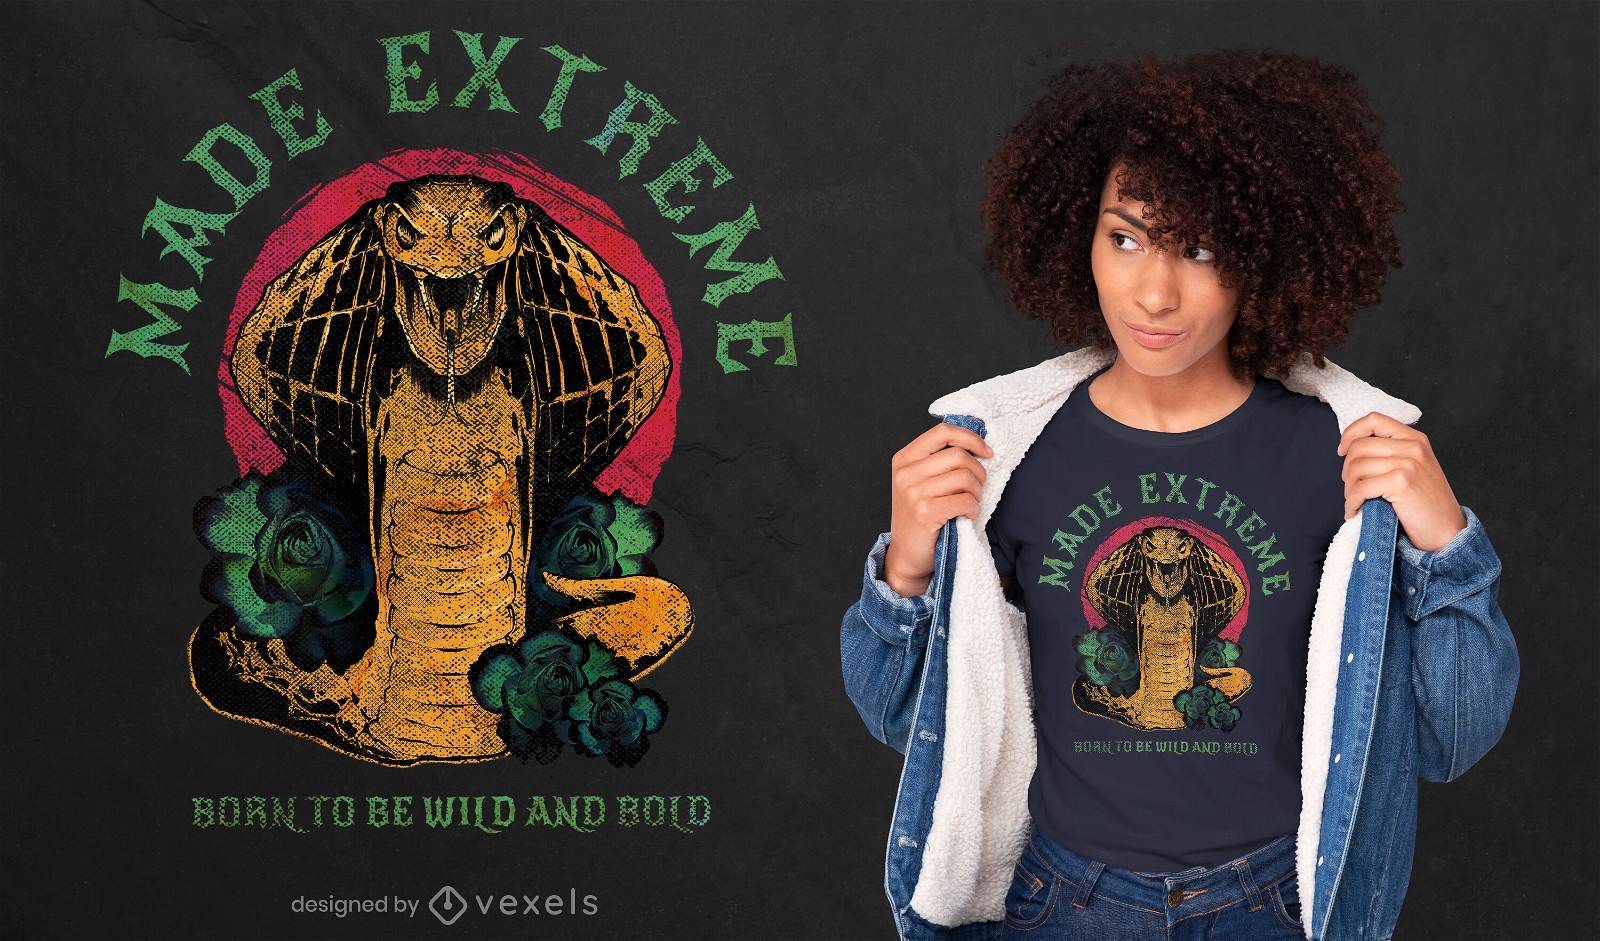
Cobra cobra t-shirt de animal selvagem psd
Escolha uma pasta
Todos os favoritos
Criar novo
Salvar
Cobra cobra t-shirt de animal selvagem psd
Pronto para imprimir
para Merch
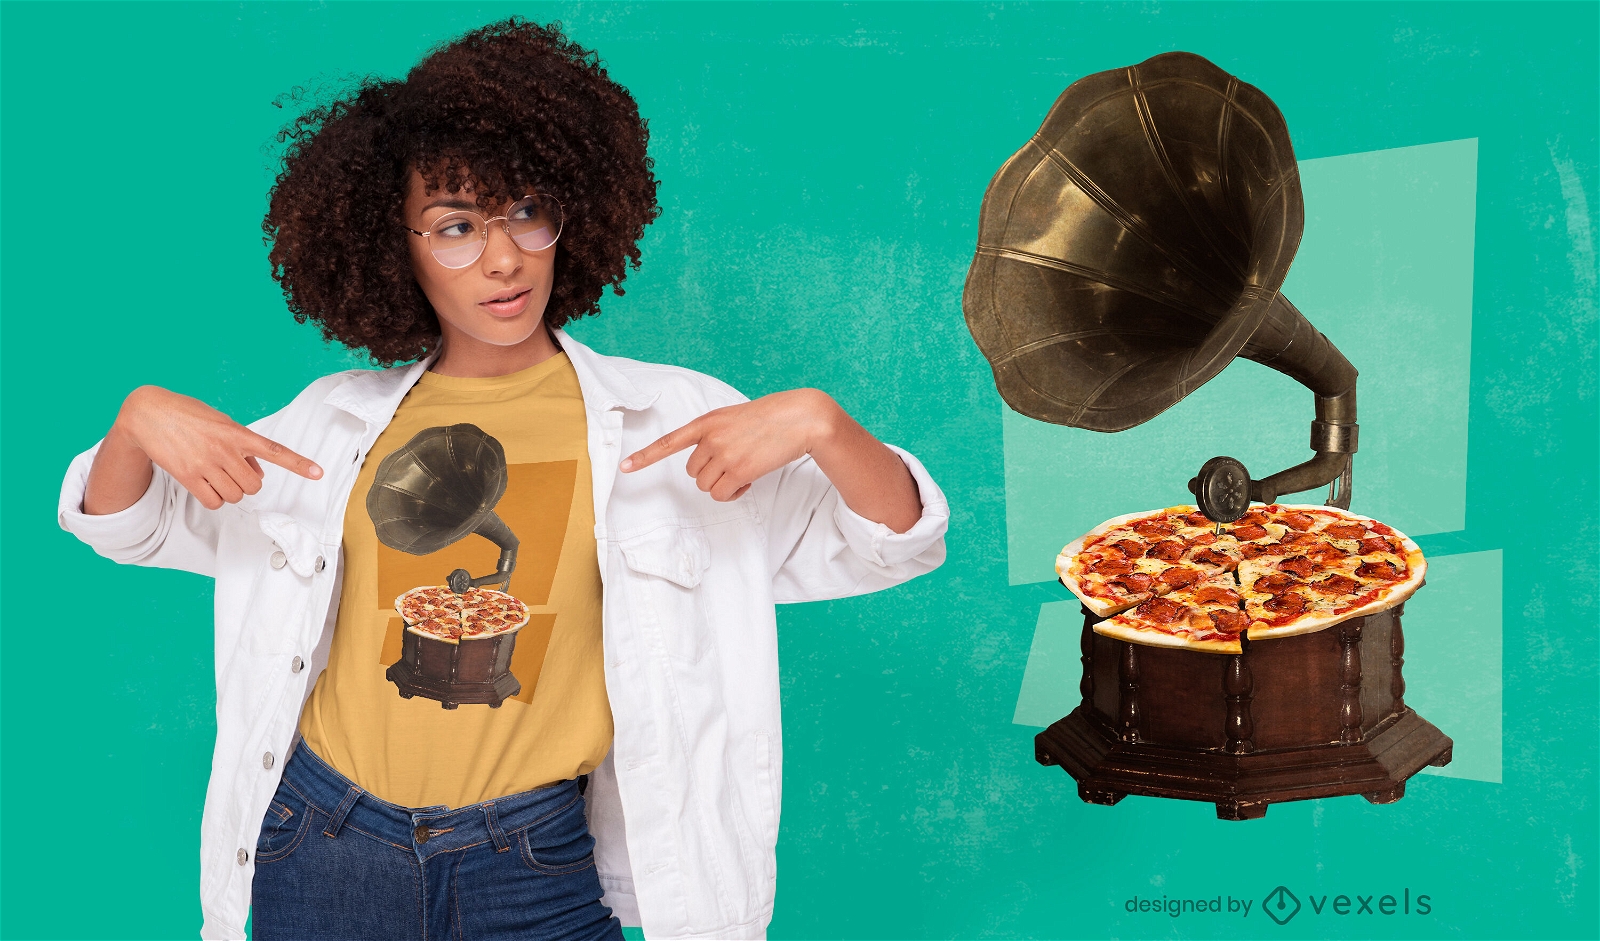
T-shirt PSD toca-discos de vinil pizza design
Escolha uma pasta
Todos os favoritos
Criar novo
Salvar
T-shirt PSD toca-discos de vinil pizza design
Pronto para imprimir
para Merch
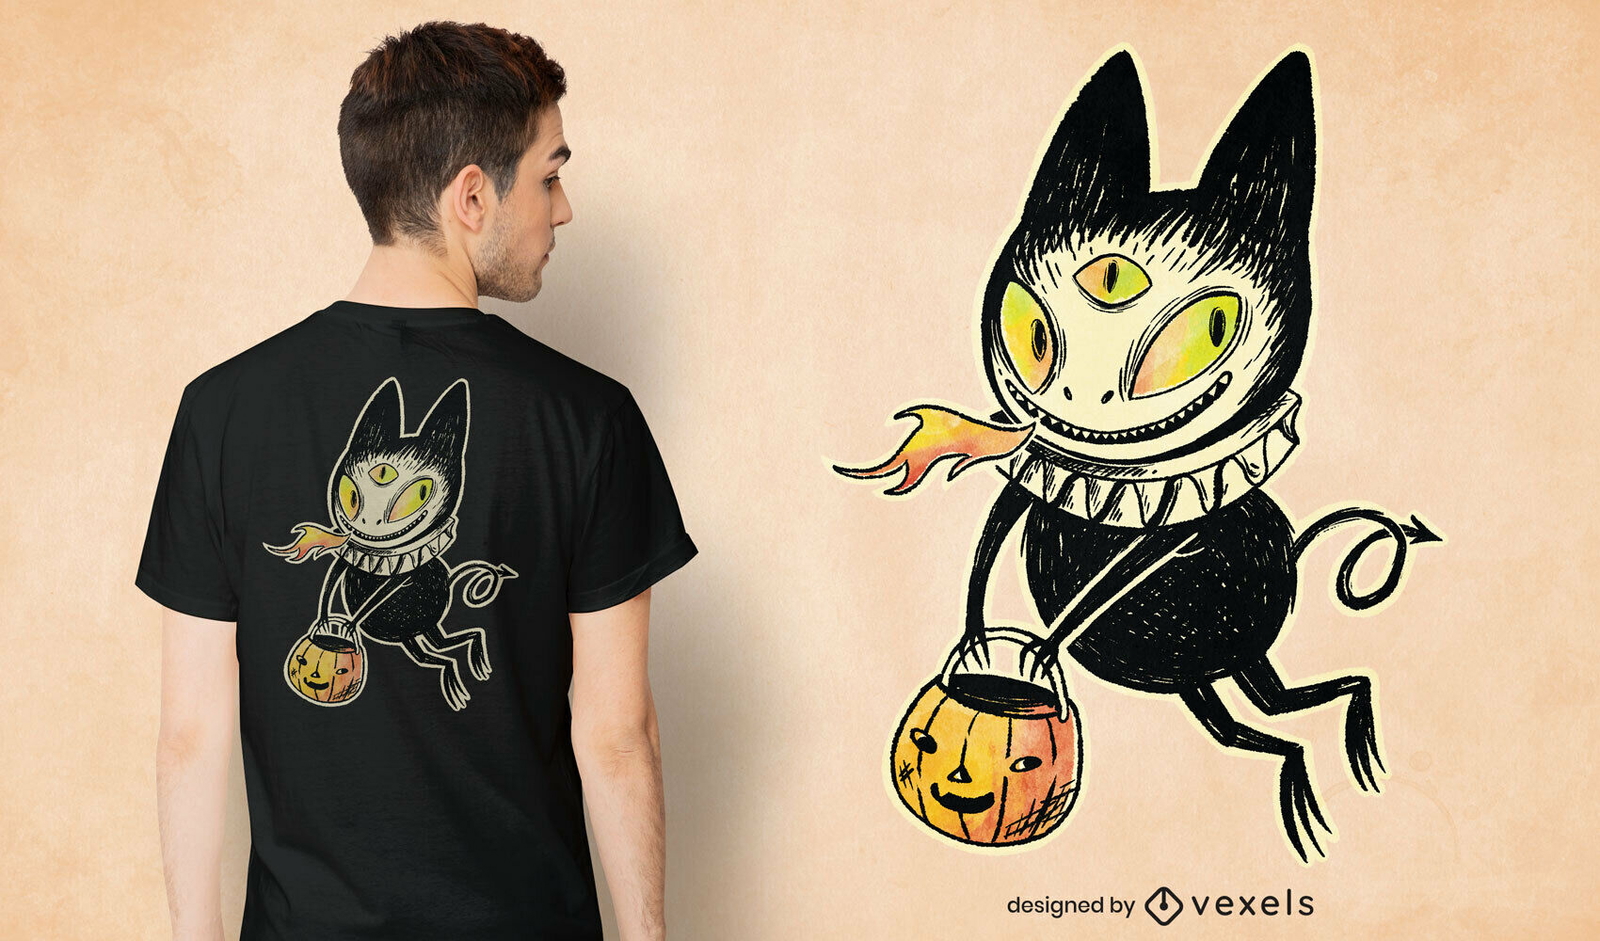
Camiseta PSD com ilustração de gato demoníaco
Escolha uma pasta
Todos os favoritos
Criar novo
Salvar
Camiseta PSD com ilustração de gato demoníaco
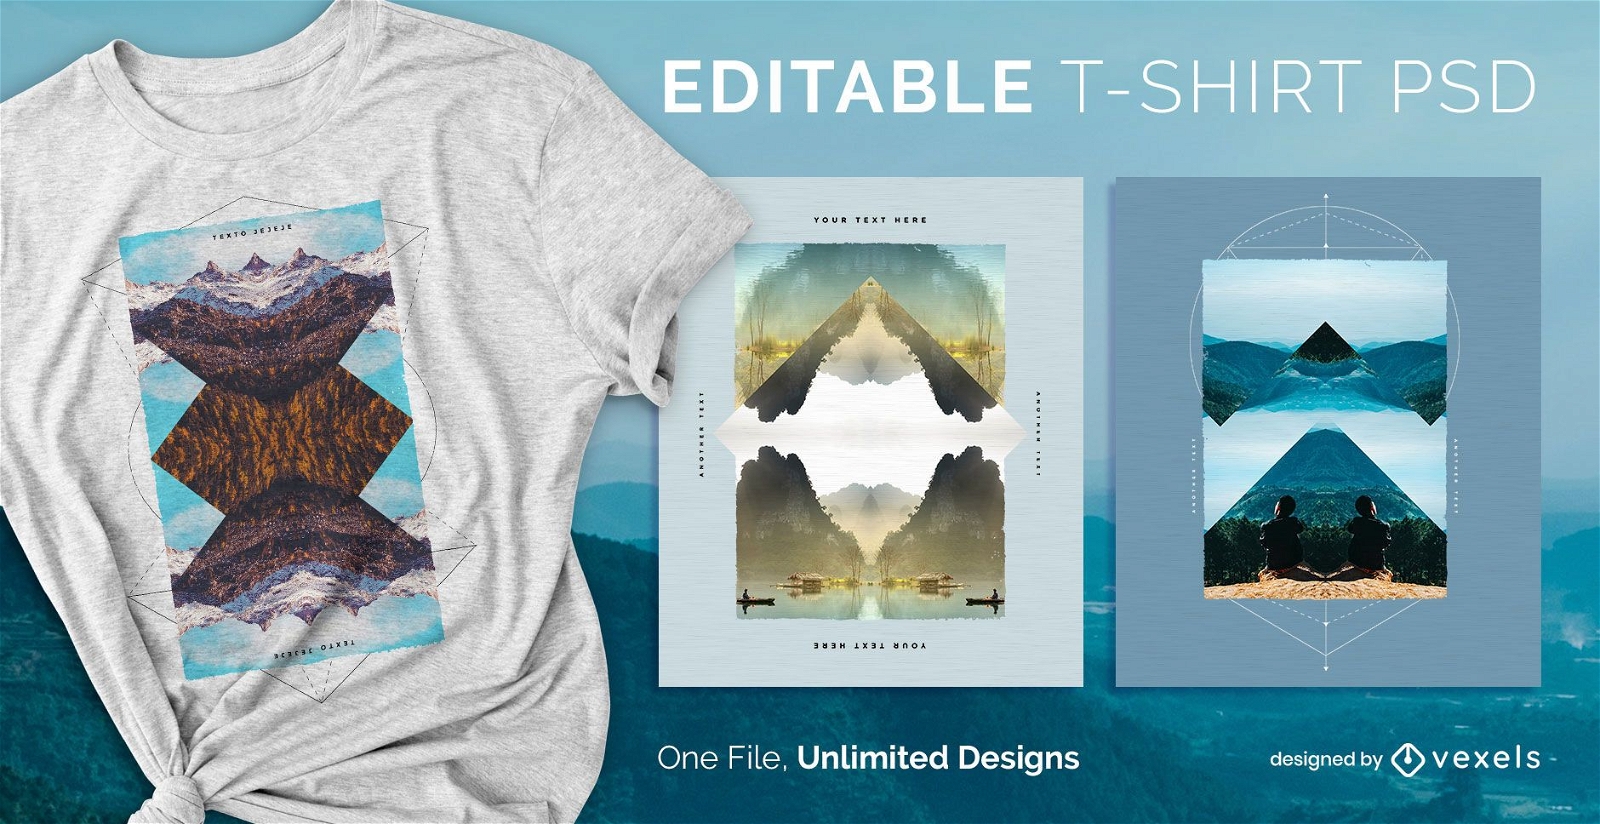
Camiseta PSD escalável
para Merch
Mirror t-shirt design psd
Escolha uma pasta
Todos os favoritos
Criar novo
Salvar
Mirror t-shirt design psd
Camiseta PSD escalável
para Merch
Camiseta PSD escalável amorfa
Escolha uma pasta
Todos os favoritos
Criar novo
Salvar
Camiseta PSD escalável amorfa
Pronto para imprimir
para Merch
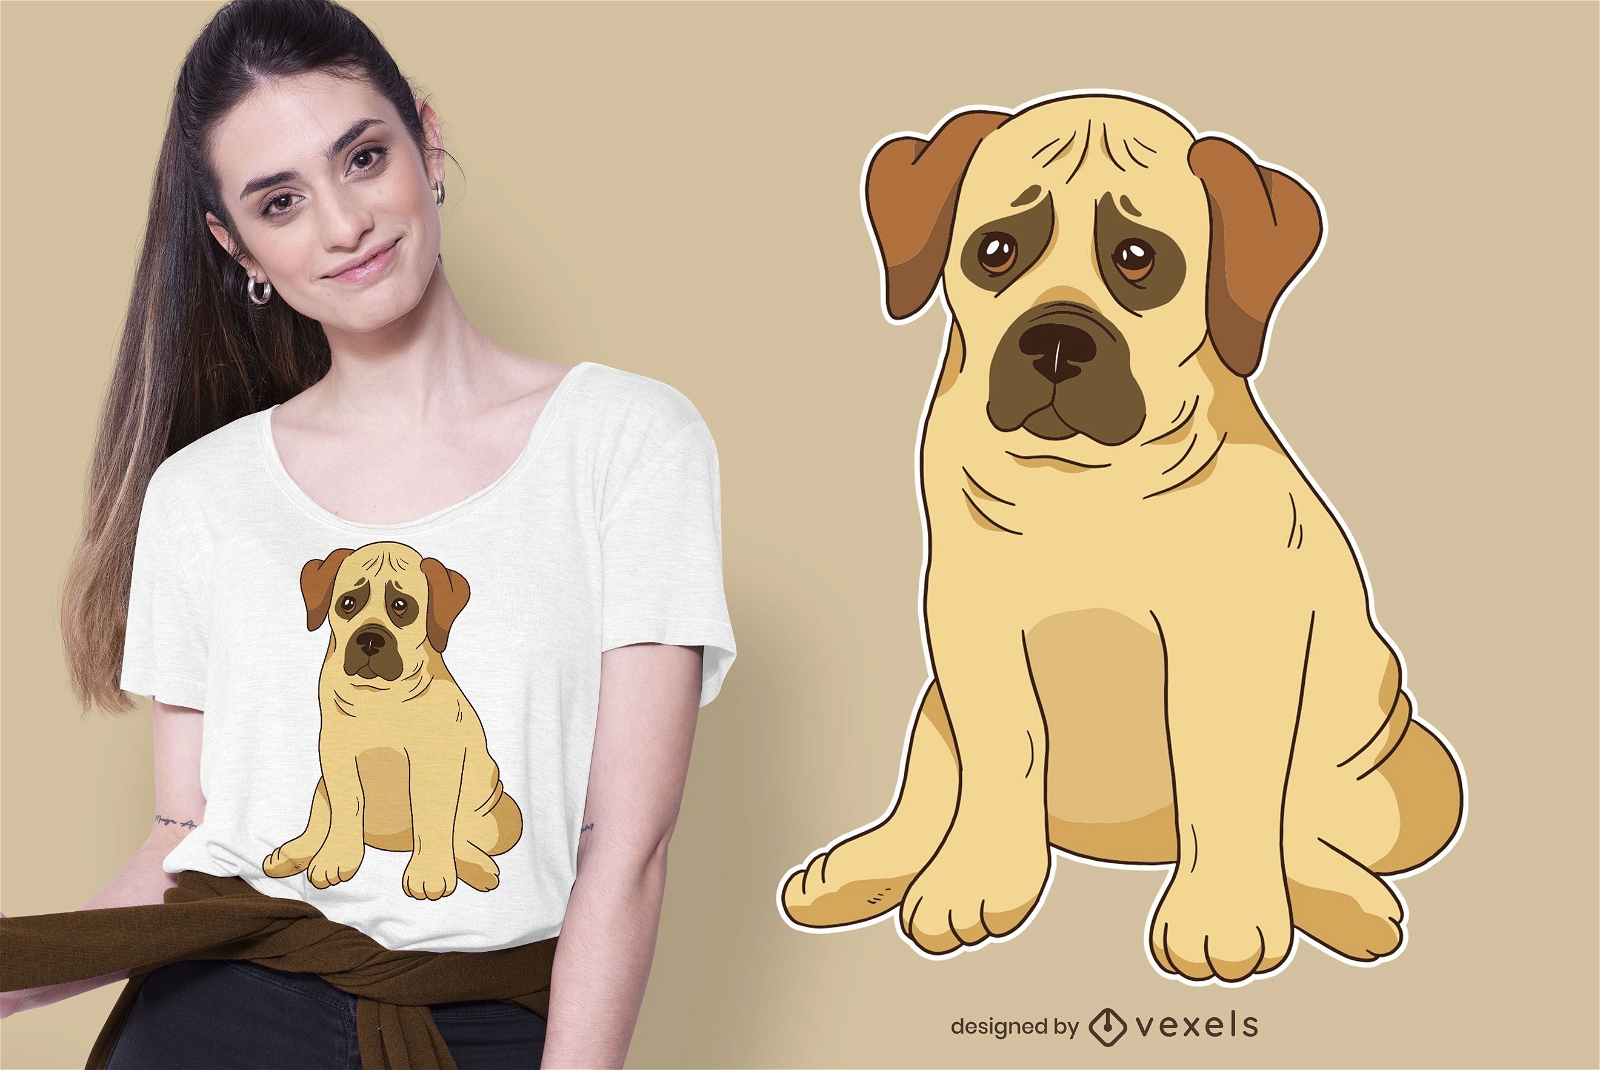
Design de t-shirt Boerboel Puppy Dog
Escolha uma pasta
Todos os favoritos
Criar novo
Salvar
Design de t-shirt Boerboel Puppy Dog
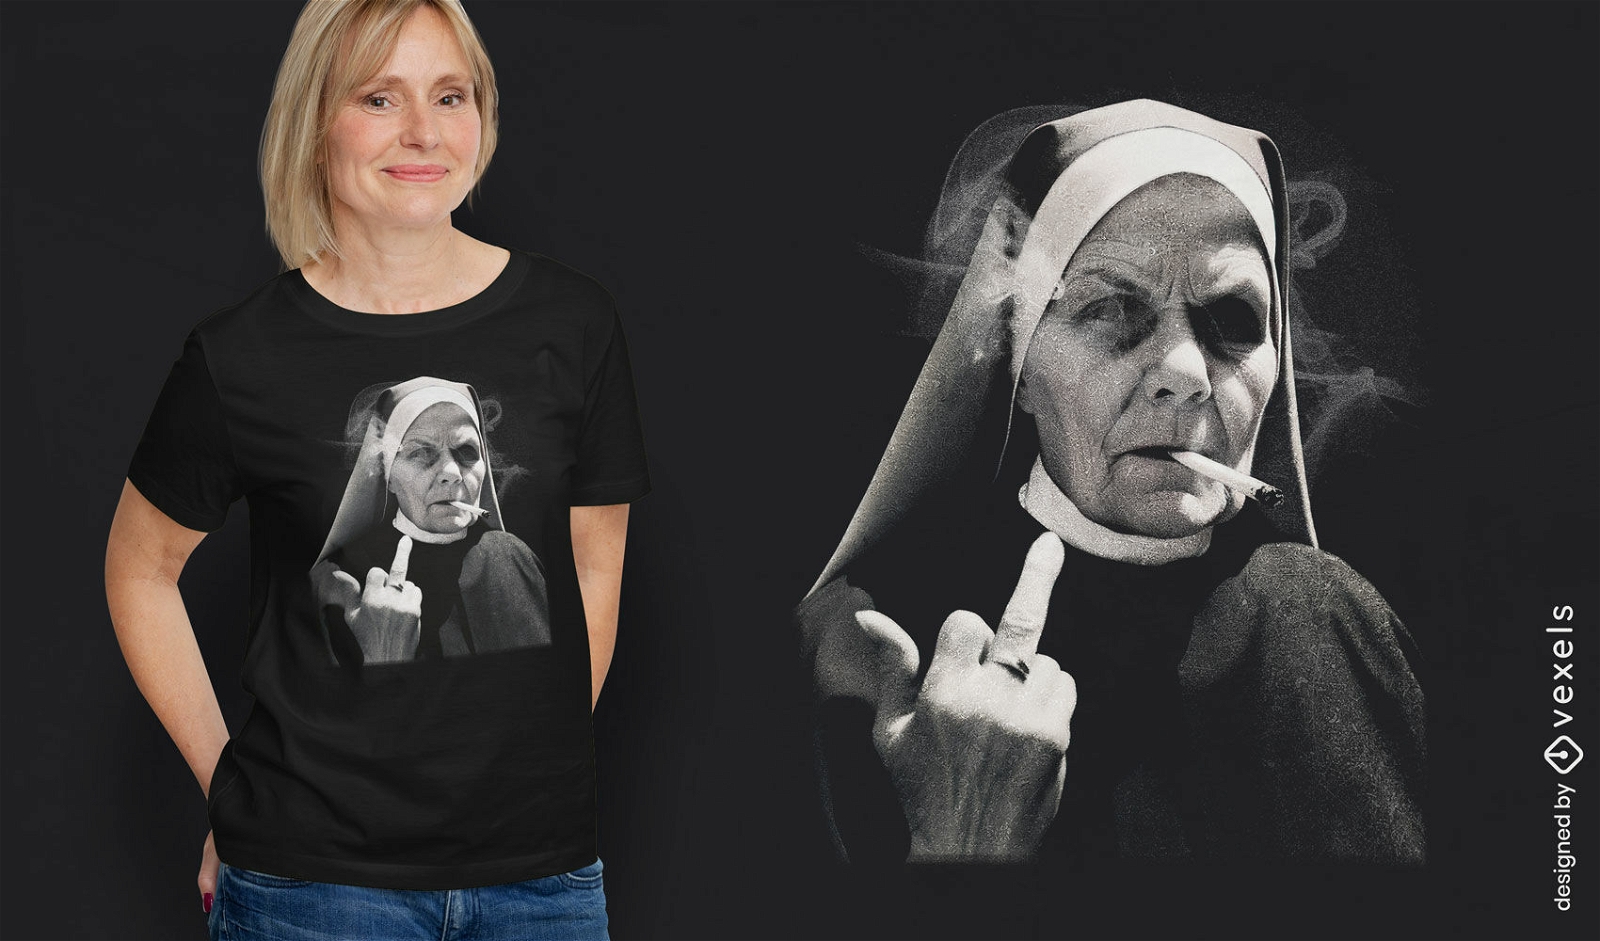
Gerado por IA, selecionado por nossos designers.
para Merch
Design de camiseta de freira rebelde
Escolha uma pasta
Todos os favoritos
Criar novo
Salvar
Design de camiseta de freira rebelde
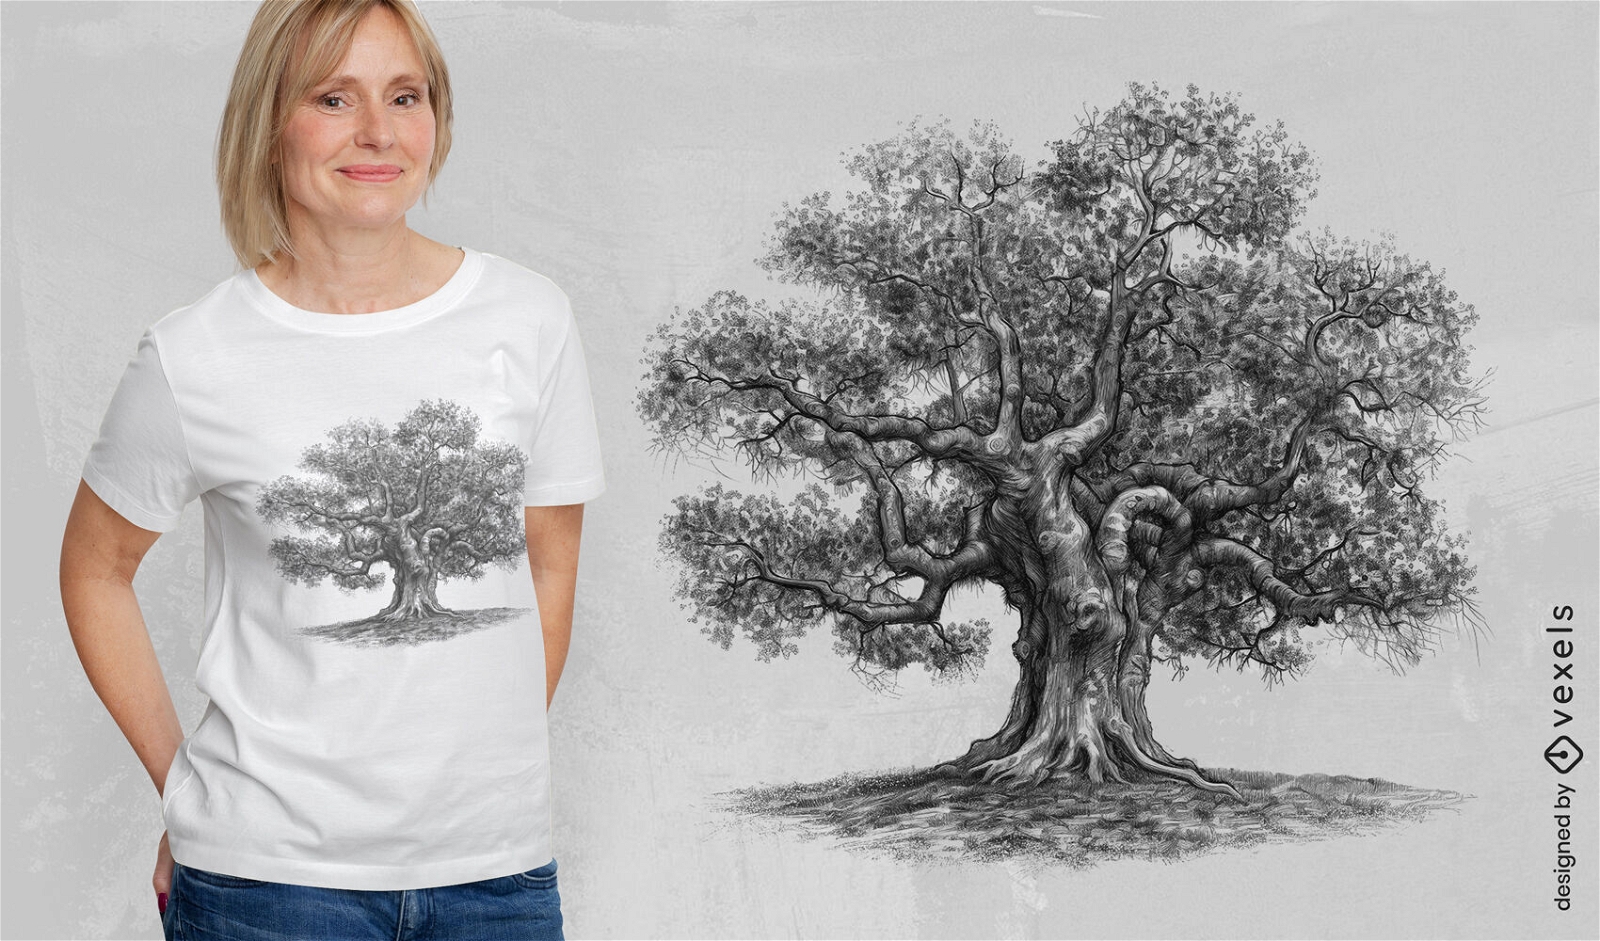
Gerado por IA, selecionado por nossos designers.
para Merch
Design de camiseta com desenho de carvalho
Escolha uma pasta
Todos os favoritos
Criar novo
Salvar
Design de camiseta com desenho de carvalho
Pronto para imprimir
para Merch
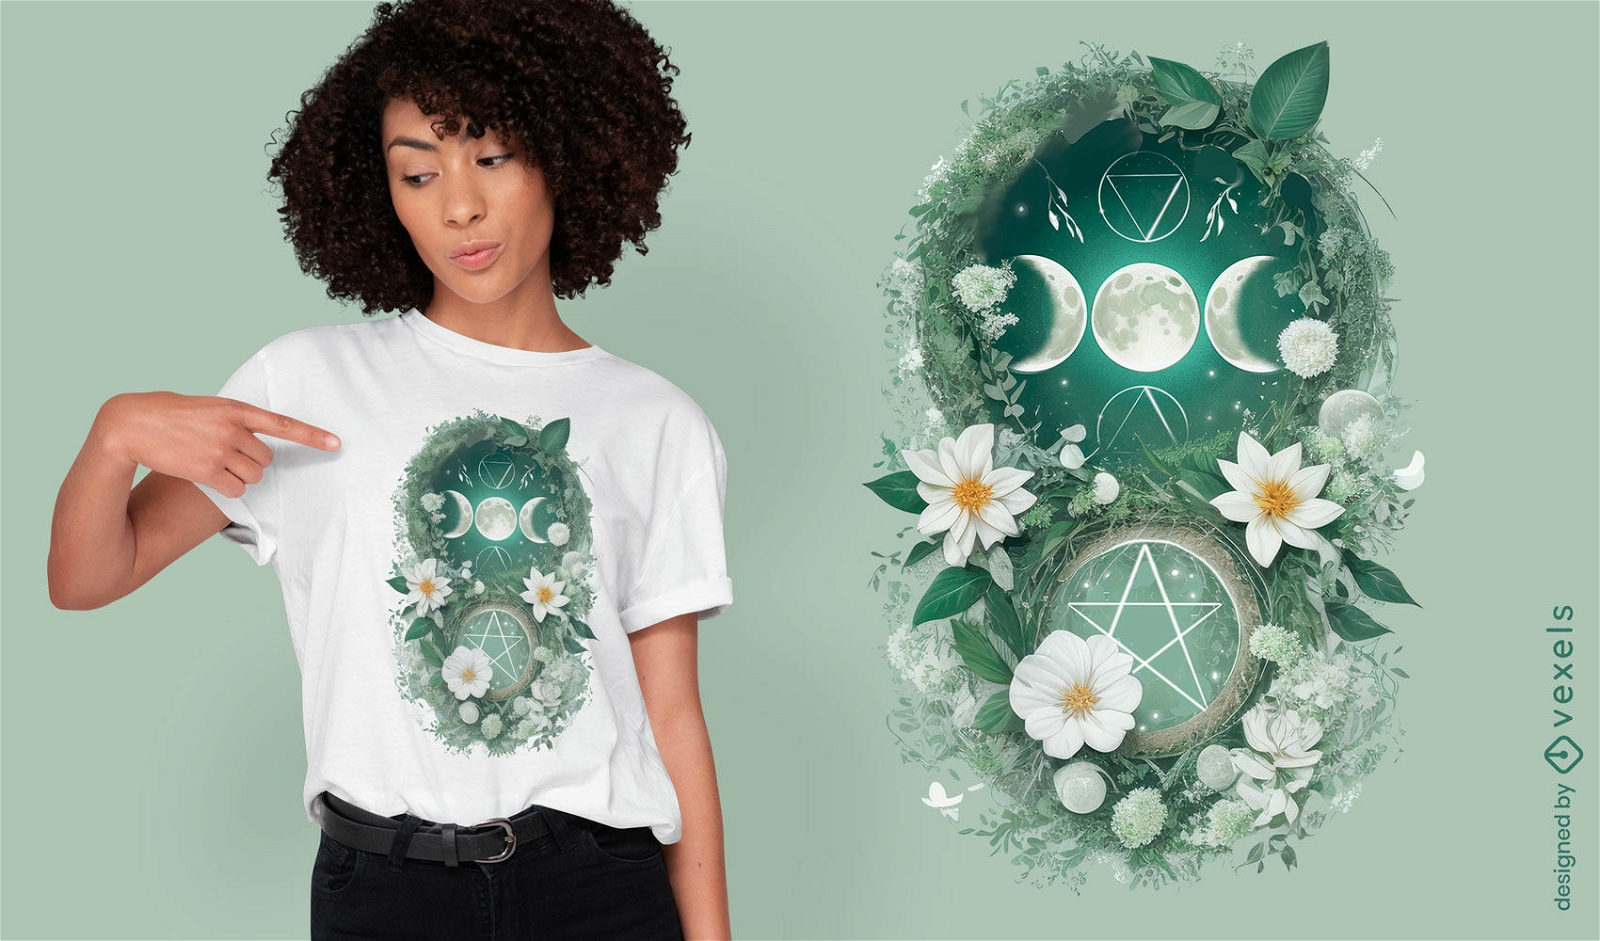
Design de camiseta com lua e flores
Escolha uma pasta
Todos os favoritos
Criar novo
Salvar
Design de camiseta com lua e flores
texto editável
Pronto para imprimir
para Merch
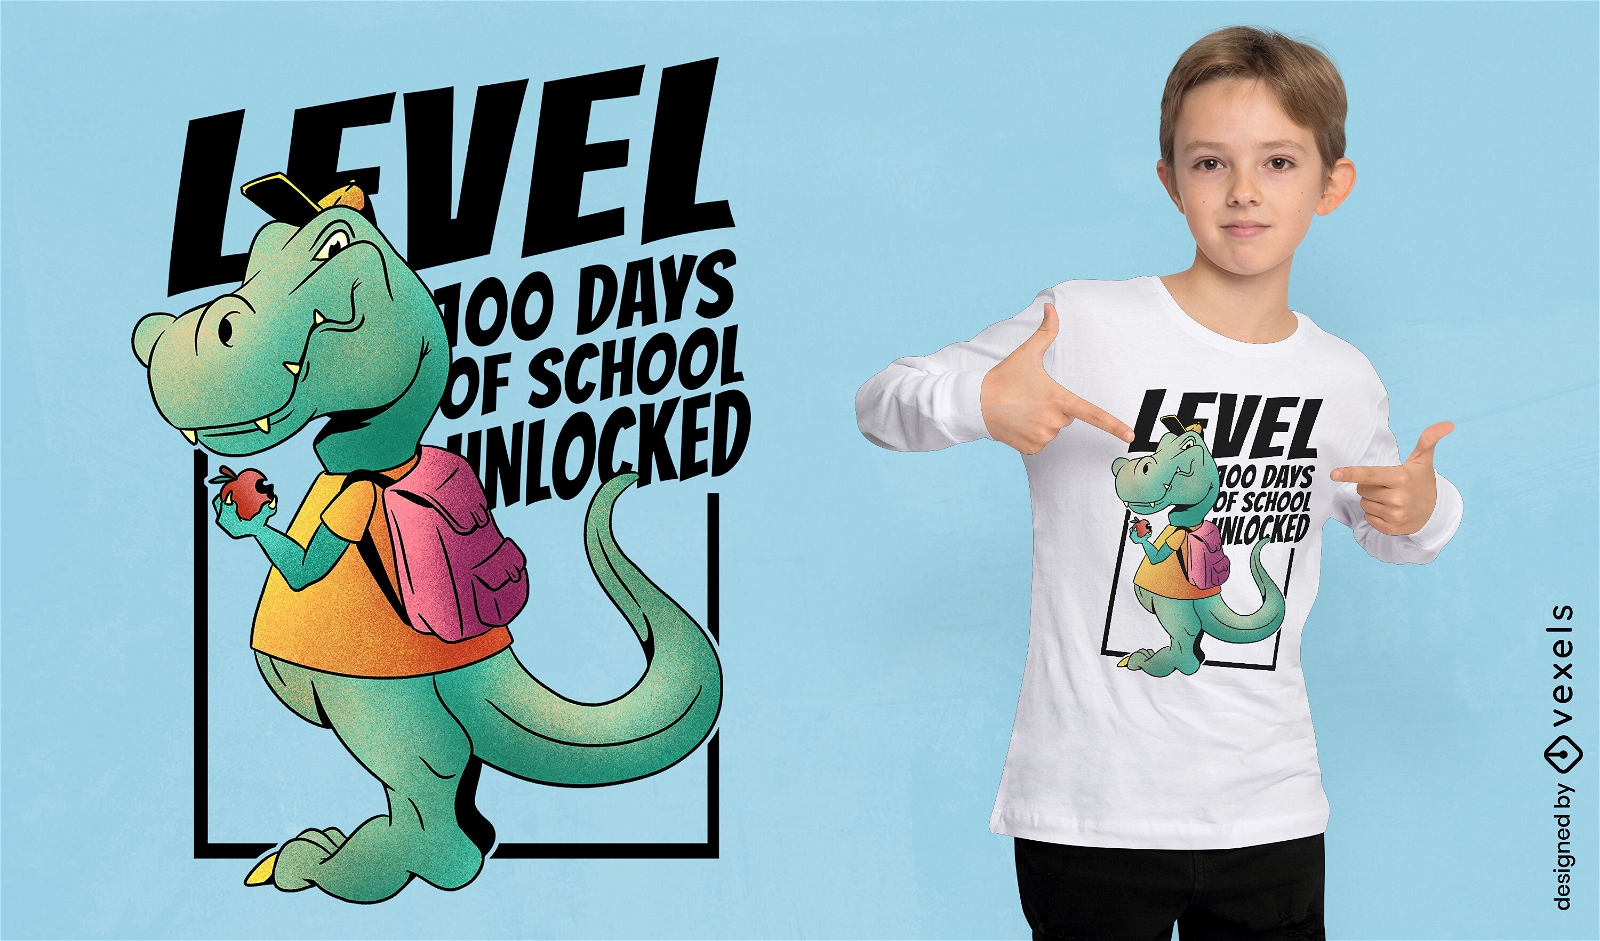
Dinossauro 100 dias de design de camiseta escolar
Escolha uma pasta
Todos os favoritos
Criar novo
Salvar
Dinossauro 100 dias de design de camiseta escolar
Pronto para imprimir
para Merch
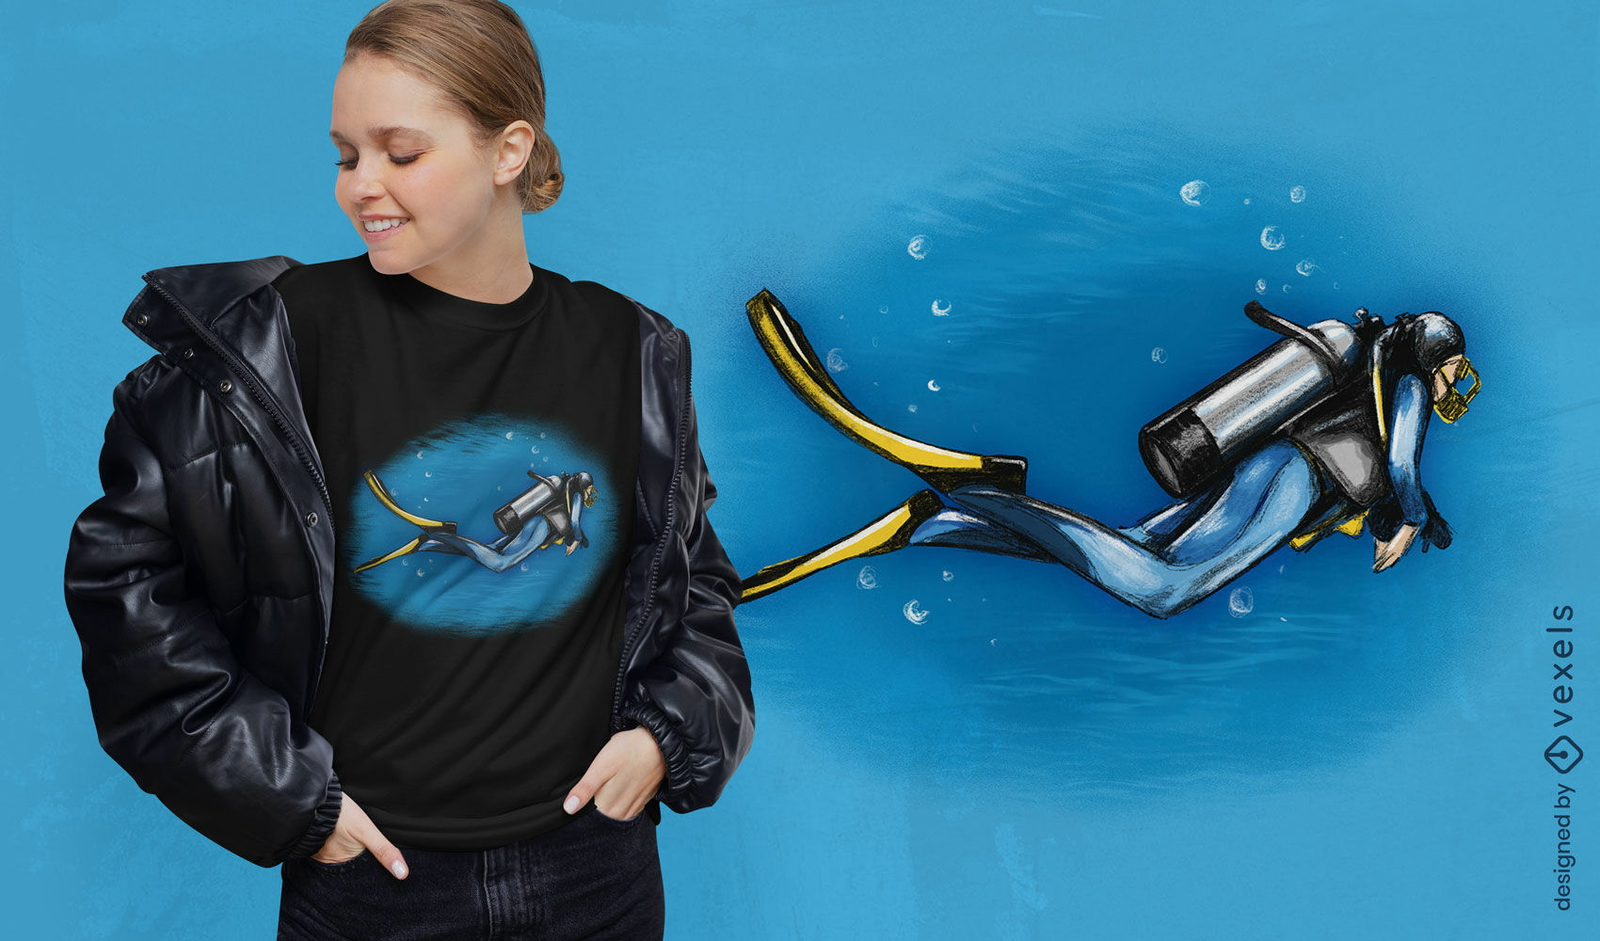
Design de camiseta de ilustração de mergulhador
Escolha uma pasta
Todos os favoritos
Criar novo
Salvar
Design de camiseta de ilustração de mergulhador
texto editável
Pronto para imprimir
para Merch
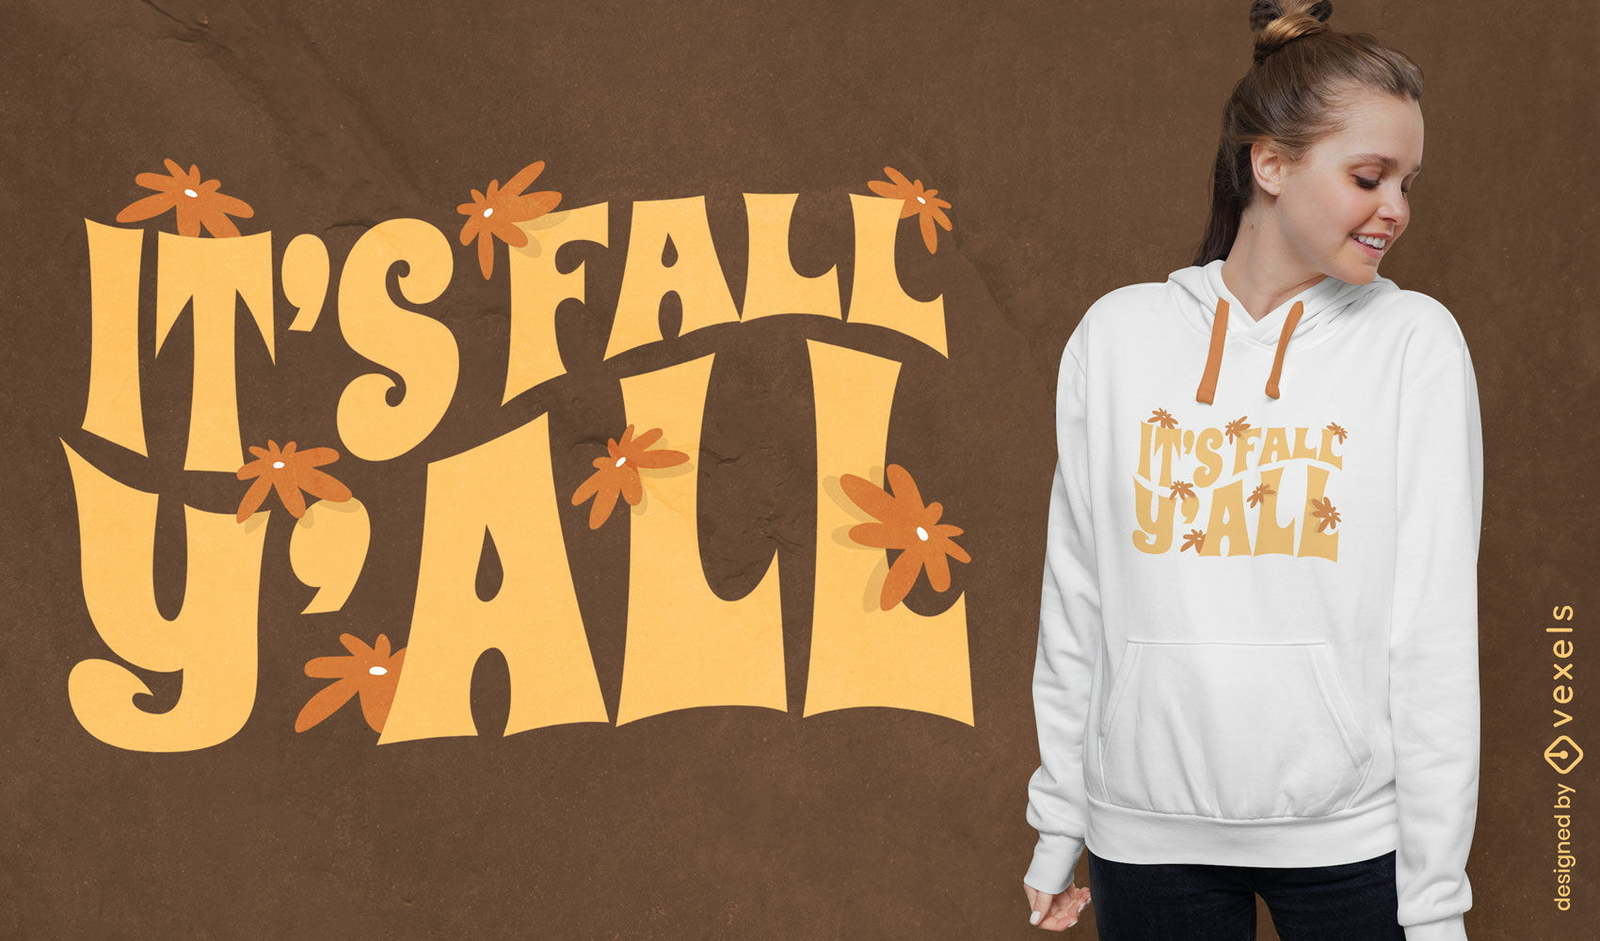
Design de t-shirt Groovy com citações da temporada de outono
Escolha uma pasta
Todos os favoritos
Criar novo
Salvar
Design de t-shirt Groovy com citações da temporada de outono
texto editável
Pronto para imprimir
para Merch
Design de camiseta psd de urso pardo
Escolha uma pasta
Todos os favoritos
Criar novo
Salvar
Design de camiseta psd de urso pardo
Pronto para imprimir
para Merch
Design de camiseta de lua e estrelas pastel
Escolha uma pasta
Todos os favoritos
Criar novo
Salvar
Design de camiseta de lua e estrelas pastel
texto editável
Pronto para imprimir
para Merch
Celebração de ano novo com camiseta de fogos de artifício psd
Escolha uma pasta
Todos os favoritos
Criar novo
Salvar
Celebração de ano novo com camiseta de fogos de artifício psd
texto editável
Pronto para imprimir
para Merch
Design de camiseta de cobra de bola de banana
Escolha uma pasta
Todos os favoritos
Criar novo
Salvar
Design de camiseta de cobra de bola de banana
texto editável
Pronto para imprimir
para Merch
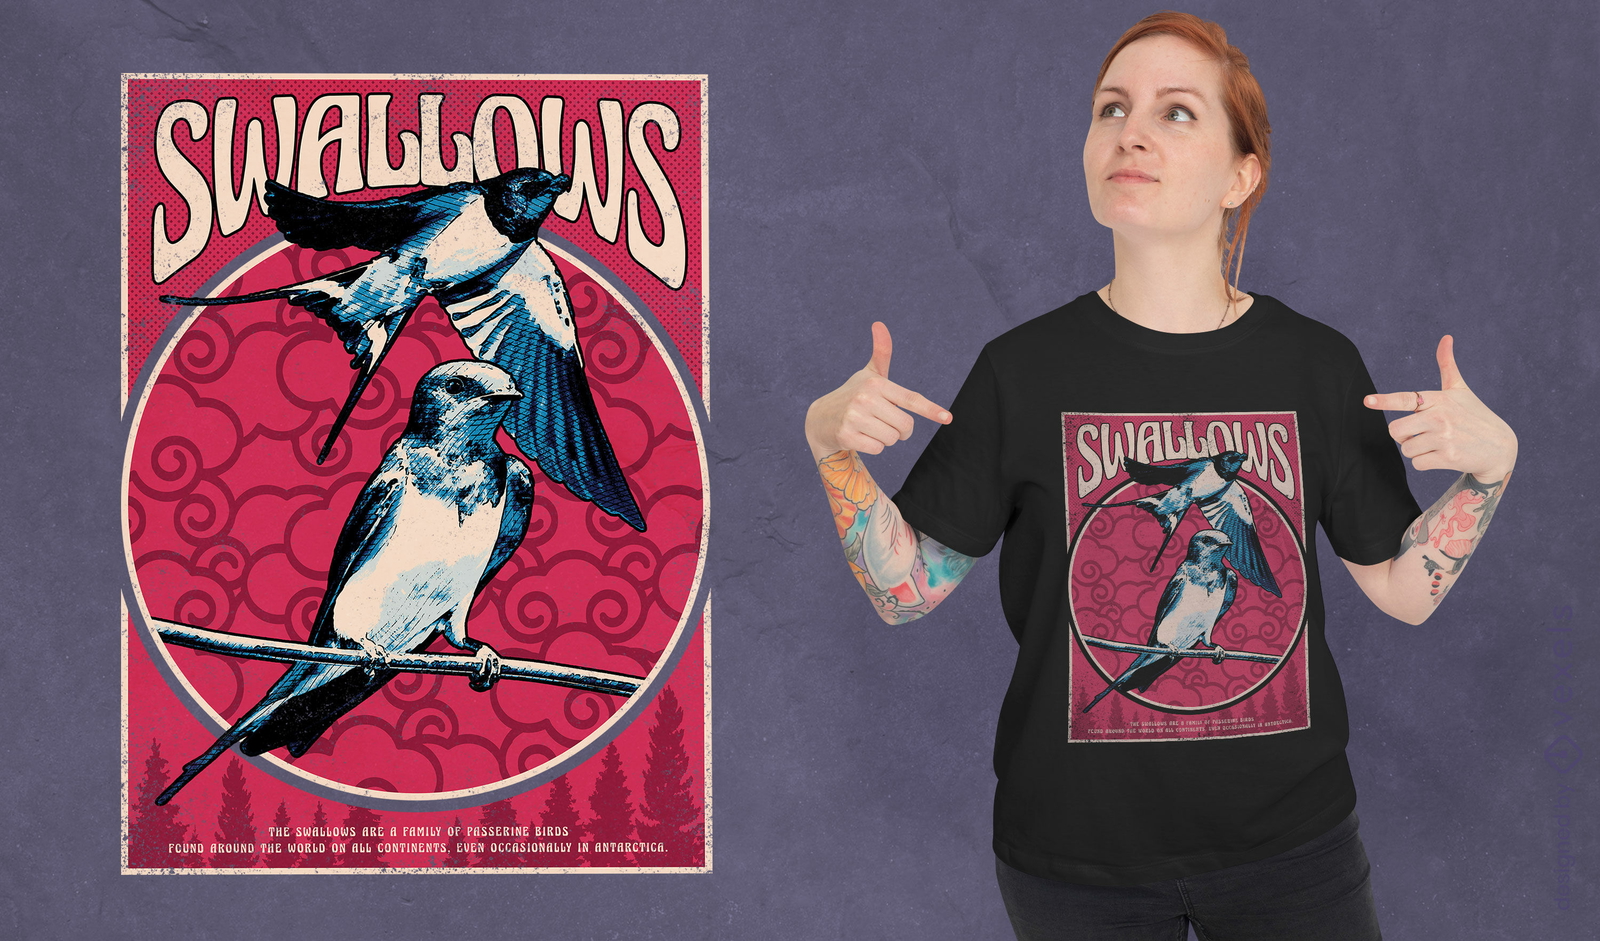
Design de camiseta de pássaros de andorinha
Escolha uma pasta
Todos os favoritos
Criar novo
Salvar
Design de camiseta de pássaros de andorinha
texto editável
Pronto para imprimir
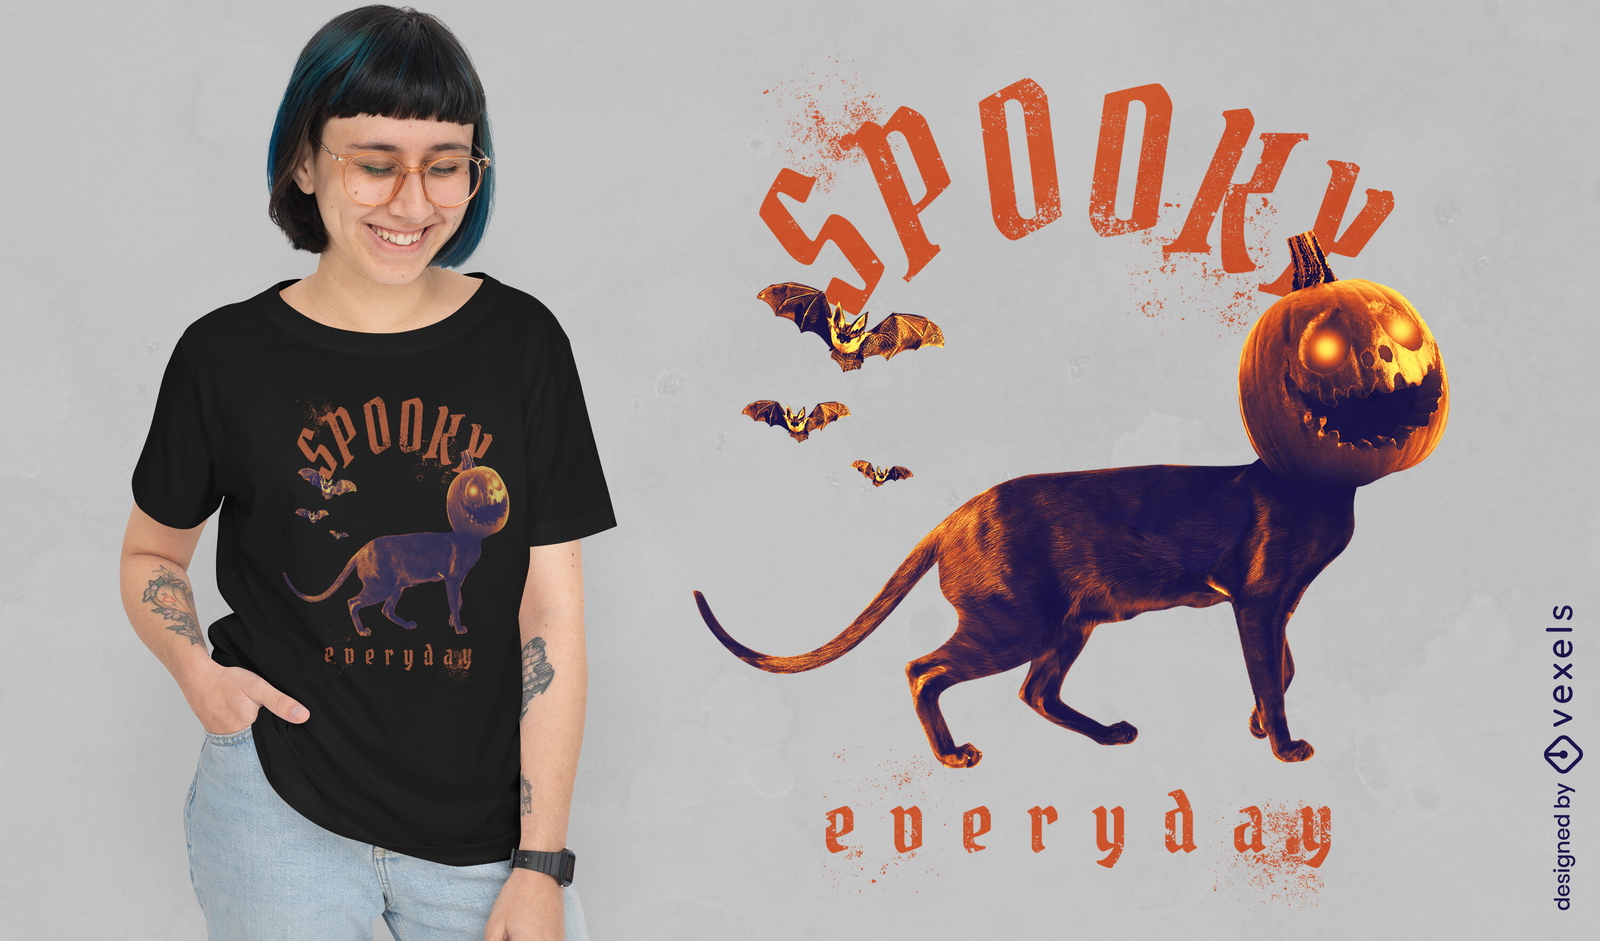
para Merch
T-shirt assustador de gato de abóbora psd
Escolha uma pasta
Todos os favoritos
Criar novo
Salvar
T-shirt assustador de gato de abóbora psd
Pronto para imprimir
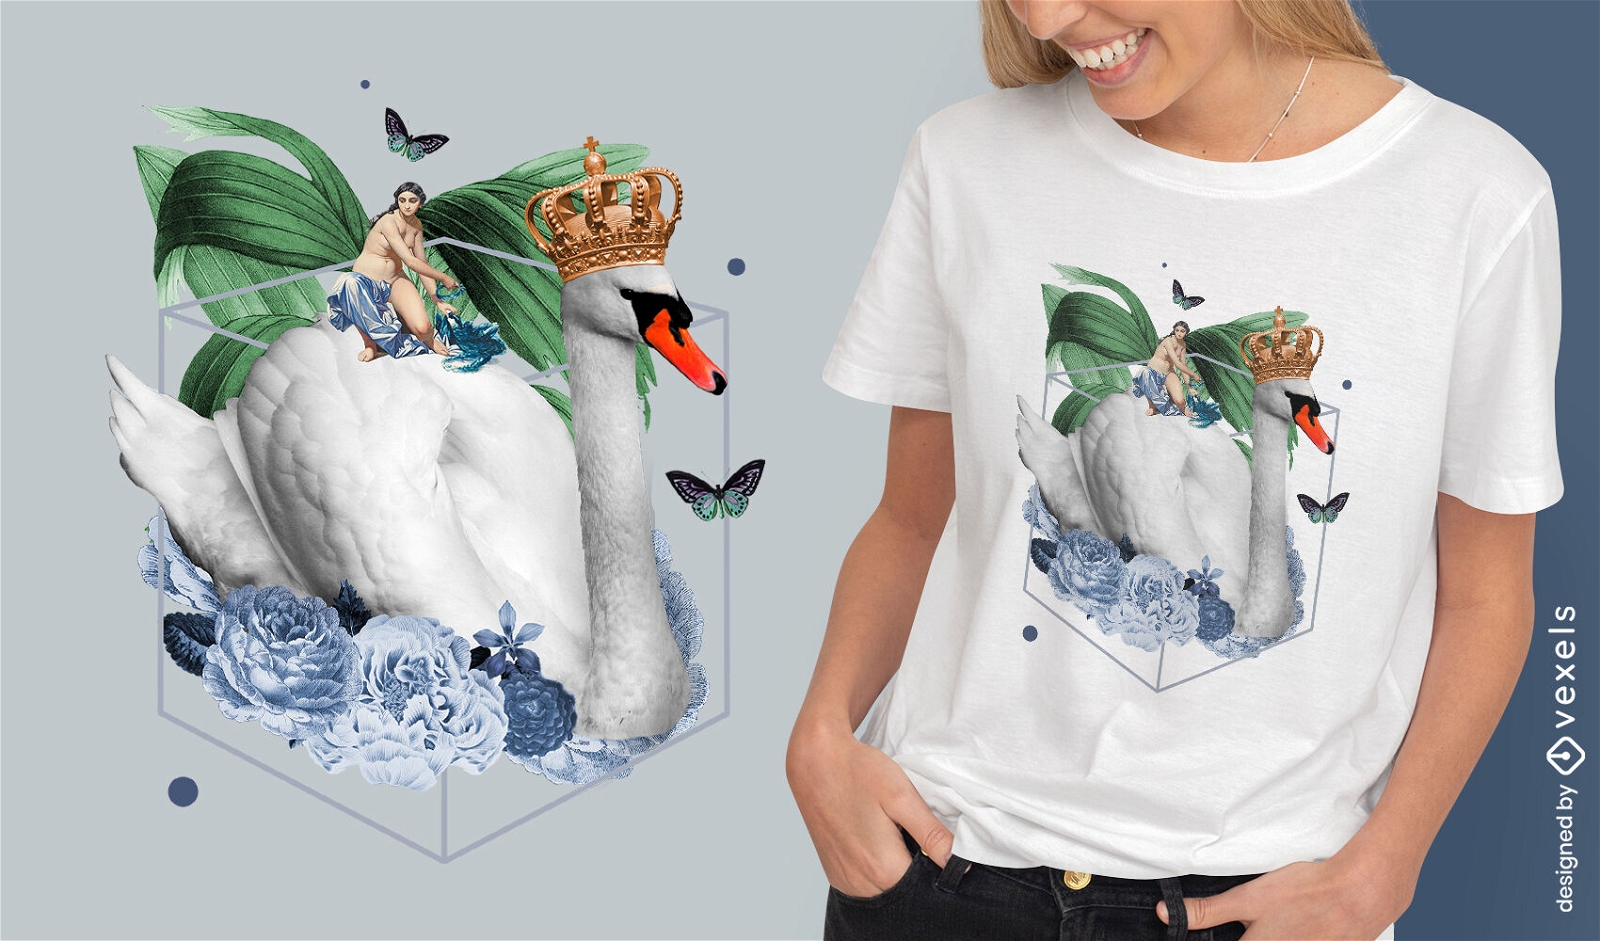
para Merch
Design de camiseta de natureza absurda do rei cisne
Escolha uma pasta
Todos os favoritos
Criar novo
Salvar
Design de camiseta de natureza absurda do rei cisne
Pronto para imprimir
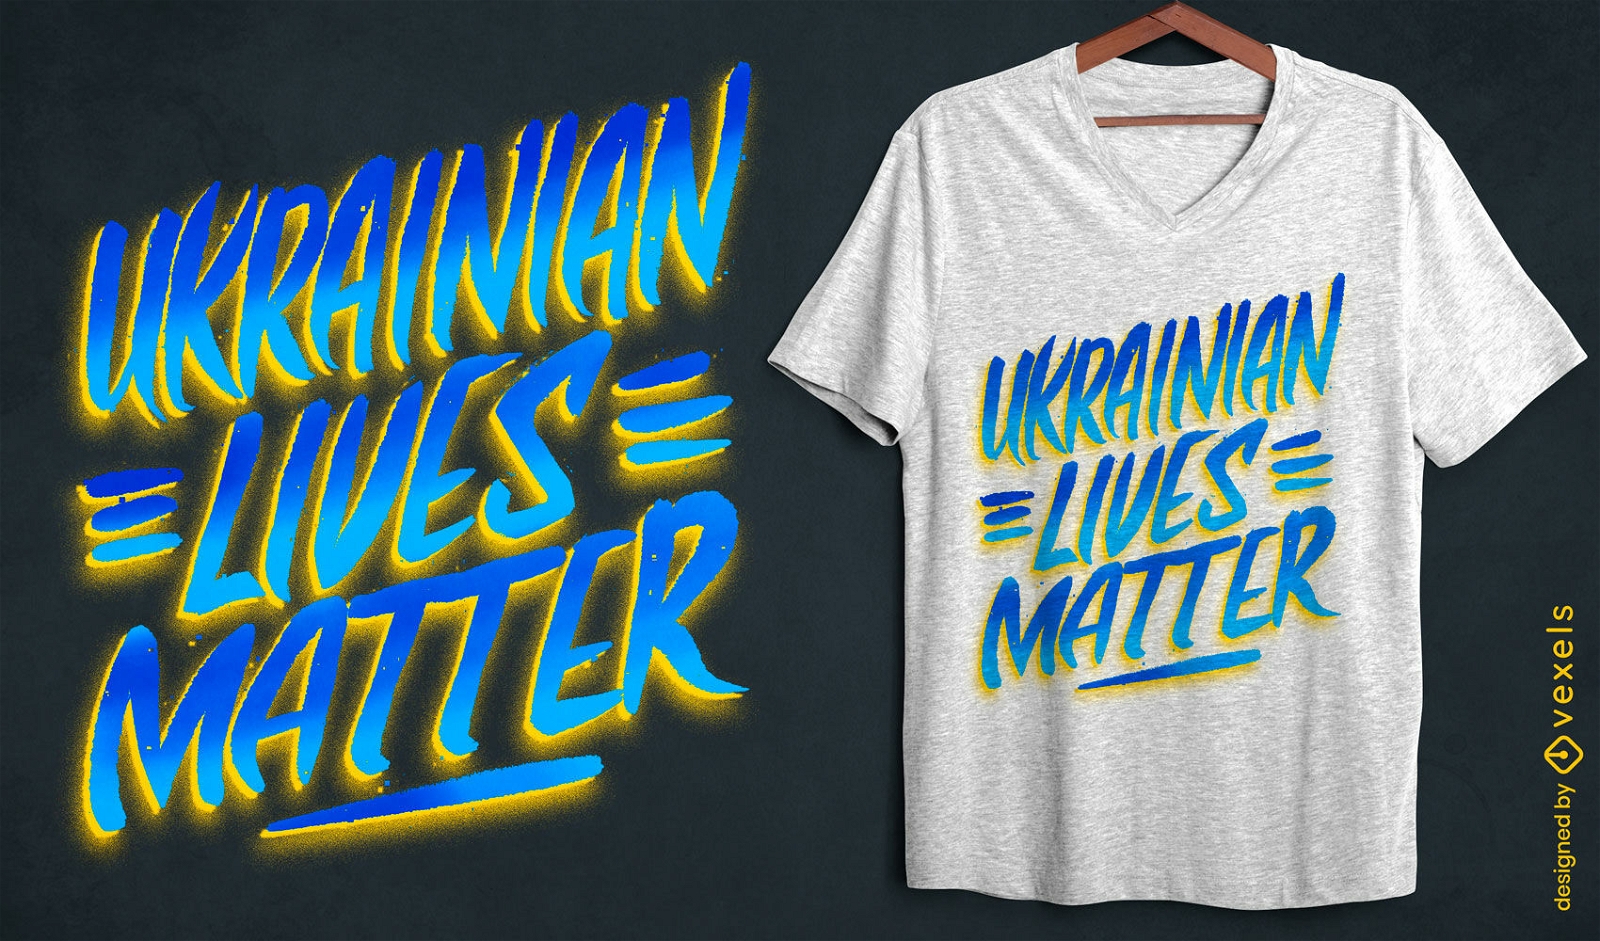
para Merch
Vidas ucranianas importam design de camiseta
Escolha uma pasta
Todos os favoritos
Criar novo
Salvar
Vidas ucranianas importam design de camiseta
Impulsione seu negócio
Com a plataforma gráfica líder de mercado.
Ver planos
Próxima
do 67
prev page
next page