Biblioteca de design
Novos designs Merch
Camisetas
Vectores
Designs de Merch de Tendência
PNGs & SVGs
Mockups
Modelos de T-Shirt PSD
Explorar Desenhos
Designs KDP
Pôsteres
Canecas
Capas para celular
Sacos de compras
Almofadas
Ferramentas de desenho
Merch Designer
Novo!
Mockup Generator
Gerador de Design de AI
Vetorizador
Quote Generator
T-Shirt Maker (Antigo)
Ajuda
Merch Digest
Blog
Centro de Ajuda
Saiba mais sobre o Merch
Feedback
Soluções Corporativas
Empresa
Acesso à API
Estúdio de Design
Design em Lote
Preços
Carregando...
Inscrever-se
Conecte-se
PSD Templates
graficos
Biblioteca de design
Novos designs Merch
Camisetas
Vectores
Designs de Merch de Tendência
PNGs & SVGs
Mockups
Modelos de T-Shirt PSD
Explorar Desenhos
Designs KDP
Pôsteres
Canecas
Capas para celular
Sacos de compras
Almofadas
Ferramentas de desenho
Merch Designer
Novo!
Mockup Generator
Gerador de Design de AI
Vetorizador
Quote Generator
T-Shirt Maker (Antigo)
Ajuda
Merch Digest
Blog
Centro de Ajuda
Saiba mais sobre o Merch
Feedback
Soluções Corporativas
Empresa
Acesso à API
Estúdio de Design
Design em Lote
PLANOS
PSD Templates
graficos
3312 Designs de Camisetas e Mockups PSD de graficos
Baixar designs de camisetas ou mockups PSD editáveis de graficos
Relacionado:
graficos vetoriais
,
desenhos graficos de ações
,
graficos tridimensionais
Ordenar por
Mais relevante
Resultados patrocinados da
Ganhe 15% de desconto com o código: VEXELS15
veja mais detalhes
texto editável
Pronto para imprimir
para Merch
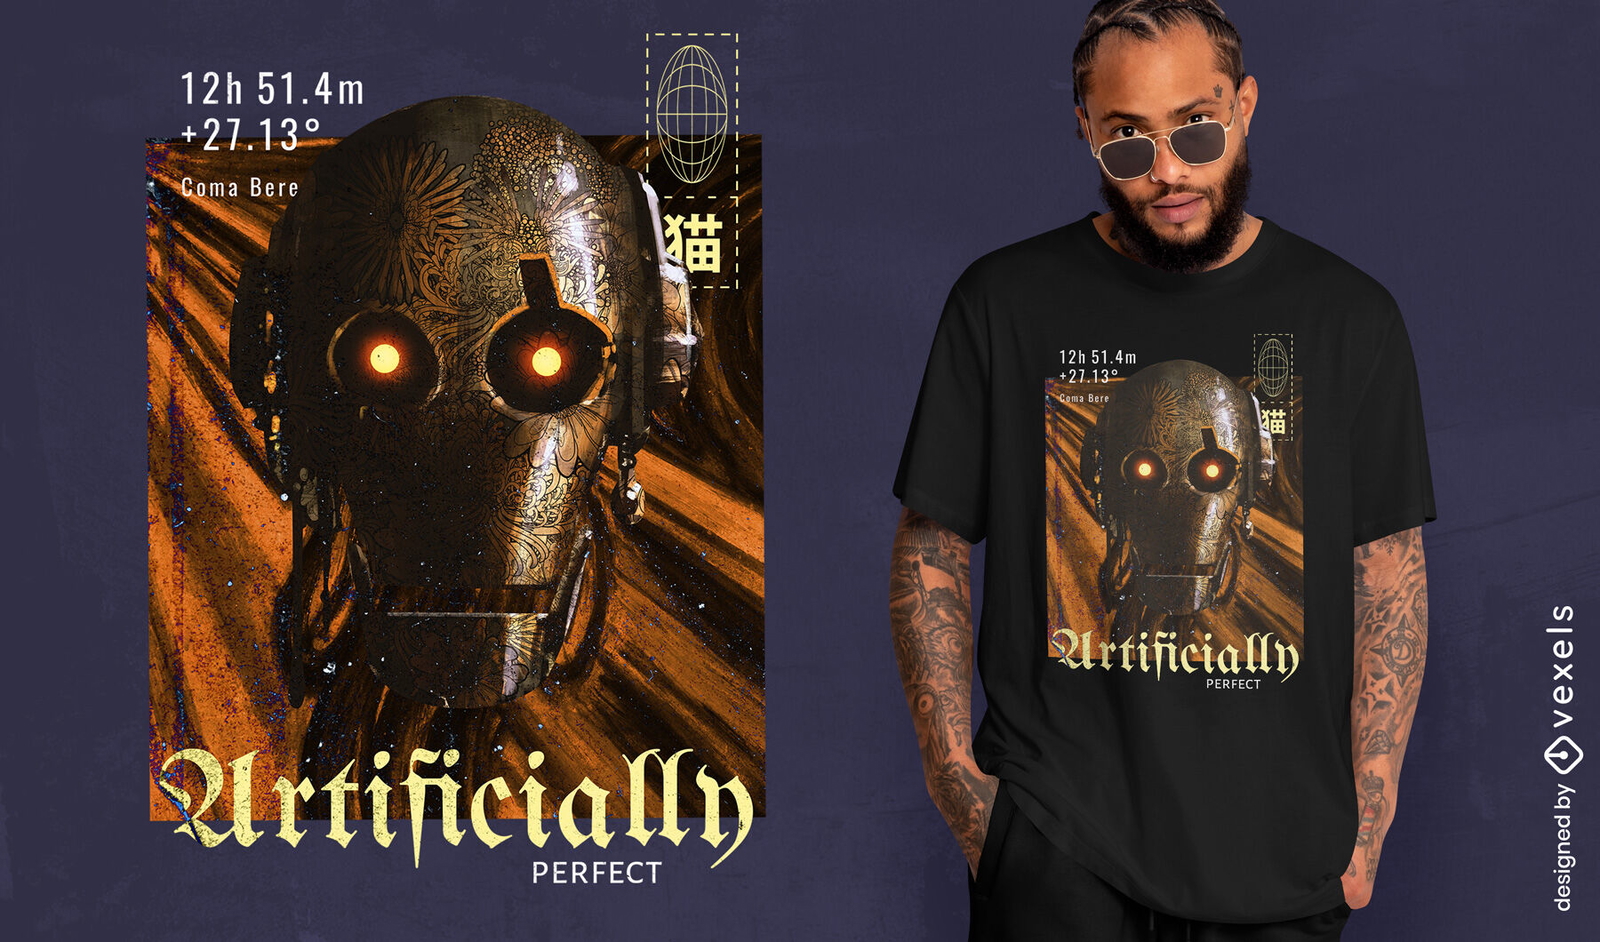
Robô de pintura de grito steampunk design de camiseta PSD
Escolha uma pasta
Todos os favoritos
Criar novo
Salvar
Robô de pintura de grito steampunk design de camiseta PSD
texto editável
para Merch
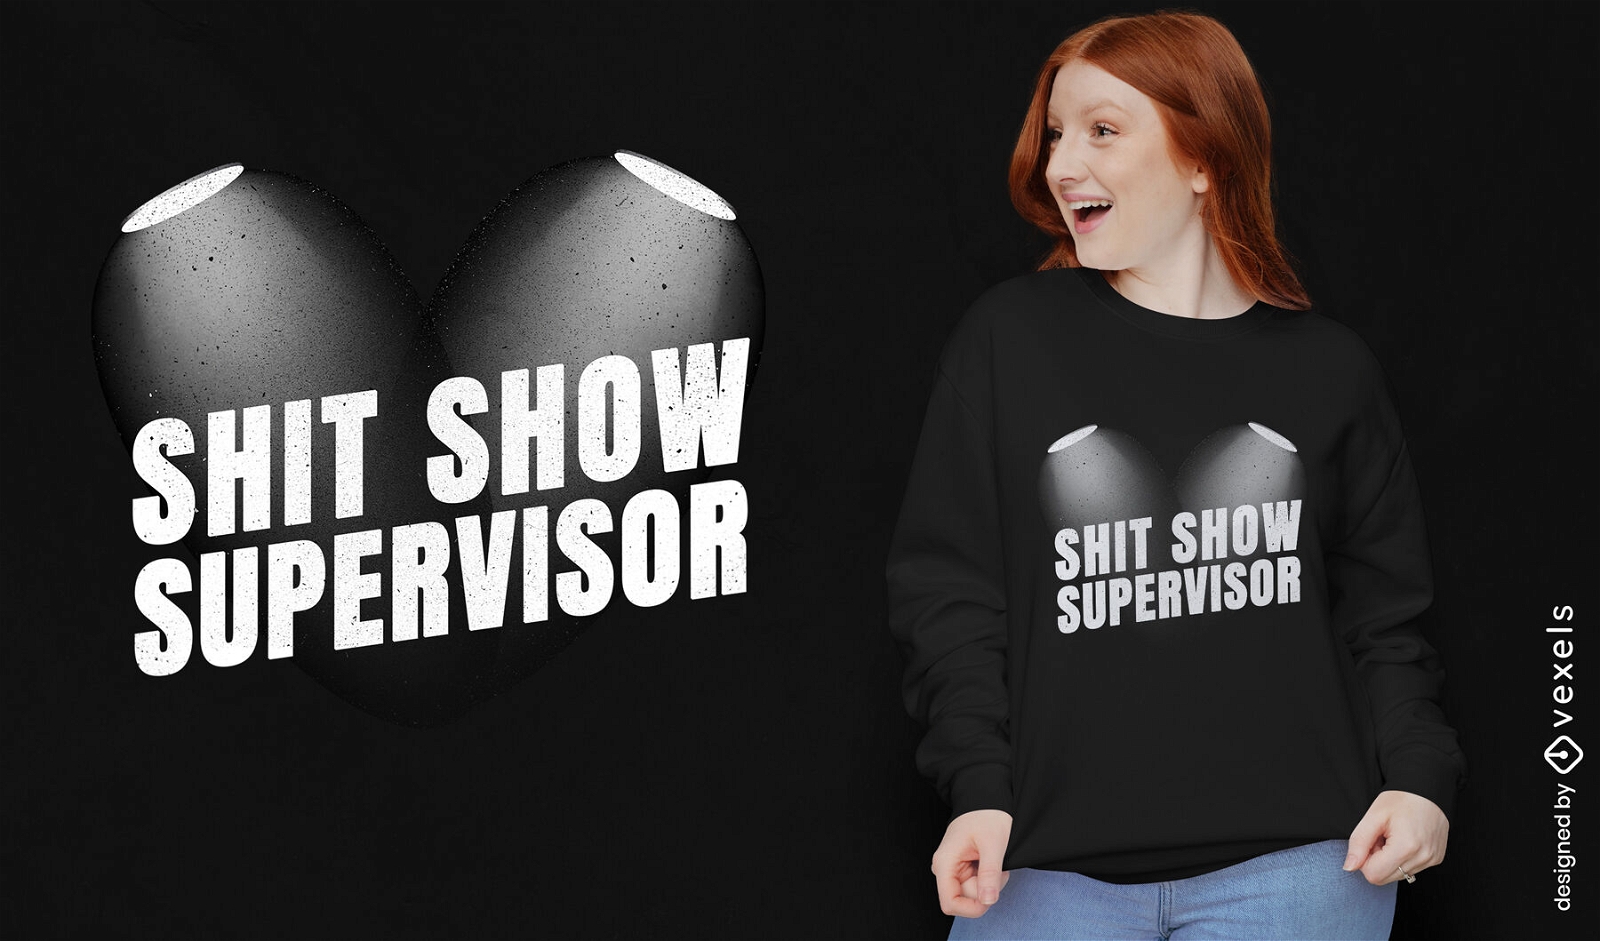
Design de camiseta de supervisor de show de merda
Escolha uma pasta
Todos os favoritos
Criar novo
Salvar
Design de camiseta de supervisor de show de merda
texto editável
Pronto para imprimir
para Merch
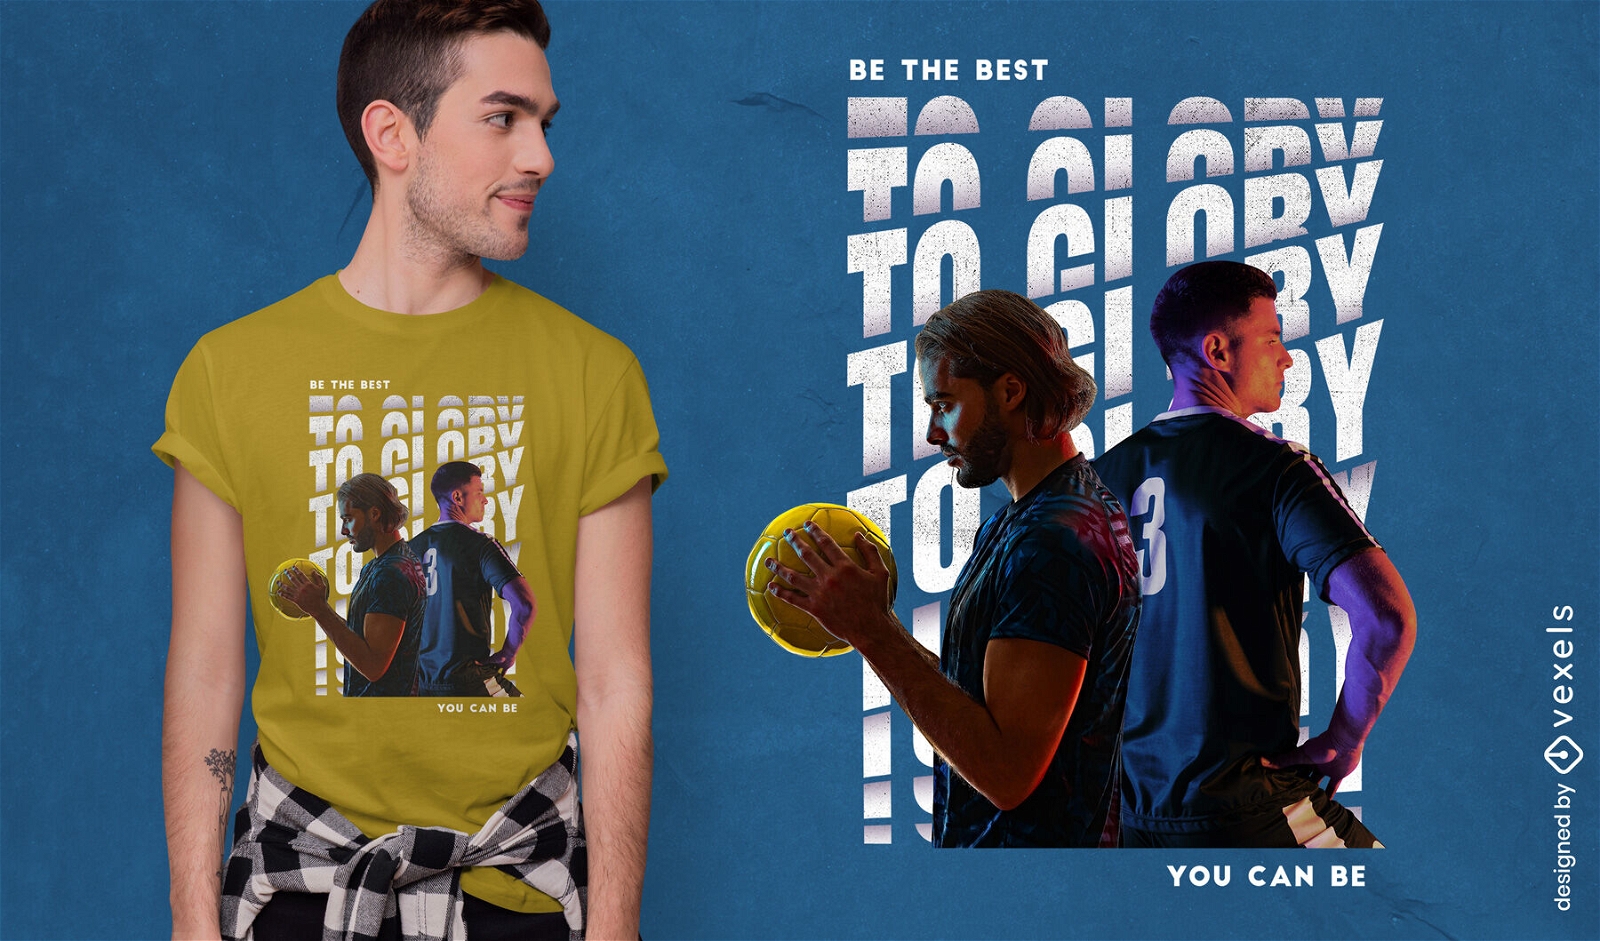
Design de camiseta psd de rivais de futebol
Escolha uma pasta
Todos os favoritos
Criar novo
Salvar
Design de camiseta psd de rivais de futebol
Pronto para imprimir
para Merch
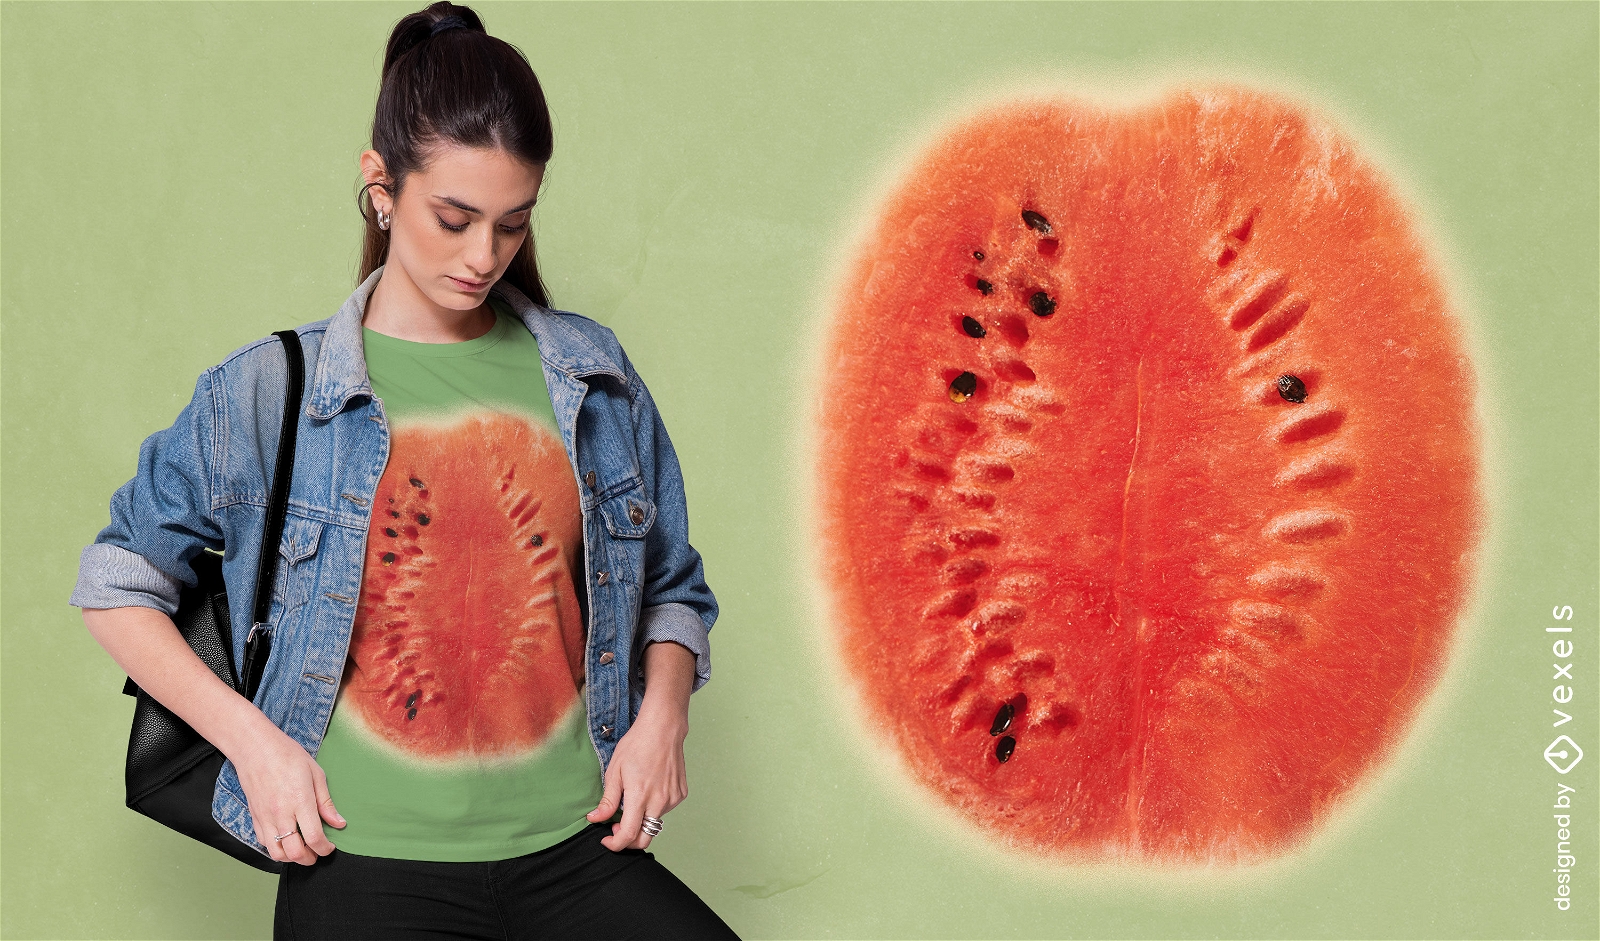
Camiseta de frutas melancia gigante psd
Escolha uma pasta
Todos os favoritos
Criar novo
Salvar
Camiseta de frutas melancia gigante psd
Pronto para imprimir
para Merch
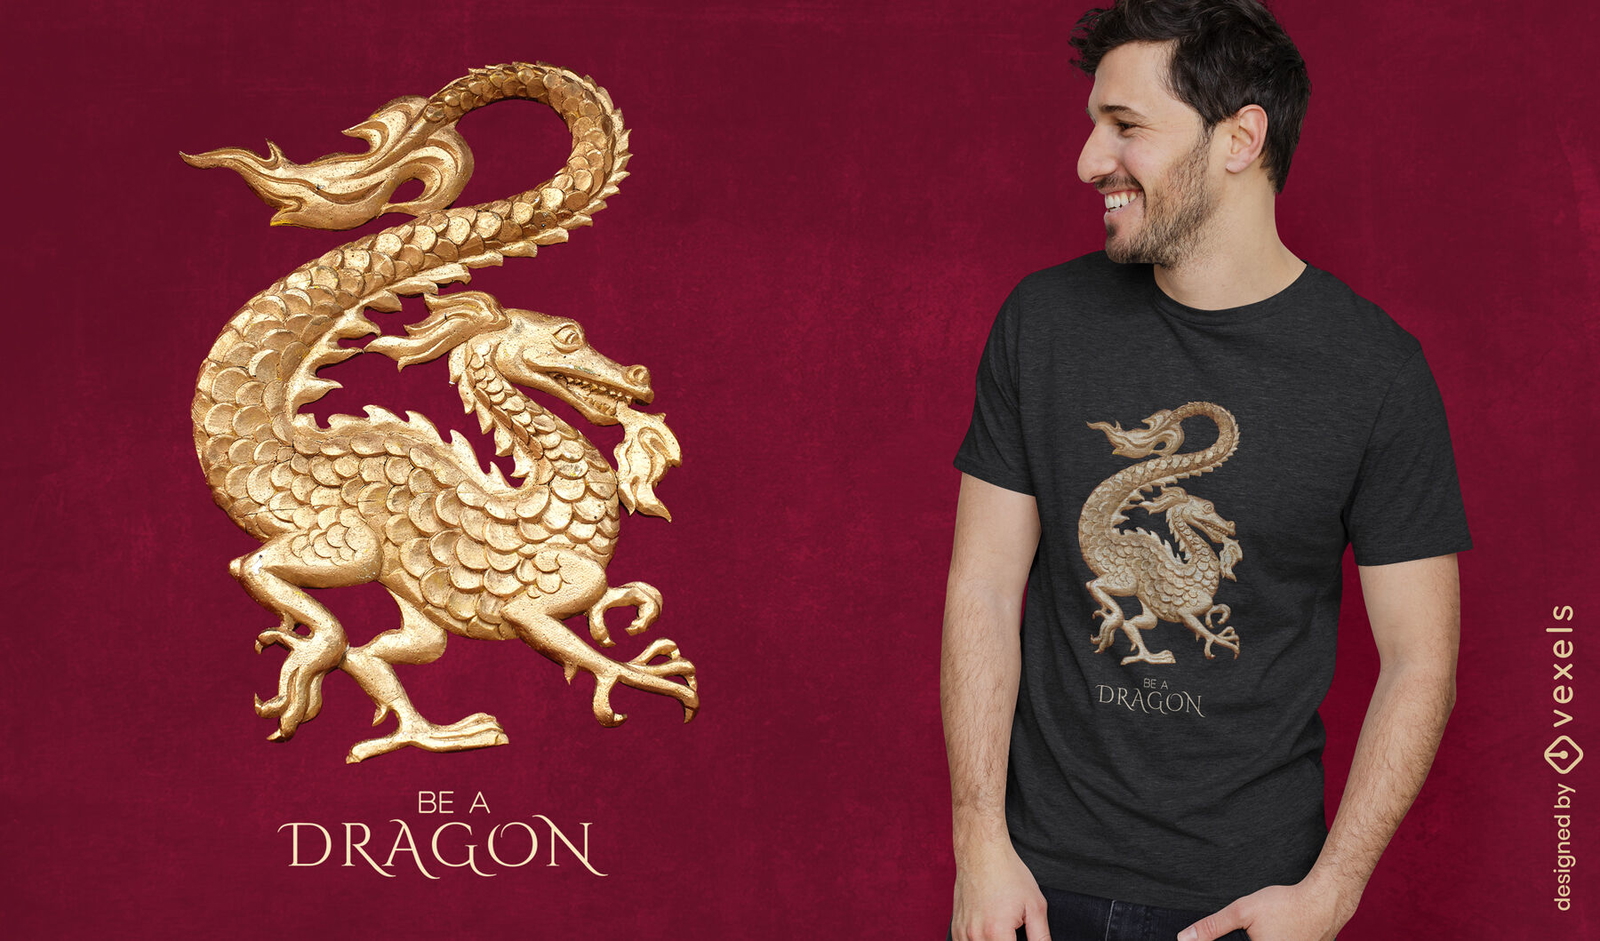
Design de camiseta de criatura de fantasia de dragão
Escolha uma pasta
Todos os favoritos
Criar novo
Salvar
Design de camiseta de criatura de fantasia de dragão
Pronto para imprimir
para Merch
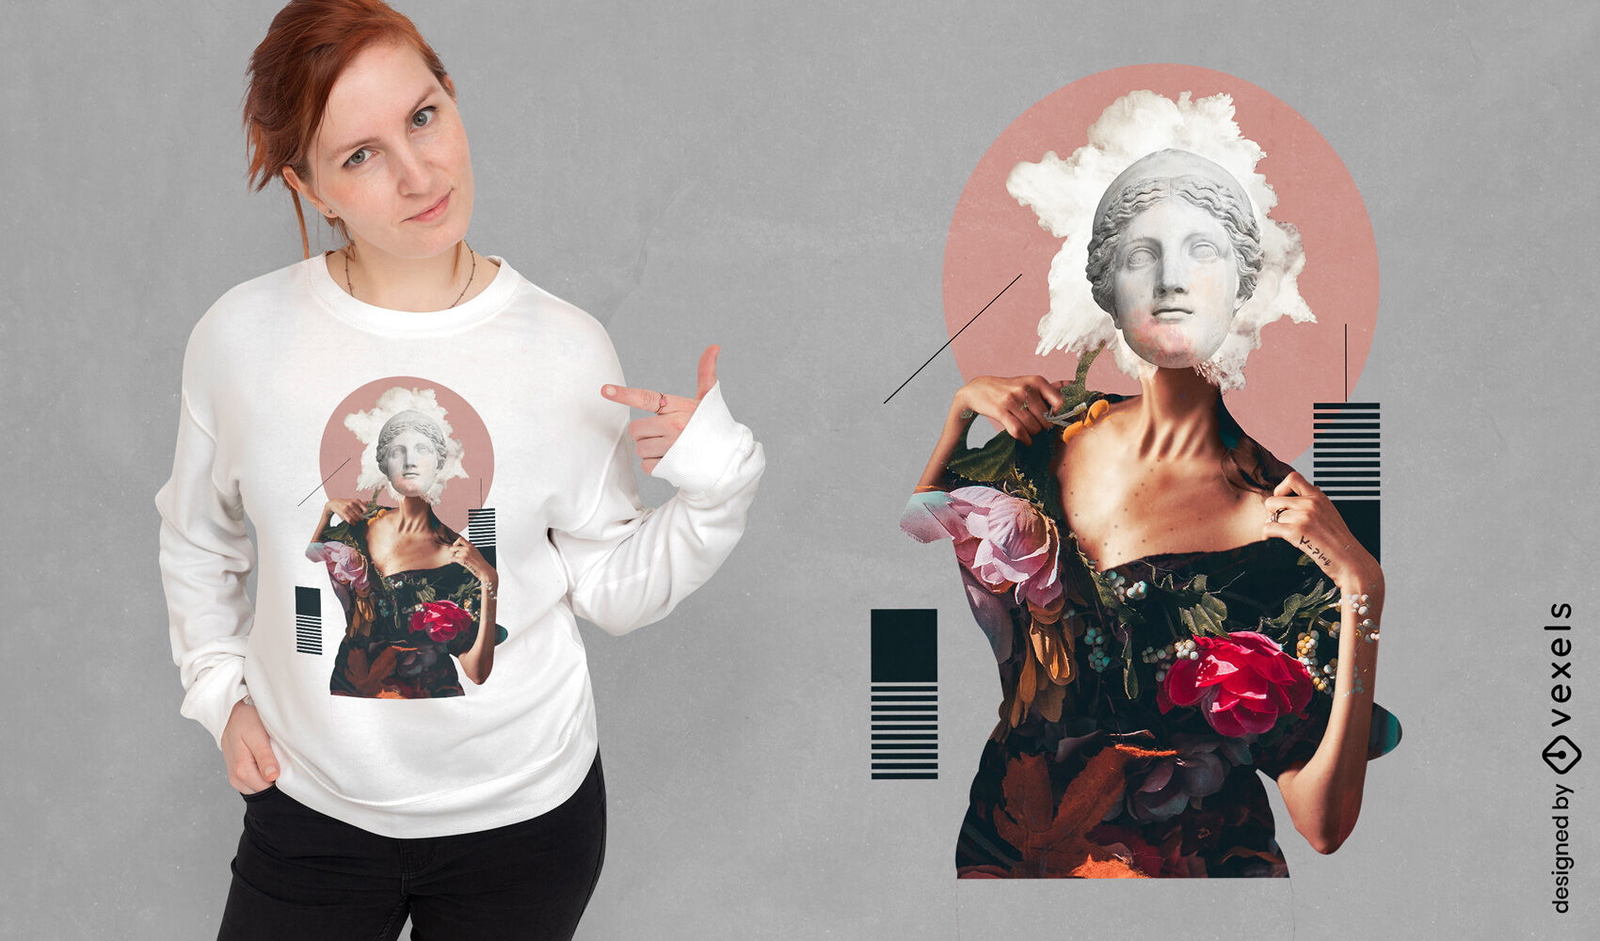
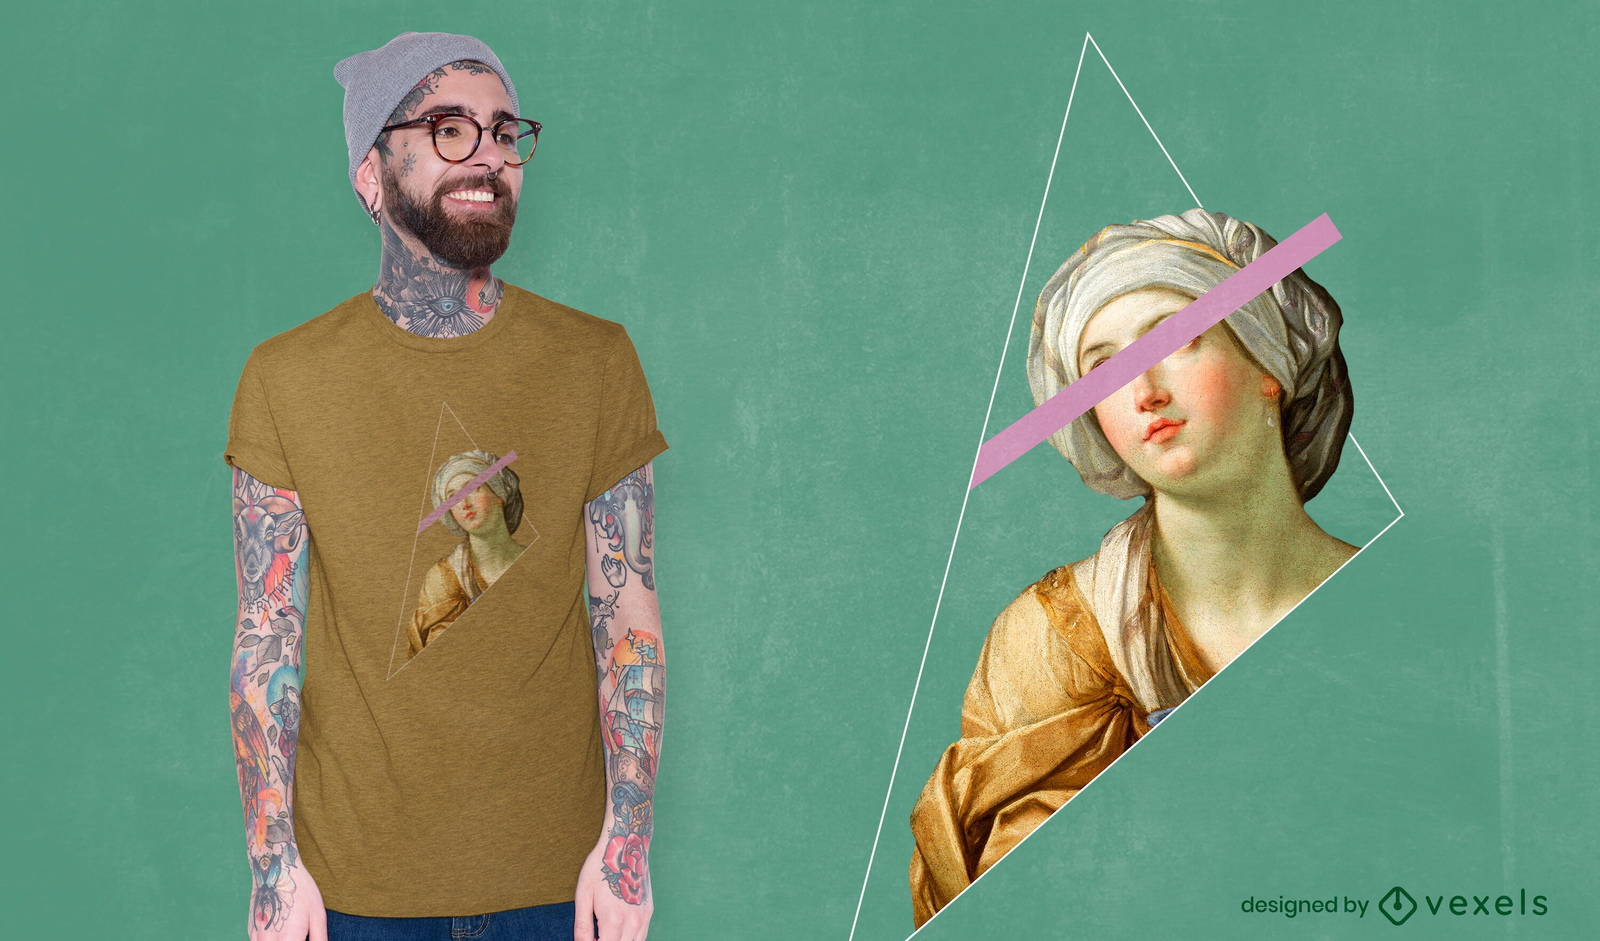
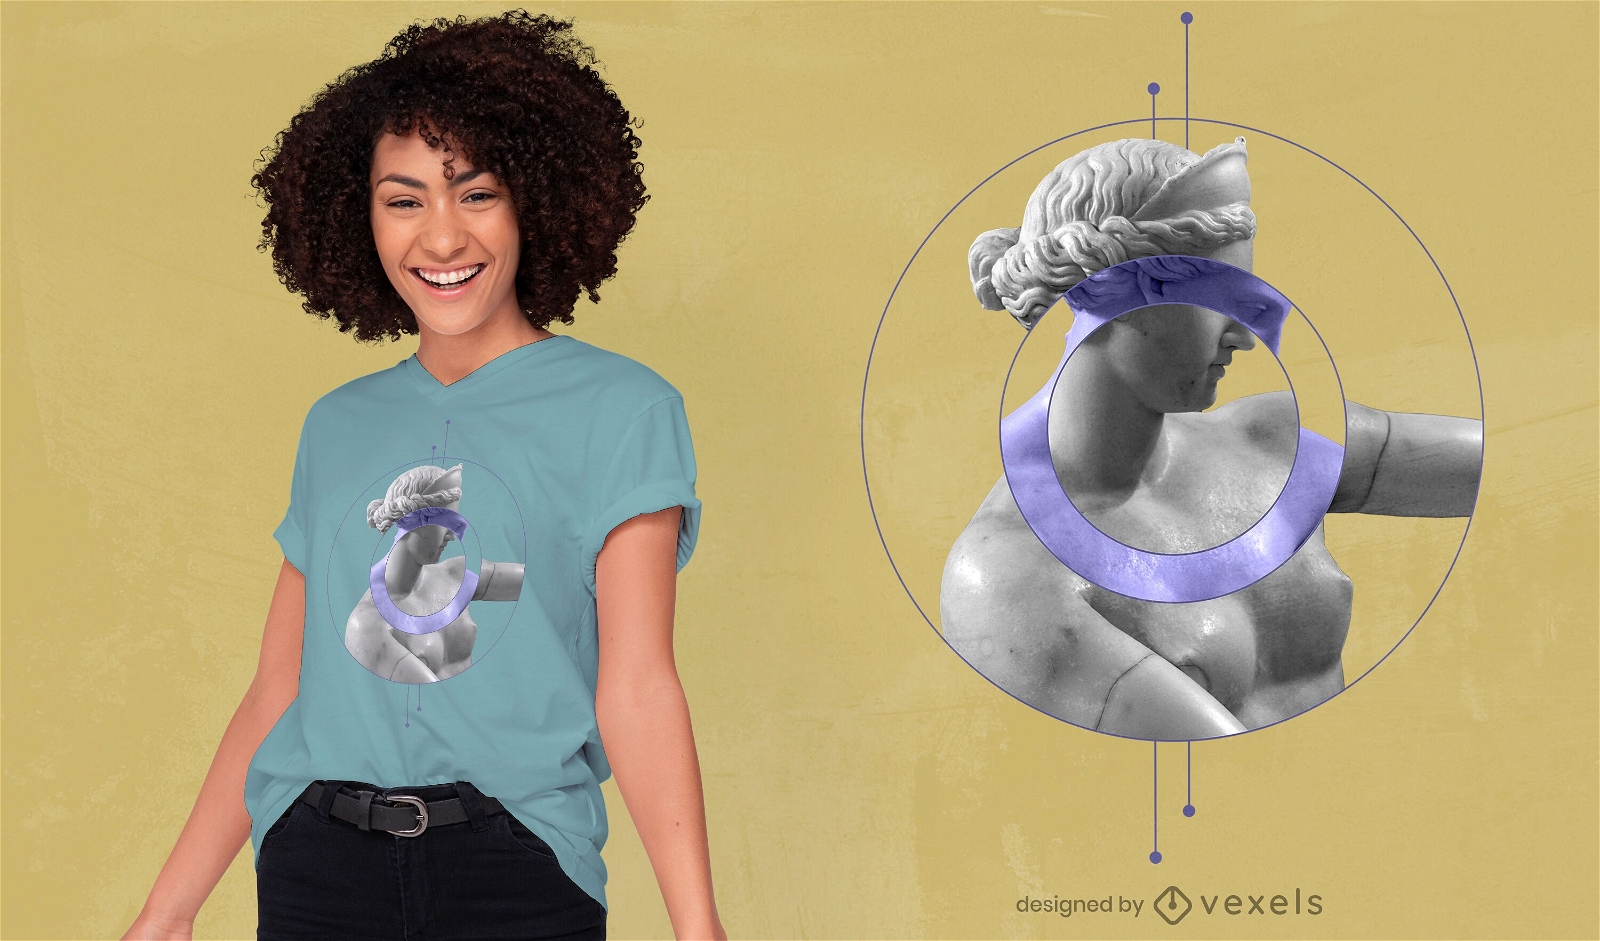
Mulher com design de t-shirt de cabeça de estátua psd
Escolha uma pasta
Todos os favoritos
Criar novo
Salvar
Mulher com design de t-shirt de cabeça de estátua psd
Pronto para imprimir
para Merch
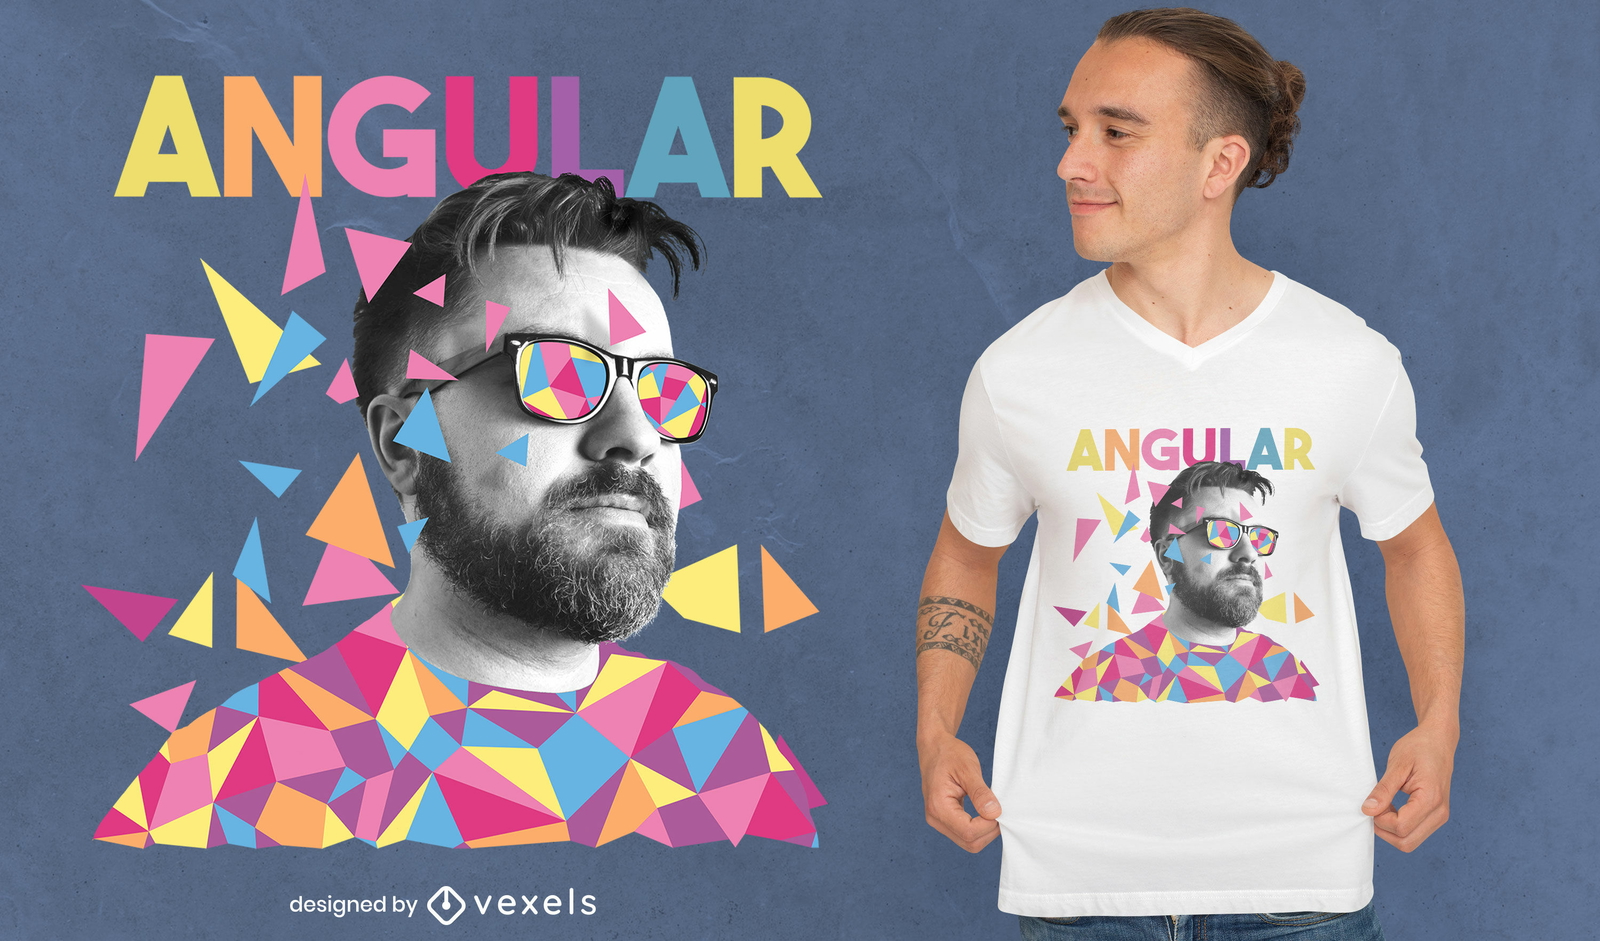
Homem com camiseta geométrica de óculos de sol psd
Escolha uma pasta
Todos os favoritos
Criar novo
Salvar
Homem com camiseta geométrica de óculos de sol psd
Pronto para imprimir
para Merch
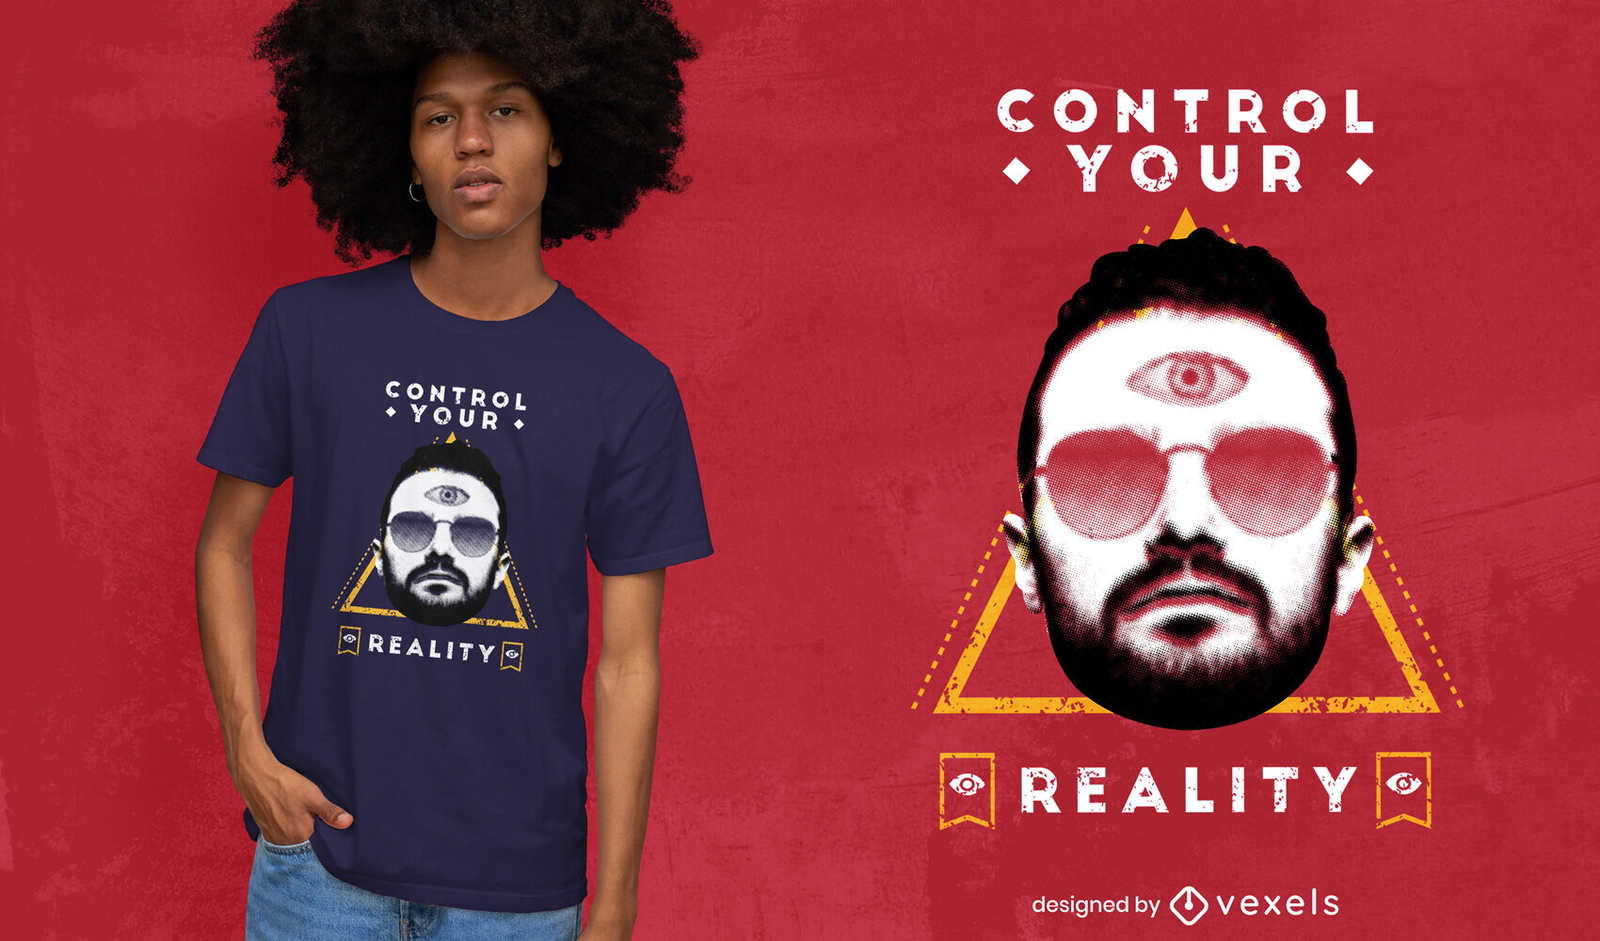
Homem com óculos de sol e camiseta do terceiro olho psd
Escolha uma pasta
Todos os favoritos
Criar novo
Salvar
Homem com óculos de sol e camiseta do terceiro olho psd
Pronto para imprimir
para Merch
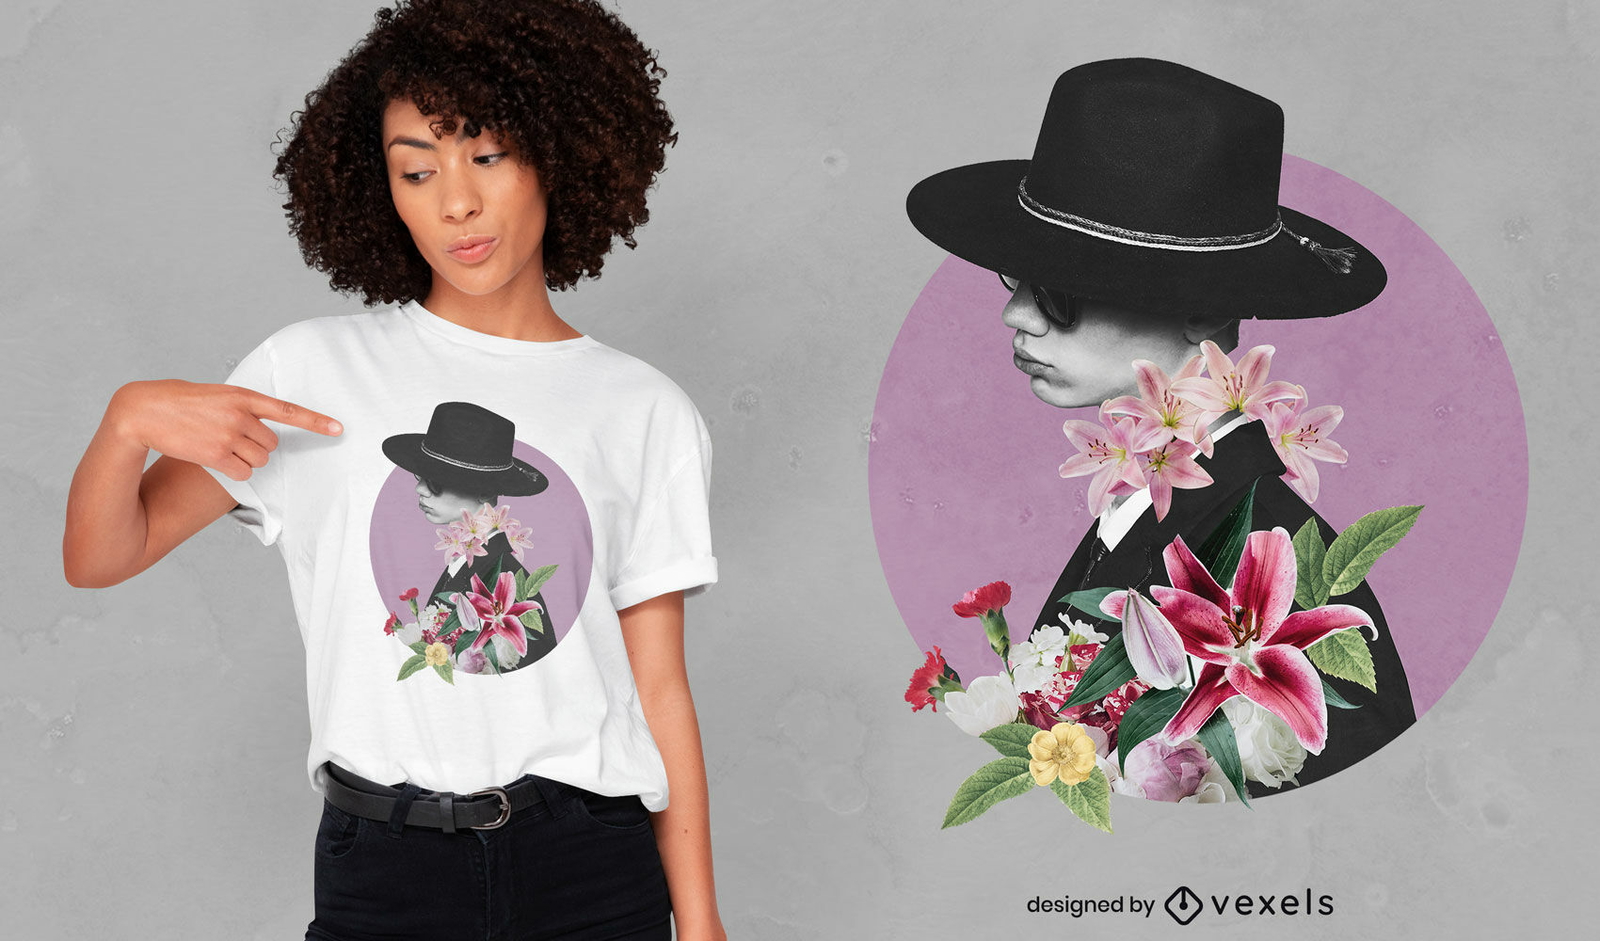
Design de t-shirt psd de colagem de chapéu e flores de menino
Escolha uma pasta
Todos os favoritos
Criar novo
Salvar
Design de t-shirt psd de colagem de chapéu e flores de menino
Pronto para imprimir
para Merch
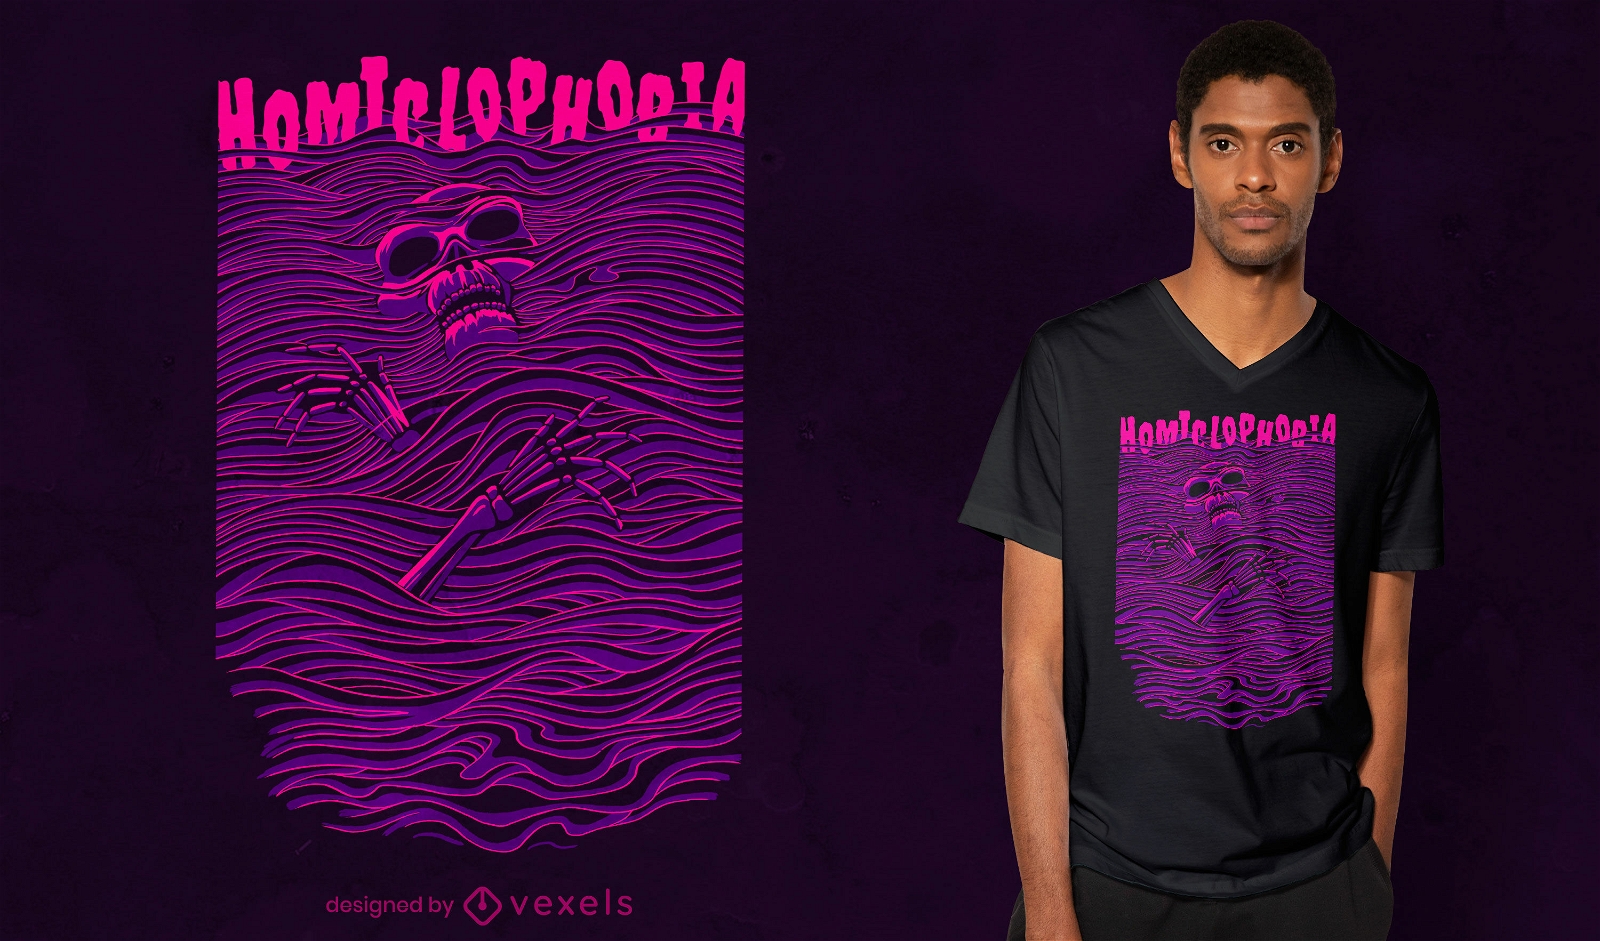
Design de camiseta psd de arte de linha de homiclofobia
Escolha uma pasta
Todos os favoritos
Criar novo
Salvar
Design de camiseta psd de arte de linha de homiclofobia
Pronto para imprimir
para Merch
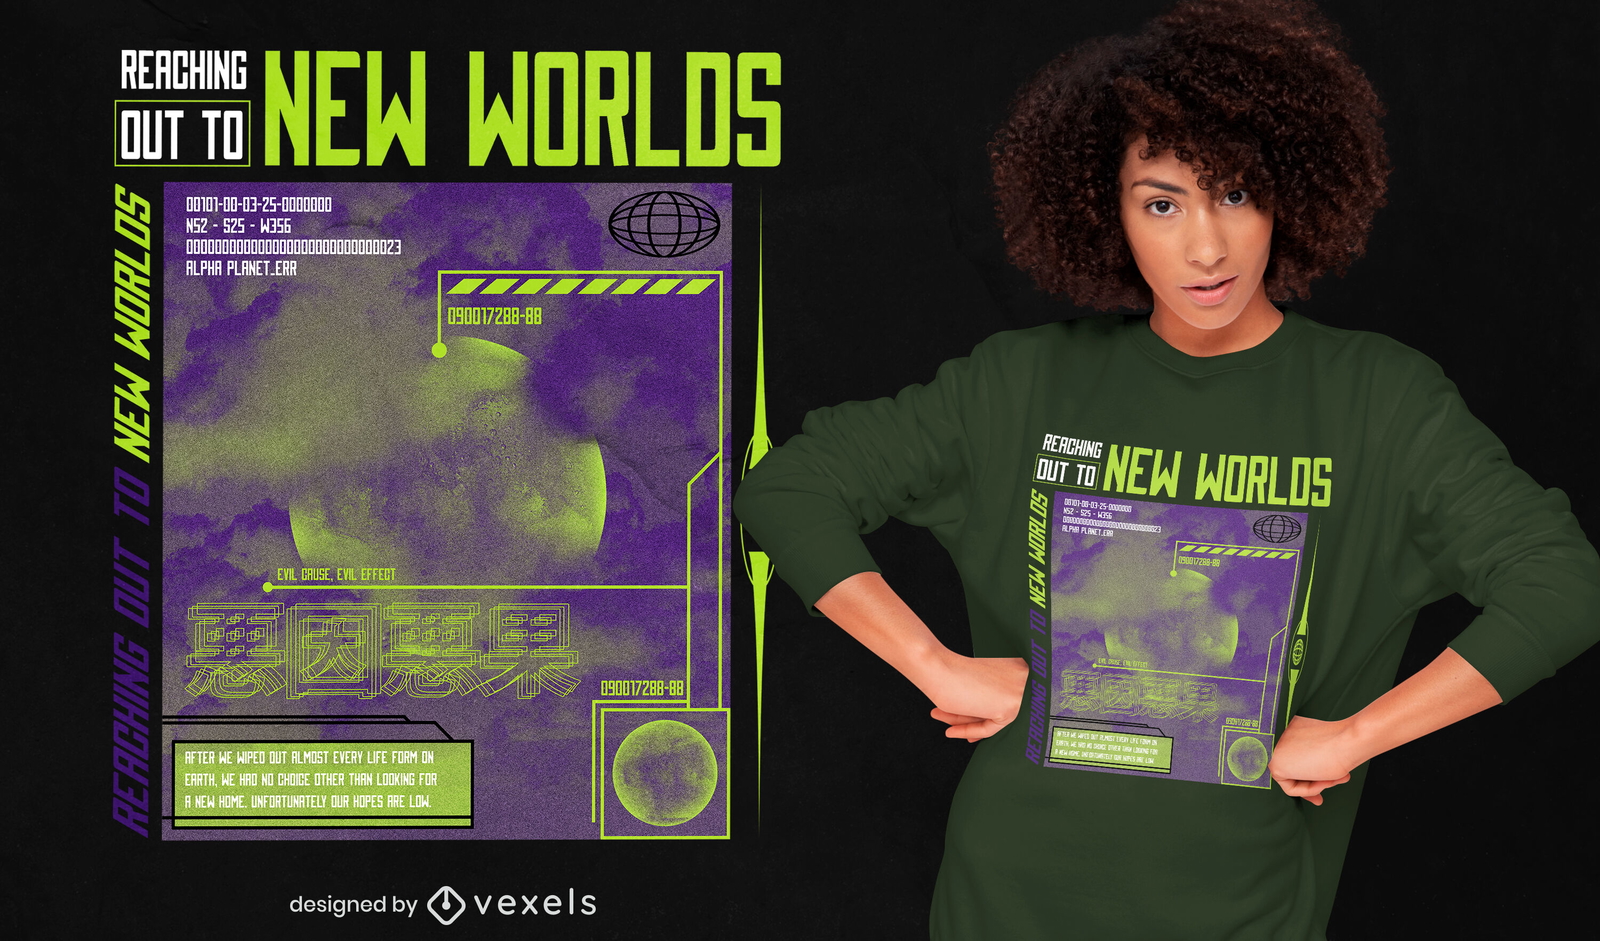
Novo mundo planeta espaço citação t-shirt psd
Escolha uma pasta
Todos os favoritos
Criar novo
Salvar
Novo mundo planeta espaço citação t-shirt psd
Pronto para imprimir
para Merch
Camiseta de composição de pintura realista psd
Escolha uma pasta
Todos os favoritos
Criar novo
Salvar
Camiseta de composição de pintura realista psd
Pronto para imprimir
para Merch
Statue composition t-shirt psd
Escolha uma pasta
Todos os favoritos
Criar novo
Salvar
Statue composition t-shirt psd
Camiseta PSD escalável
para Merch
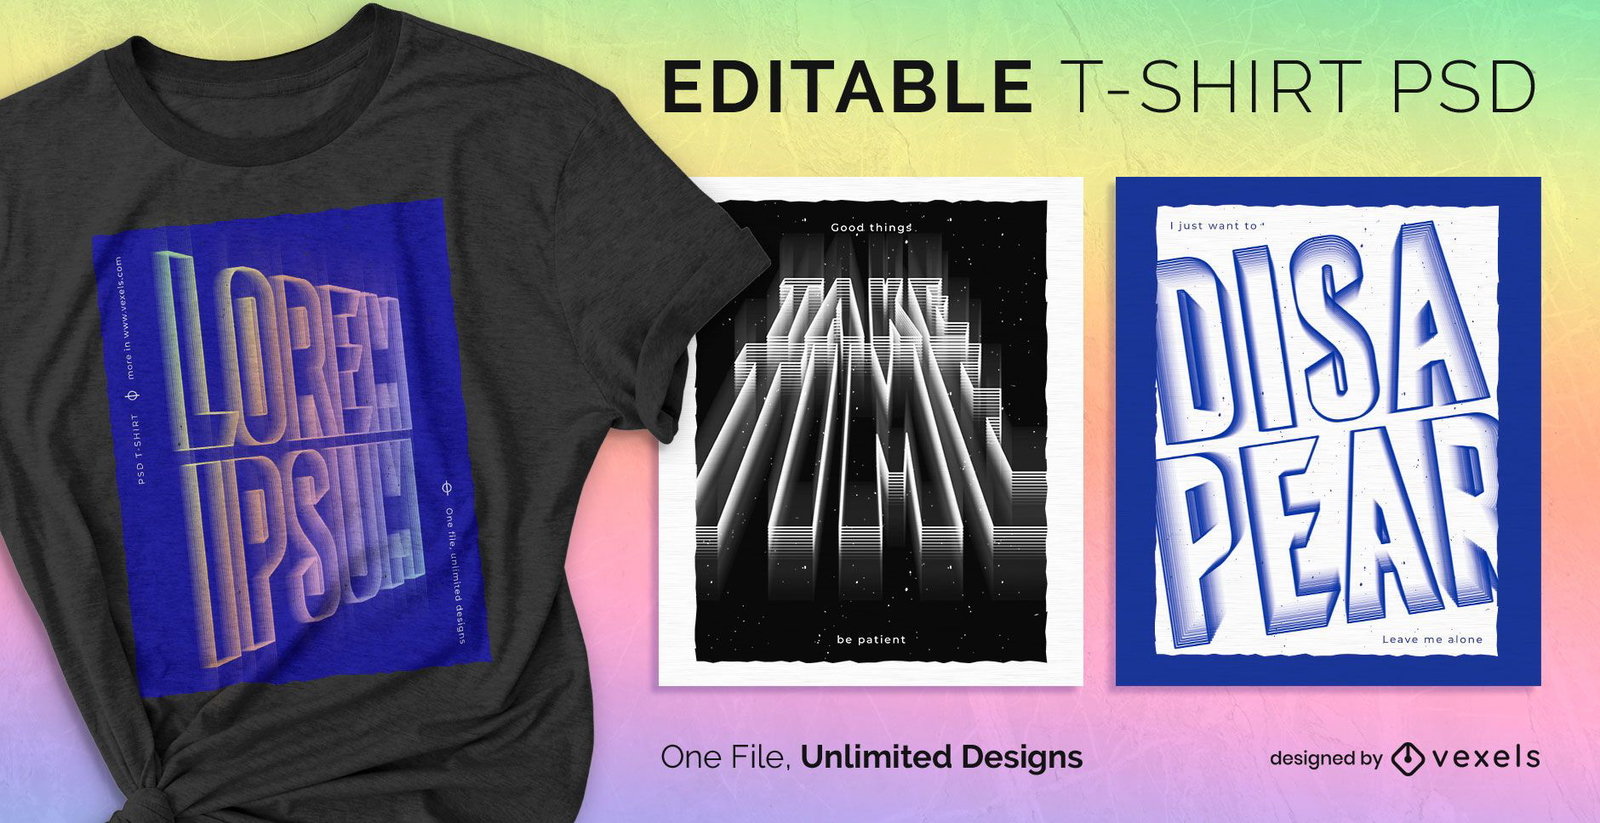
T-shirt escalável de texto em relevo psd
Escolha uma pasta
Todos os favoritos
Criar novo
Salvar
T-shirt escalável de texto em relevo psd
Camiseta PSD escalável
para Merch
Camiseta escalável ondulada PSD
Escolha uma pasta
Todos os favoritos
Criar novo
Salvar
Camiseta escalável ondulada PSD
Camiseta PSD escalável
para Merch
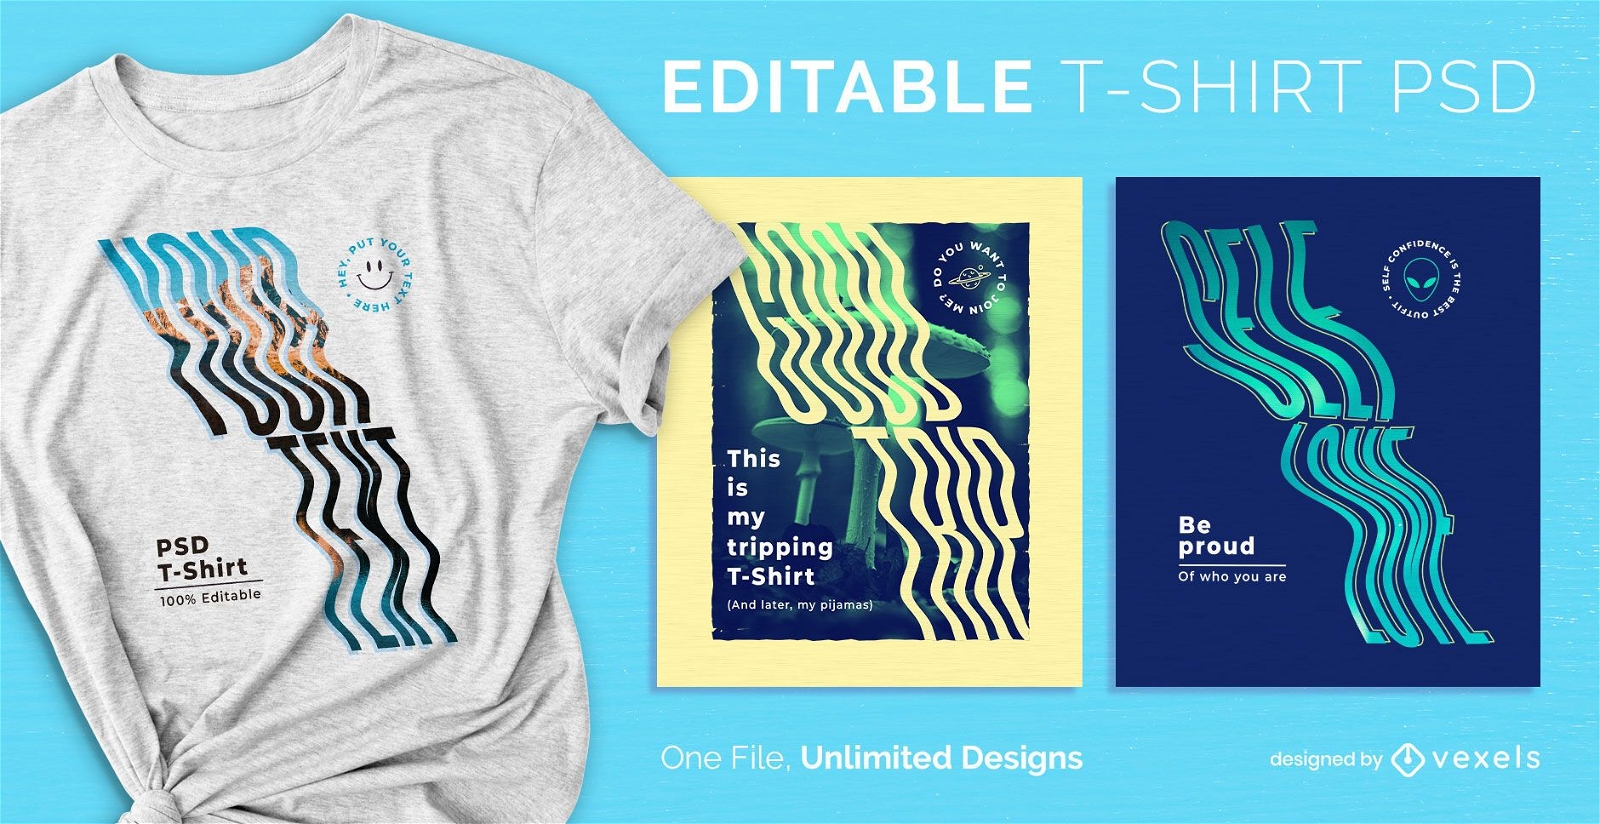
Design de t-shirt psd com texto ondulado
Escolha uma pasta
Todos os favoritos
Criar novo
Salvar
Design de t-shirt psd com texto ondulado
Camiseta PSD escalável
para Merch
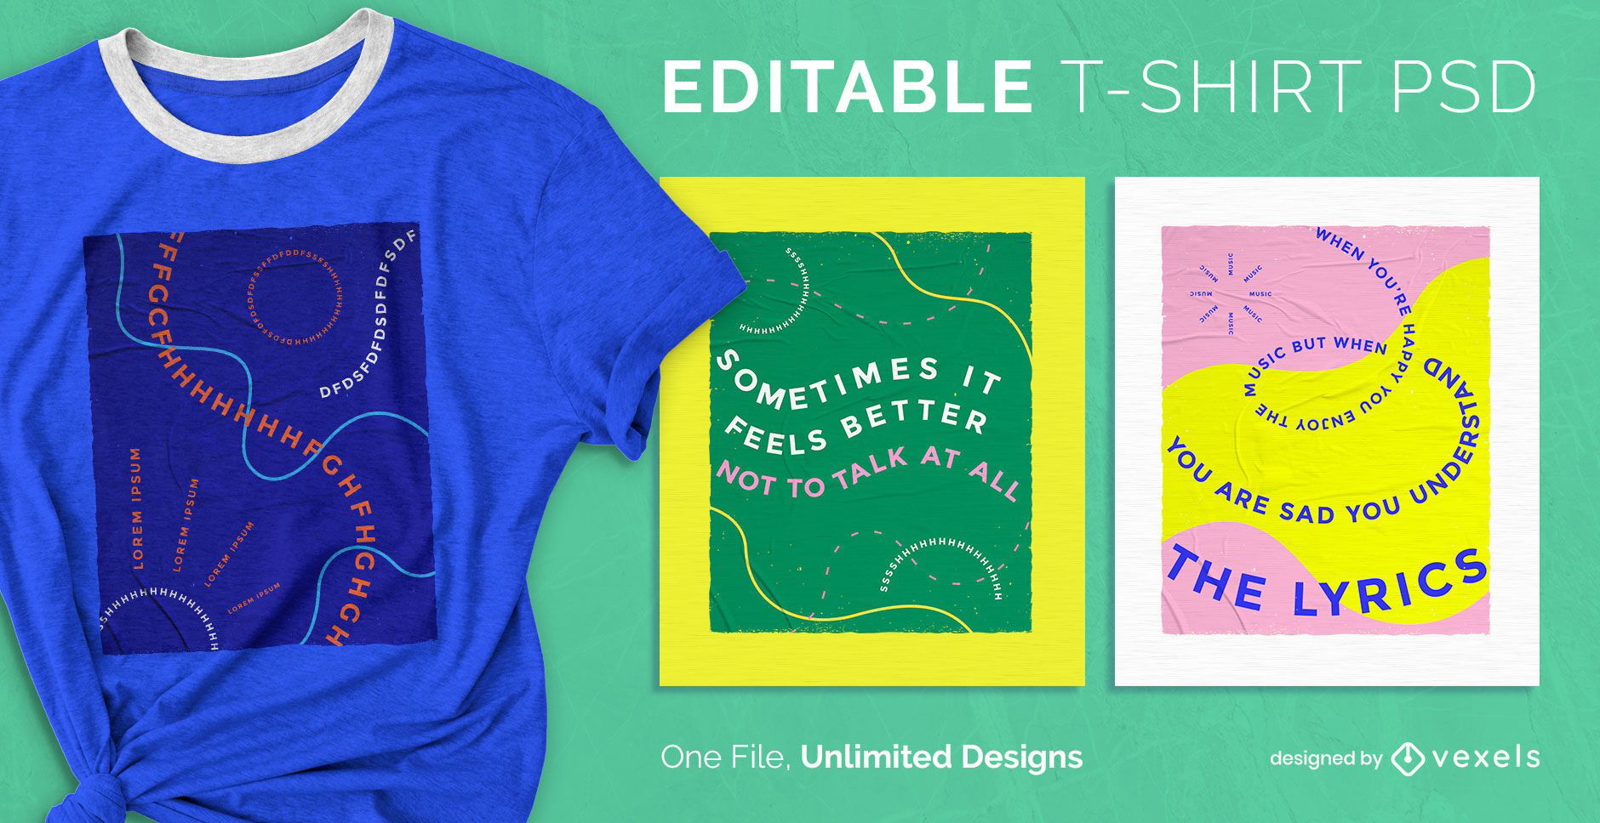
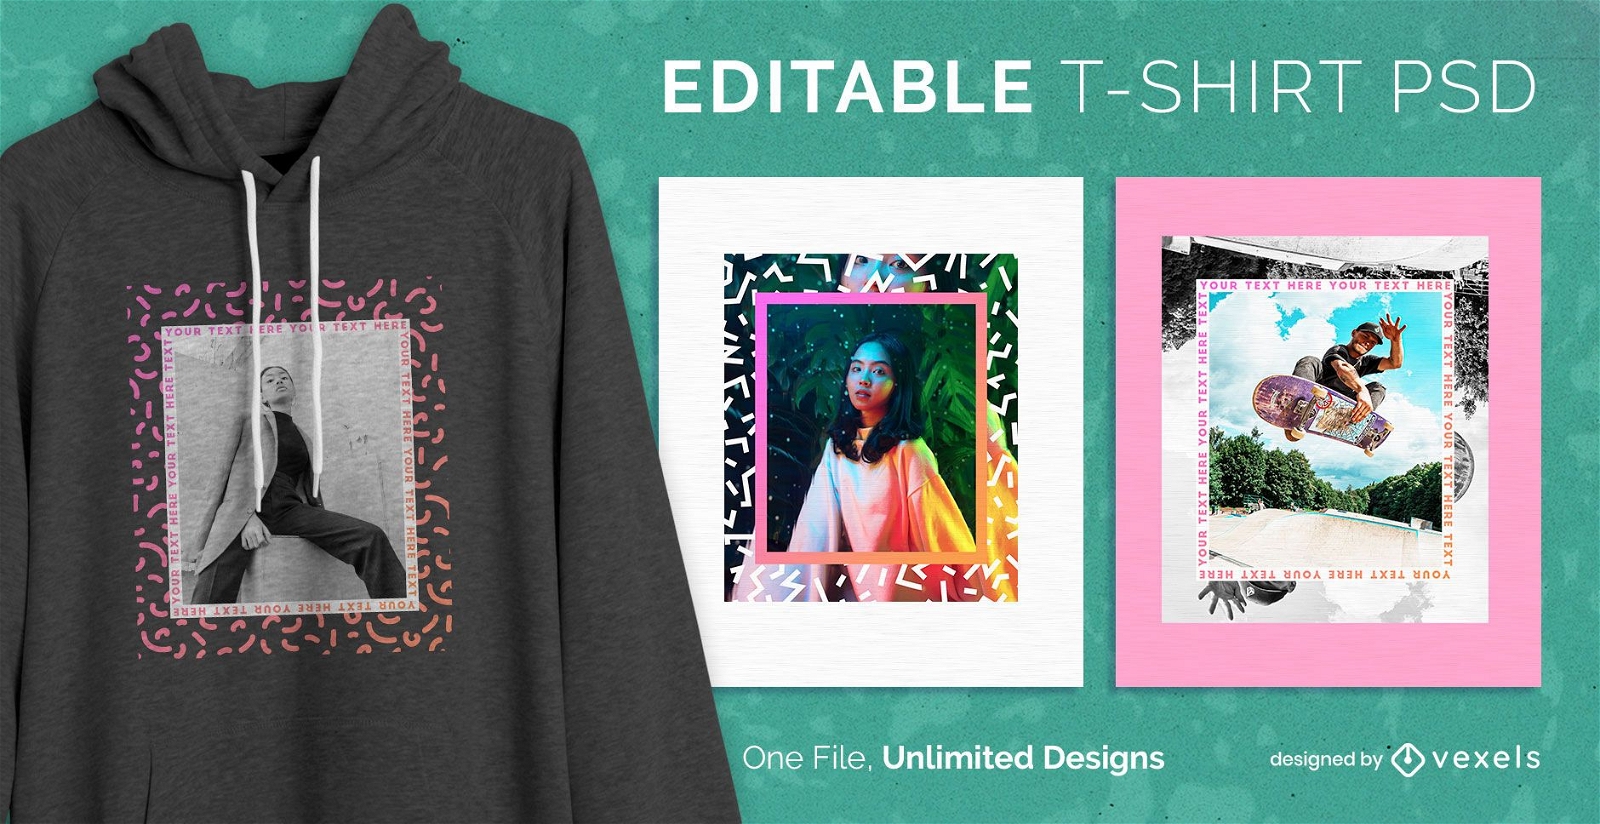
Quadro de design de camiseta psd
Escolha uma pasta
Todos os favoritos
Criar novo
Salvar
Quadro de design de camiseta psd
texto editável
Pronto para imprimir
para Merch
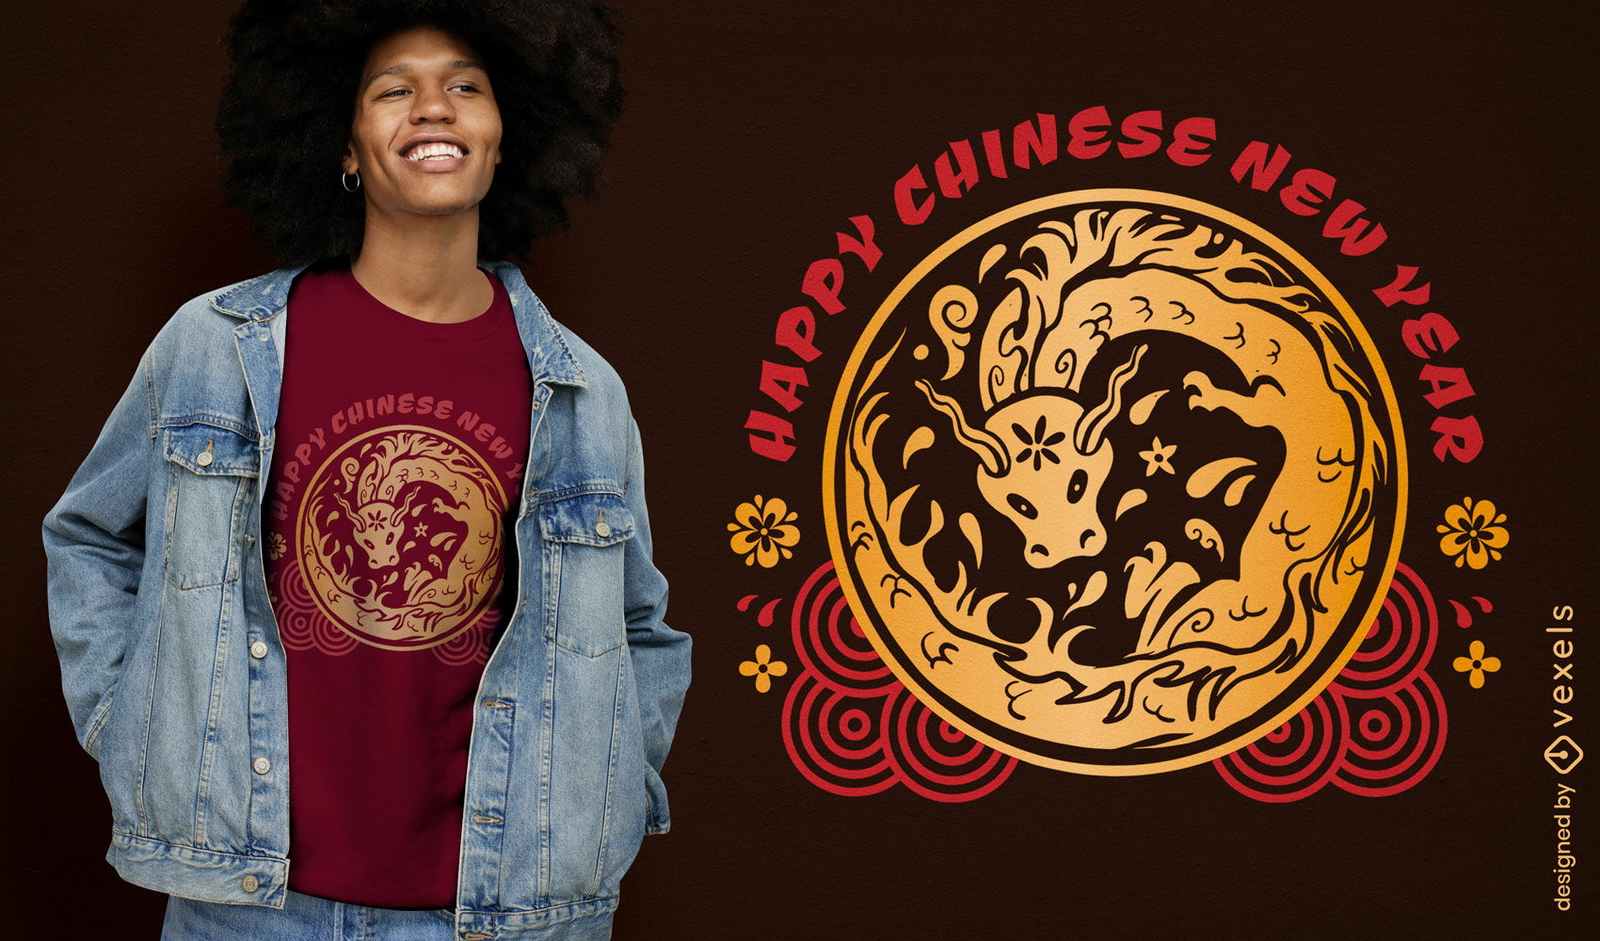
Design gráfico de camiseta com dragão do Ano Novo Chinês
Escolha uma pasta
Todos os favoritos
Criar novo
Salvar
Design gráfico de camiseta com dragão do Ano Novo Chinês
Pronto para imprimir
para Merch
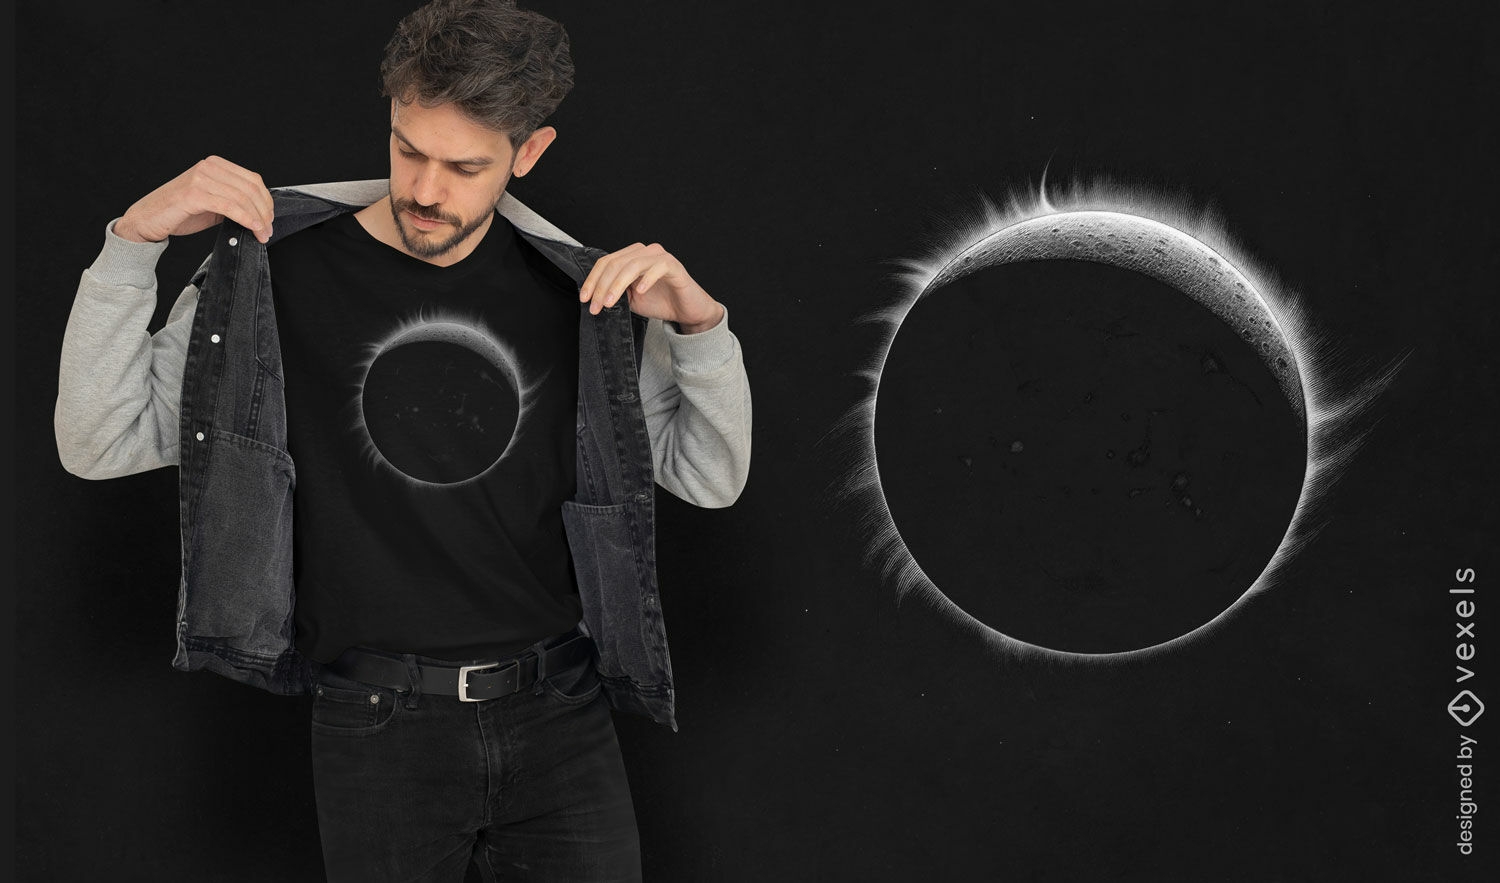
Design de camiseta para eclipse solar
Escolha uma pasta
Todos os favoritos
Criar novo
Salvar
Design de camiseta para eclipse solar
Gerado por IA, selecionado por nossos designers.
para Merch
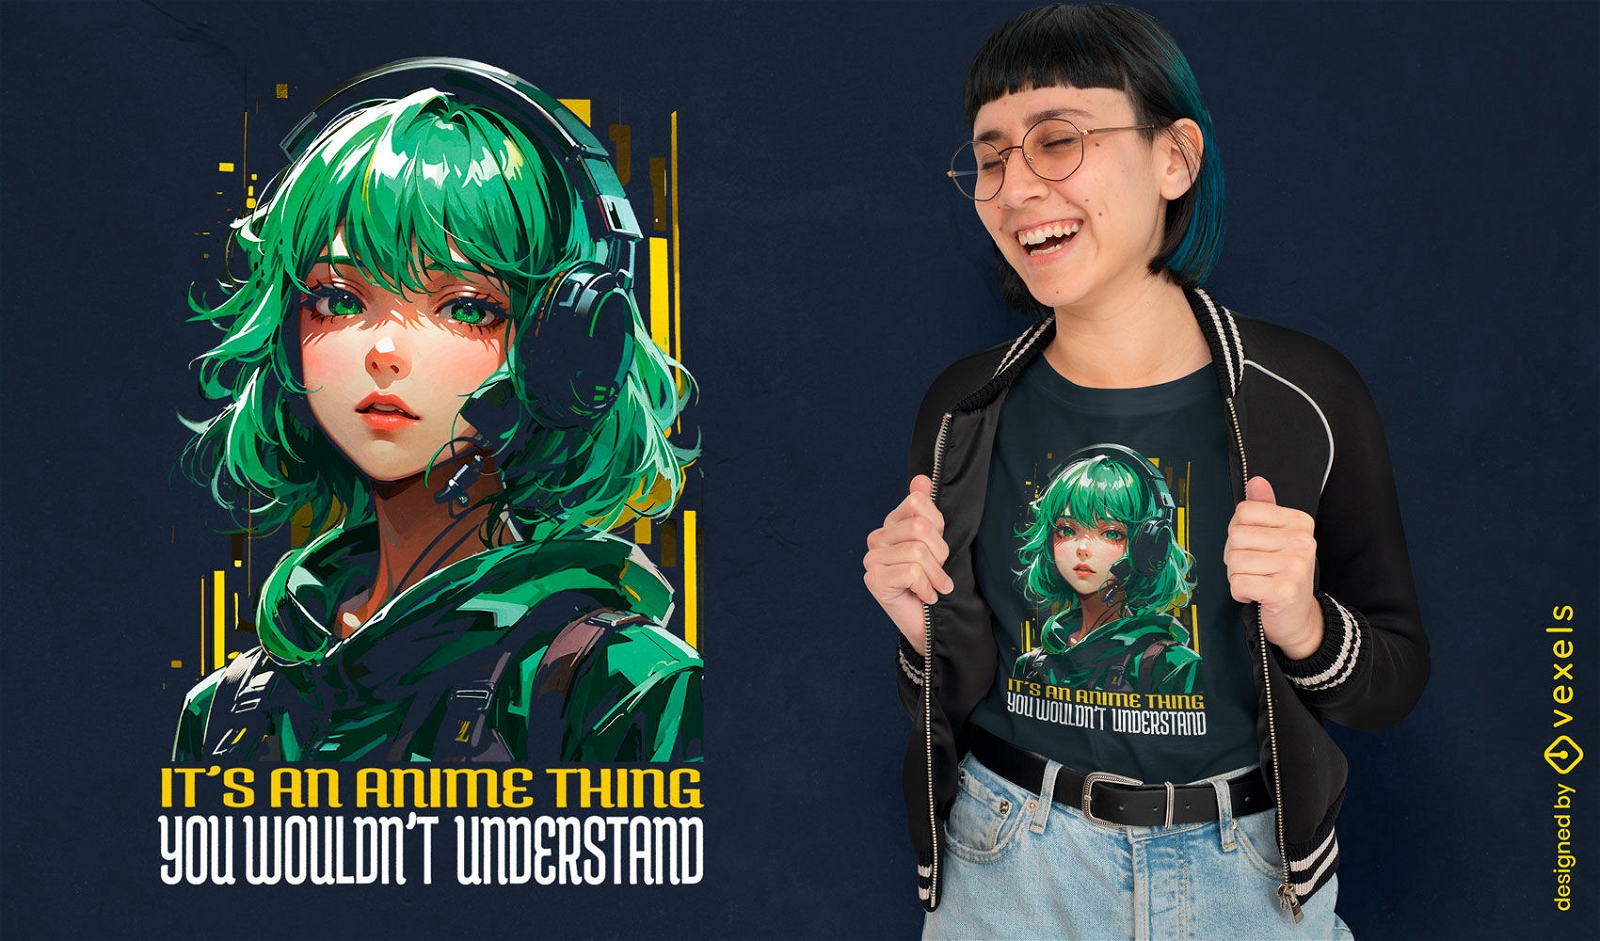
Design de camiseta feminina inspirada em anime
Escolha uma pasta
Todos os favoritos
Criar novo
Salvar
Design de camiseta feminina inspirada em anime
Gerado por IA, selecionado por nossos designers.
para Merch
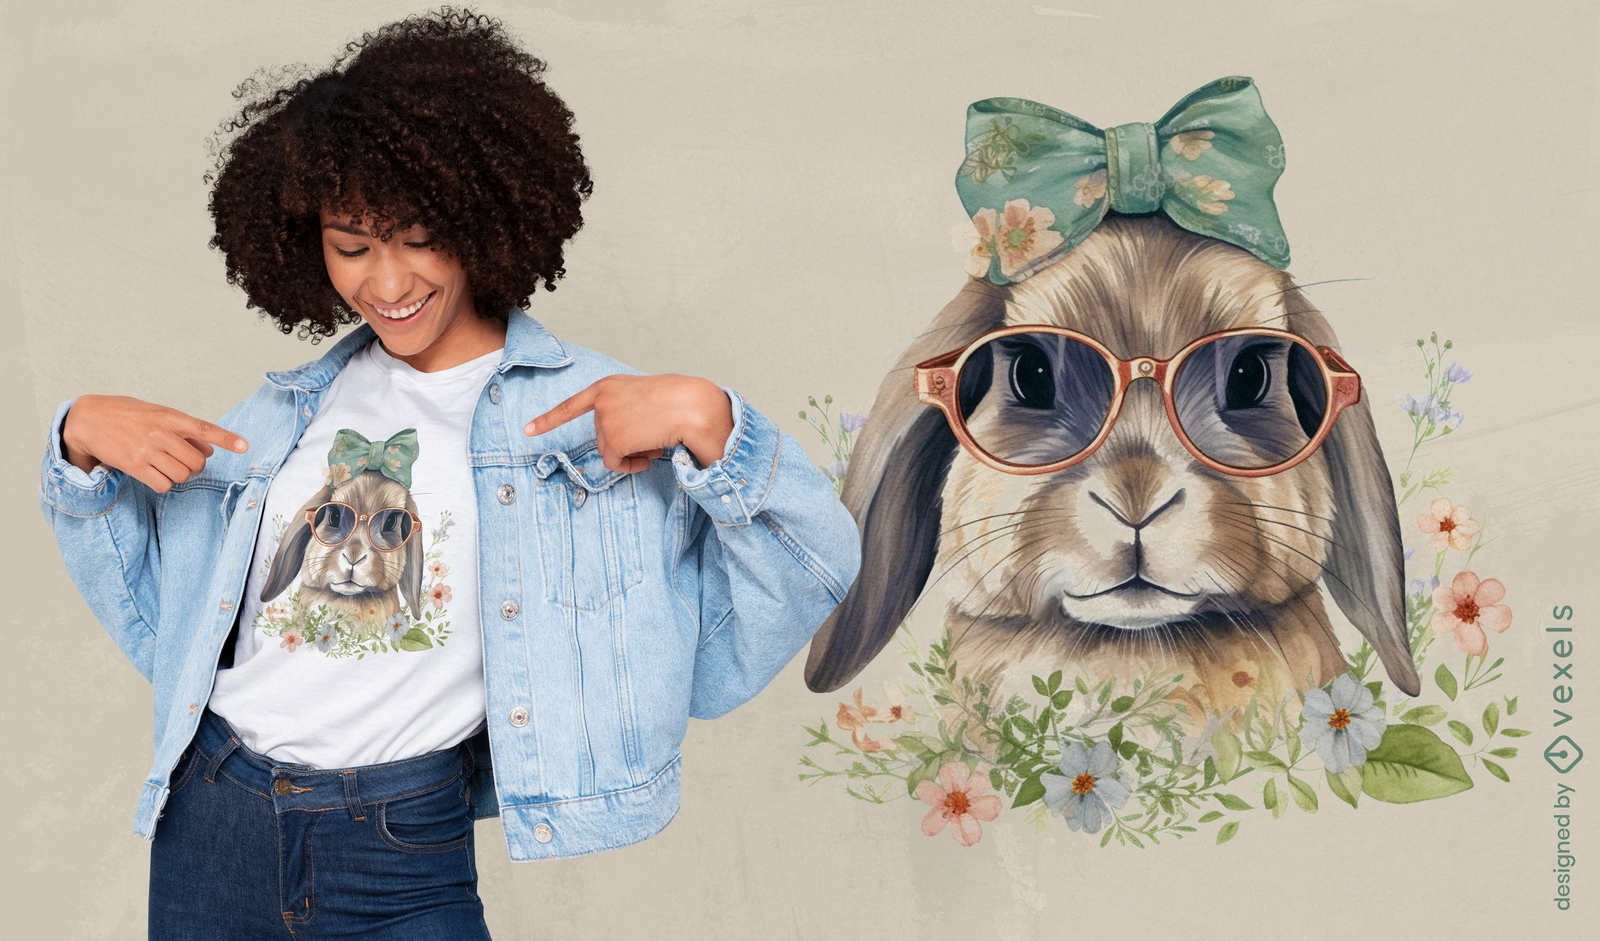
Coelho de Páscoa com design estiloso de camiseta com óculos de sol
Escolha uma pasta
Todos os favoritos
Criar novo
Salvar
Coelho de Páscoa com design estiloso de camiseta com óculos de sol
Gerado por IA, selecionado por nossos designers.
para Merch
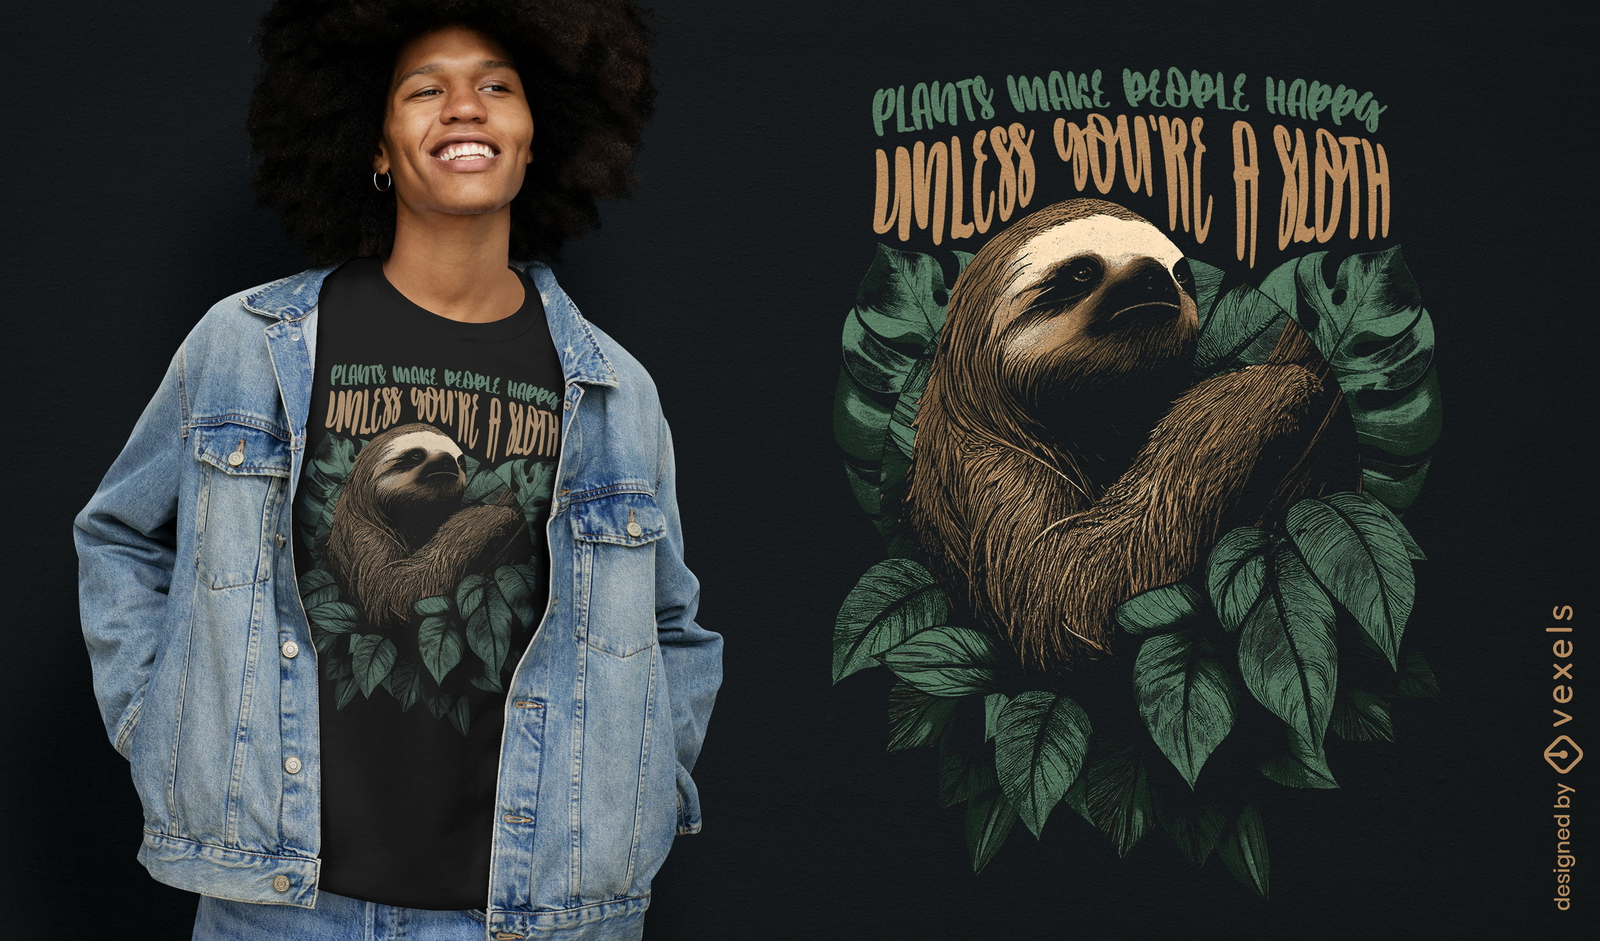
Design humorístico de camisetas com preguiças e plantas
Escolha uma pasta
Todos os favoritos
Criar novo
Salvar
Design humorístico de camisetas com preguiças e plantas
Gerado por IA, selecionado por nossos designers.
para Merch
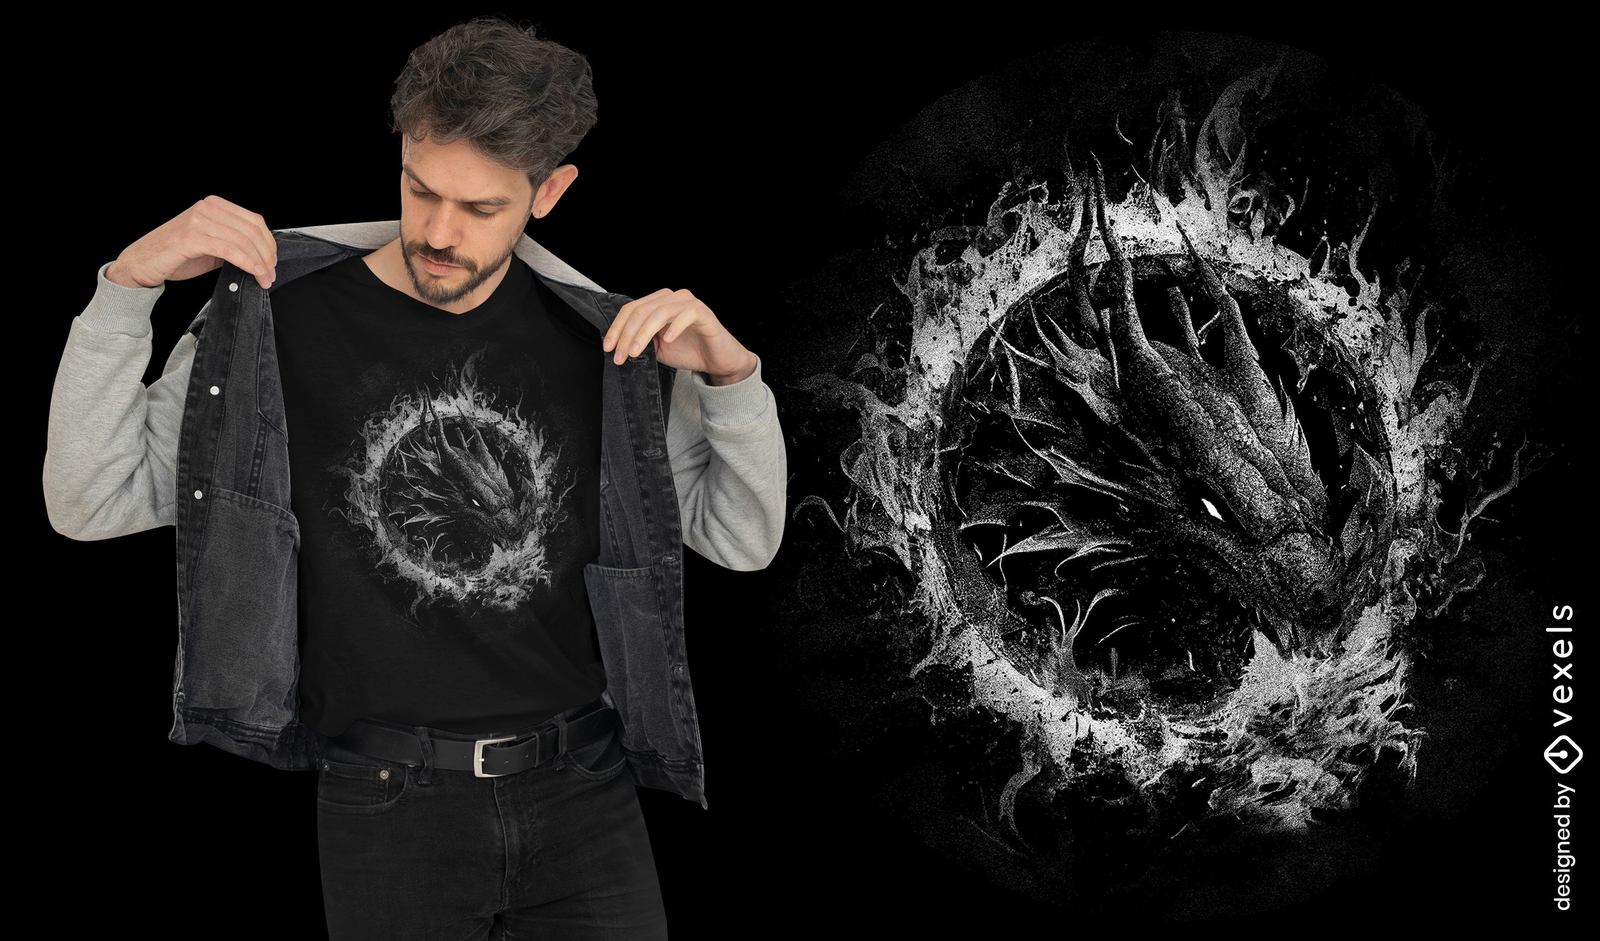
Design emergente de camiseta com dragão
Escolha uma pasta
Todos os favoritos
Criar novo
Salvar
Design emergente de camiseta com dragão
Pronto para imprimir
para Merch
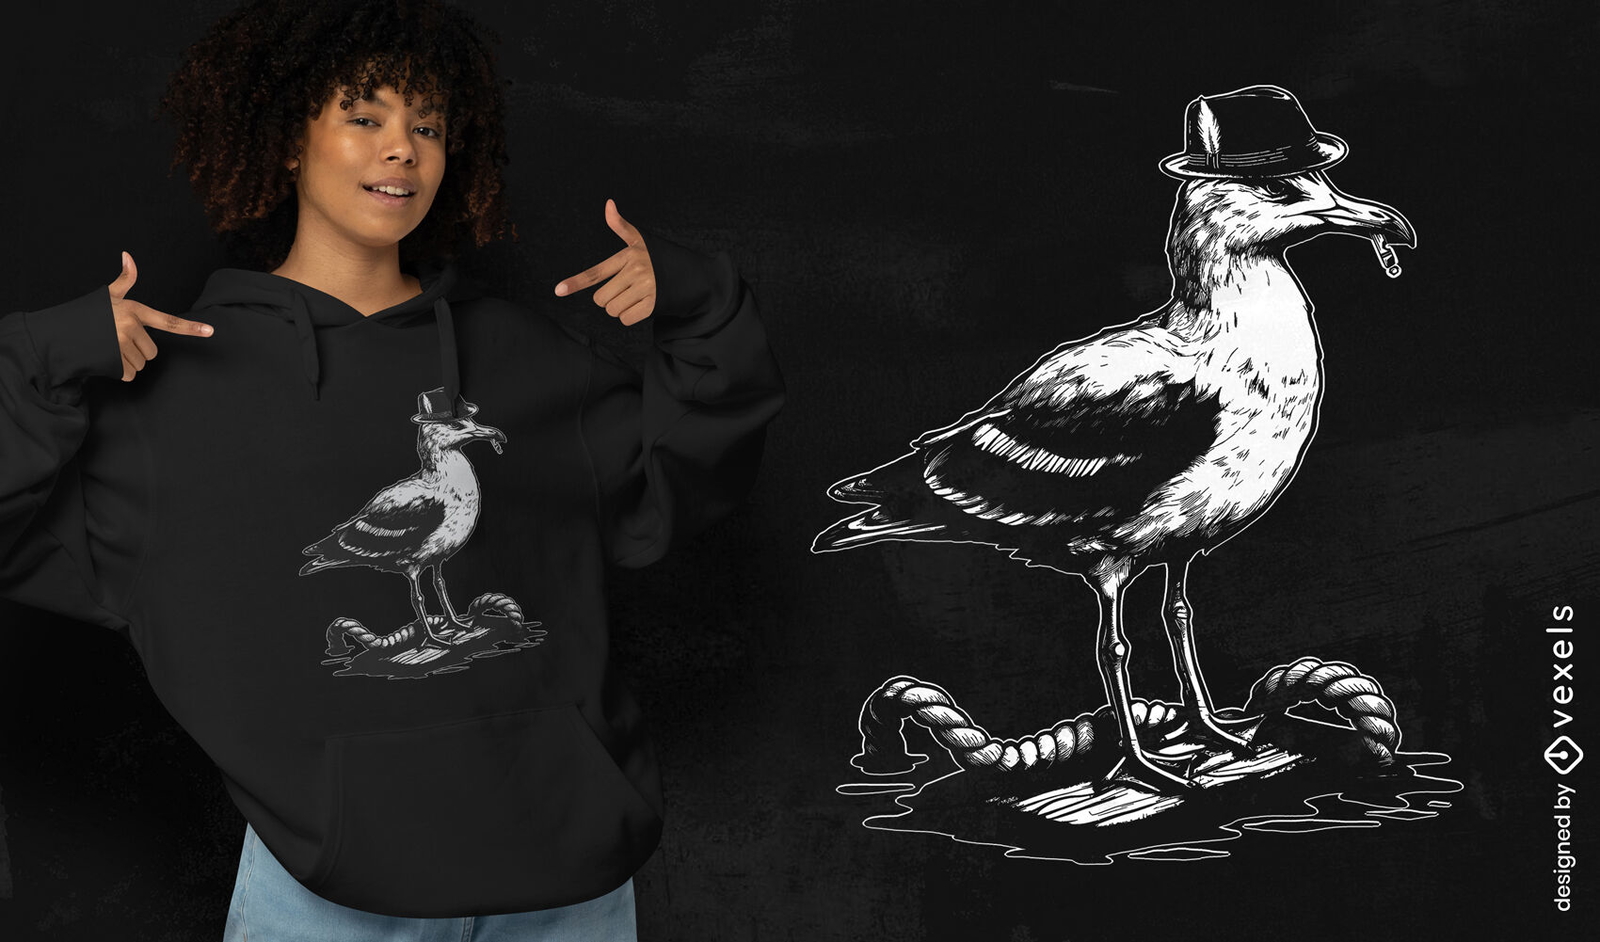
Design de camiseta de gaivota com chap?u
Escolha uma pasta
Todos os favoritos
Criar novo
Salvar
Design de camiseta de gaivota com chap?u
Pronto para imprimir
para Merch
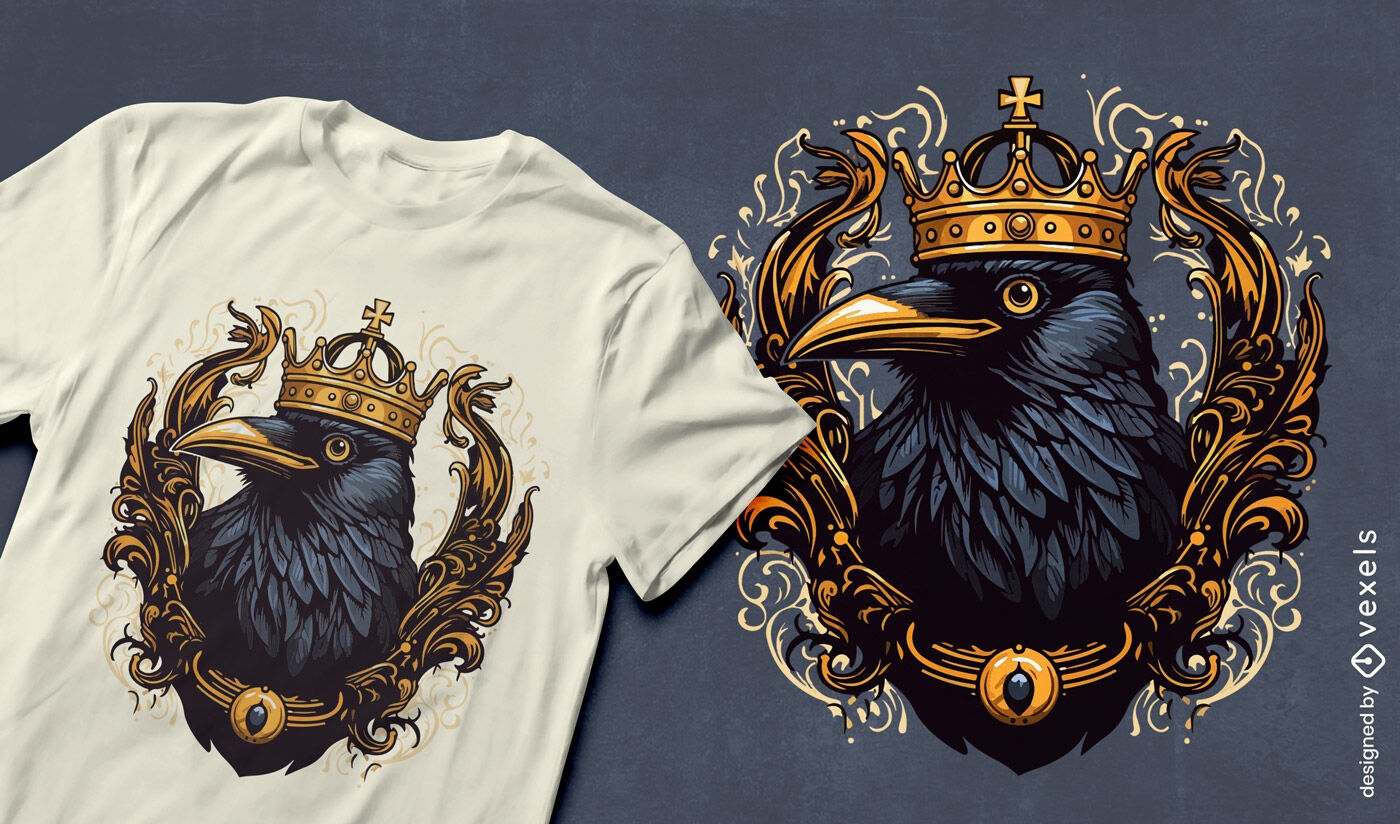
Design de camiseta corvo com coroa
Escolha uma pasta
Todos os favoritos
Criar novo
Salvar
Design de camiseta corvo com coroa
Pronto para imprimir
para Merch
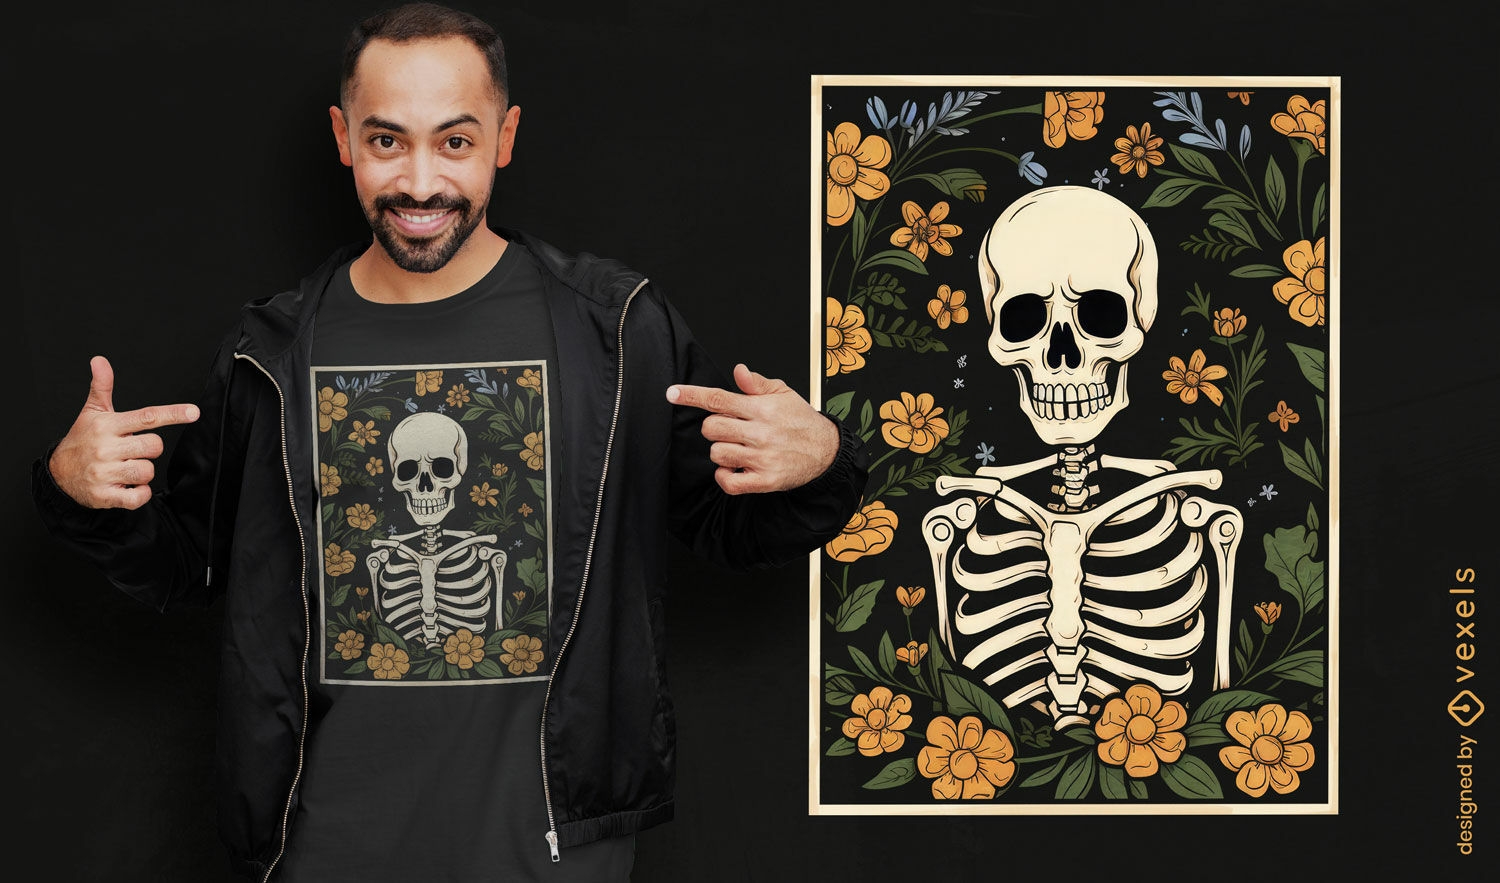
Esqueleto com design de camiseta escura com flores
Escolha uma pasta
Todos os favoritos
Criar novo
Salvar
Esqueleto com design de camiseta escura com flores
texto editável
Pronto para imprimir
para Merch
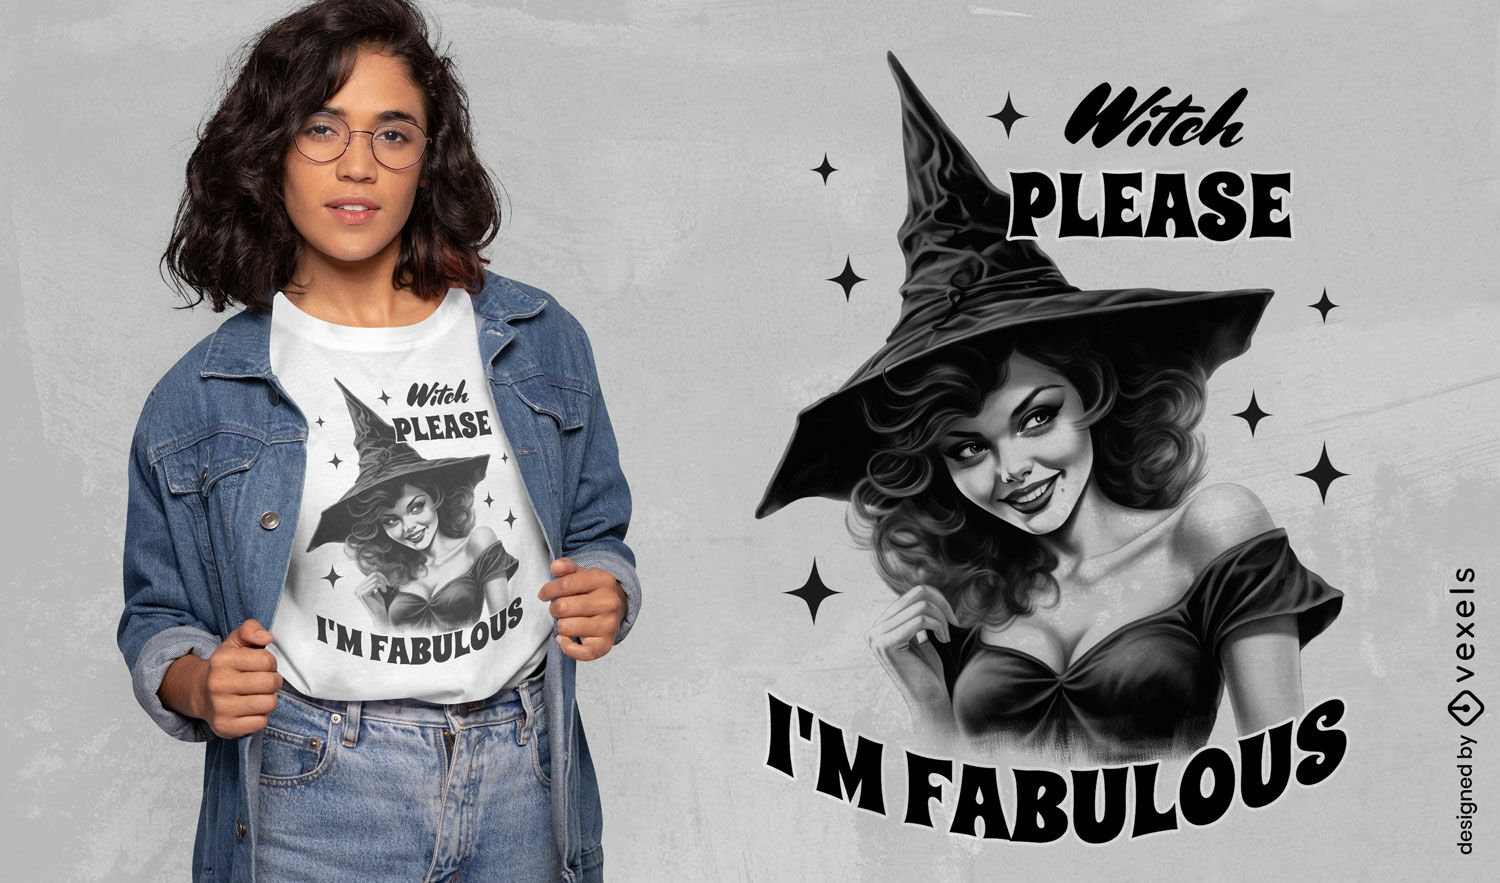
Bruxa, por favor, sou fabuloso design de camiseta
Escolha uma pasta
Todos os favoritos
Criar novo
Salvar
Bruxa, por favor, sou fabuloso design de camiseta
Gerado por IA, selecionado por nossos designers.
para Merch
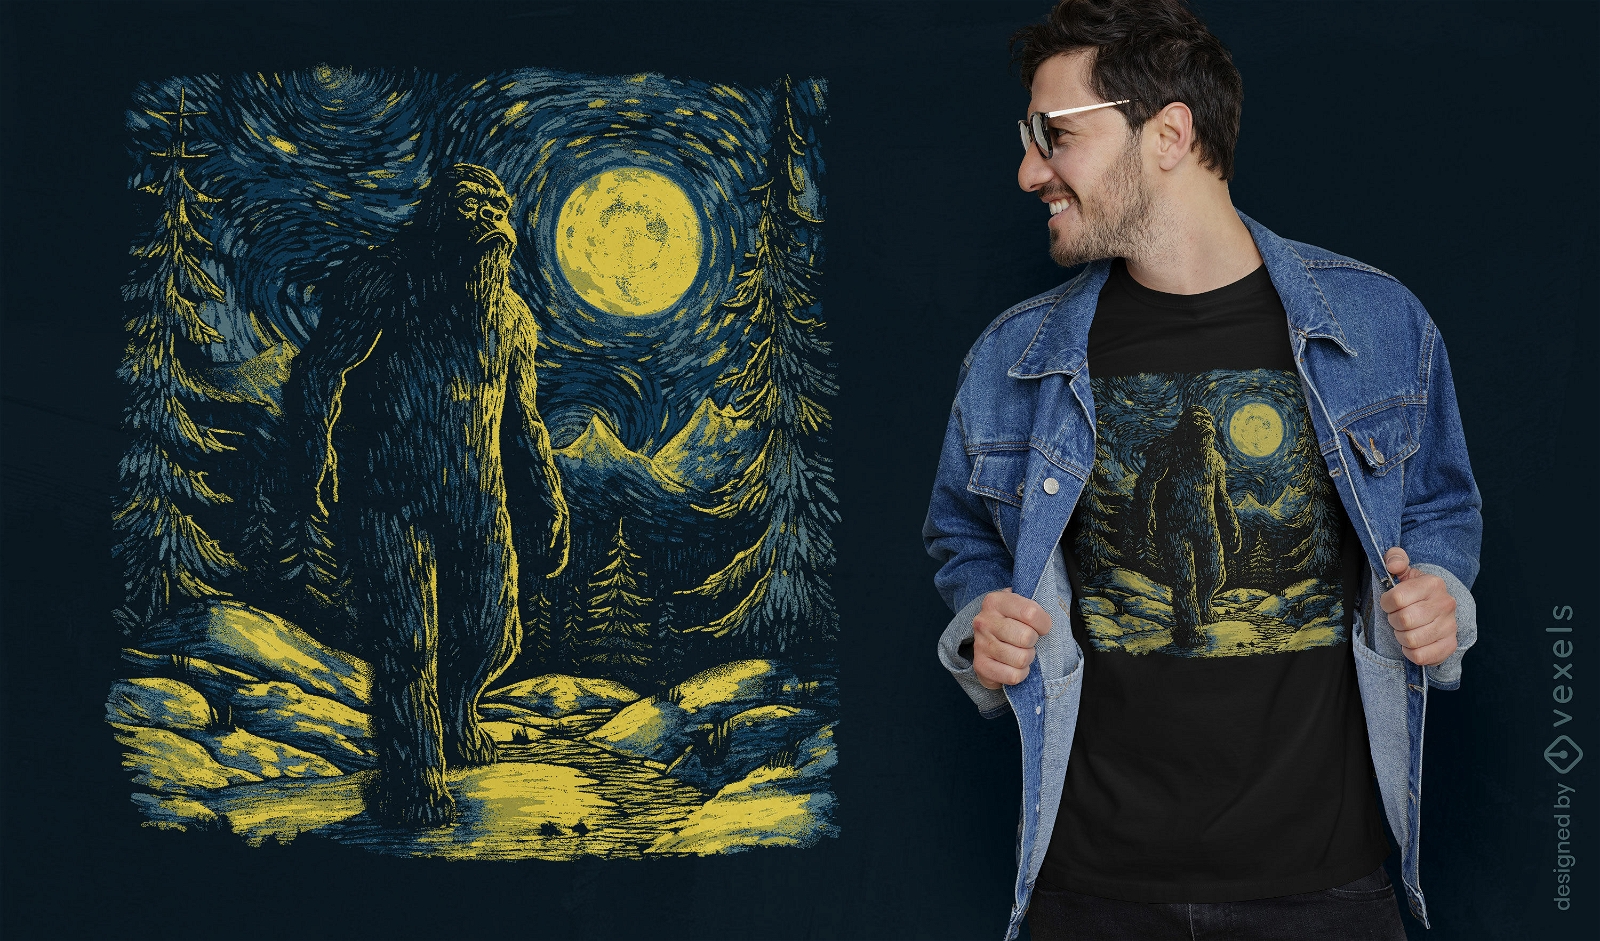
Design de camiseta Big Foot para noite estrelada
Escolha uma pasta
Todos os favoritos
Criar novo
Salvar
Design de camiseta Big Foot para noite estrelada
Pronto para imprimir
para Merch
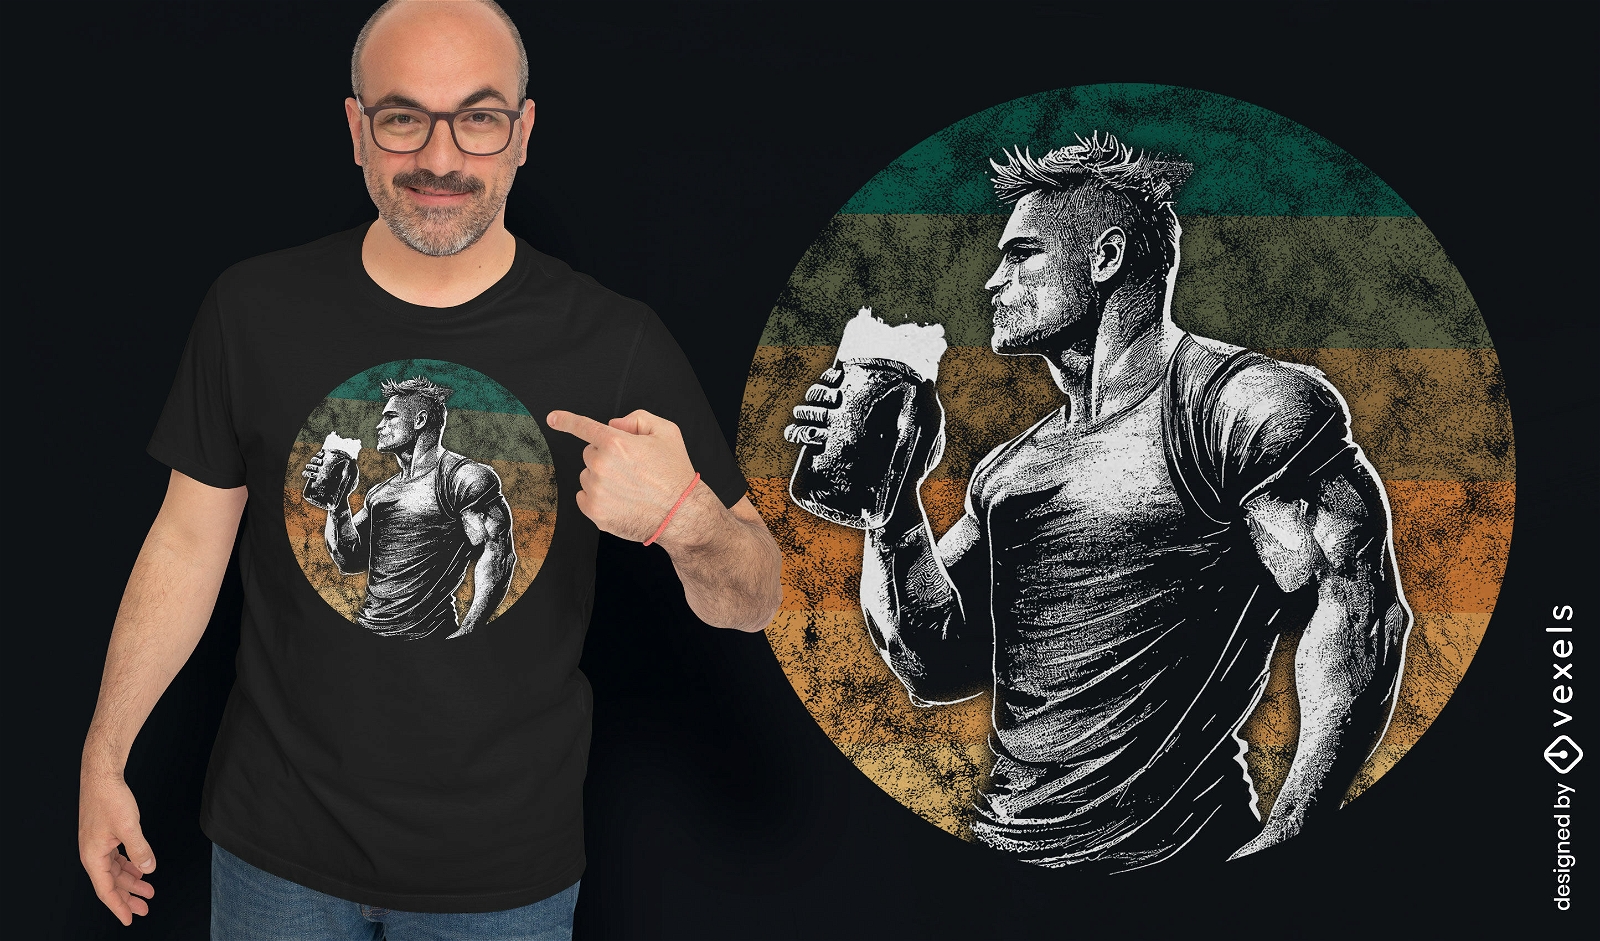
Design de camiseta de homem musculoso bebendo cerveja
Escolha uma pasta
Todos os favoritos
Criar novo
Salvar
Design de camiseta de homem musculoso bebendo cerveja
texto editável
Pronto para imprimir
para Merch
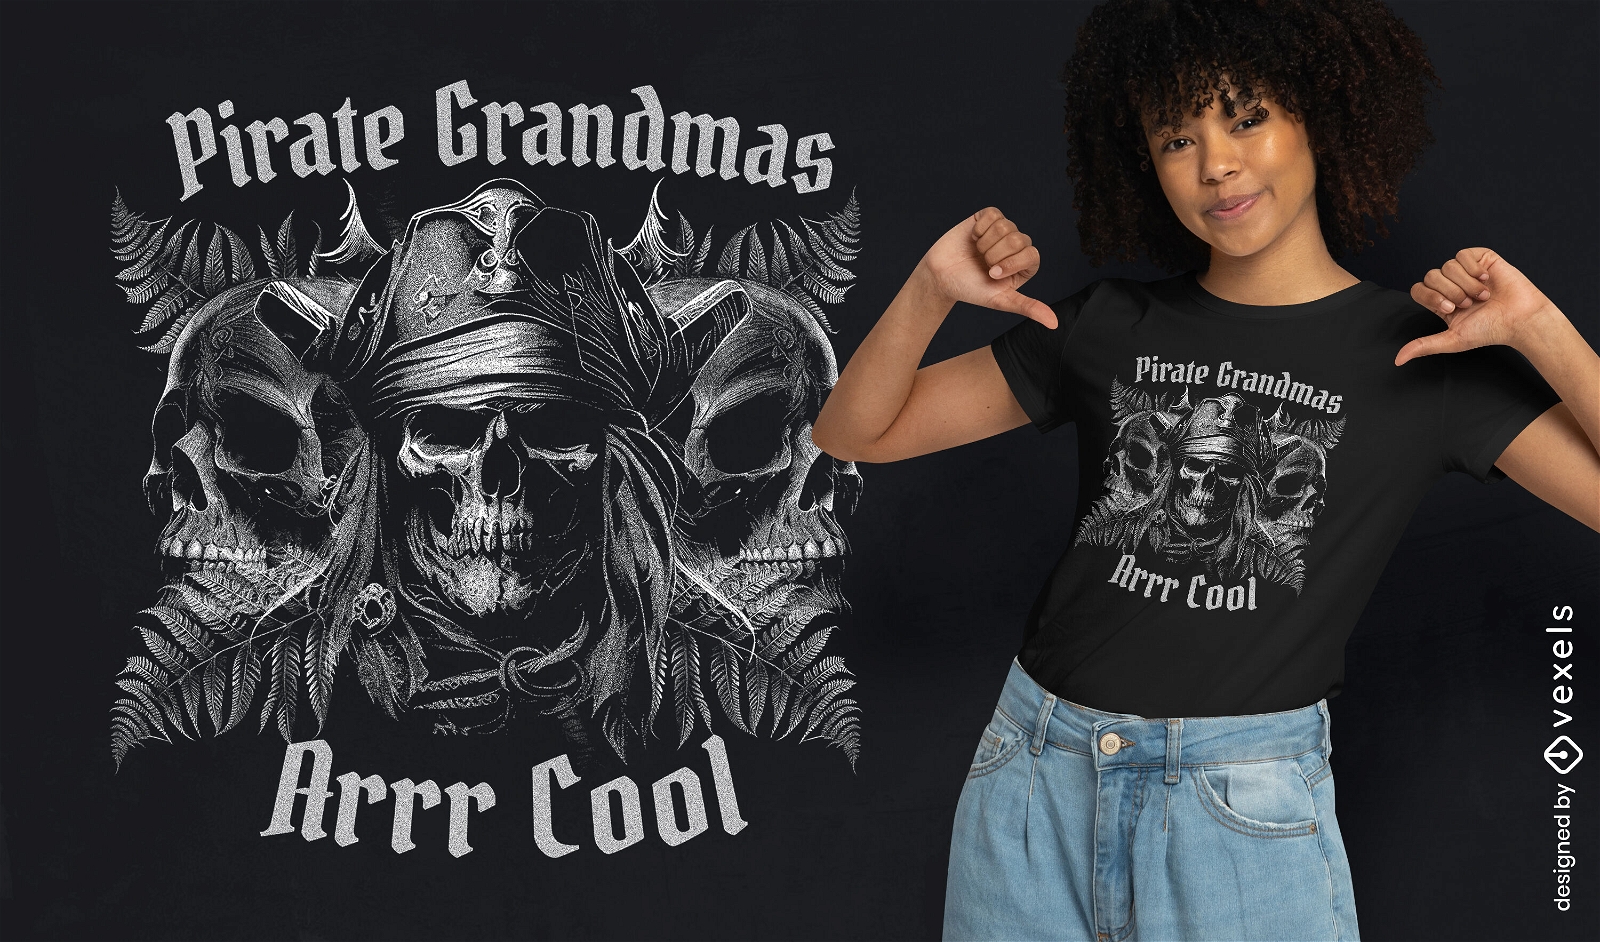
Design de camiseta de caveira pirata
Escolha uma pasta
Todos os favoritos
Criar novo
Salvar
Design de camiseta de caveira pirata
Pronto para imprimir
para Merch
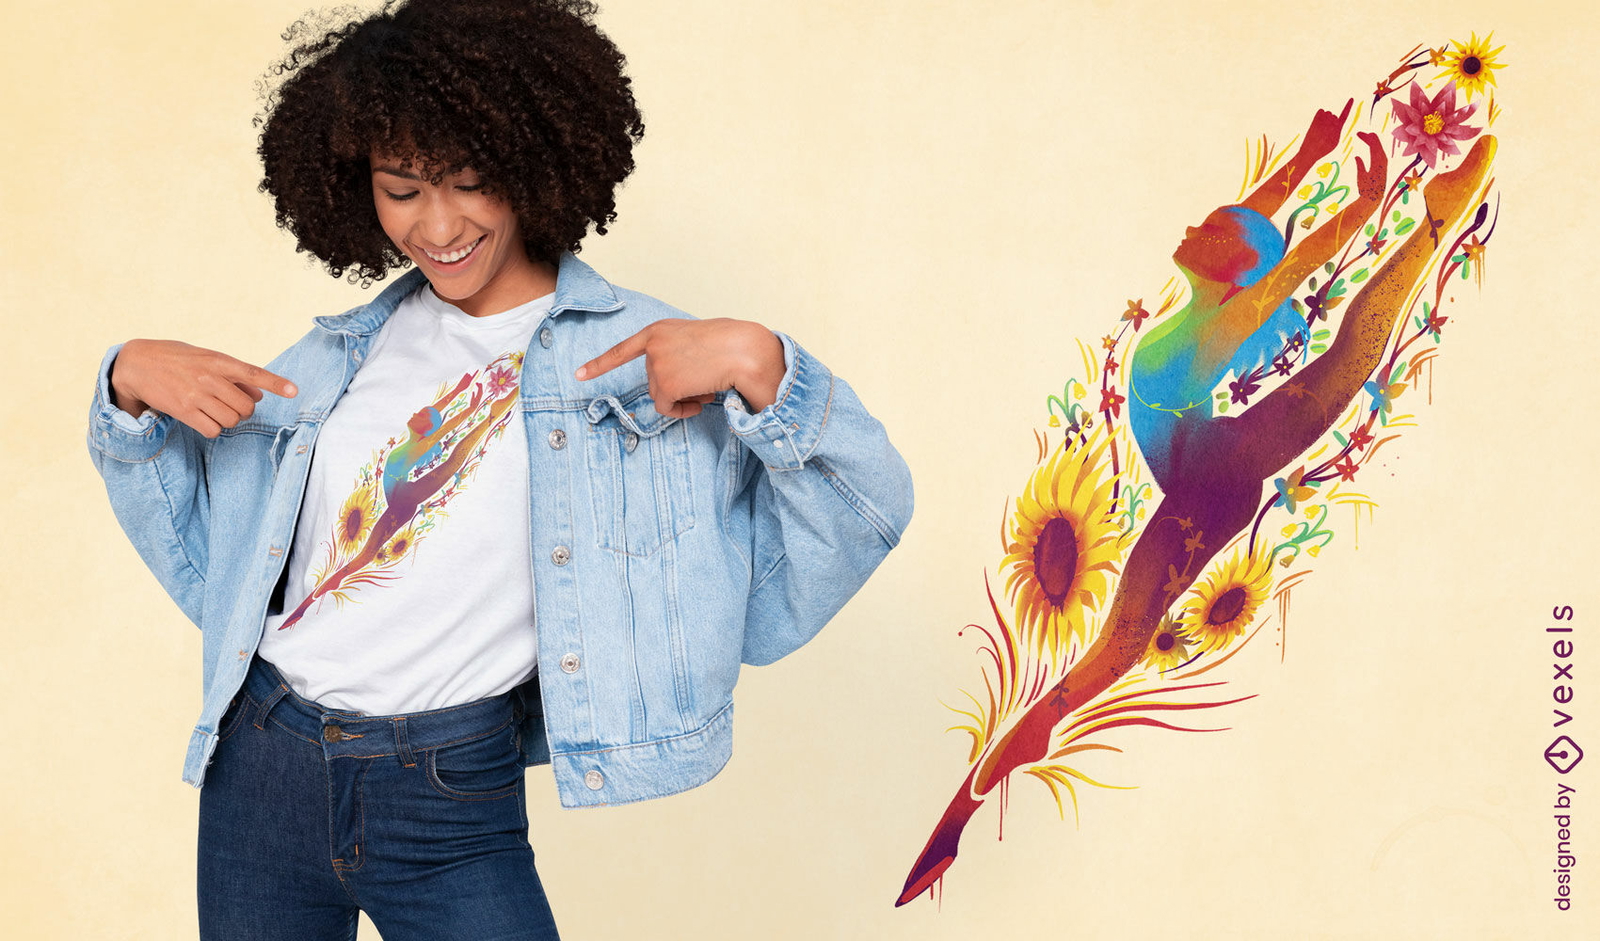
Design de camiseta de dançarina floral
Escolha uma pasta
Todos os favoritos
Criar novo
Salvar
Design de camiseta de dançarina floral
Pronto para imprimir
para Merch
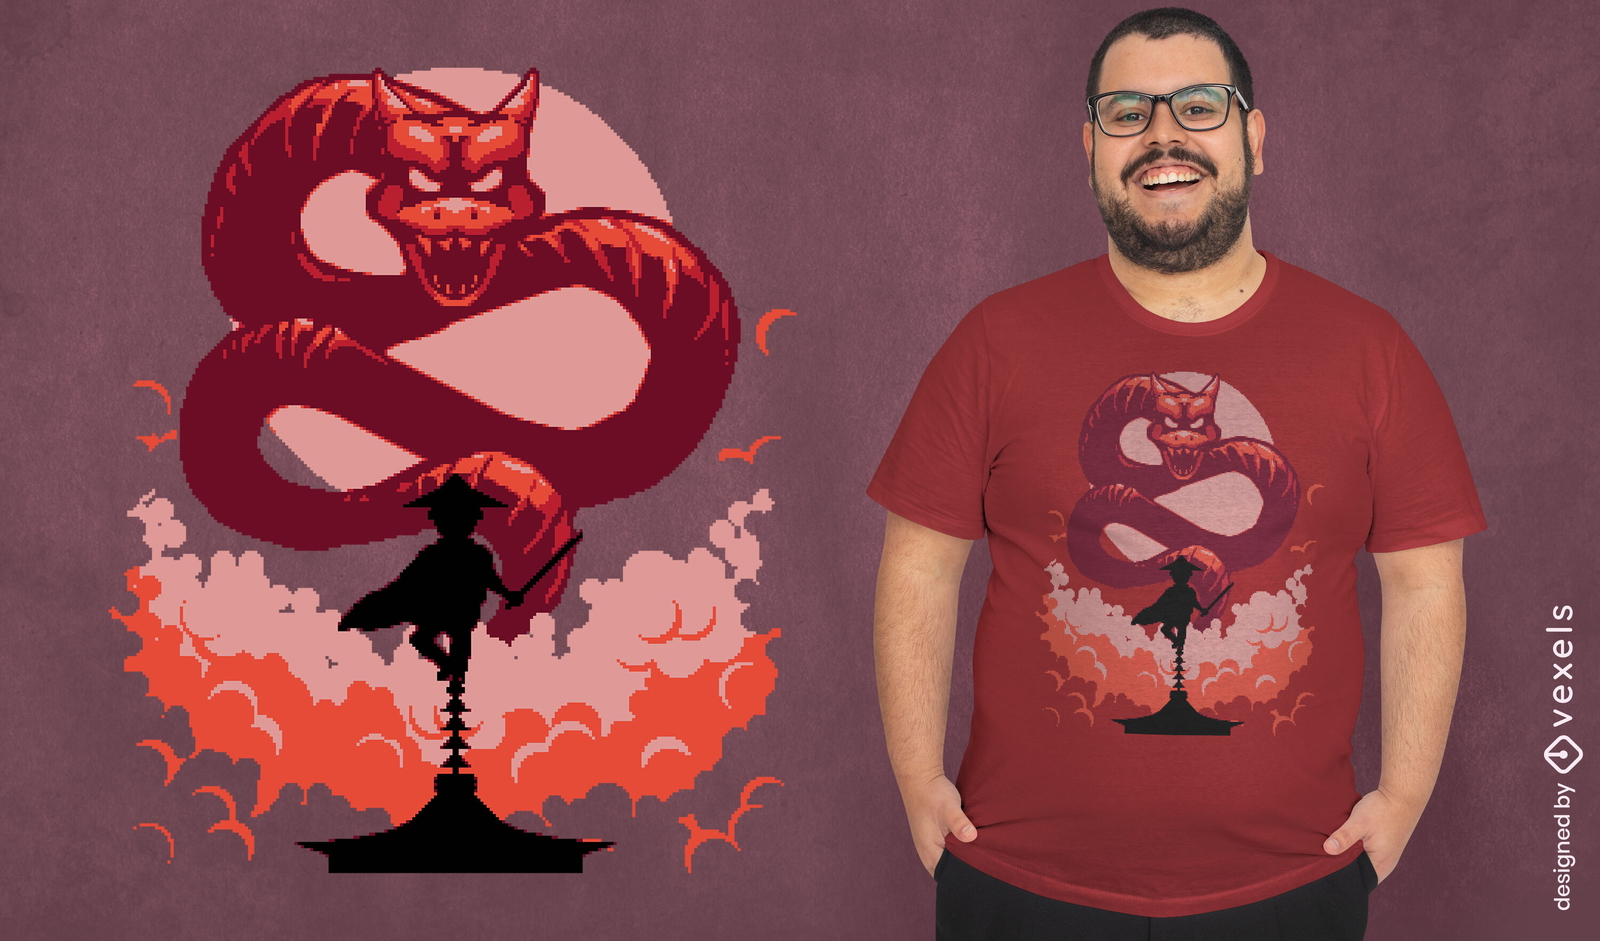
Design de camiseta de samurai e dragão
Escolha uma pasta
Todos os favoritos
Criar novo
Salvar
Design de camiseta de samurai e dragão
Pronto para imprimir
para Merch
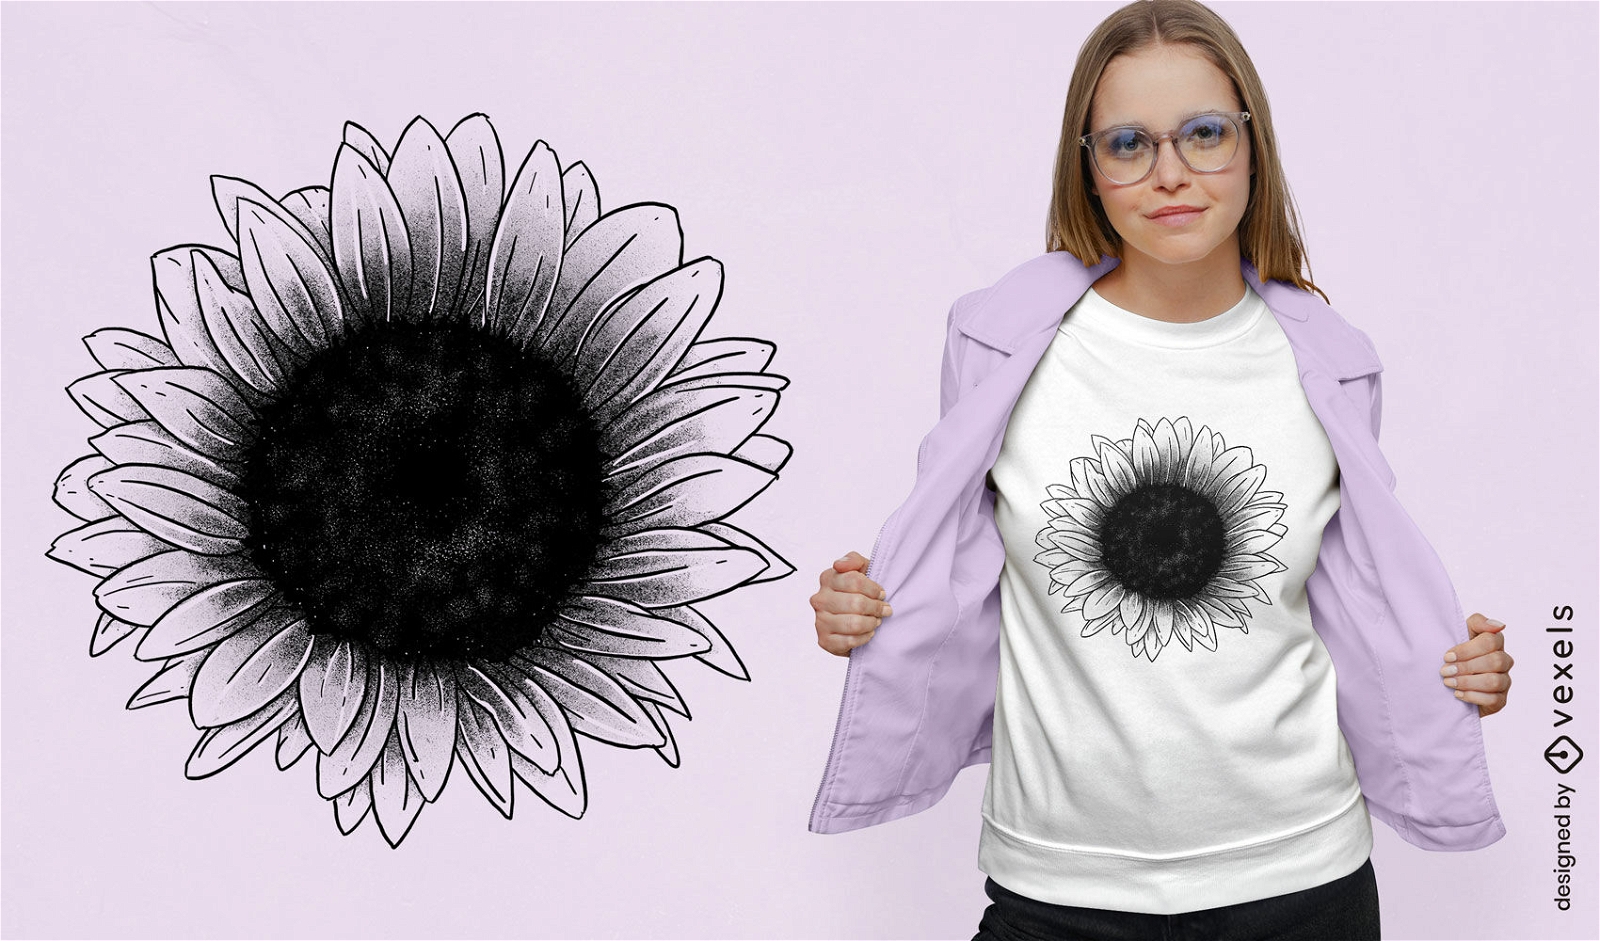
Design de camiseta de girassol preto
Escolha uma pasta
Todos os favoritos
Criar novo
Salvar
Design de camiseta de girassol preto
Pronto para imprimir
para Merch
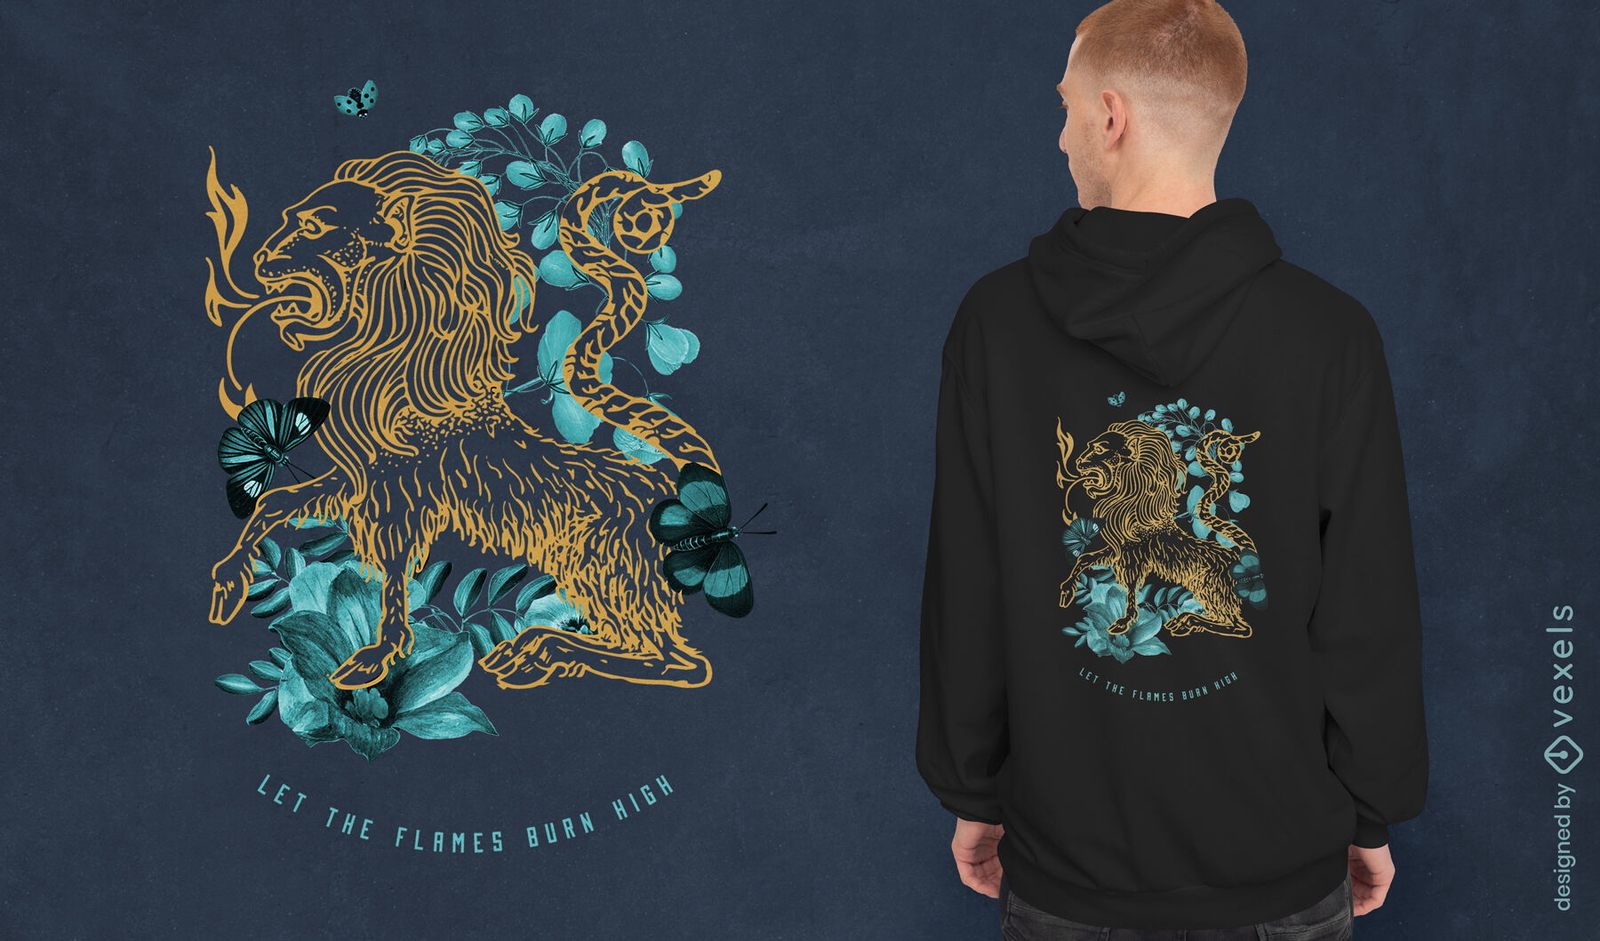
Design de camiseta de arte de linha de fogo de leão respirando
Escolha uma pasta
Todos os favoritos
Criar novo
Salvar
Design de camiseta de arte de linha de fogo de leão respirando
Pronto para imprimir
para Merch
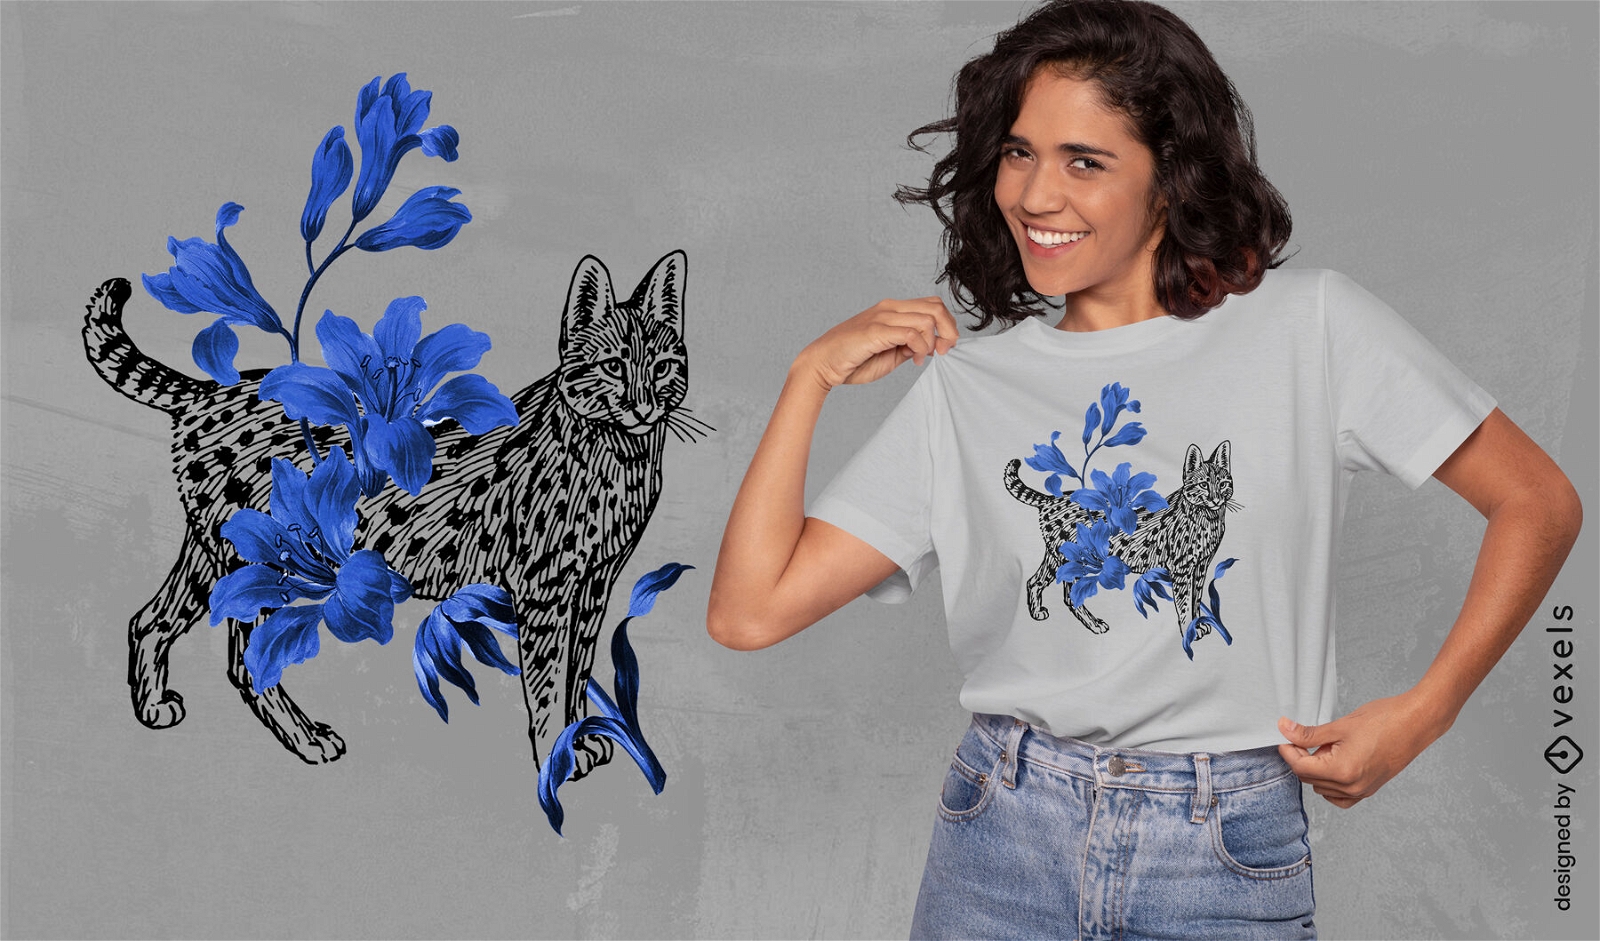
Gato com design de camiseta de flores azuis
Escolha uma pasta
Todos os favoritos
Criar novo
Salvar
Gato com design de camiseta de flores azuis
Pronto para imprimir
para Merch
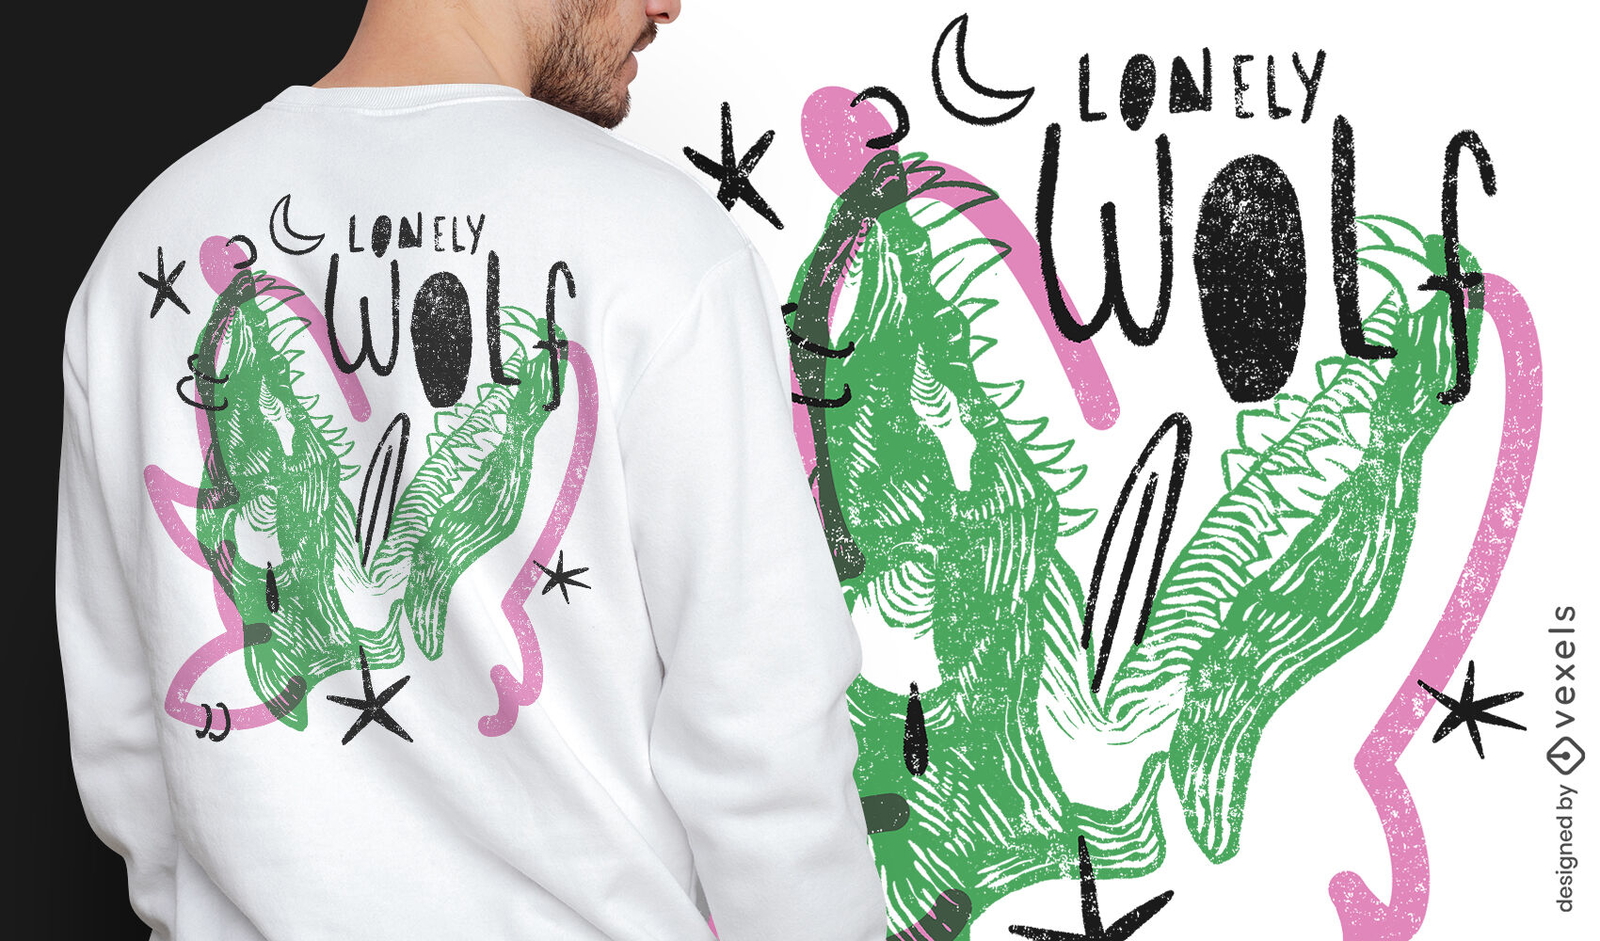
Design de camiseta de caveira de lobo solitário
Escolha uma pasta
Todos os favoritos
Criar novo
Salvar
Design de camiseta de caveira de lobo solitário
texto editável
Pronto para imprimir
para Merch
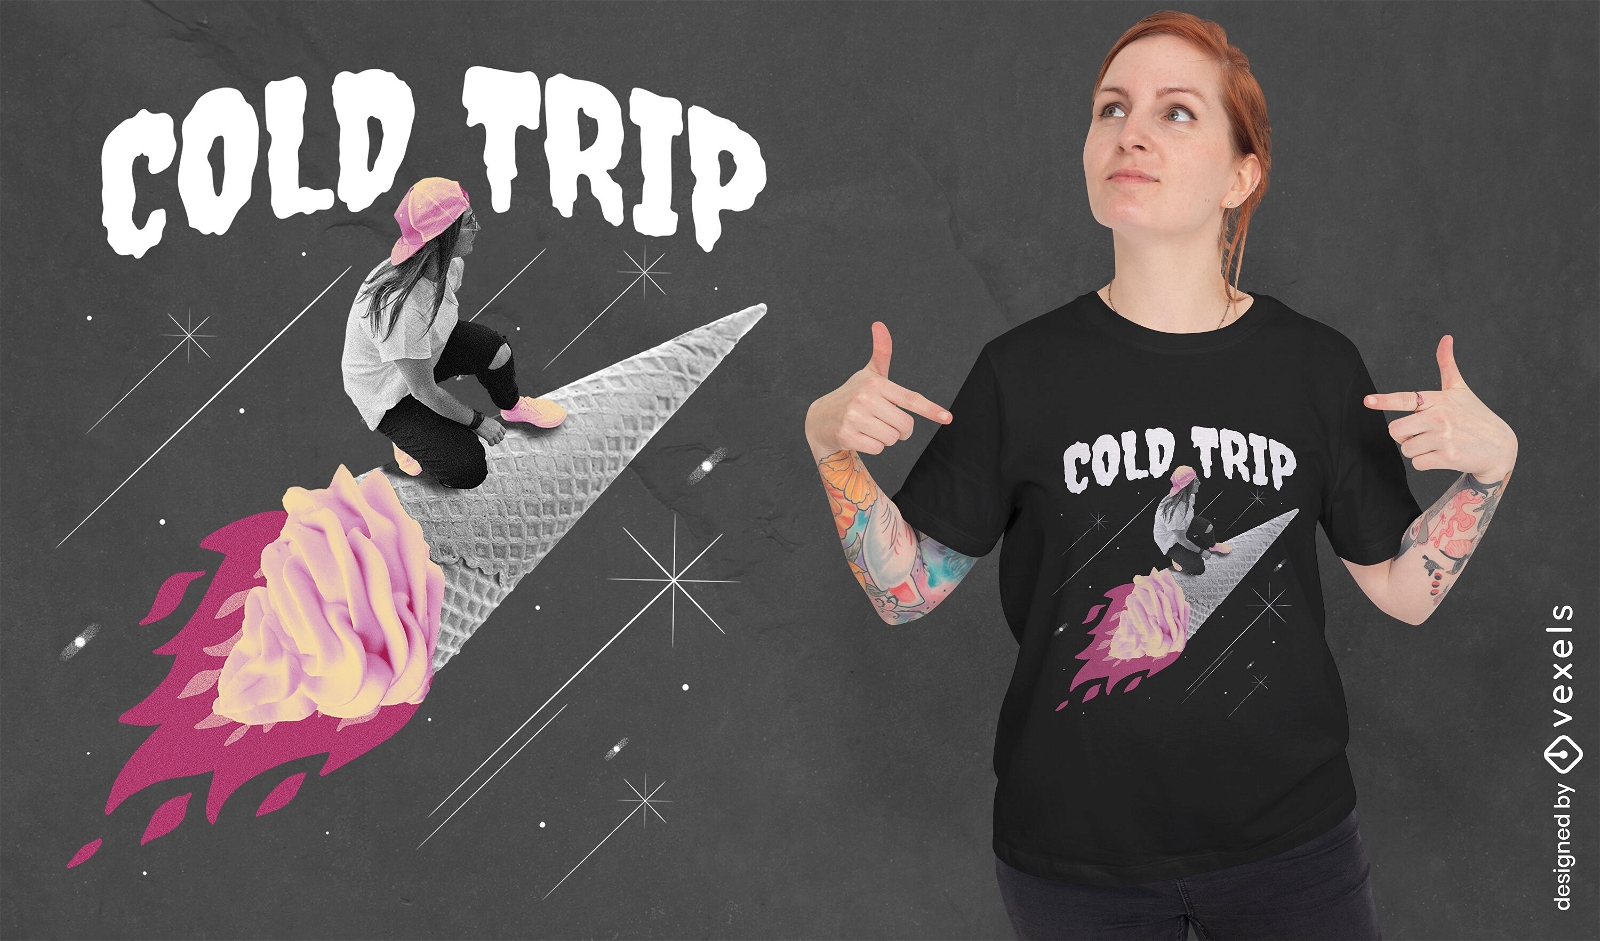
Design de camiseta psd de foguete de sorvete
Escolha uma pasta
Todos os favoritos
Criar novo
Salvar
Design de camiseta psd de foguete de sorvete
Pronto para imprimir
para Merch
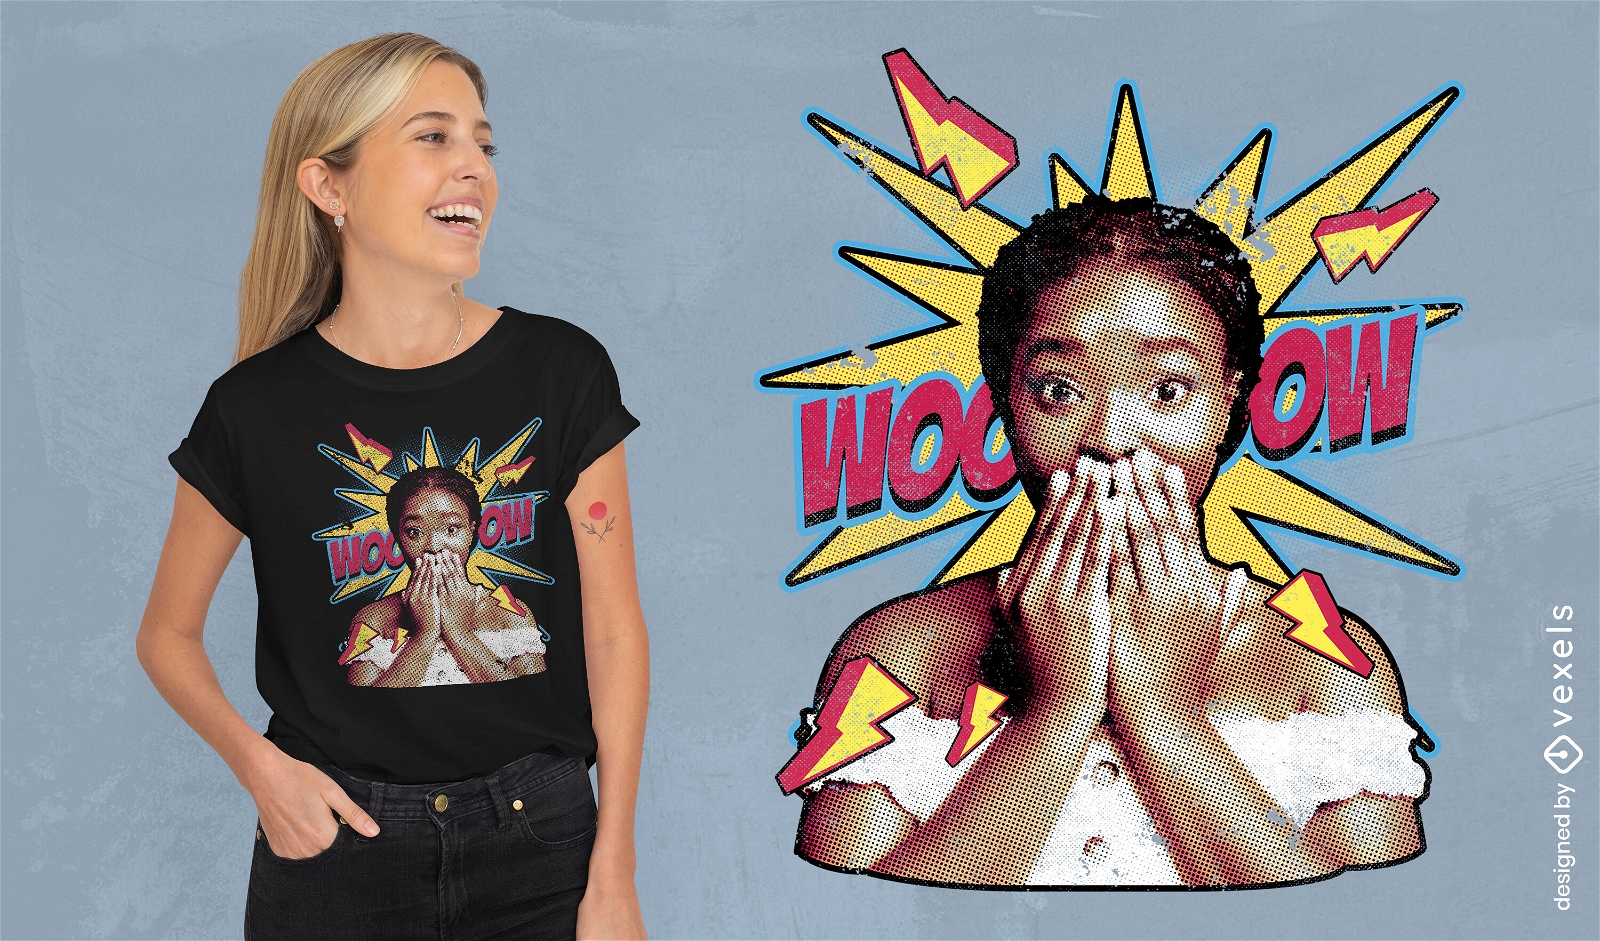
Camiseta em quadrinhos de mulher negra surpresa psd
Escolha uma pasta
Todos os favoritos
Criar novo
Salvar
Camiseta em quadrinhos de mulher negra surpresa psd
Pronto para imprimir
para Merch
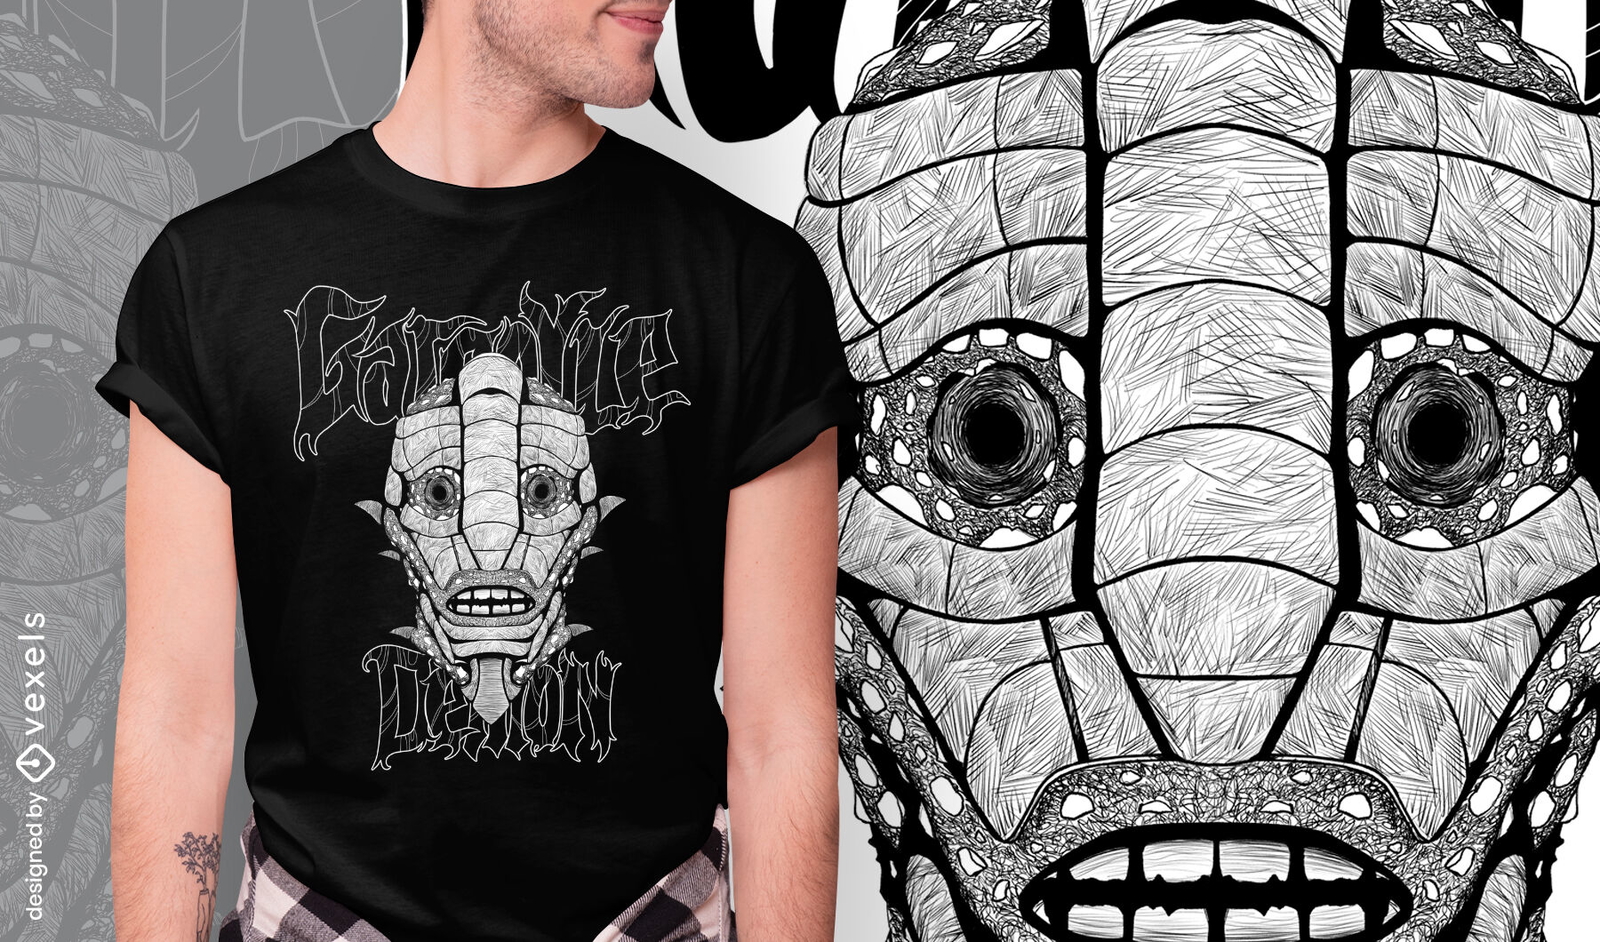
Camiseta horripilante de monstro gárgula desenhada à mão psd
Escolha uma pasta
Todos os favoritos
Criar novo
Salvar
Camiseta horripilante de monstro gárgula desenhada à mão psd
Pronto para imprimir
para Merch
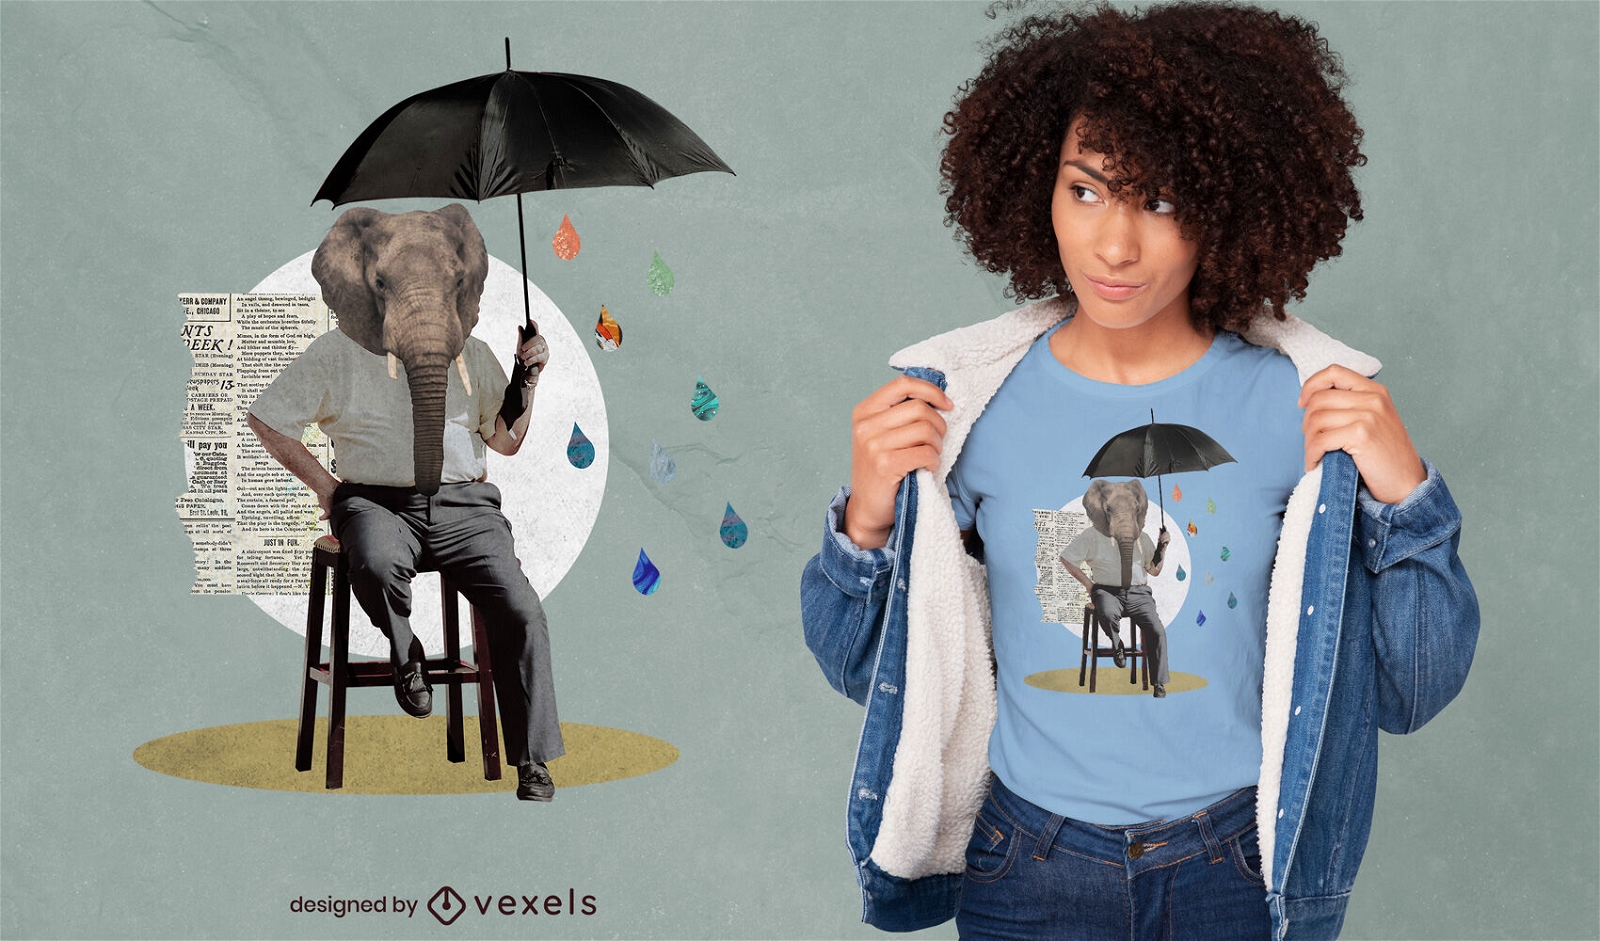
Homem elefante com design de camiseta psd guarda-chuva
Escolha uma pasta
Todos os favoritos
Criar novo
Salvar
Homem elefante com design de camiseta psd guarda-chuva
Pronto para imprimir
para Merch
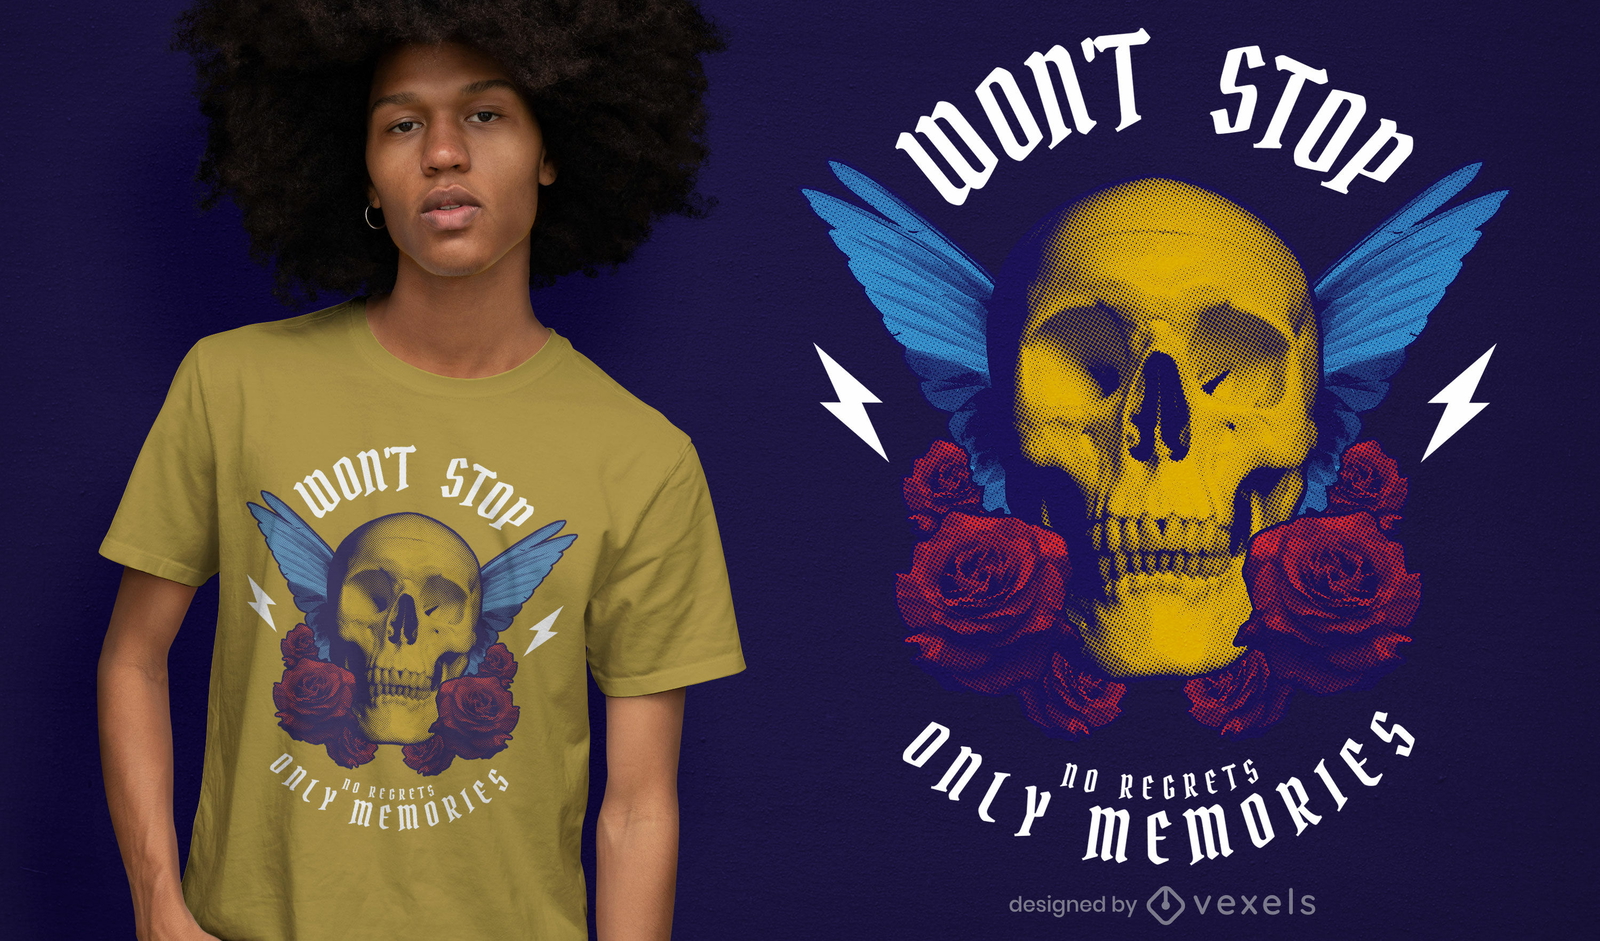
Camiseta fotográfica com crânio alado psd
Escolha uma pasta
Todos os favoritos
Criar novo
Salvar
Camiseta fotográfica com crânio alado psd
Pronto para imprimir
para Merch
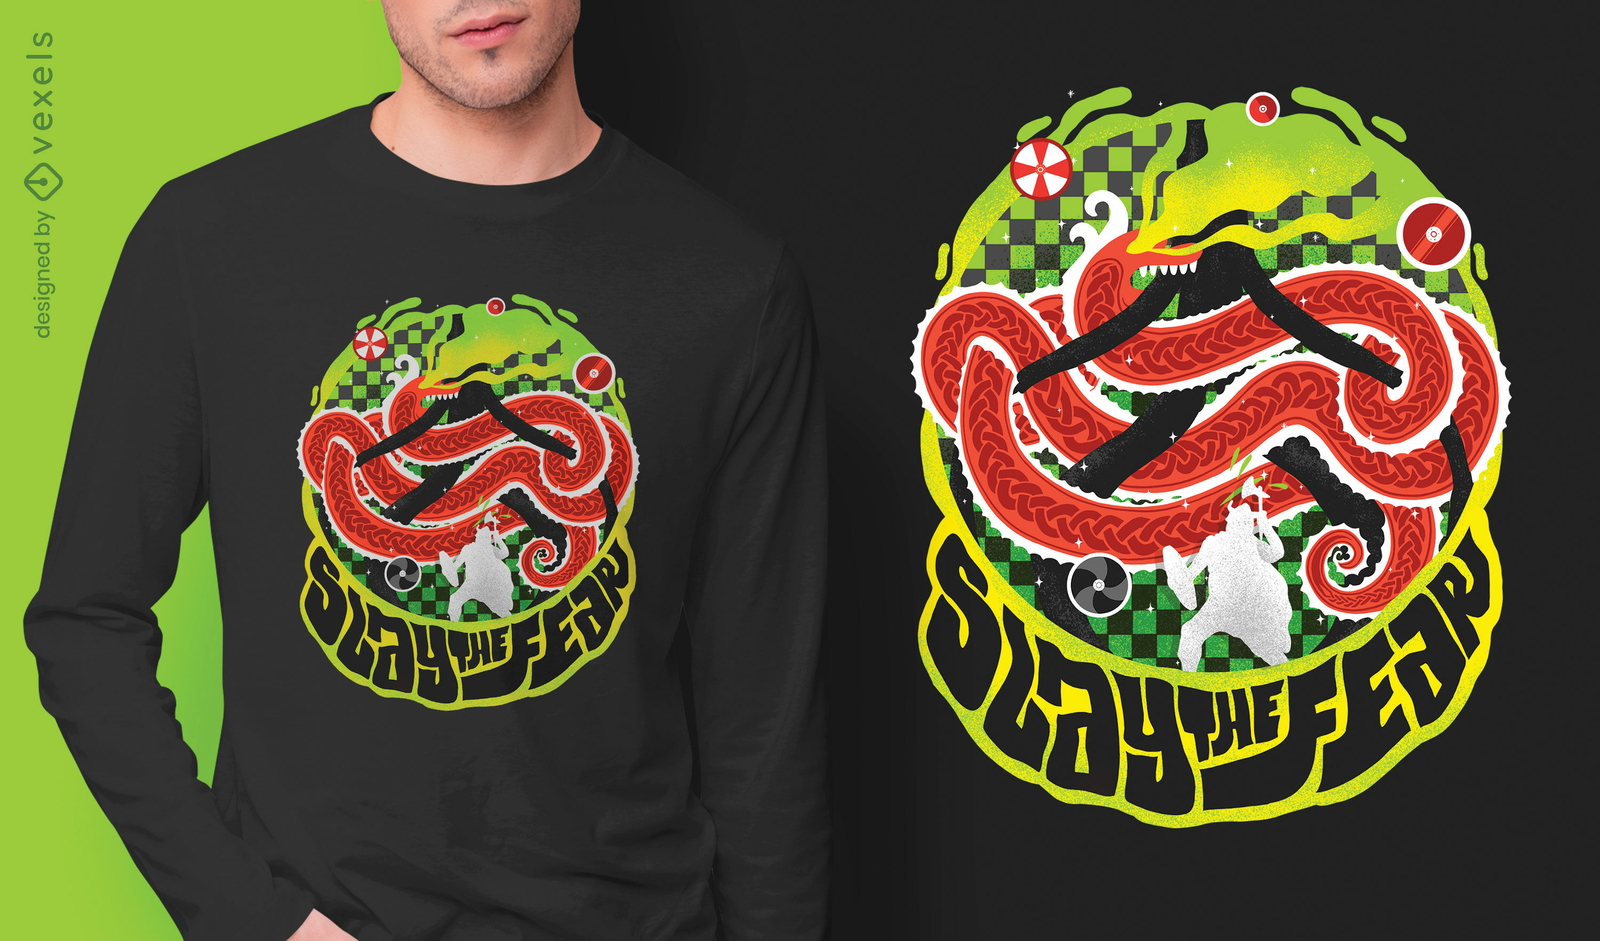
Mate o medo do design da camiseta psd
Escolha uma pasta
Todos os favoritos
Criar novo
Salvar
Mate o medo do design da camiseta psd
Pronto para imprimir
para Merch
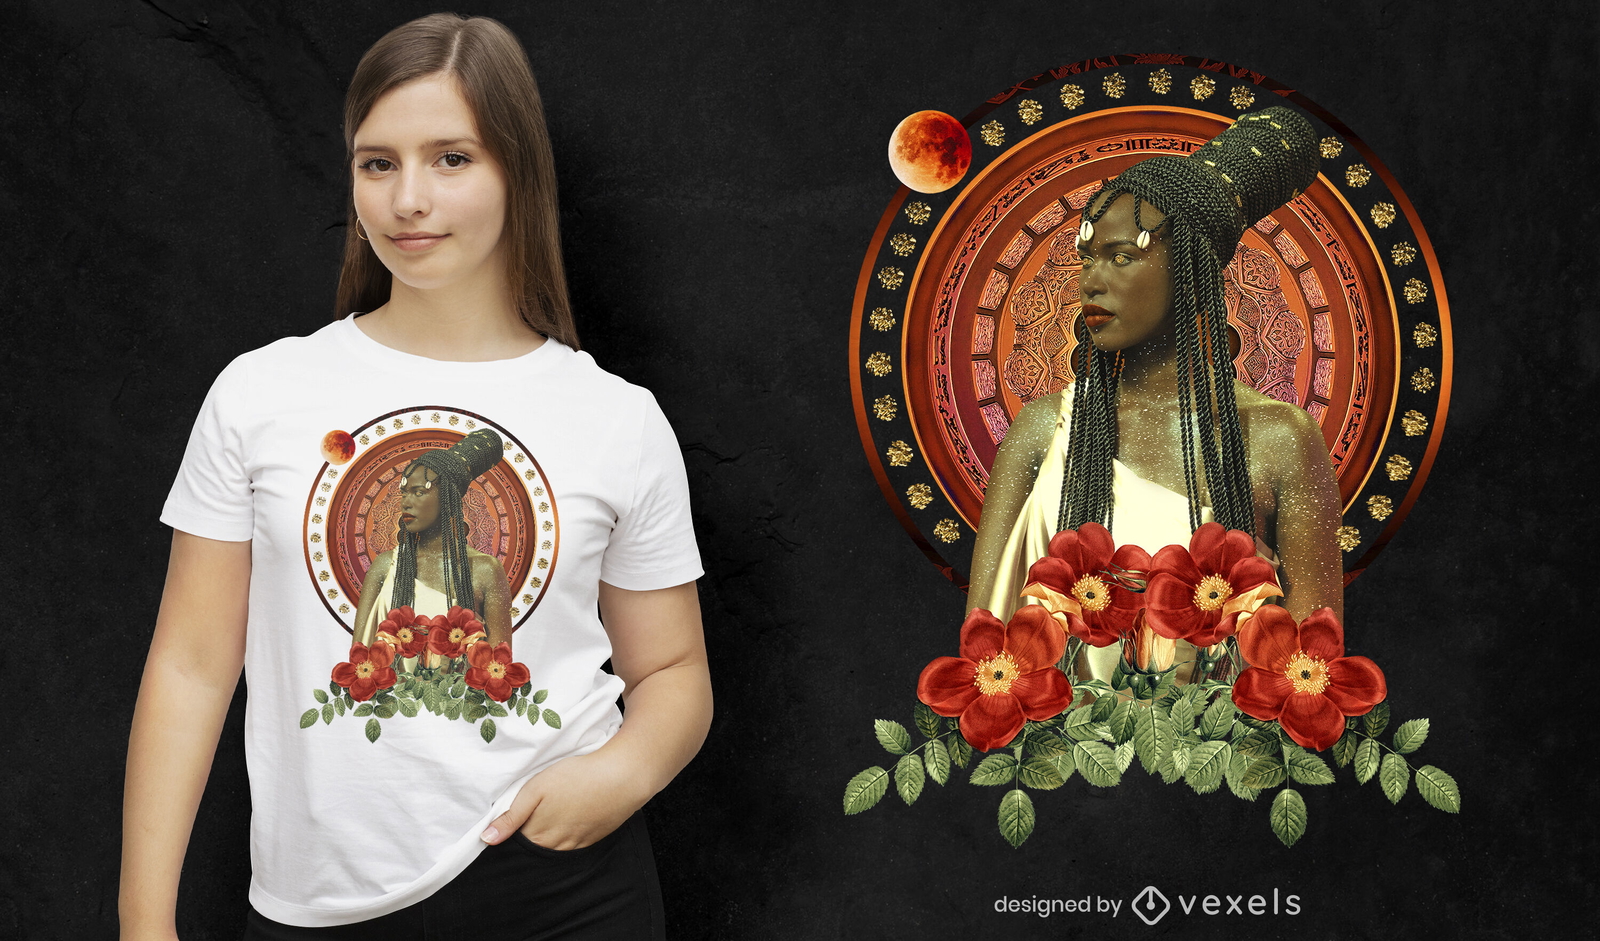
Camiseta fotográfica de mulher exótica psd
Escolha uma pasta
Todos os favoritos
Criar novo
Salvar
Camiseta fotográfica de mulher exótica psd
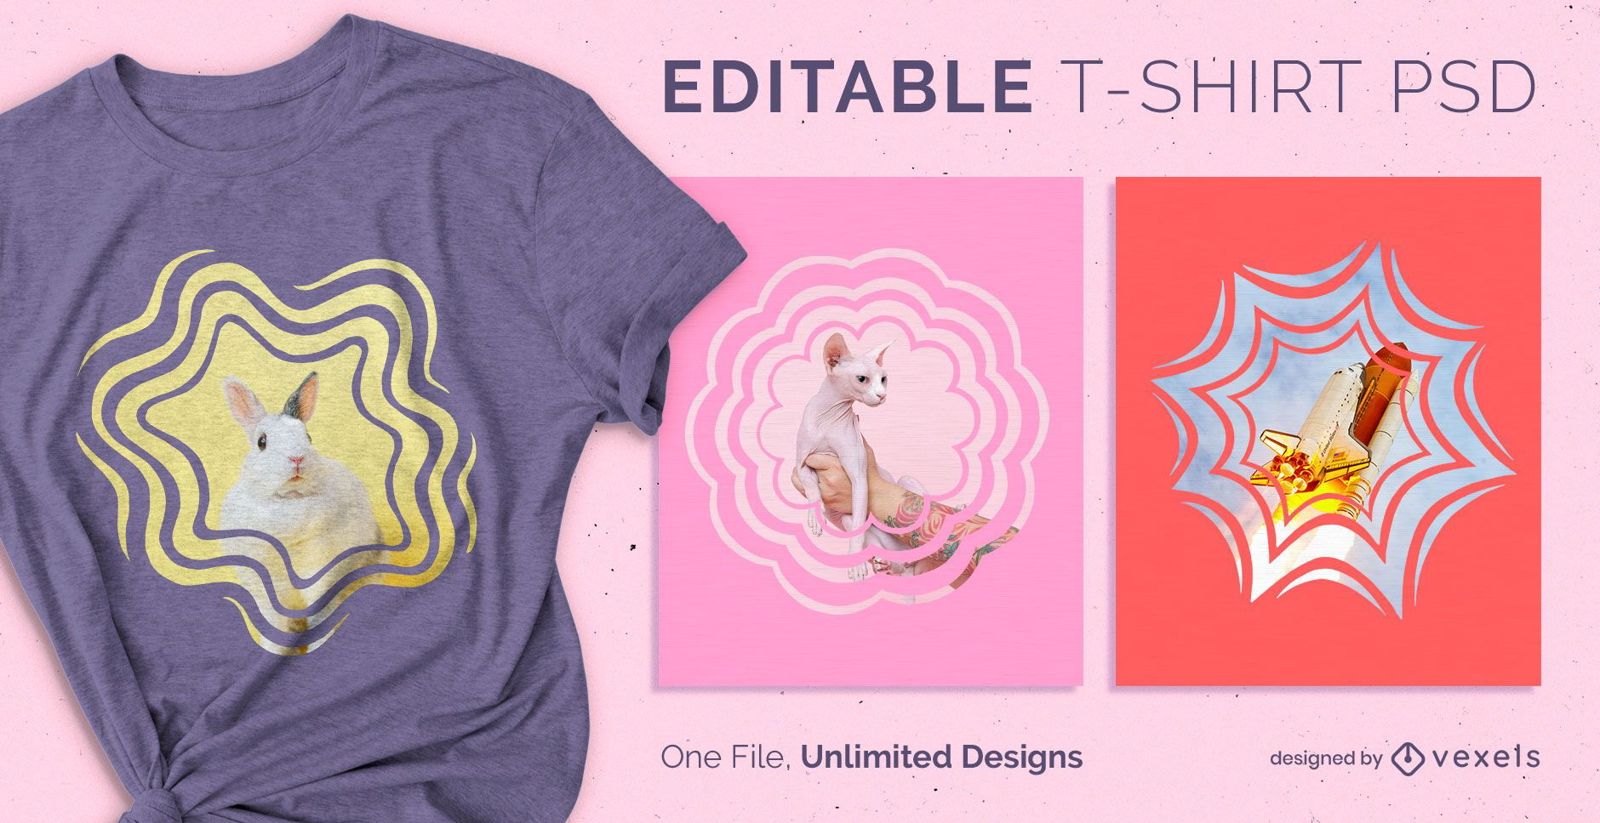
Camiseta PSD escalável
para Merch
T-shirt escalável distorção psd
Escolha uma pasta
Todos os favoritos
Criar novo
Salvar
T-shirt escalável distorção psd
Pronto para imprimir
para Merch
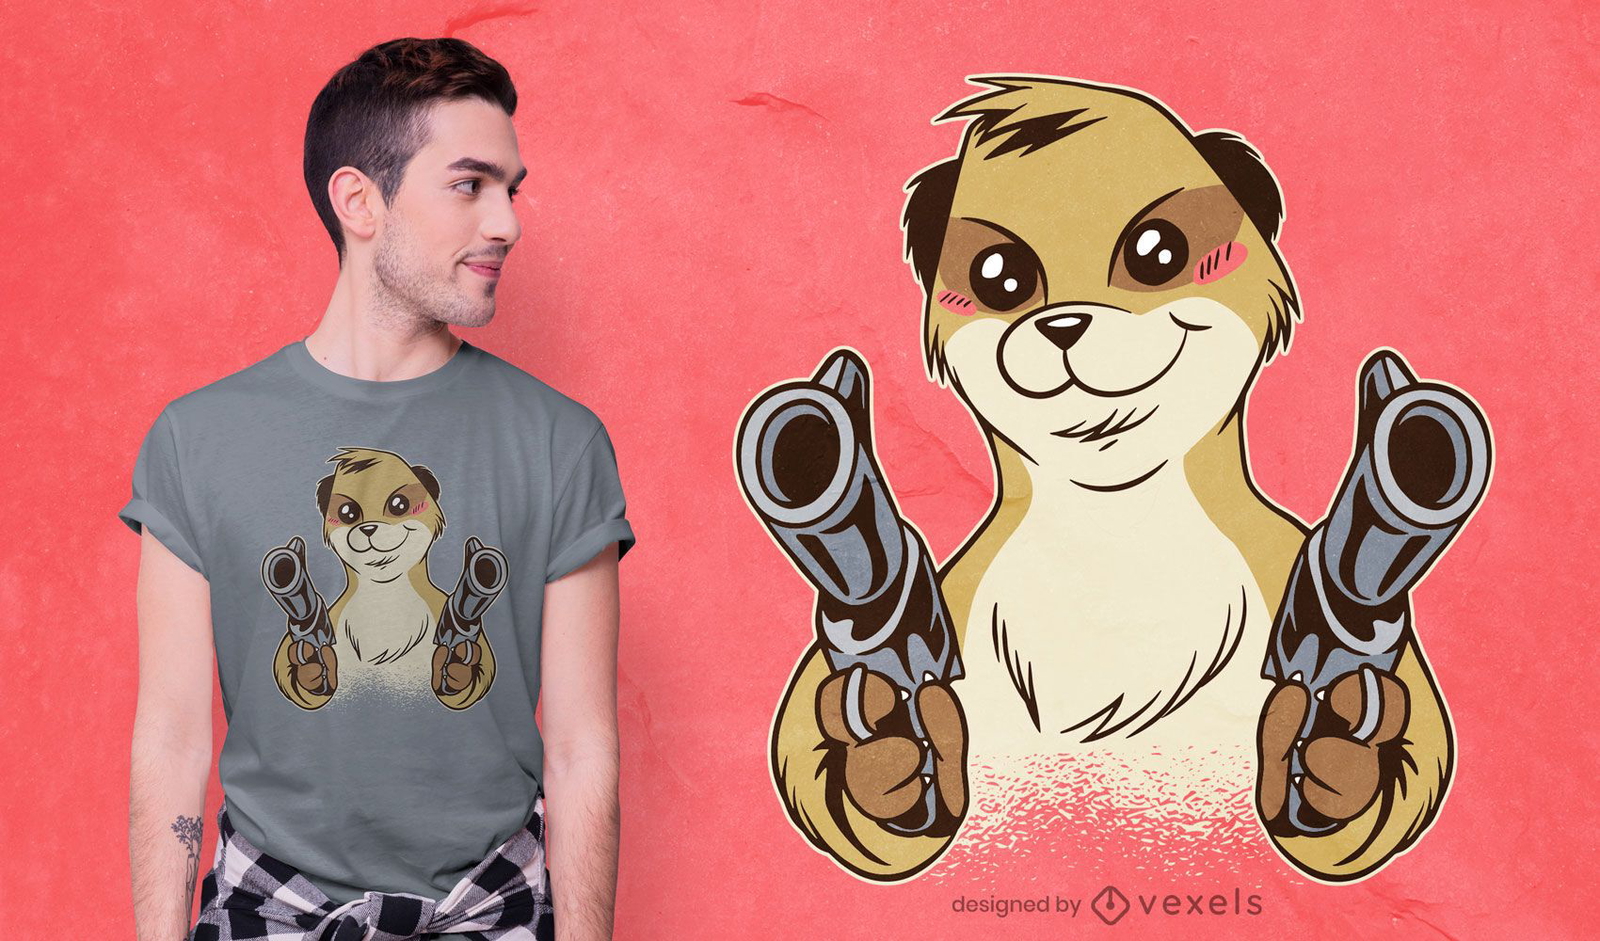
Design de camiseta Meerkat de empunhadura dupla
Escolha uma pasta
Todos os favoritos
Criar novo
Salvar
Design de camiseta Meerkat de empunhadura dupla
Pronto para imprimir
para Merch
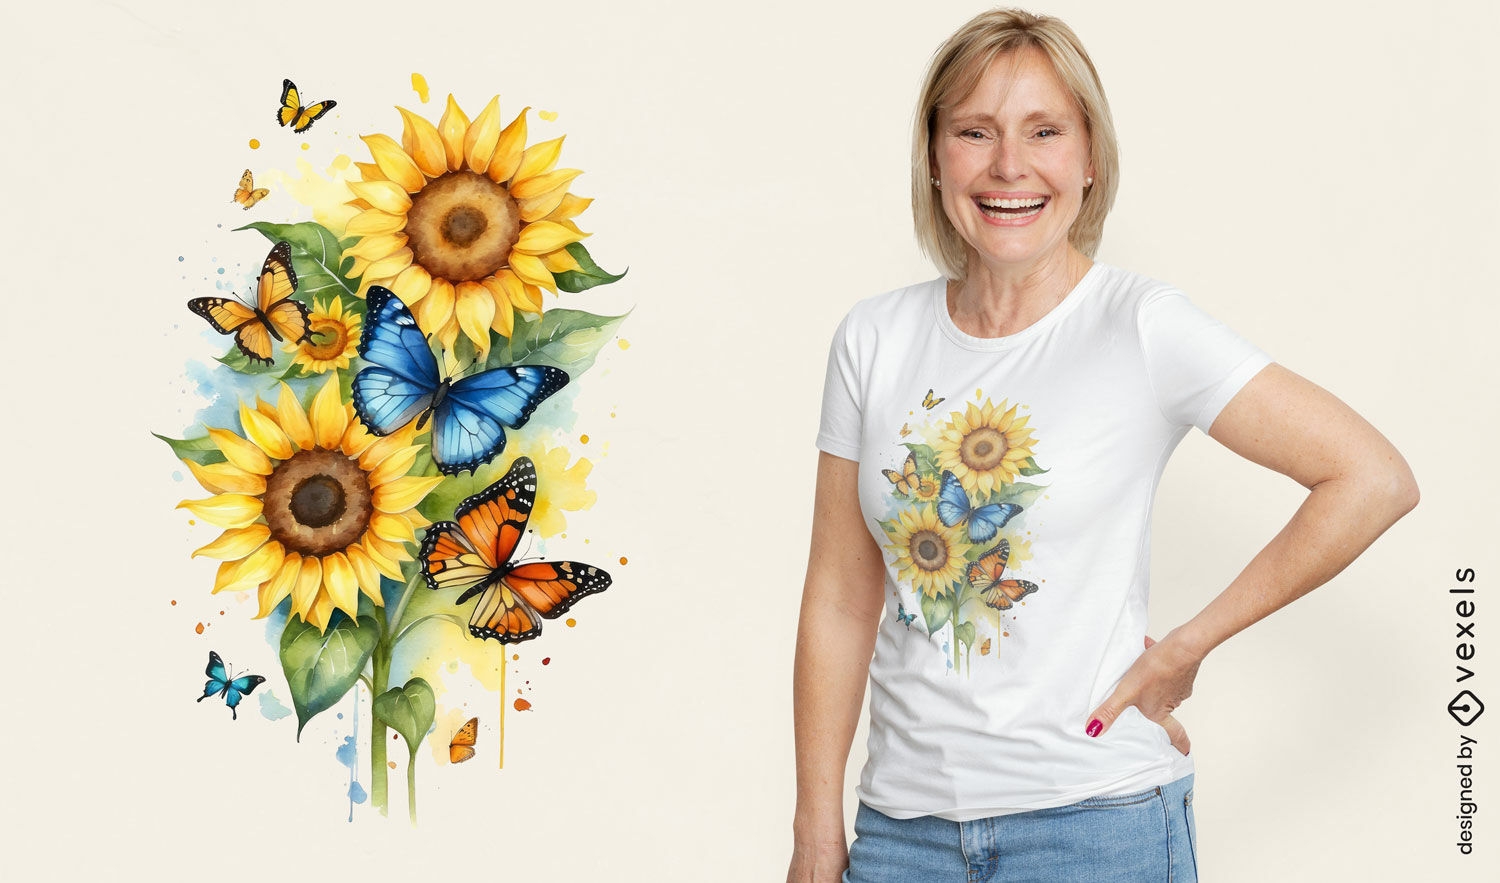
Design de camiseta com girassol e borboleta
Escolha uma pasta
Todos os favoritos
Criar novo
Salvar
Design de camiseta com girassol e borboleta
Gerado por IA, selecionado por nossos designers.
para Merch
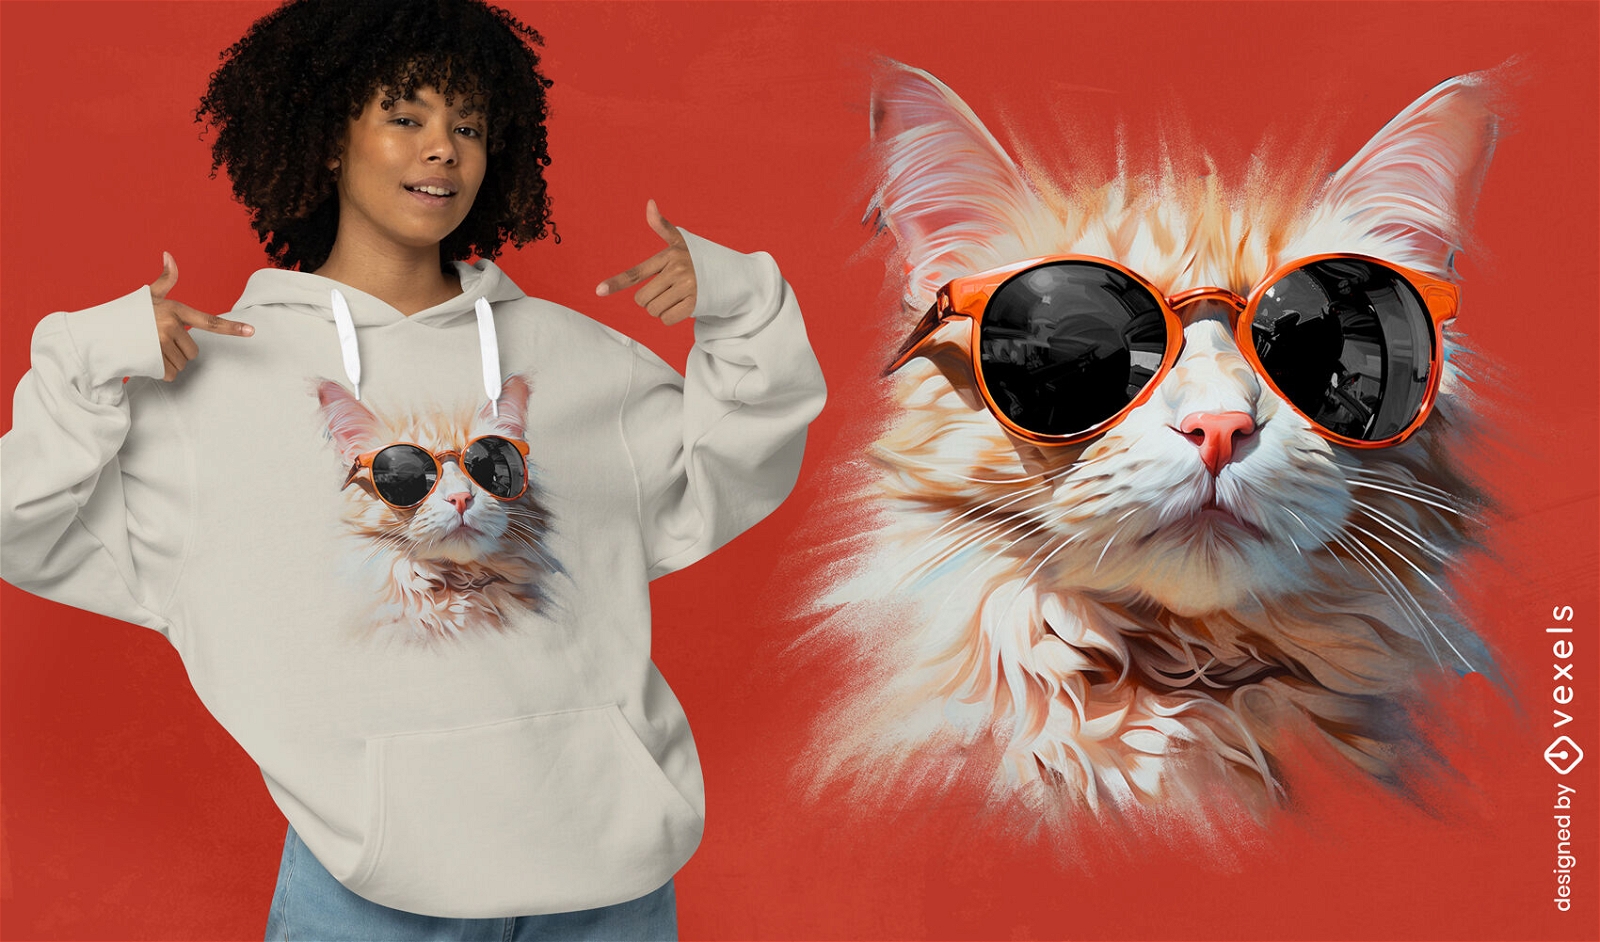
Gato realista com design de camiseta com ?culos de sol
Escolha uma pasta
Todos os favoritos
Criar novo
Salvar
Gato realista com design de camiseta com ?culos de sol
Gerado por IA, selecionado por nossos designers.
para Merch
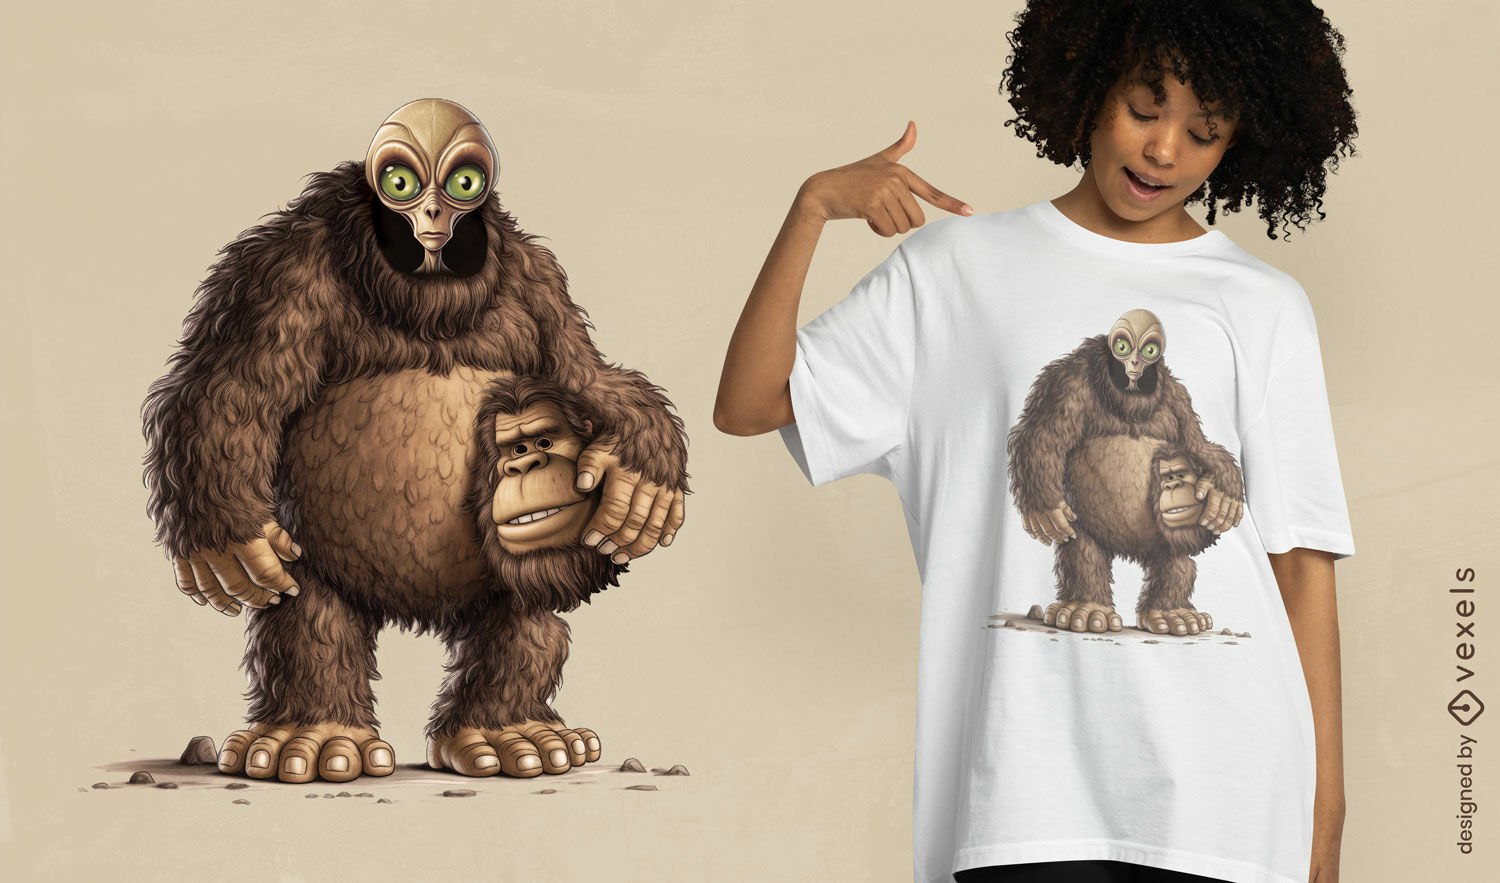
Design de camiseta com fantasia de Alien com Pé Grande
Escolha uma pasta
Todos os favoritos
Criar novo
Salvar
Design de camiseta com fantasia de Alien com Pé Grande
Gerado por IA, selecionado por nossos designers.
para Merch
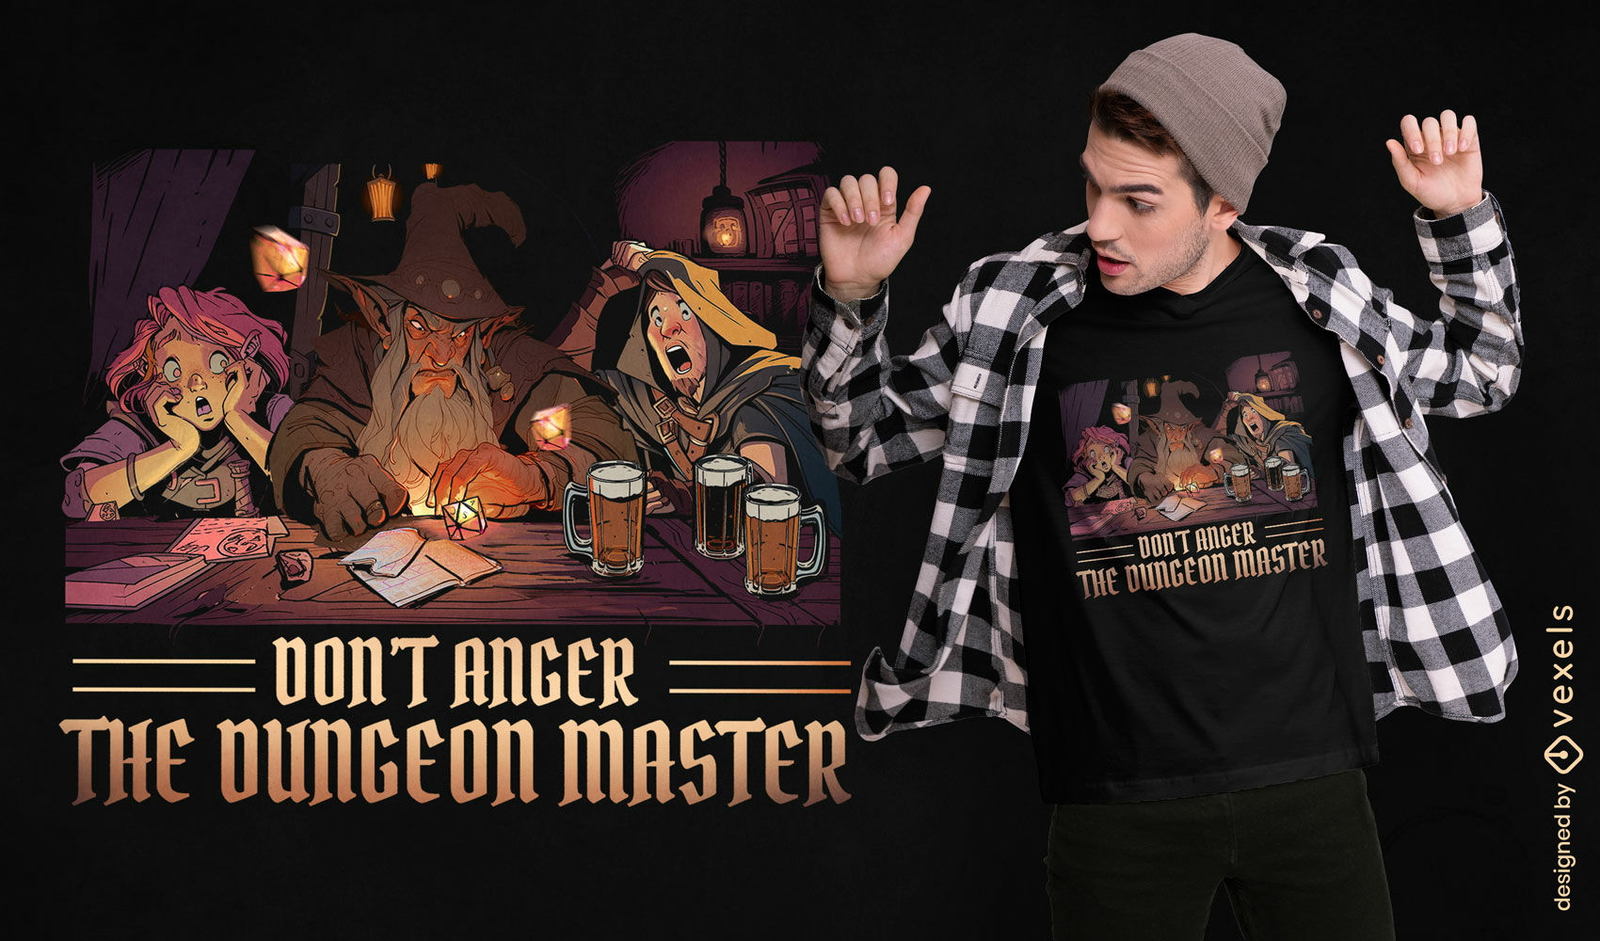
Design de camiseta com cita??o de jogo Dungeon Master
Escolha uma pasta
Todos os favoritos
Criar novo
Salvar
Design de camiseta com cita??o de jogo Dungeon Master
Gerado por IA, selecionado por nossos designers.
para Merch
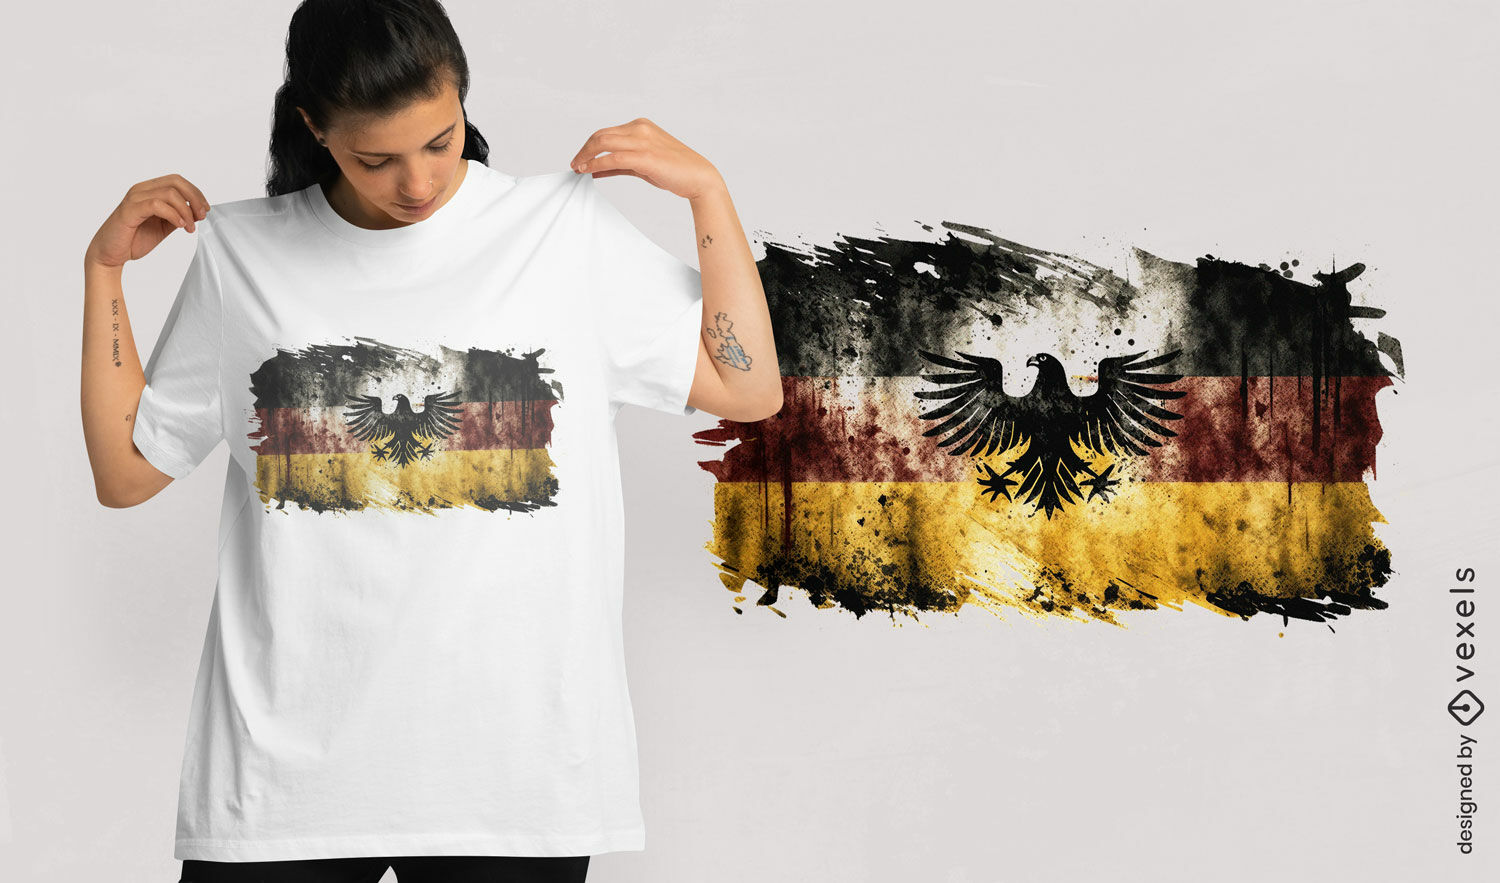
Design de camiseta com bandeira alemã e águia
Escolha uma pasta
Todos os favoritos
Criar novo
Salvar
Design de camiseta com bandeira alemã e águia
Impulsione seu negócio
Com a plataforma gráfica líder de mercado.
Ver planos
Próxima
do 67
prev page
next page