Biblioteca de design
Novos designs Merch
Camisetas
Vectores
Designs de Merch de Tendência
PNGs & SVGs
Mockups
Modelos de T-Shirt PSD
Explorar Desenhos
Designs KDP
Pôsteres
Canecas
Capas para celular
Sacos de compras
Almofadas
Ferramentas de desenho
Merch Designer
Novo!
Mockup Generator
Gerador de Design de AI
Vetorizador
Quote Generator
T-Shirt Maker (Antigo)
Ajuda
Merch Digest
Blog
Centro de Ajuda
Saiba mais sobre o Merch
Feedback
Soluções Corporativas
Empresa
Acesso à API
Estúdio de Design
Design em Lote
Preços
Carregando...
Inscrever-se
Conecte-se
PSD Templates
graficos
Biblioteca de design
Novos designs Merch
Camisetas
Vectores
Designs de Merch de Tendência
PNGs & SVGs
Mockups
Modelos de T-Shirt PSD
Explorar Desenhos
Designs KDP
Pôsteres
Canecas
Capas para celular
Sacos de compras
Almofadas
Ferramentas de desenho
Merch Designer
Novo!
Mockup Generator
Gerador de Design de AI
Vetorizador
Quote Generator
T-Shirt Maker (Antigo)
Ajuda
Merch Digest
Blog
Centro de Ajuda
Saiba mais sobre o Merch
Feedback
Soluções Corporativas
Empresa
Acesso à API
Estúdio de Design
Design em Lote
PLANOS
PSD Templates
graficos
3312 Designs de Camisetas e Mockups PSD de graficos
Baixar designs de camisetas ou mockups PSD editáveis de graficos
Relacionado:
graficos vetoriais
,
desenhos graficos de ações
,
graficos tridimensionais
Ordenar por
Mais relevante
Resultados patrocinados da
Ganhe 15% de desconto com o código: VEXELS15
veja mais detalhes
texto editável
Pronto para imprimir
para Merch
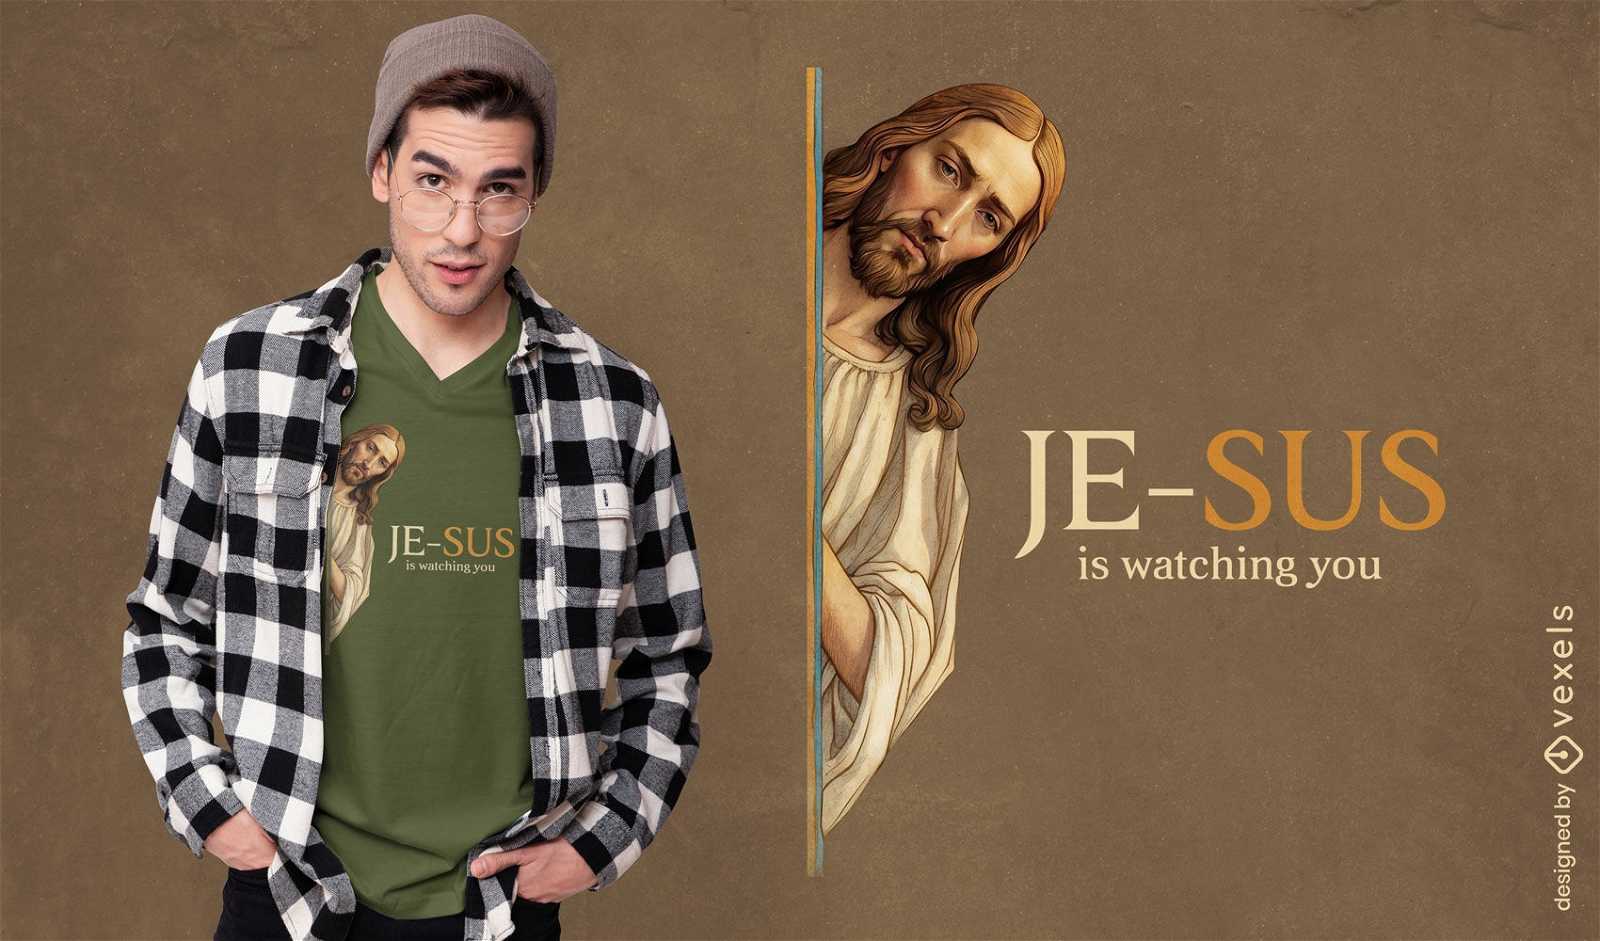
Design de camiseta espiritual vigilante Jesus
Escolha uma pasta
Todos os favoritos
Criar novo
Salvar
Design de camiseta espiritual vigilante Jesus
Gerado por IA, selecionado por nossos designers.
para Merch
Gato cowboy com design de camiseta com chap?u
Escolha uma pasta
Todos os favoritos
Criar novo
Salvar
Gato cowboy com design de camiseta com chap?u
Gerado por IA, selecionado por nossos designers.
para Merch
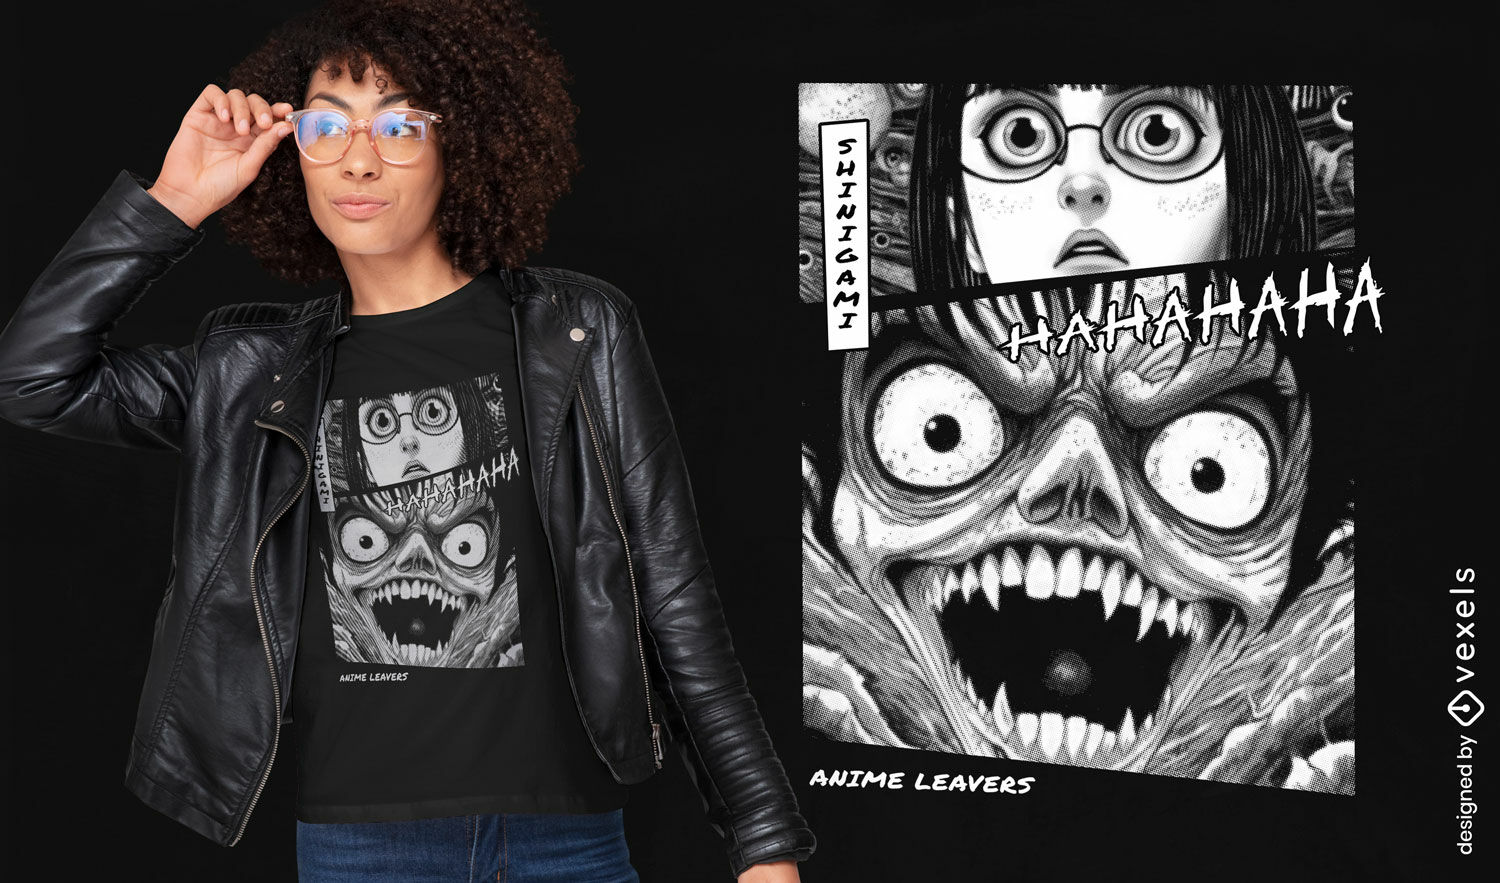
Design de camiseta com cara de dem?nio anime
Escolha uma pasta
Todos os favoritos
Criar novo
Salvar
Design de camiseta com cara de dem?nio anime
Gerado por IA, selecionado por nossos designers.
para Merch
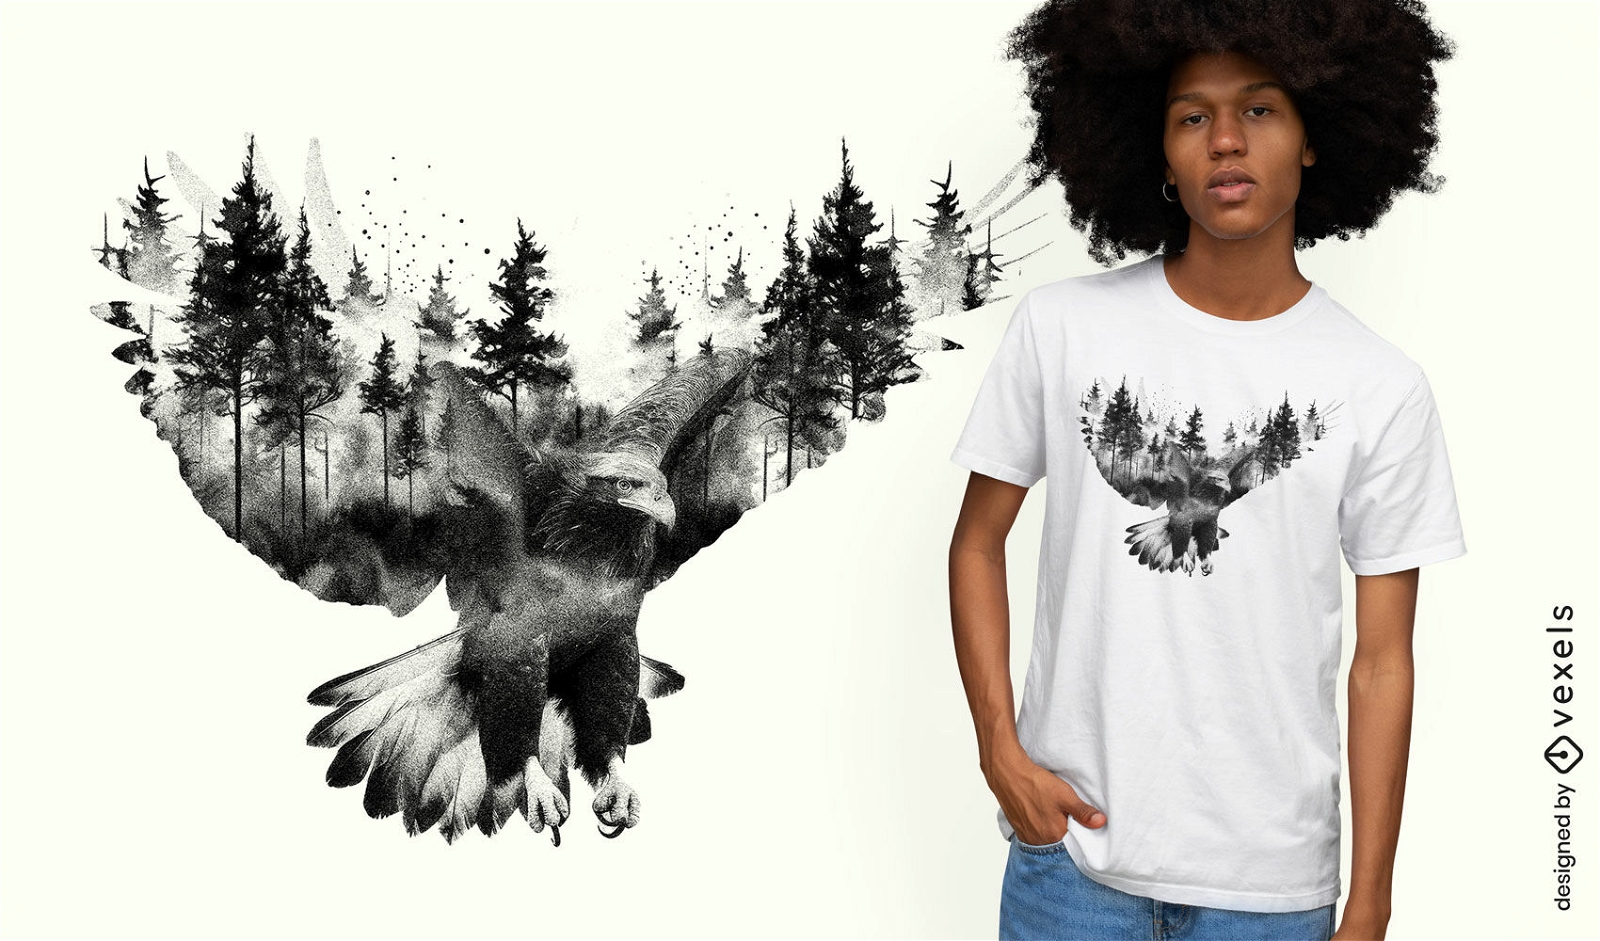
Design de camiseta com floresta e ?guia voadora
Escolha uma pasta
Todos os favoritos
Criar novo
Salvar
Design de camiseta com floresta e ?guia voadora
Pronto para imprimir
para Merch
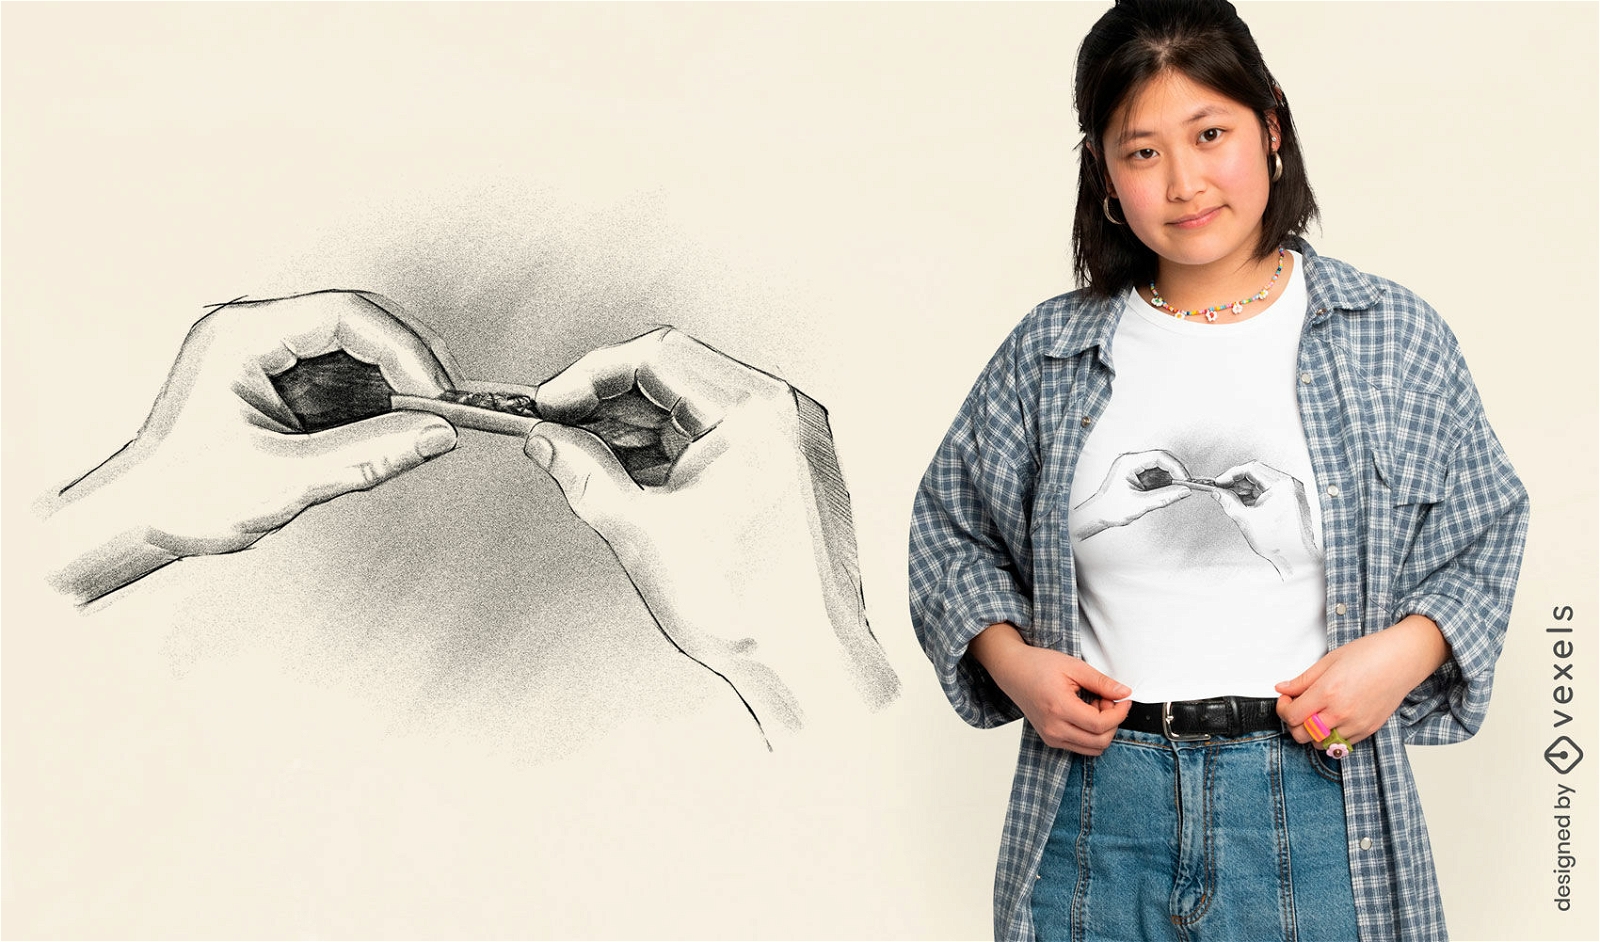
Design de camiseta de tabaco
Escolha uma pasta
Todos os favoritos
Criar novo
Salvar
Design de camiseta de tabaco
texto editável
Pronto para imprimir
para Merch
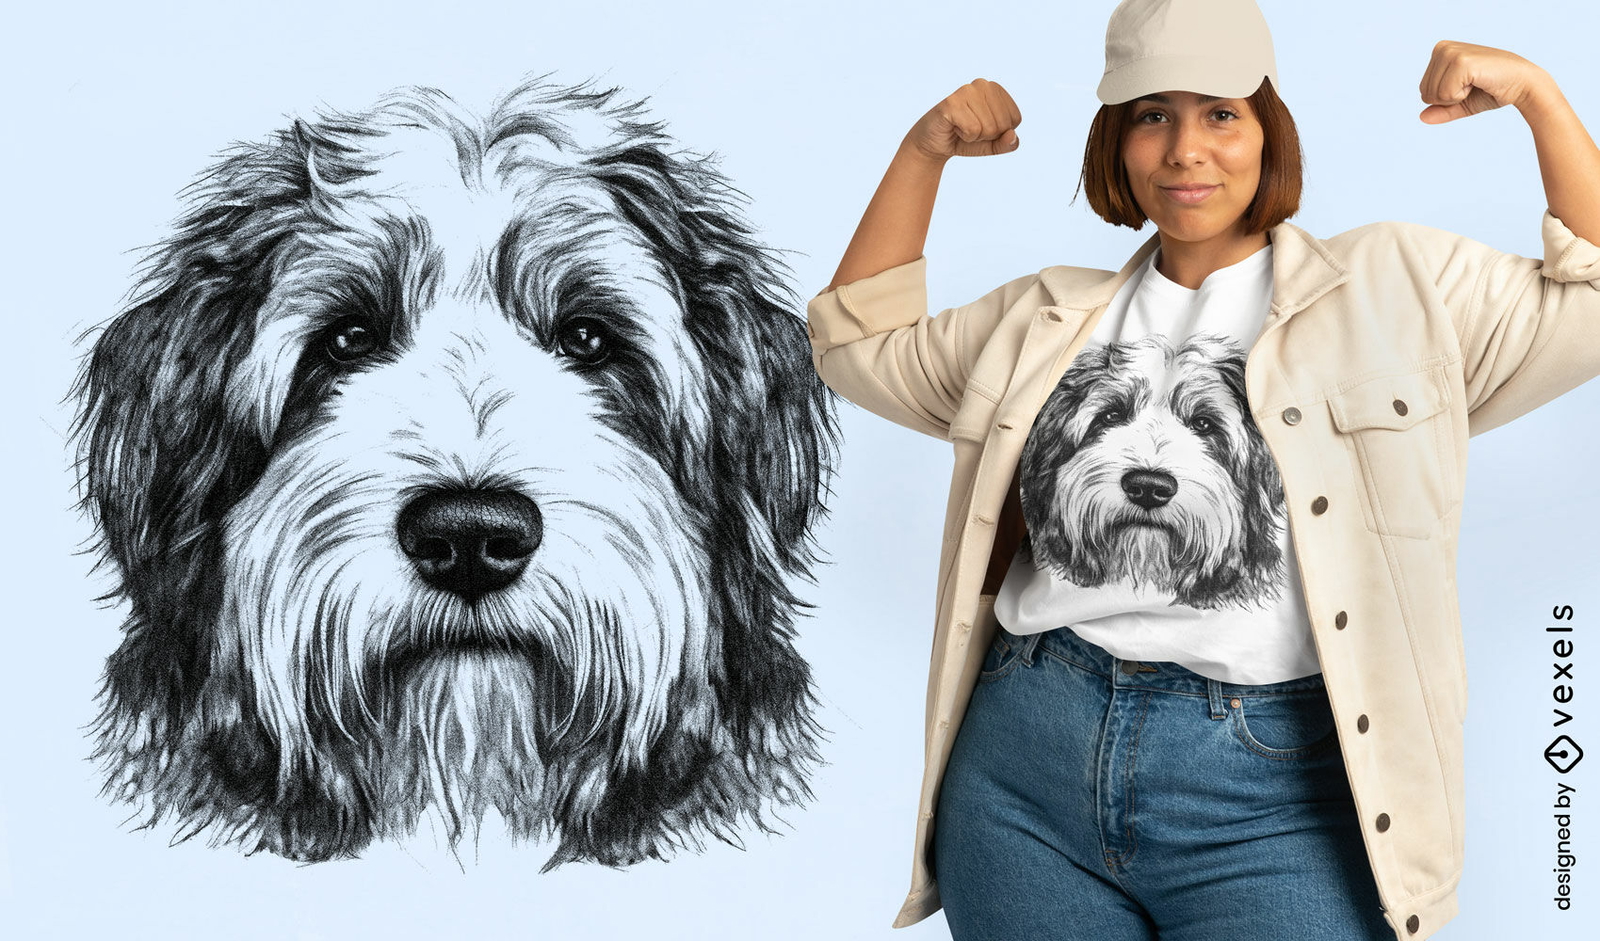
Design de camiseta com ilustra??o Sheeodog
Escolha uma pasta
Todos os favoritos
Criar novo
Salvar
Design de camiseta com ilustra??o Sheeodog
Pronto para imprimir
para Merch
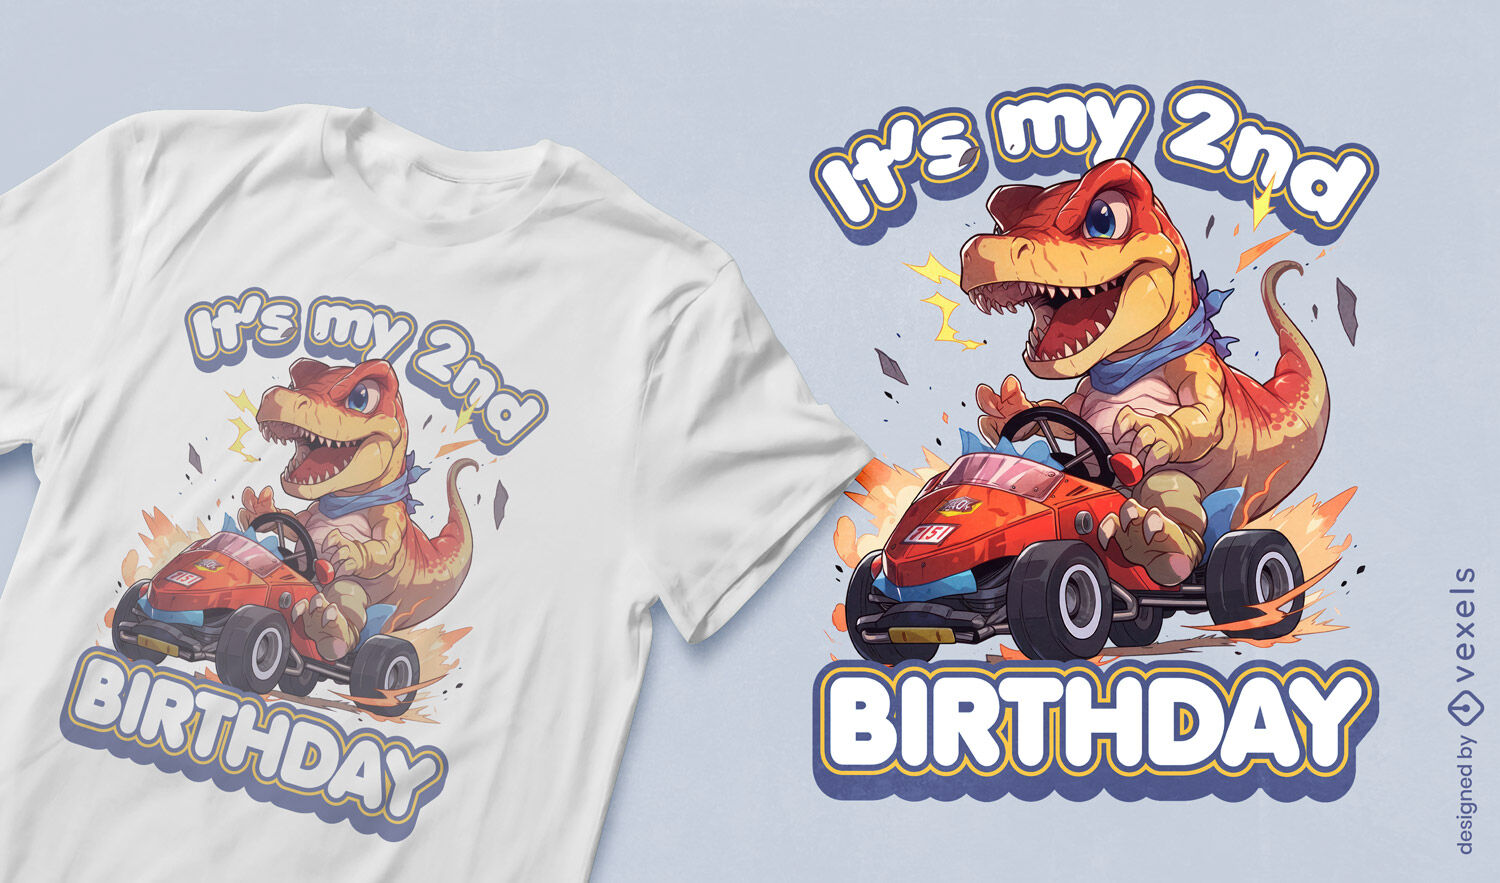
Design de camiseta de anivers?rio de carro com dinossauro
Escolha uma pasta
Todos os favoritos
Criar novo
Salvar
Design de camiseta de anivers?rio de carro com dinossauro
Pronto para imprimir
para Merch
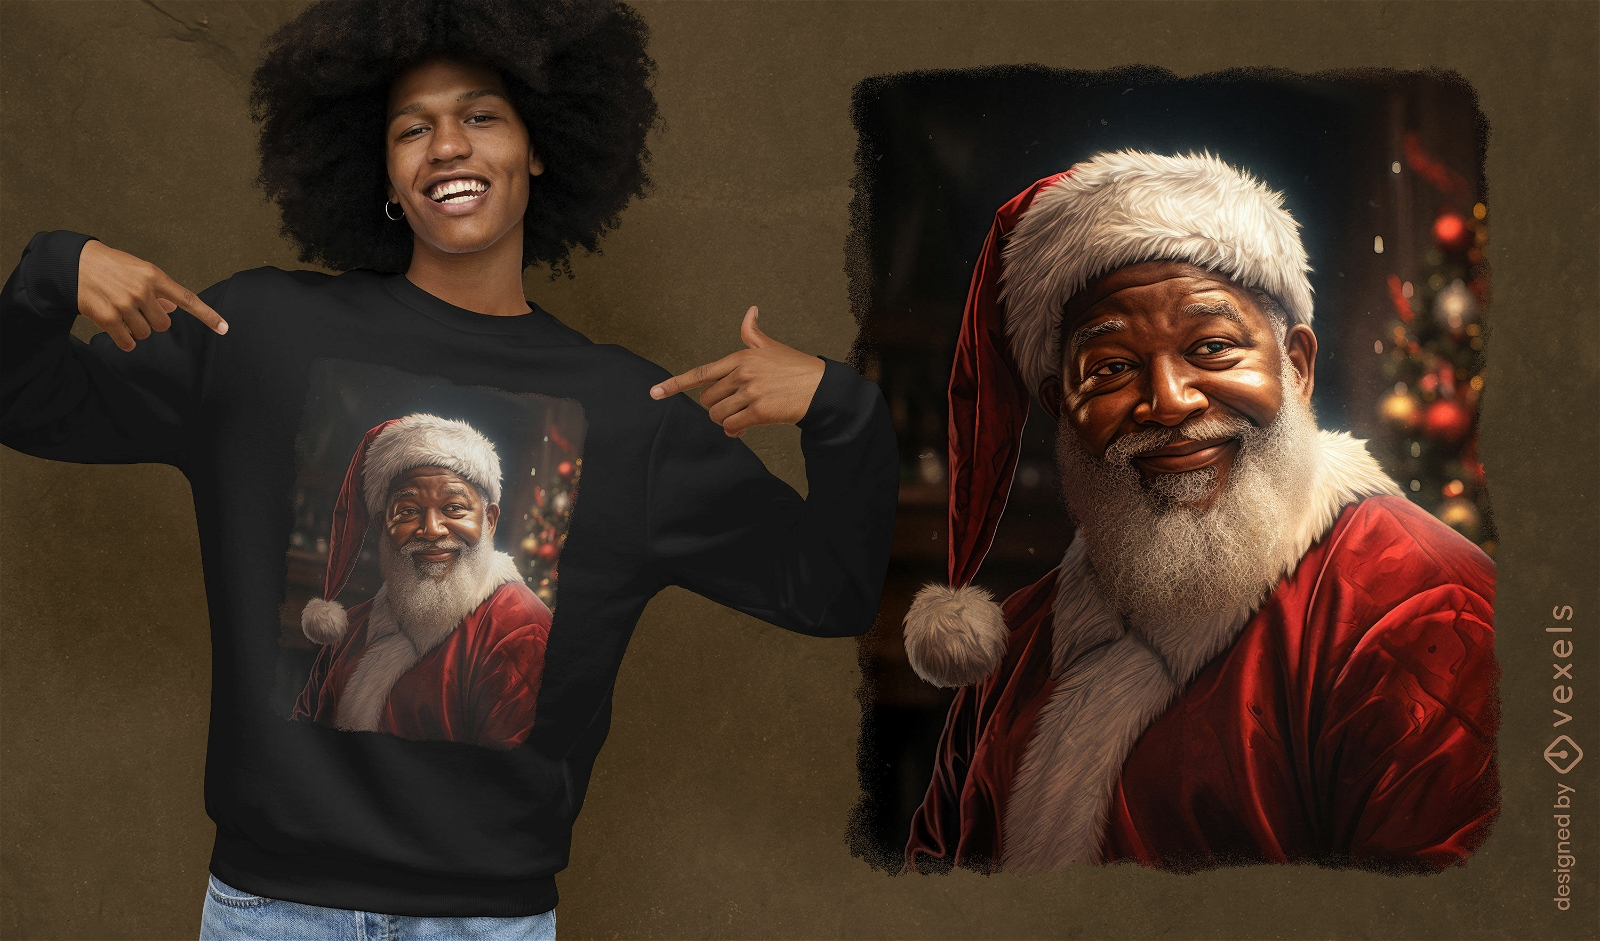
Design realista de camiseta psd do Papai Noel preto
Escolha uma pasta
Todos os favoritos
Criar novo
Salvar
Design realista de camiseta psd do Papai Noel preto
Pronto para imprimir
para Merch
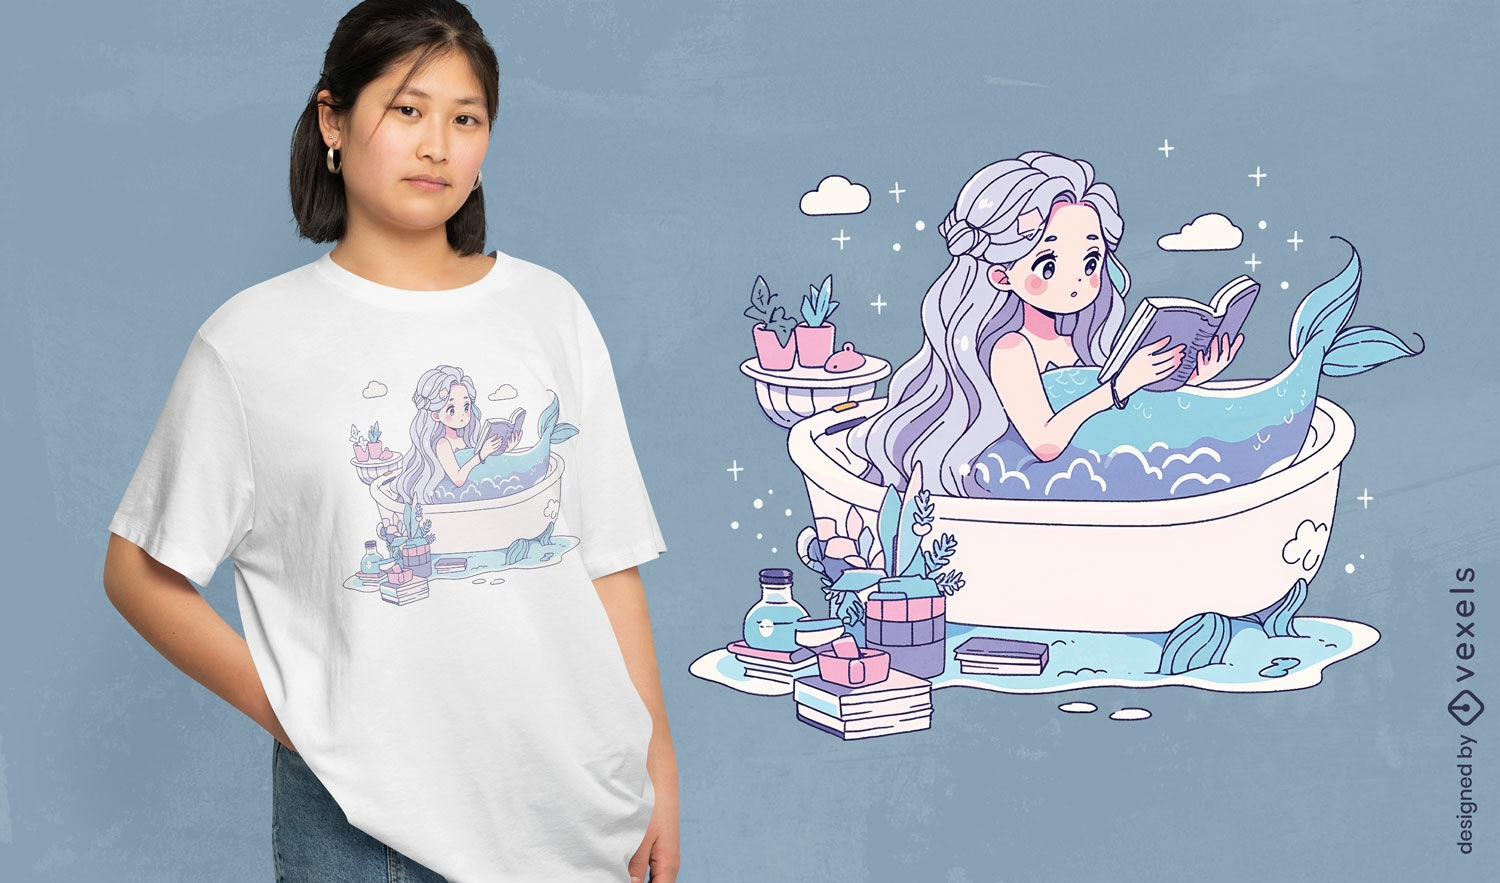
Design de camiseta de leitura de sereia
Escolha uma pasta
Todos os favoritos
Criar novo
Salvar
Design de camiseta de leitura de sereia
texto editável
Pronto para imprimir
para Merch
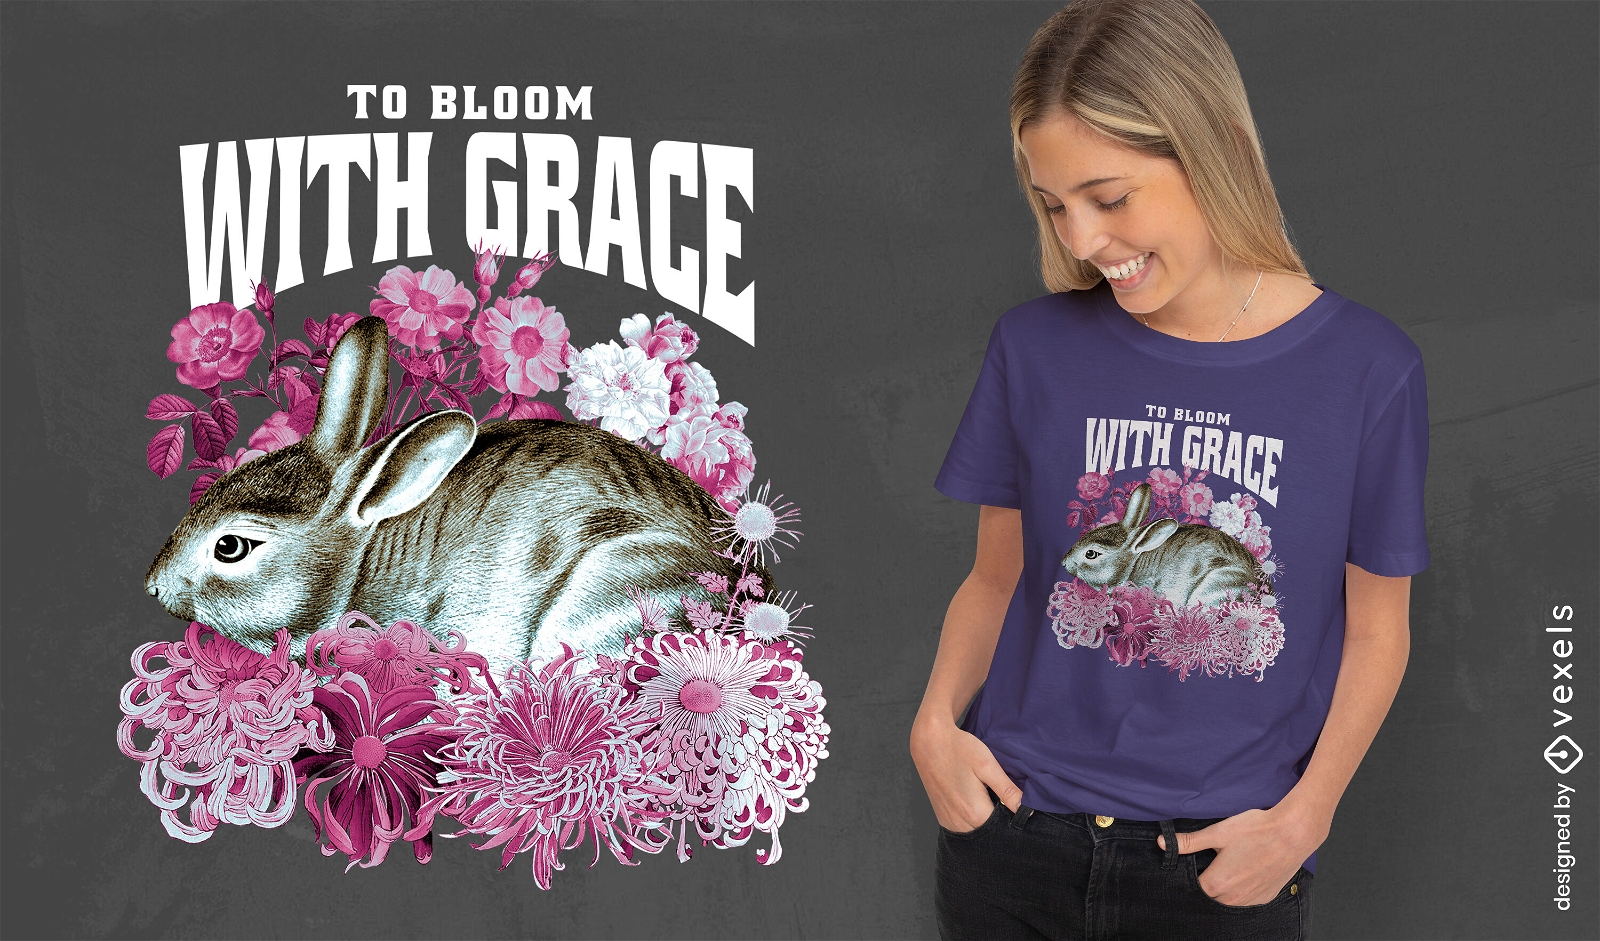
Animal de coelho com camiseta de flores psd
Escolha uma pasta
Todos os favoritos
Criar novo
Salvar
Animal de coelho com camiseta de flores psd
texto editável
Pronto para imprimir
para Merch
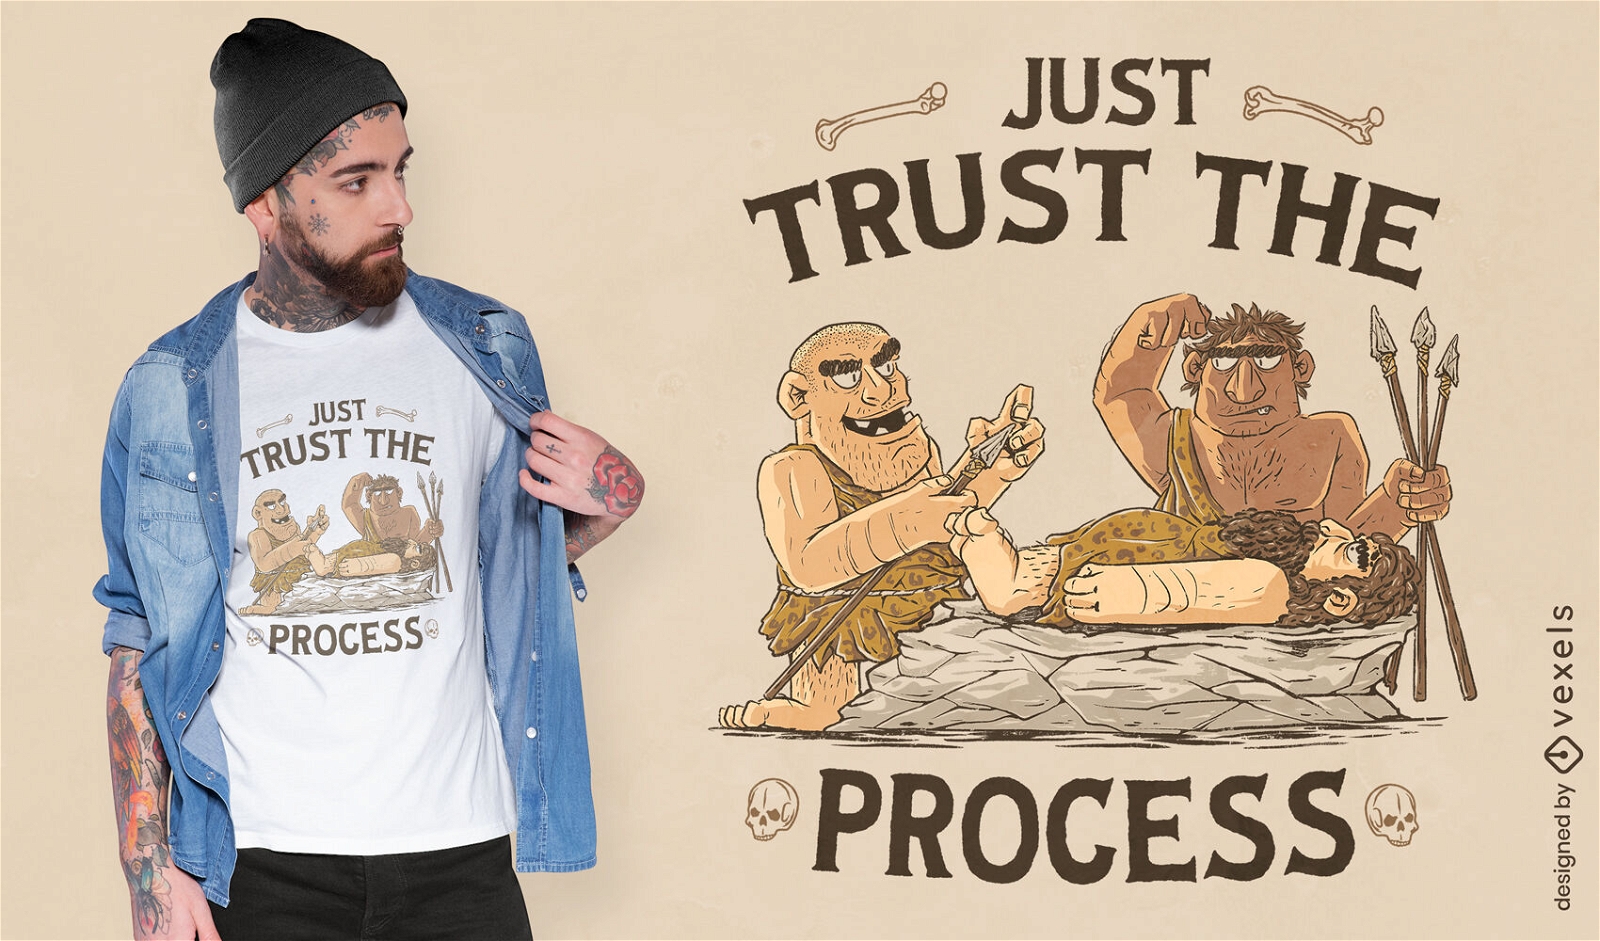
T-shirt dos doutores dos desenhos animados dos homens das cavernas psd
Escolha uma pasta
Todos os favoritos
Criar novo
Salvar
T-shirt dos doutores dos desenhos animados dos homens das cavernas psd
Pronto para imprimir
para Merch
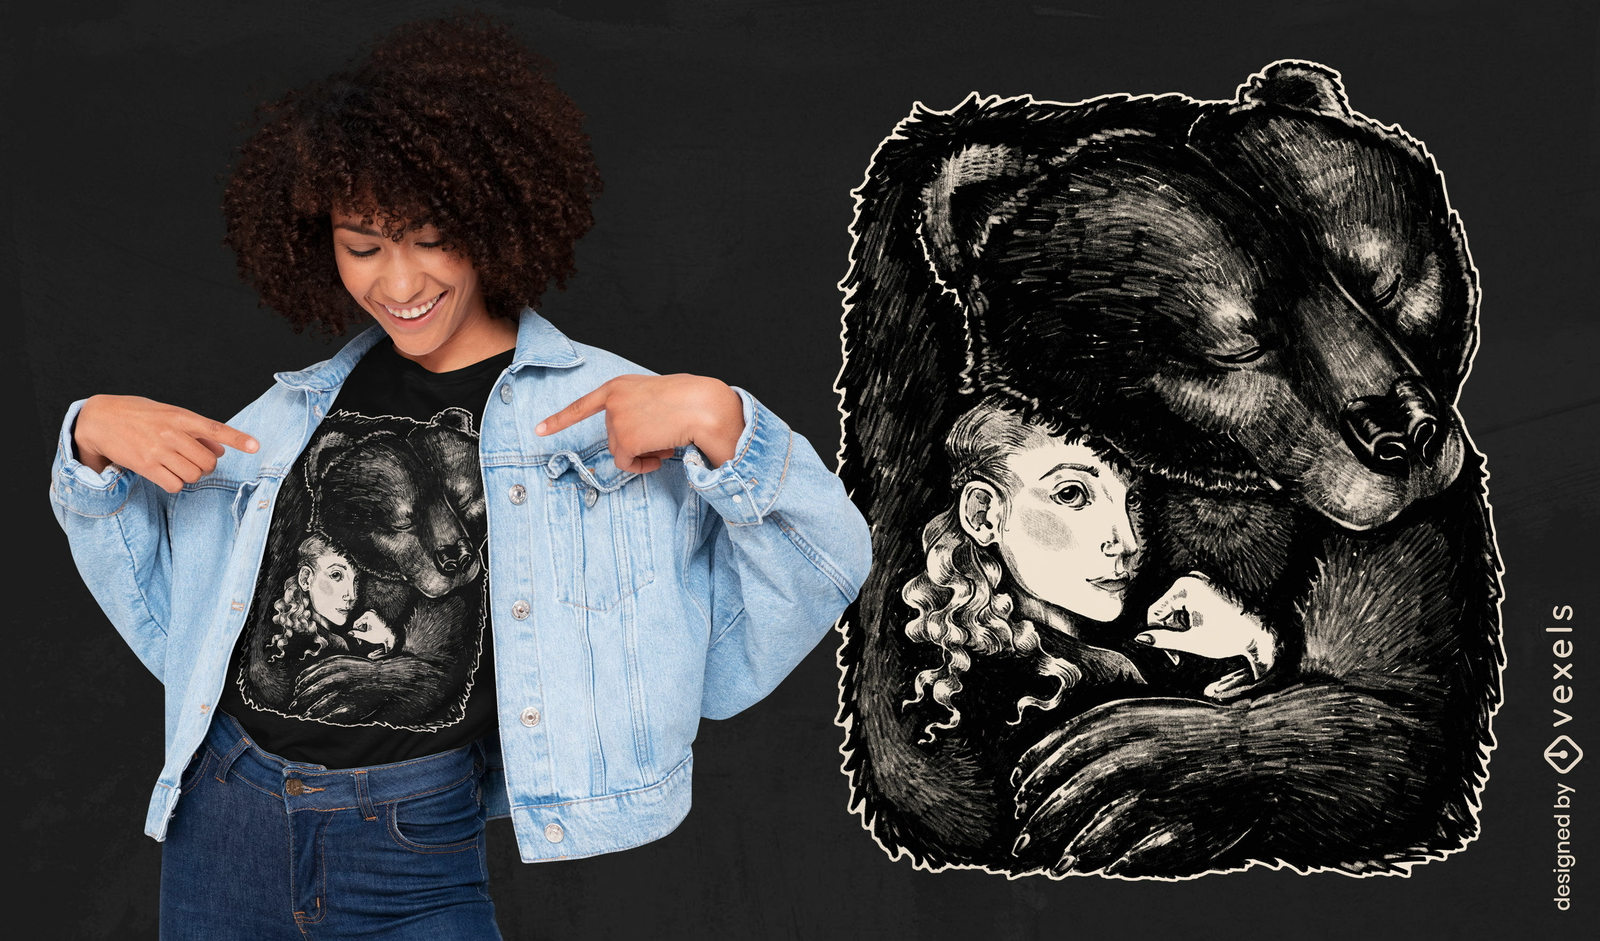
Design de camiseta de ilustração de mulher e urso
Escolha uma pasta
Todos os favoritos
Criar novo
Salvar
Design de camiseta de ilustração de mulher e urso
Pronto para imprimir
para Merch
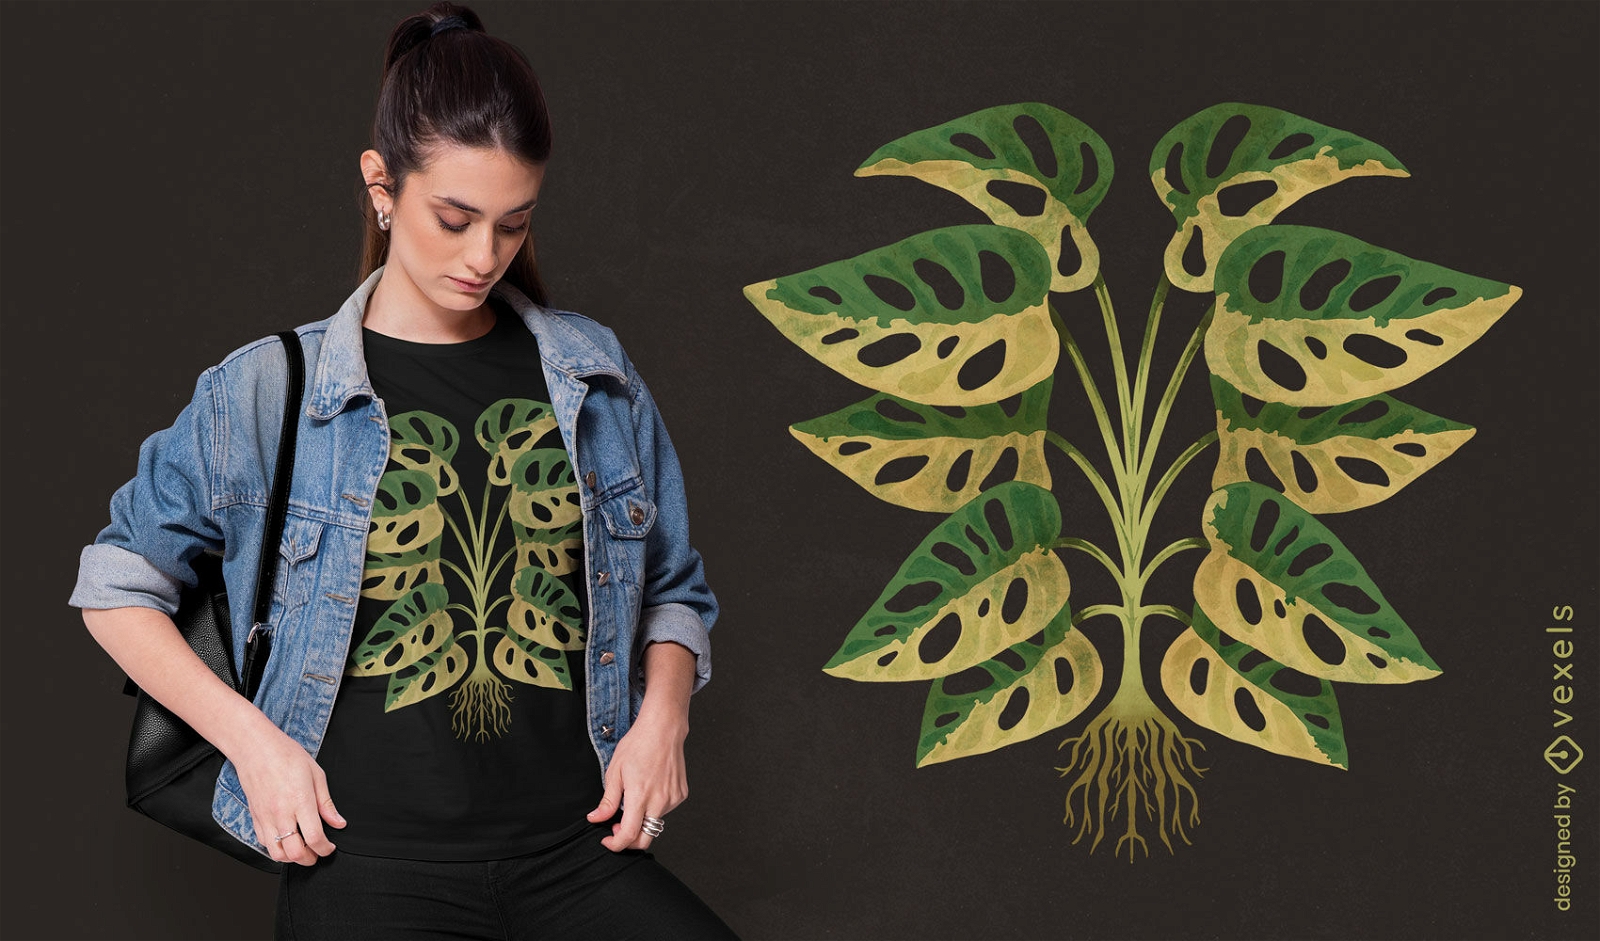
Design de camiseta de plantas Monstera
Escolha uma pasta
Todos os favoritos
Criar novo
Salvar
Design de camiseta de plantas Monstera
texto editável
Pronto para imprimir
para Merch
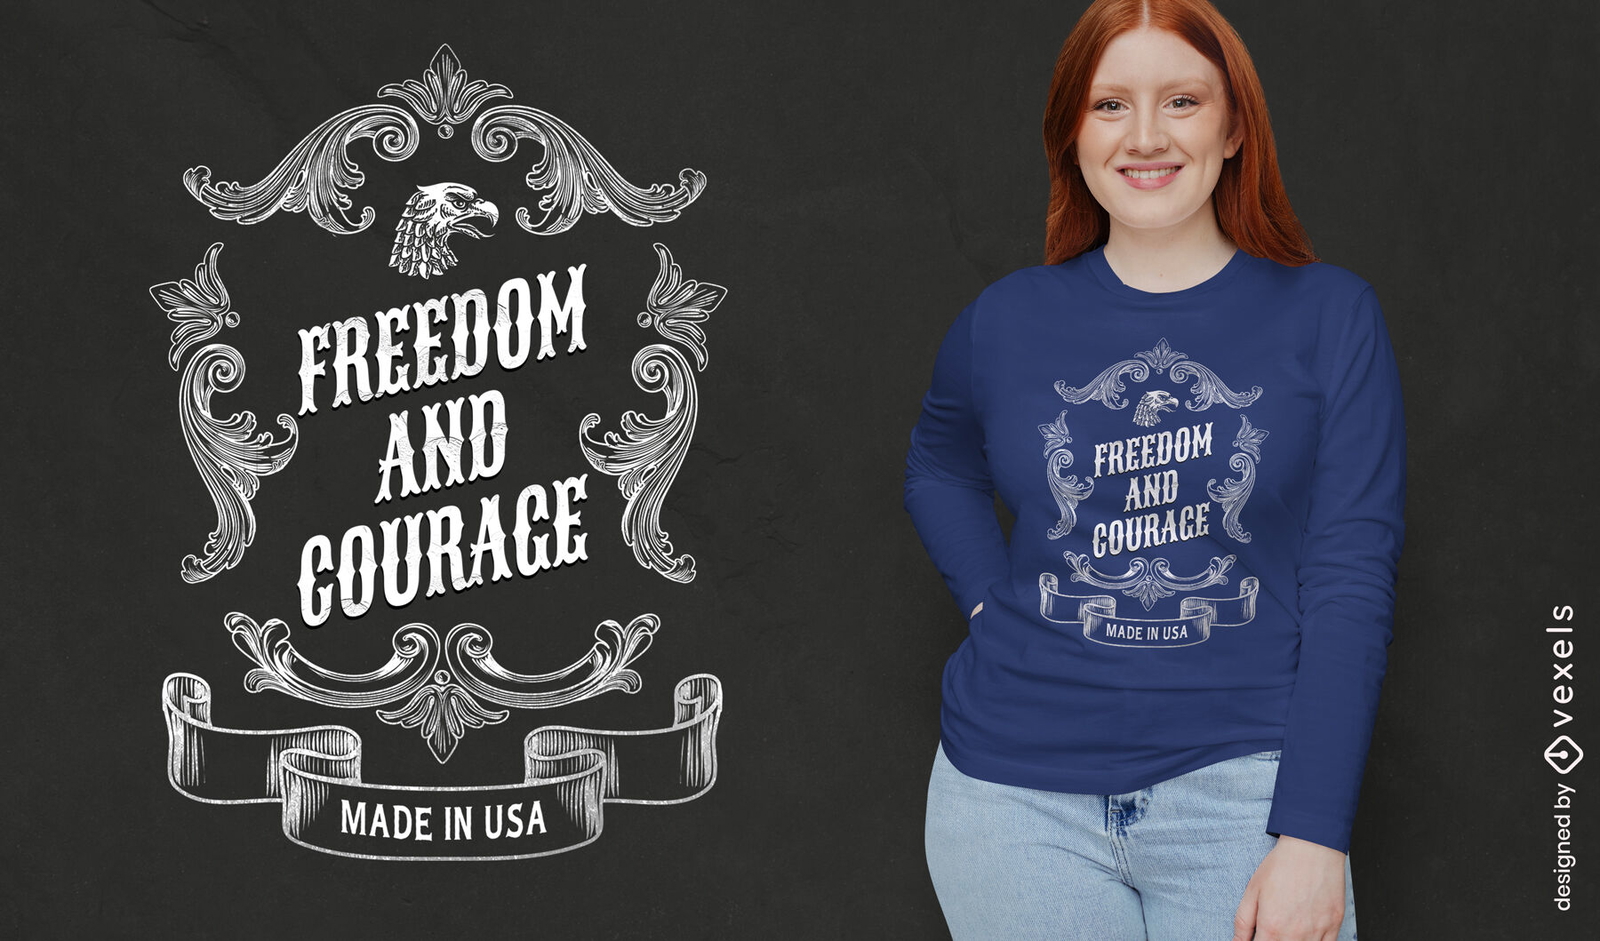
Design de camiseta com citação vintage dos EUA
Escolha uma pasta
Todos os favoritos
Criar novo
Salvar
Design de camiseta com citação vintage dos EUA
Pronto para imprimir
para Merch
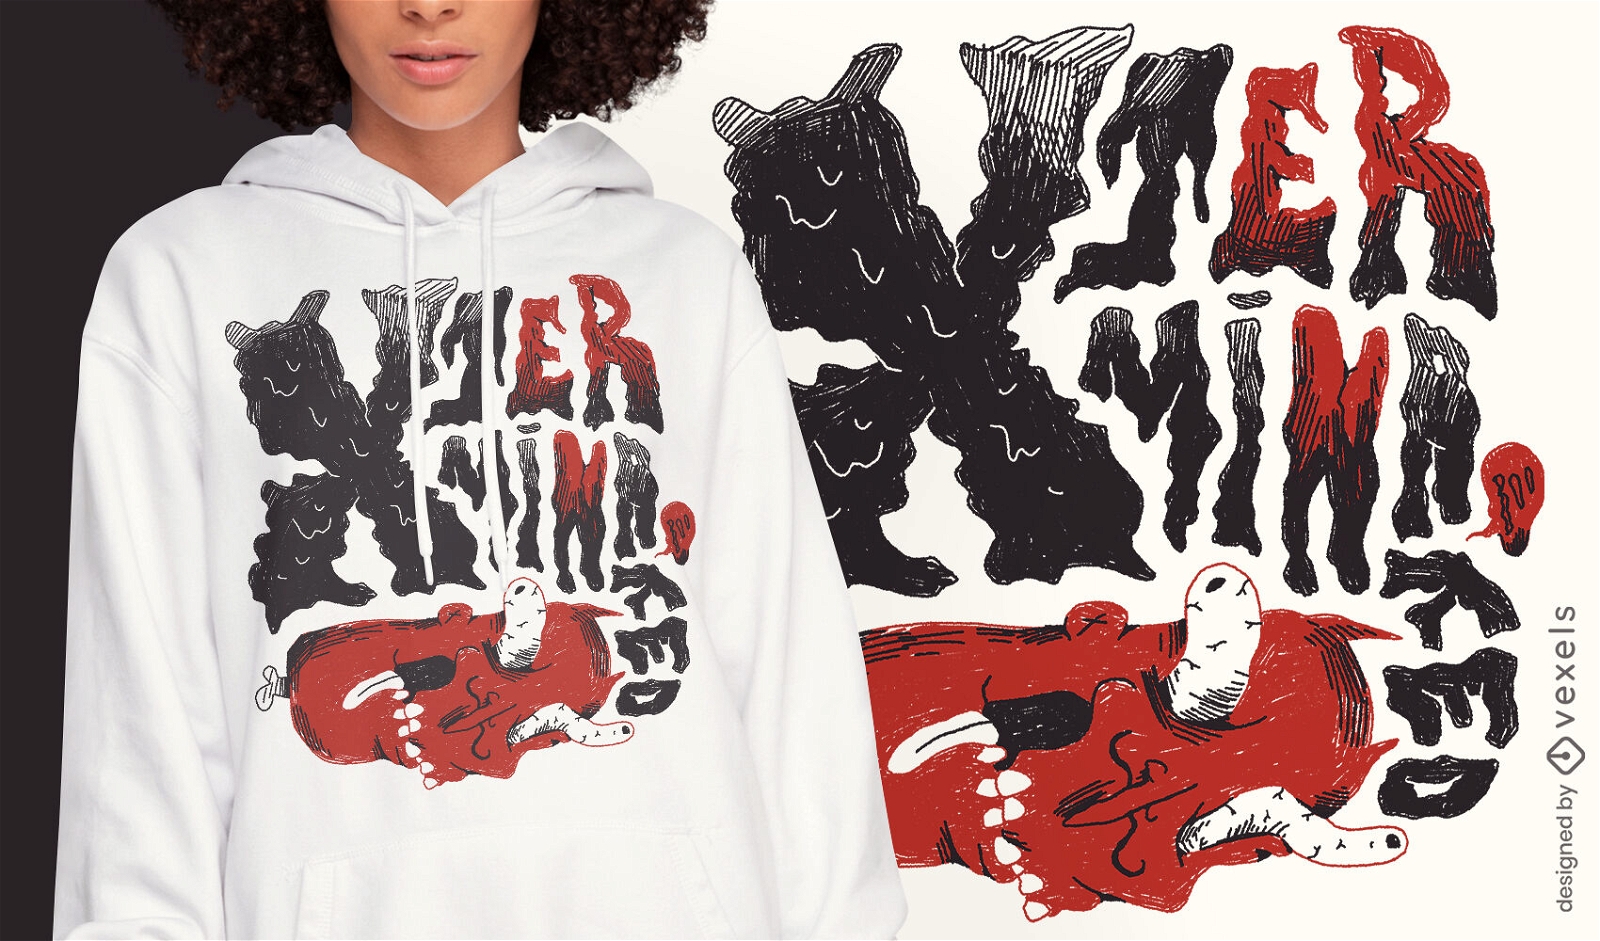
Design de camiseta Xterminated afterlife
Escolha uma pasta
Todos os favoritos
Criar novo
Salvar
Design de camiseta Xterminated afterlife
texto editável
Pronto para imprimir
para Merch
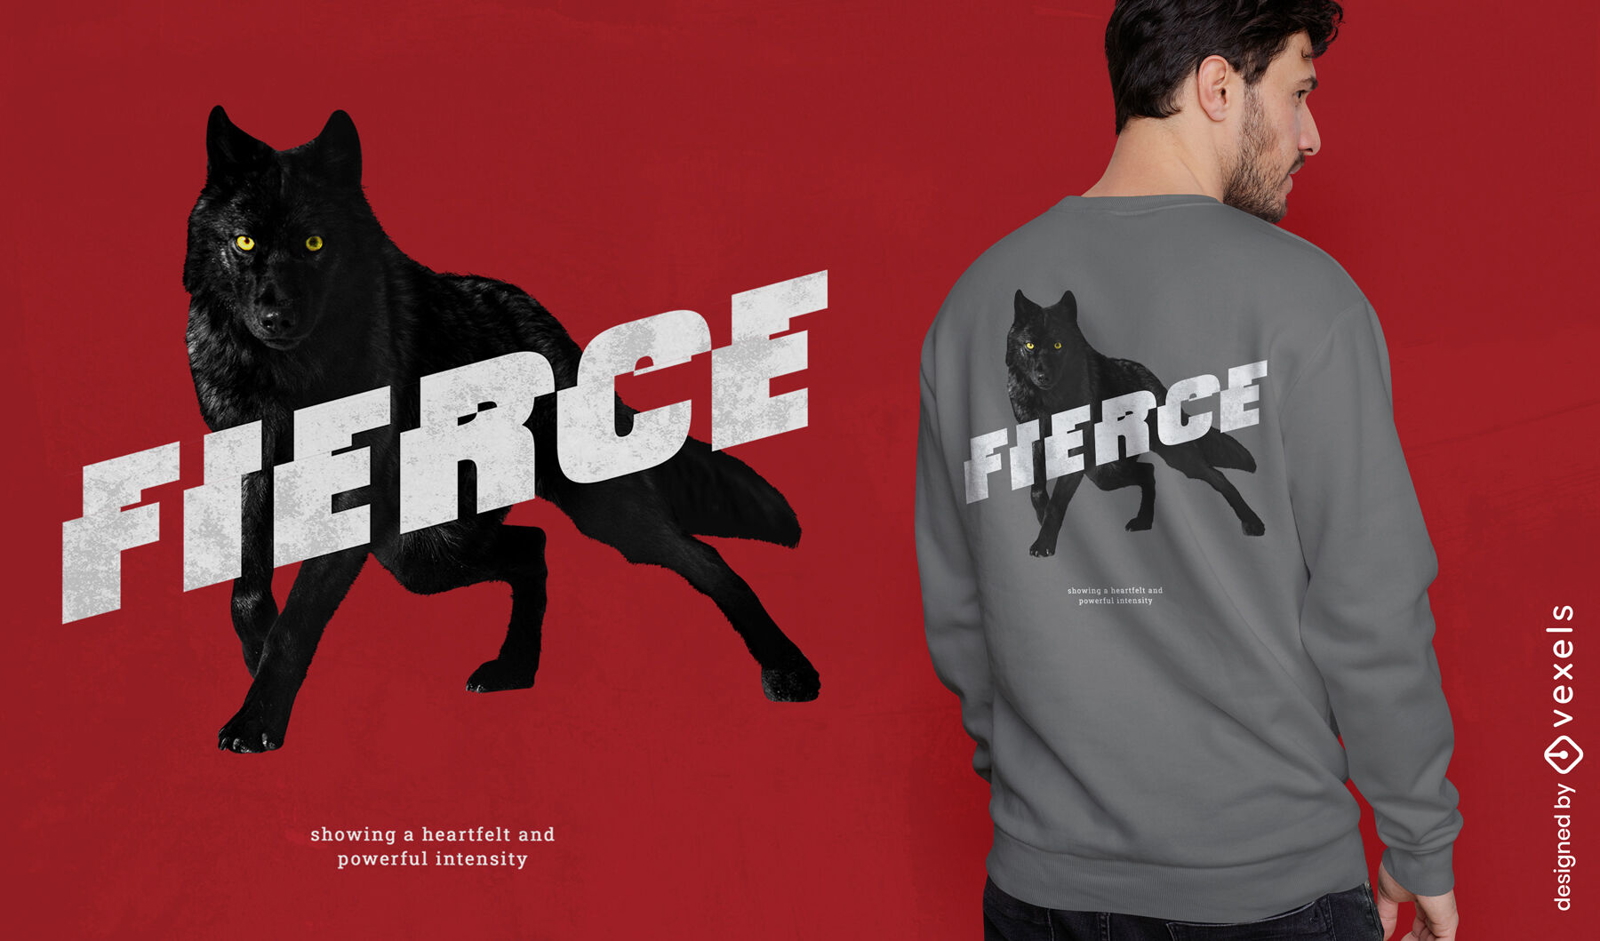
Design de camiseta psd de animal selvagem lobo preto
Escolha uma pasta
Todos os favoritos
Criar novo
Salvar
Design de camiseta psd de animal selvagem lobo preto
Pronto para imprimir
para Merch
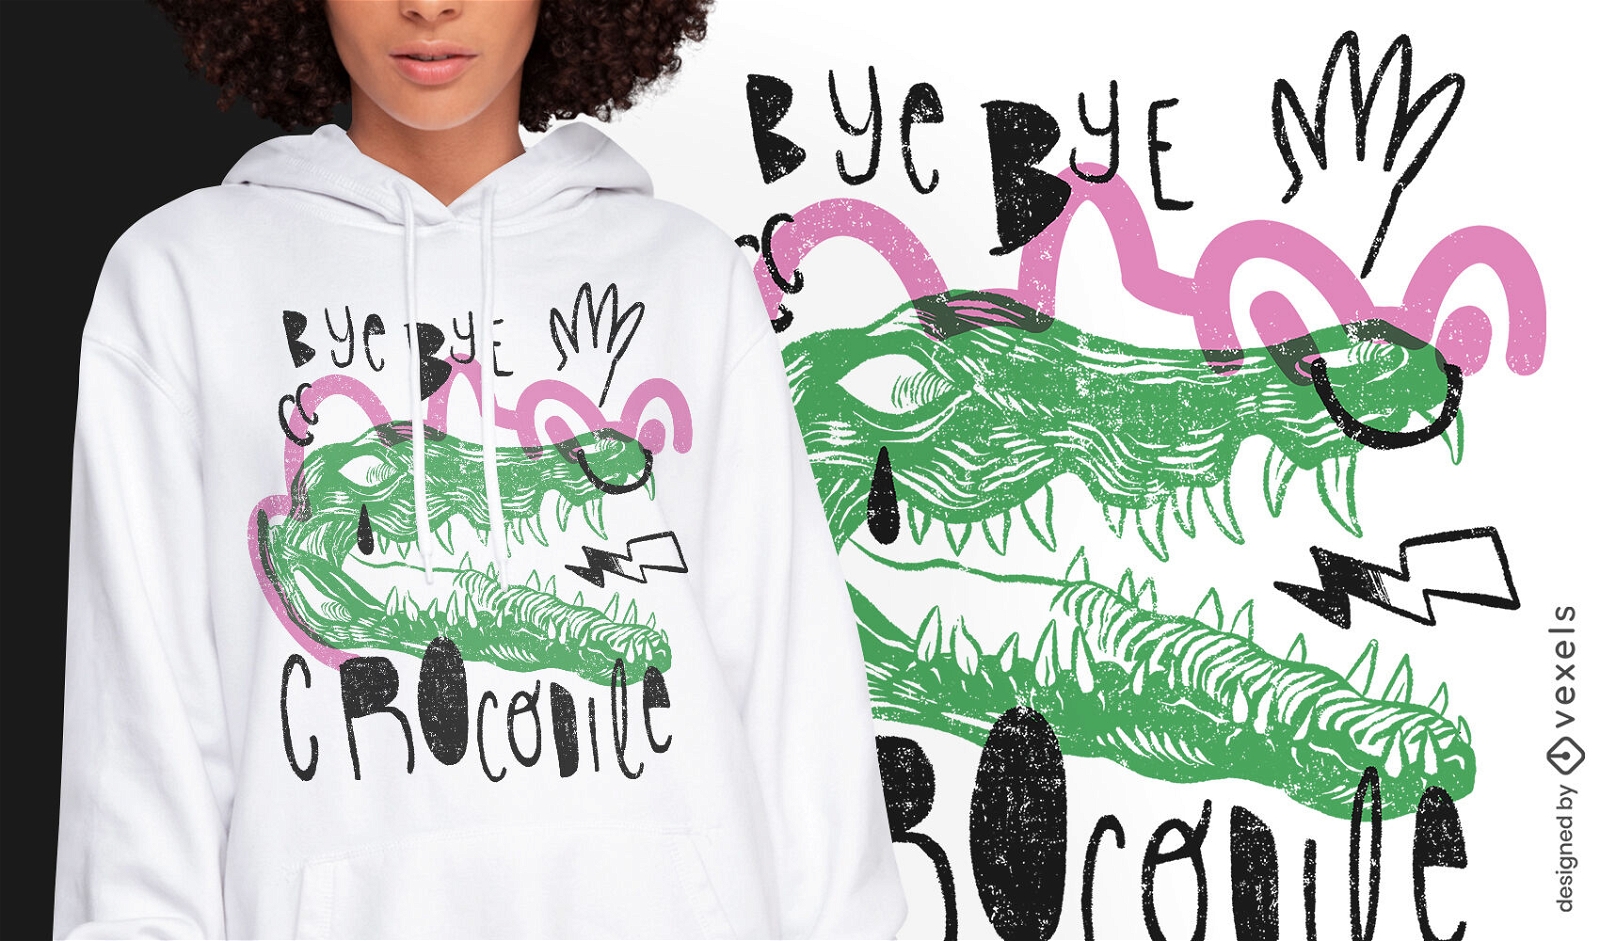
Adeus design de camiseta de crocodilo
Escolha uma pasta
Todos os favoritos
Criar novo
Salvar
Adeus design de camiseta de crocodilo
Pronto para imprimir
para Merch
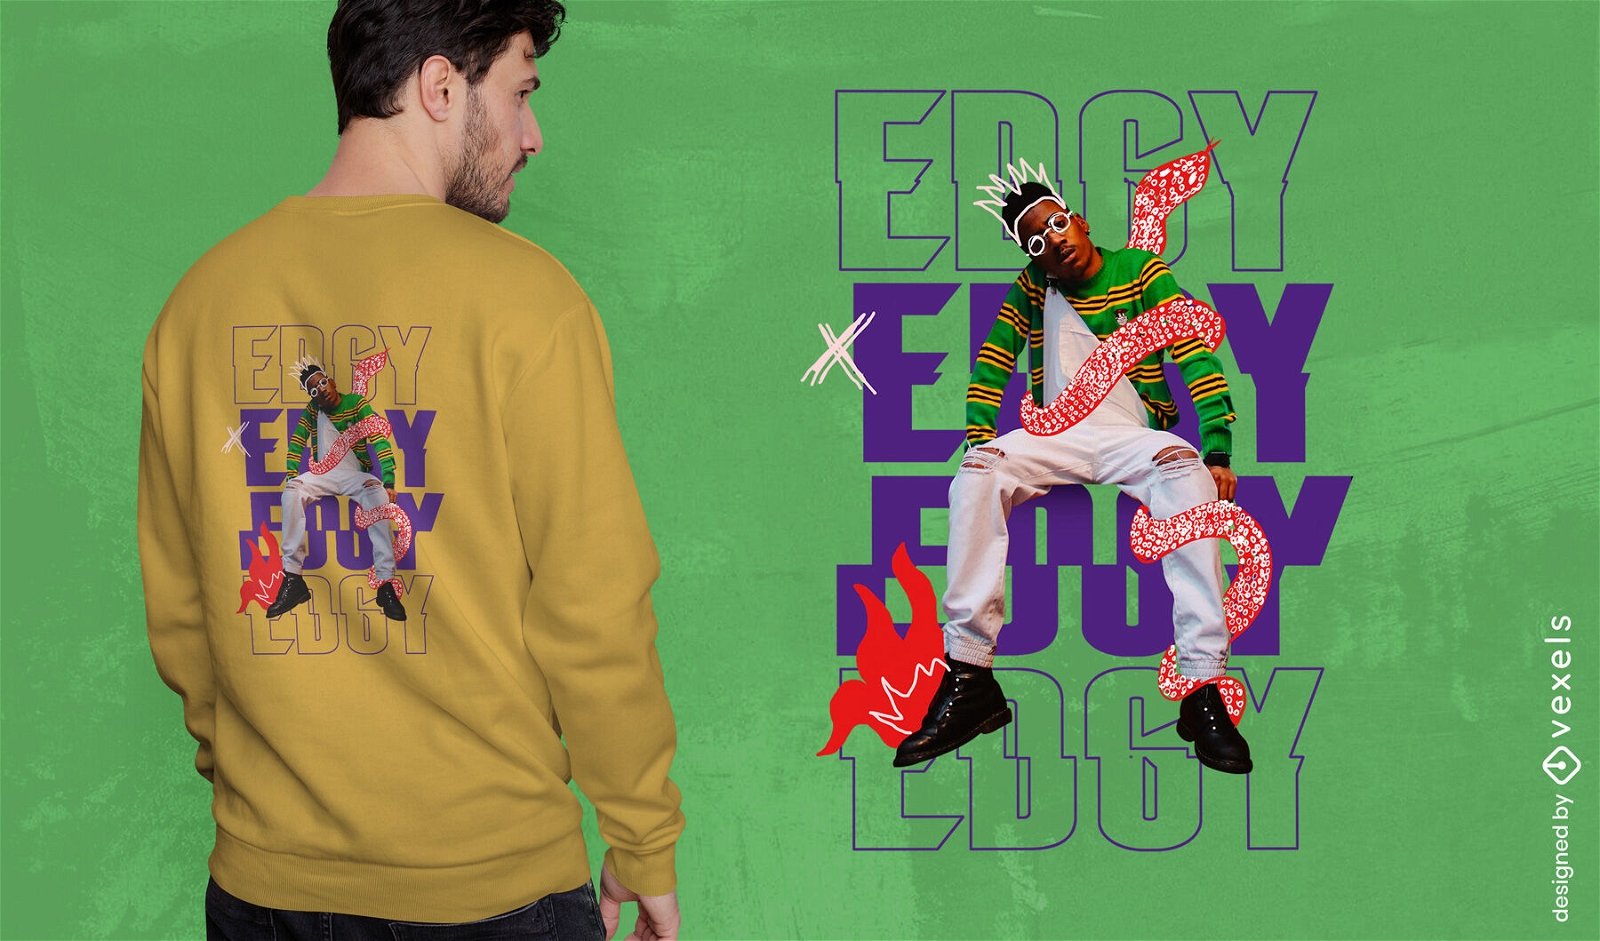
Design de camiseta psd homem estilo nervoso
Escolha uma pasta
Todos os favoritos
Criar novo
Salvar
Design de camiseta psd homem estilo nervoso
Pronto para imprimir
para Merch
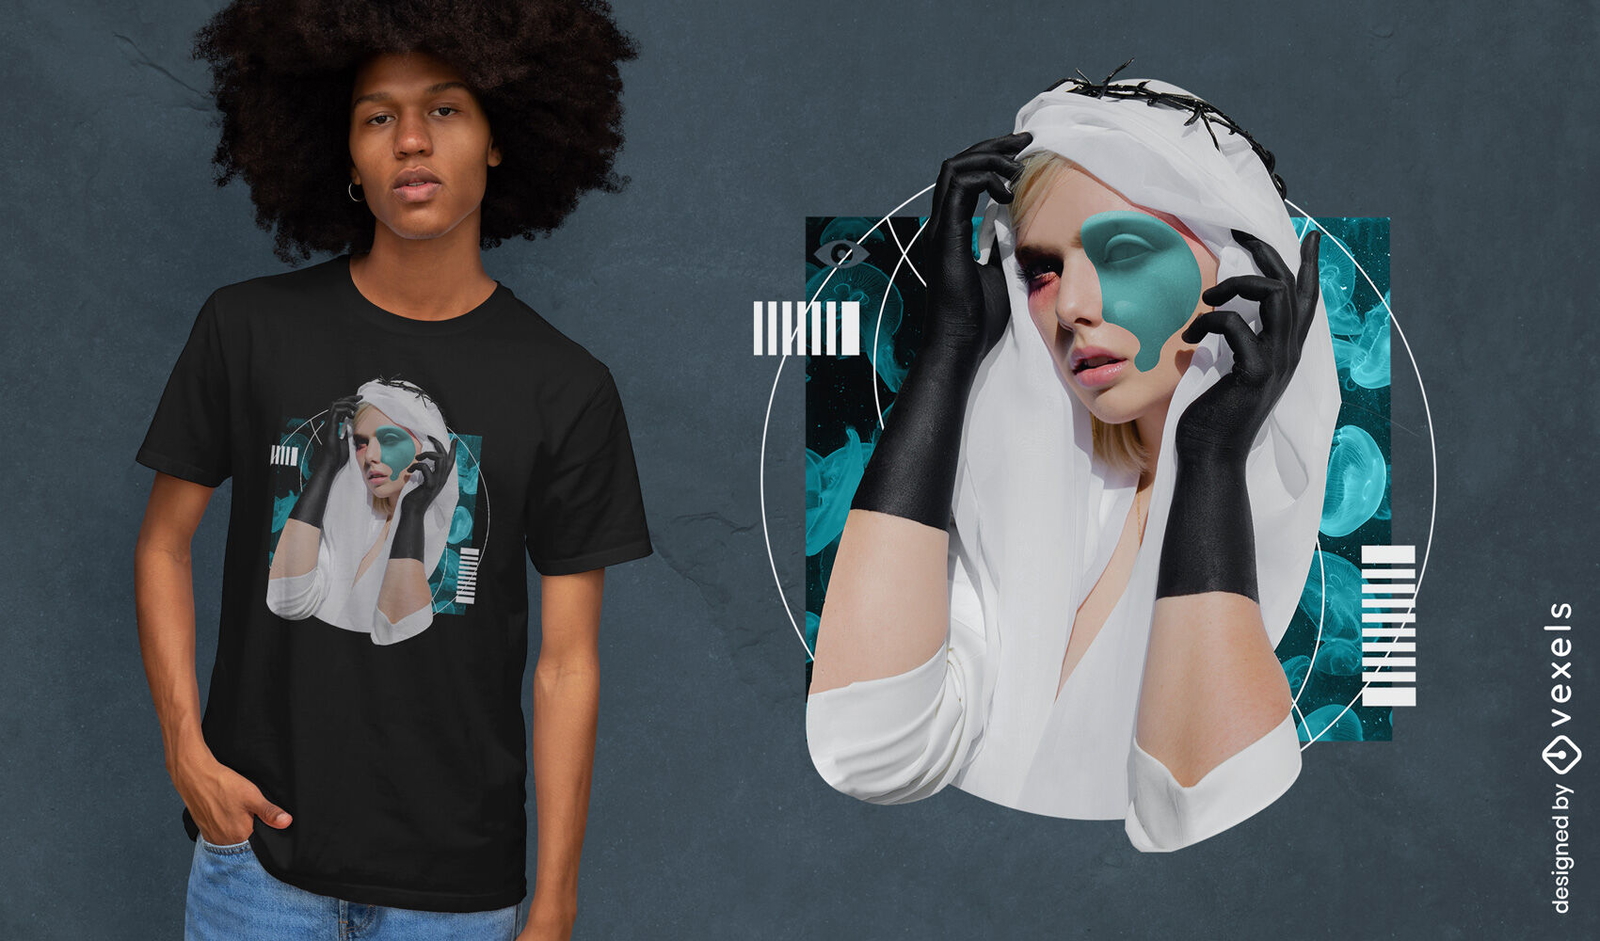
Design de camiseta psd de mulher deusa de Vênus
Escolha uma pasta
Todos os favoritos
Criar novo
Salvar
Design de camiseta psd de mulher deusa de Vênus
Pronto para imprimir
para Merch
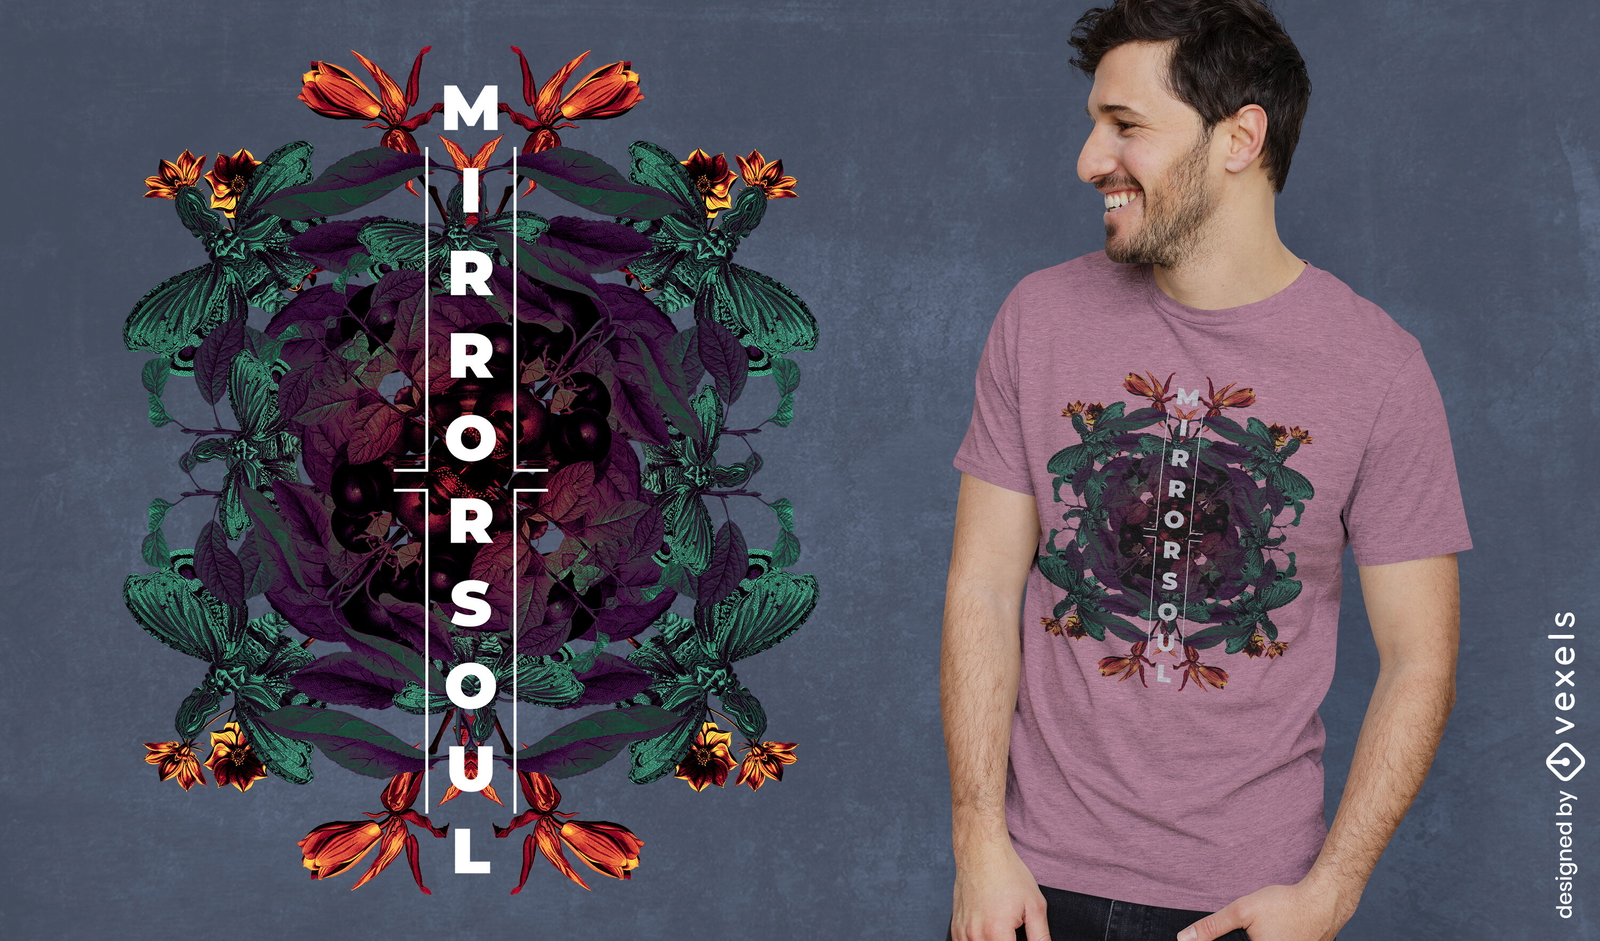
Design de camiseta de caleidoscópio espelhado
Escolha uma pasta
Todos os favoritos
Criar novo
Salvar
Design de camiseta de caleidoscópio espelhado
Pronto para imprimir
para Merch
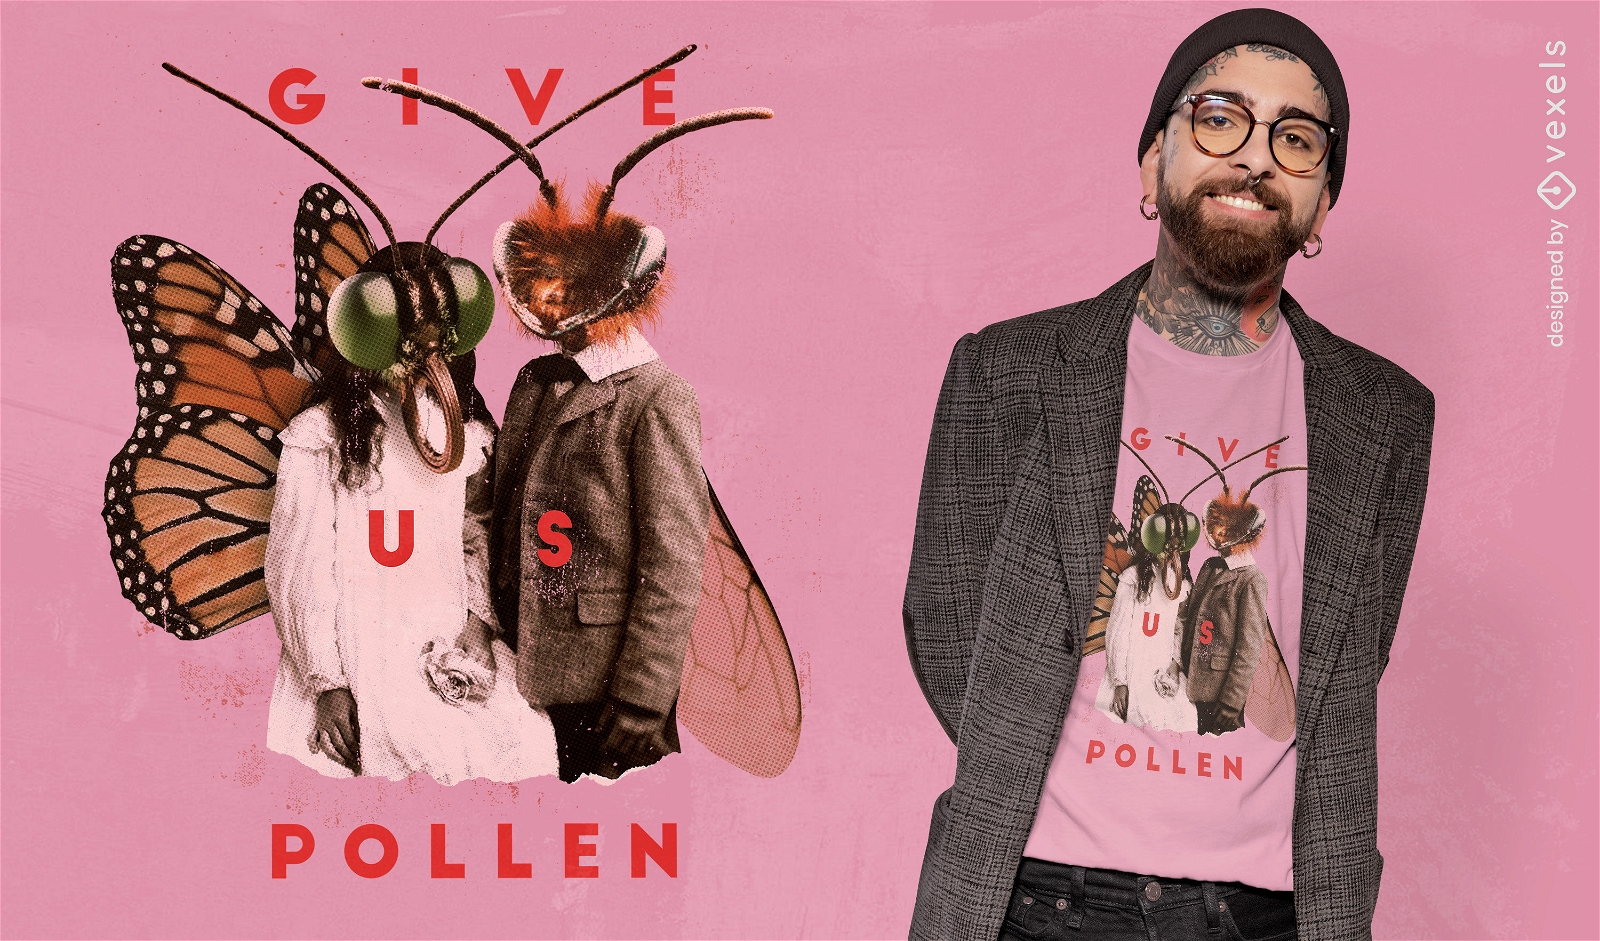
T-shirt da colagem das mariposas inseto pessoas psd
Escolha uma pasta
Todos os favoritos
Criar novo
Salvar
T-shirt da colagem das mariposas inseto pessoas psd
Pronto para imprimir
para Merch
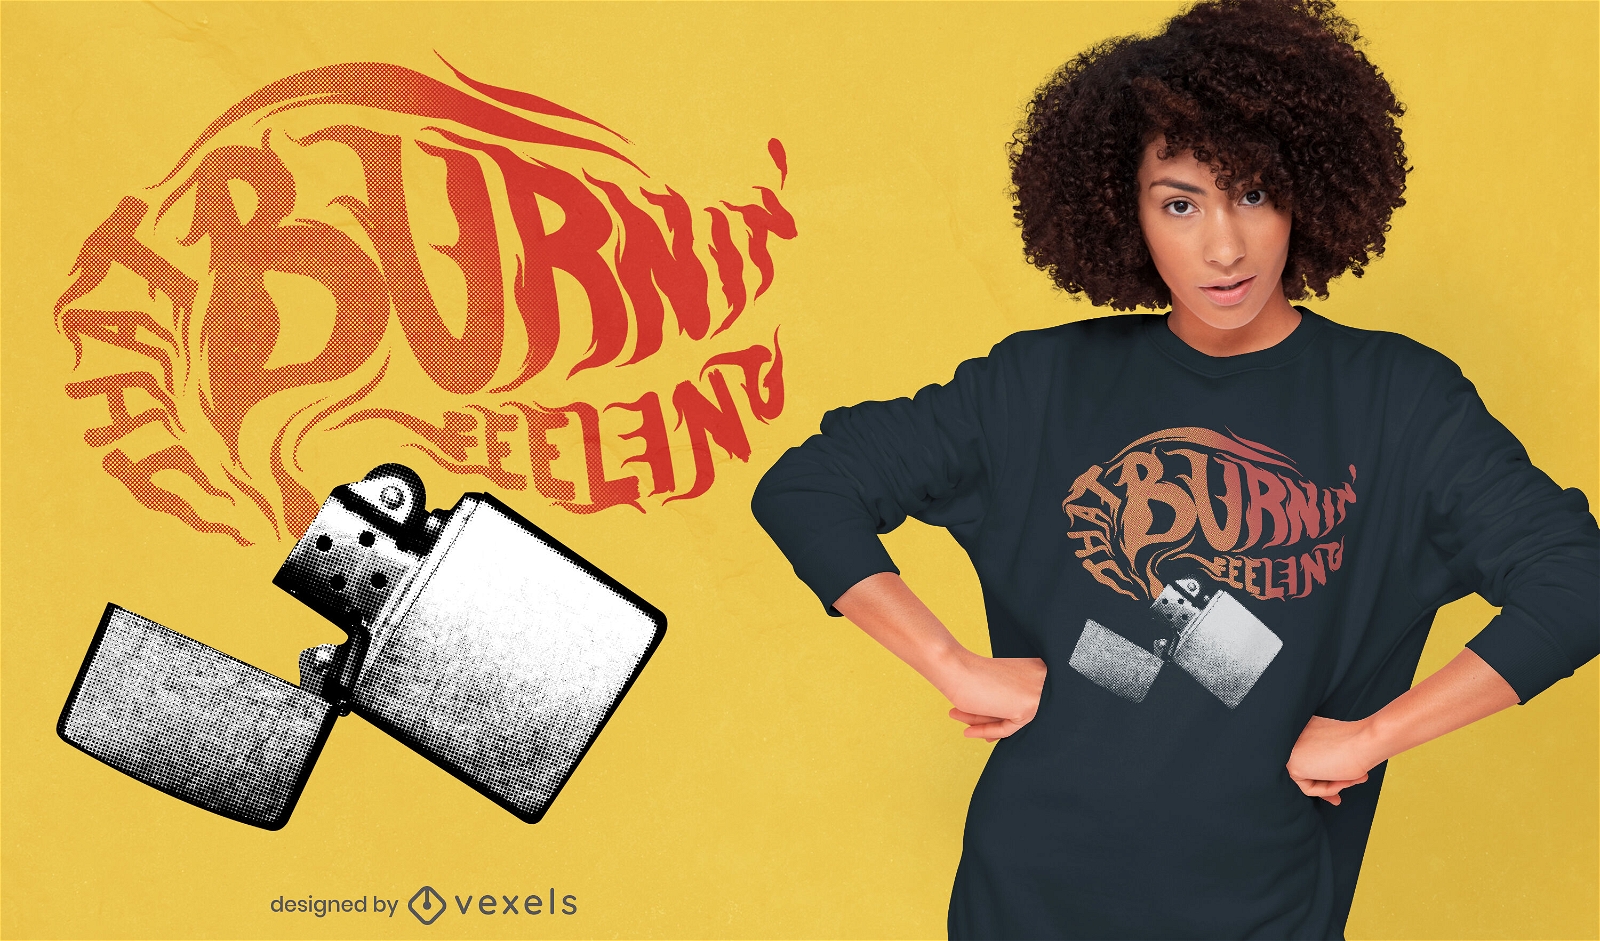
Design de t-shirt PSD de isqueiro Fire Burning
Escolha uma pasta
Todos os favoritos
Criar novo
Salvar
Design de t-shirt PSD de isqueiro Fire Burning
Pronto para imprimir
para Merch
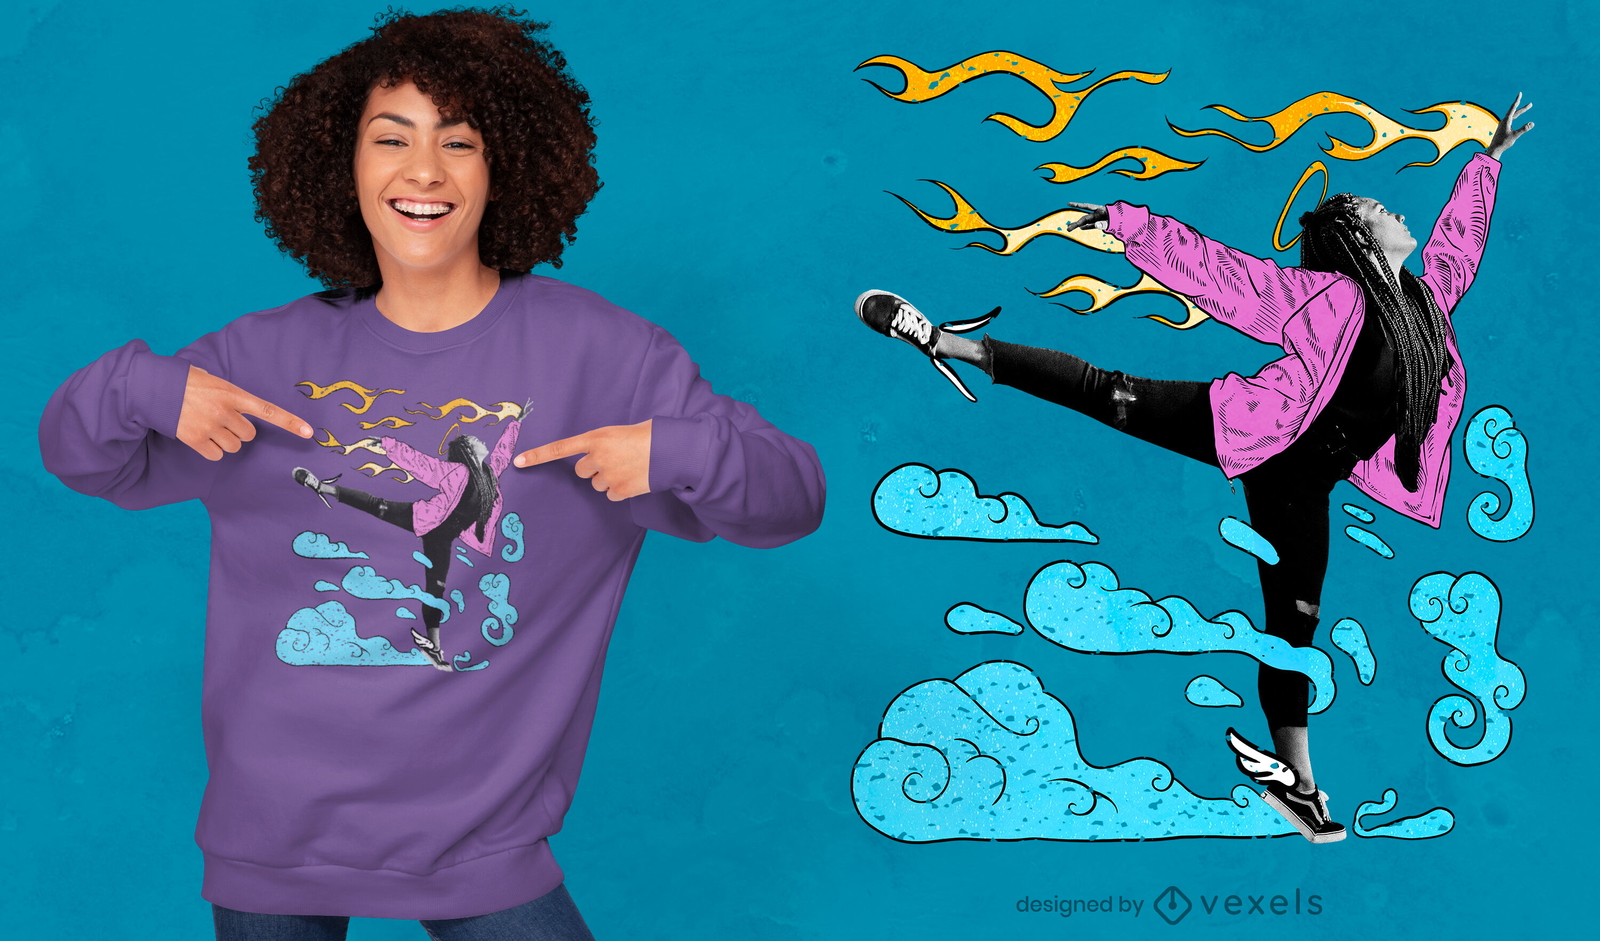
Desenho de t-shirt psd com colagem desenhada para dançarinas
Escolha uma pasta
Todos os favoritos
Criar novo
Salvar
Desenho de t-shirt psd com colagem desenhada para dançarinas
Pronto para imprimir
para Merch
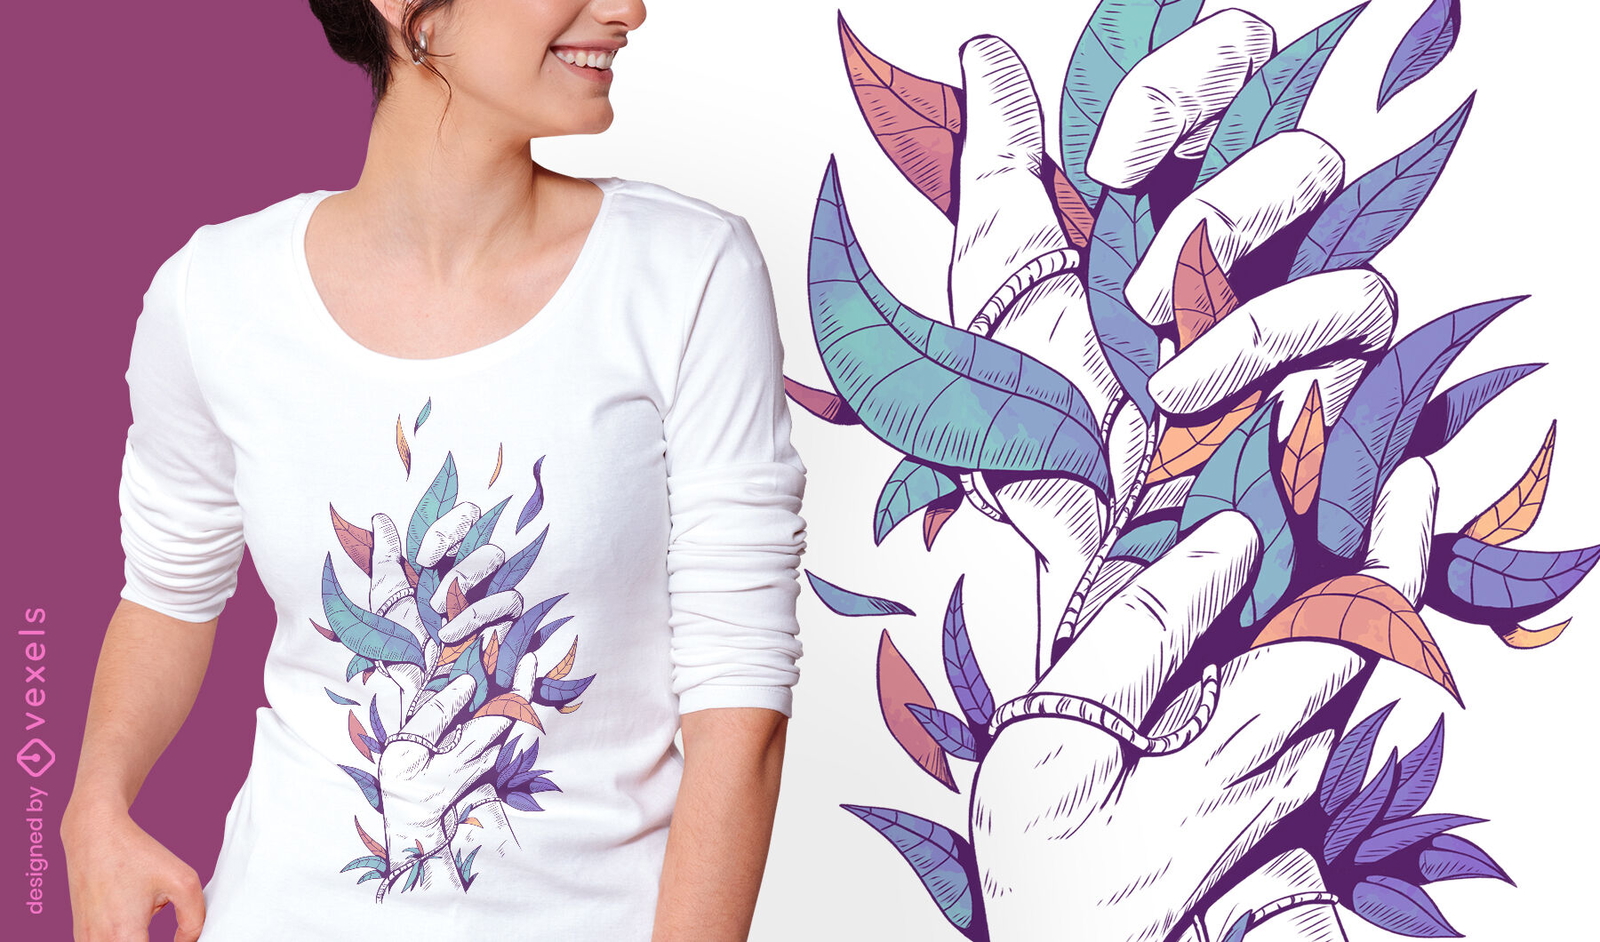
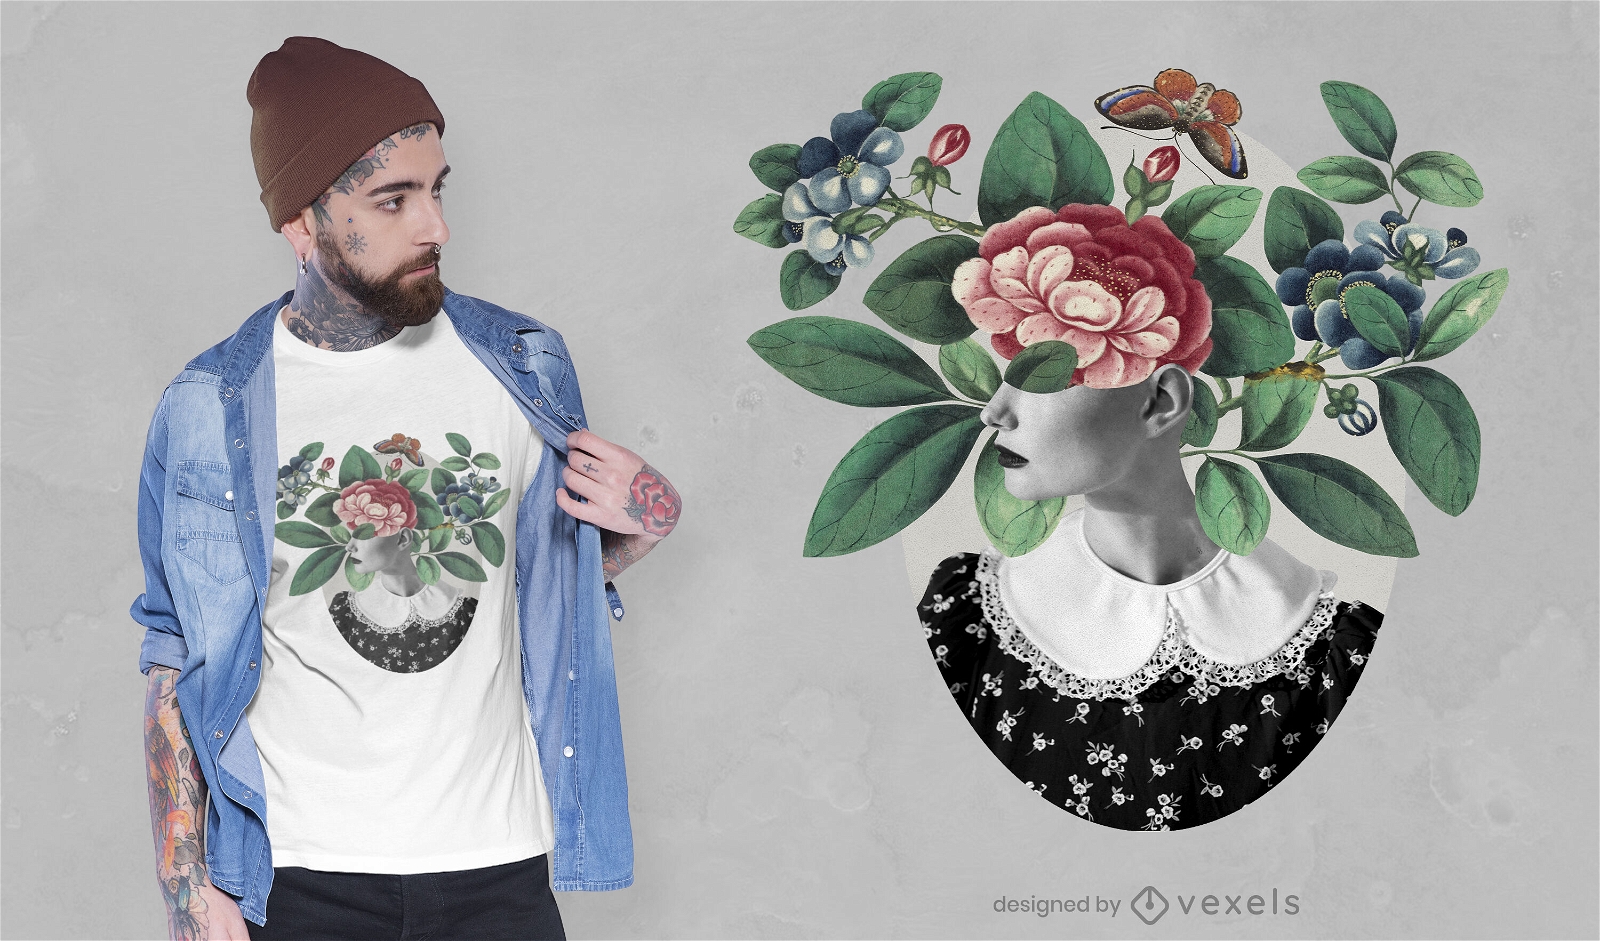
Mãos segurando folhas design de t-shirt psd
Escolha uma pasta
Todos os favoritos
Criar novo
Salvar
Mãos segurando folhas design de t-shirt psd
Pronto para imprimir
para Merch
T-shirt com retrato de mulher aquarela psd
Escolha uma pasta
Todos os favoritos
Criar novo
Salvar
T-shirt com retrato de mulher aquarela psd
Pronto para imprimir
para Merch
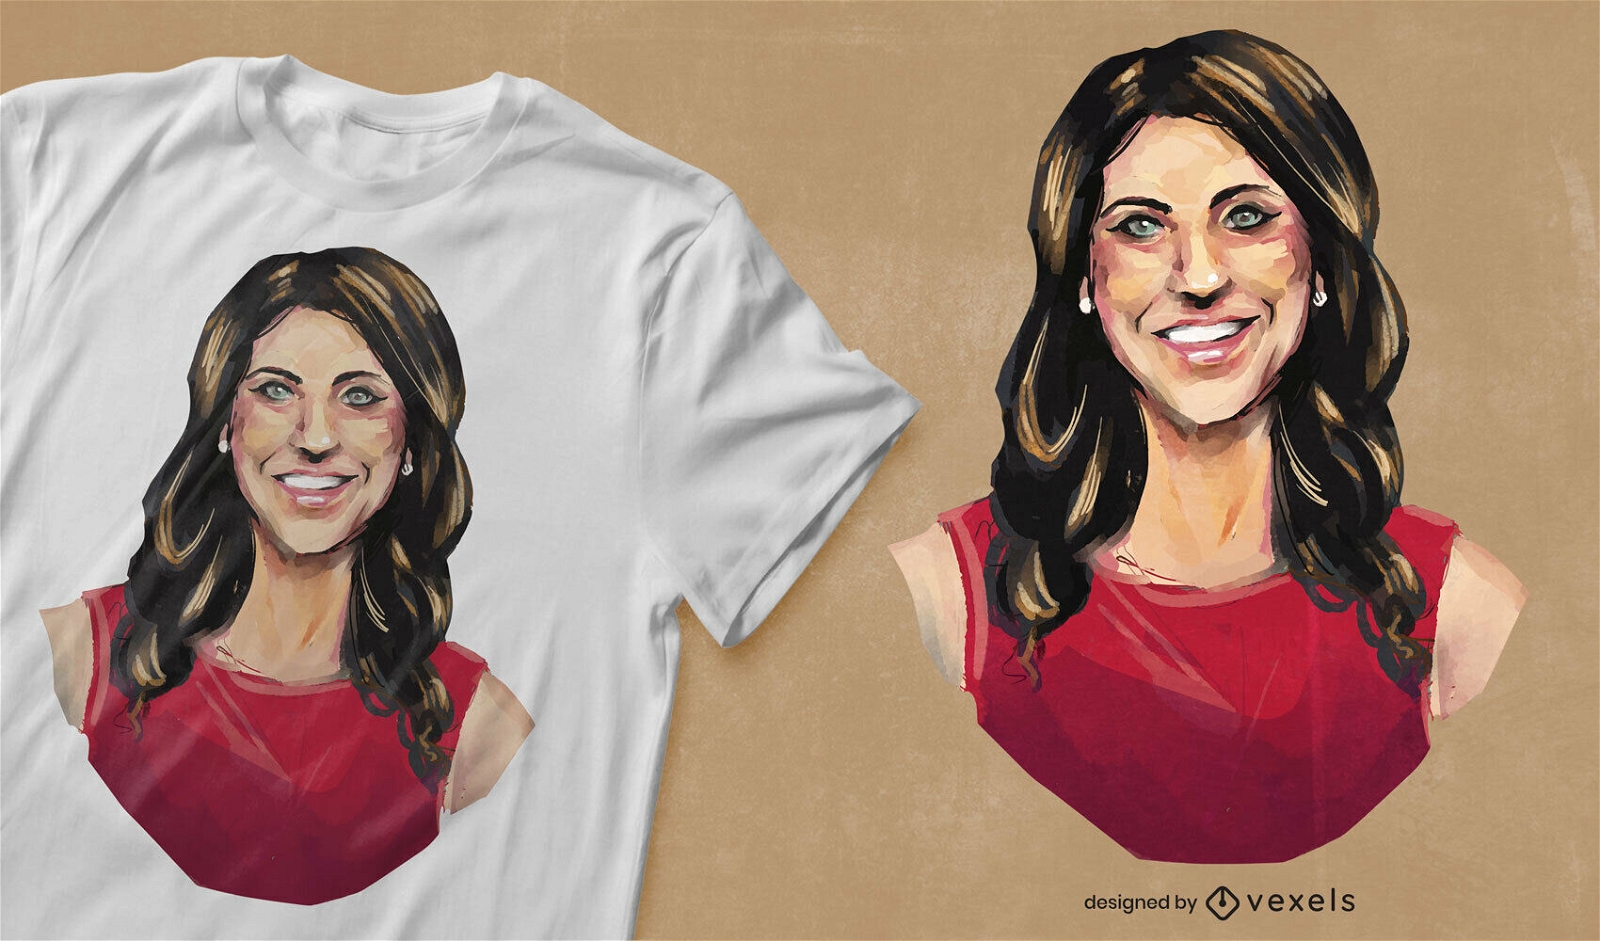
Camiseta realista com o rosto da mulher psd
Escolha uma pasta
Todos os favoritos
Criar novo
Salvar
Camiseta realista com o rosto da mulher psd
Pronto para imprimir
para Merch
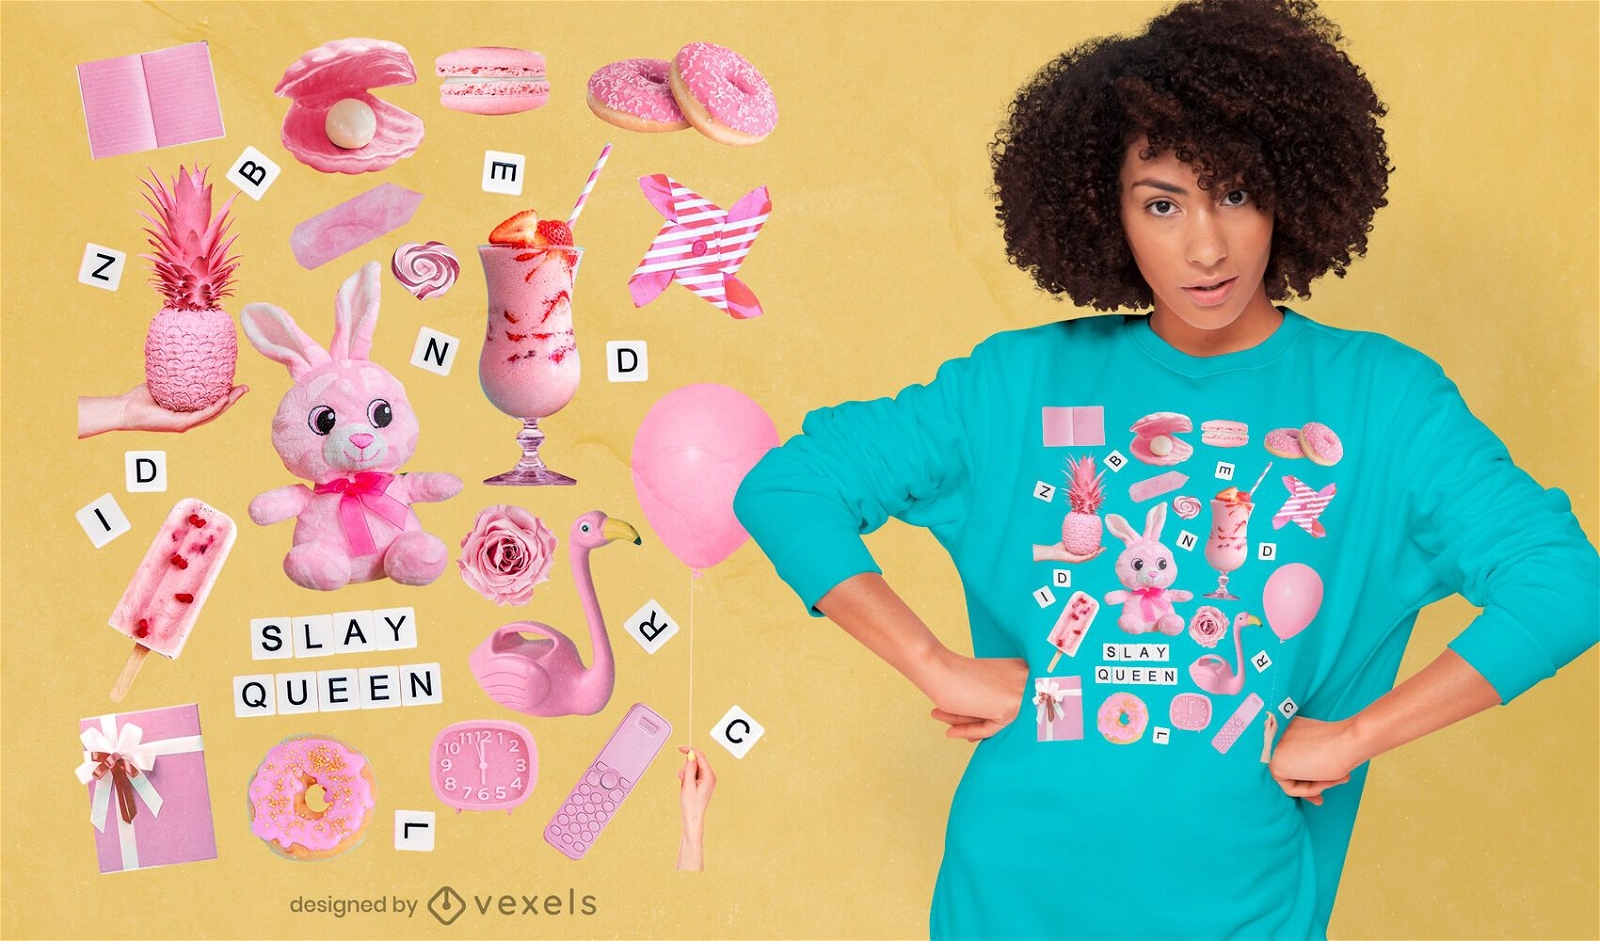
T-shirt psd com elementos rosa
Escolha uma pasta
Todos os favoritos
Criar novo
Salvar
T-shirt psd com elementos rosa
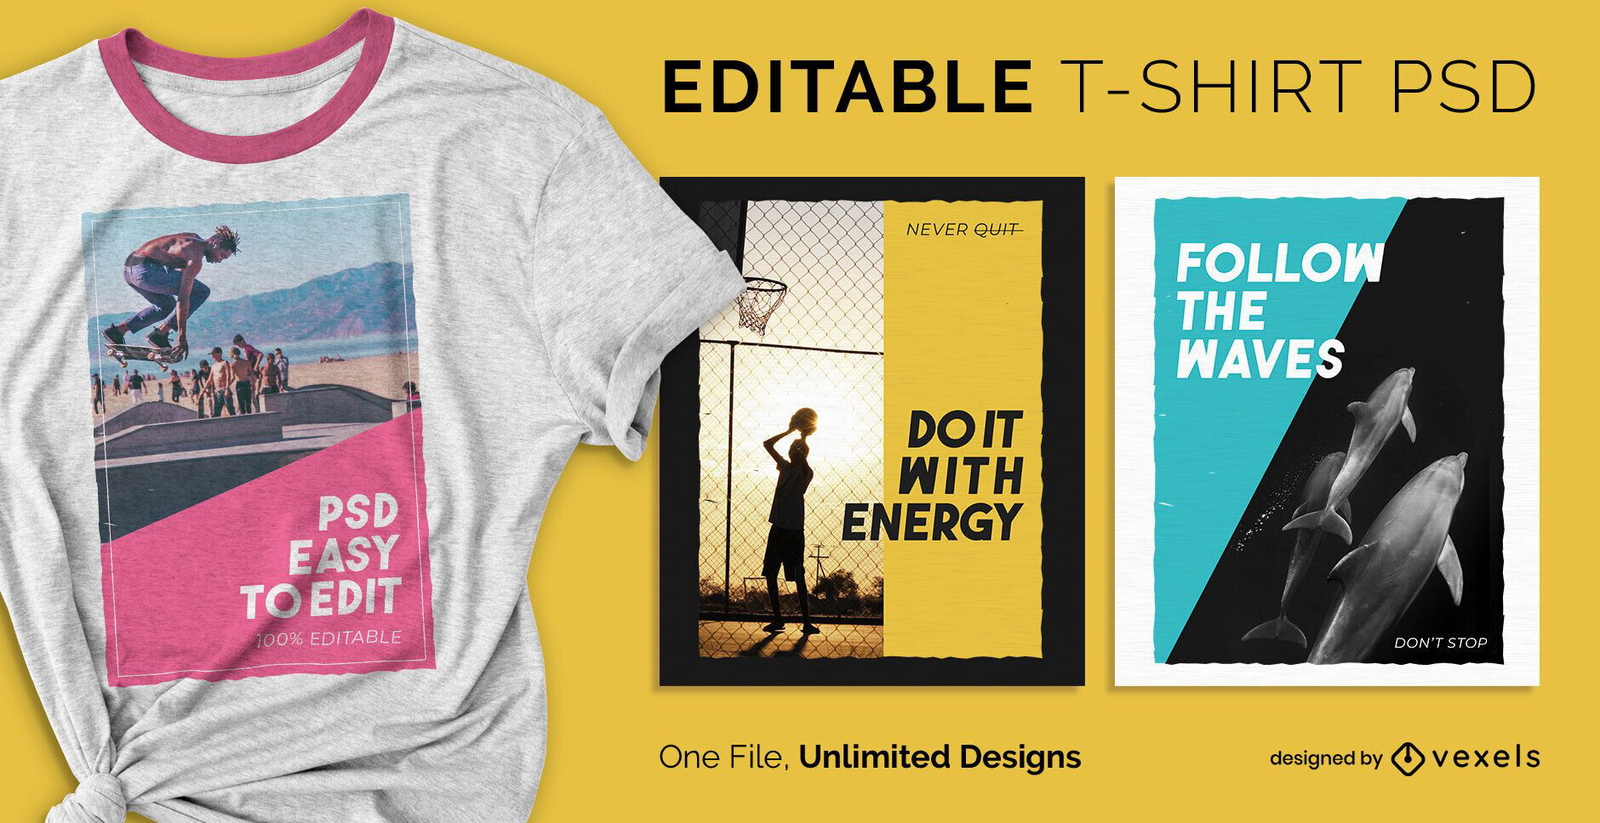
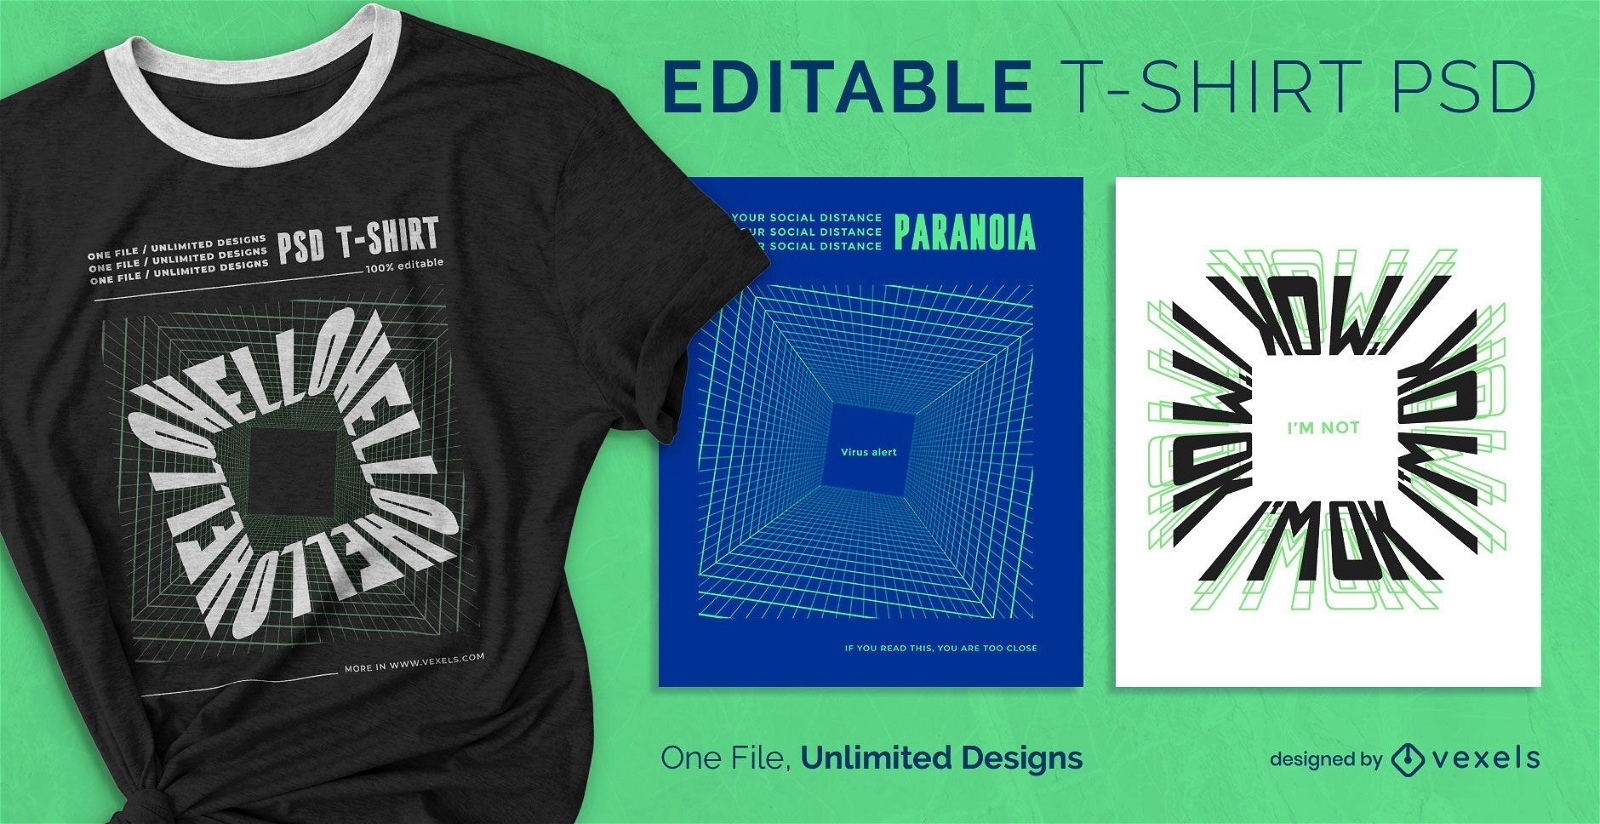
Camiseta PSD escalável
para Merch
Camiseta escalável fotográfica de ação psd
Escolha uma pasta
Todos os favoritos
Criar novo
Salvar
Camiseta escalável fotográfica de ação psd
Camiseta PSD escalável
para Merch
Camiseta digital quadrada escalável psd
Escolha uma pasta
Todos os favoritos
Criar novo
Salvar
Camiseta digital quadrada escalável psd
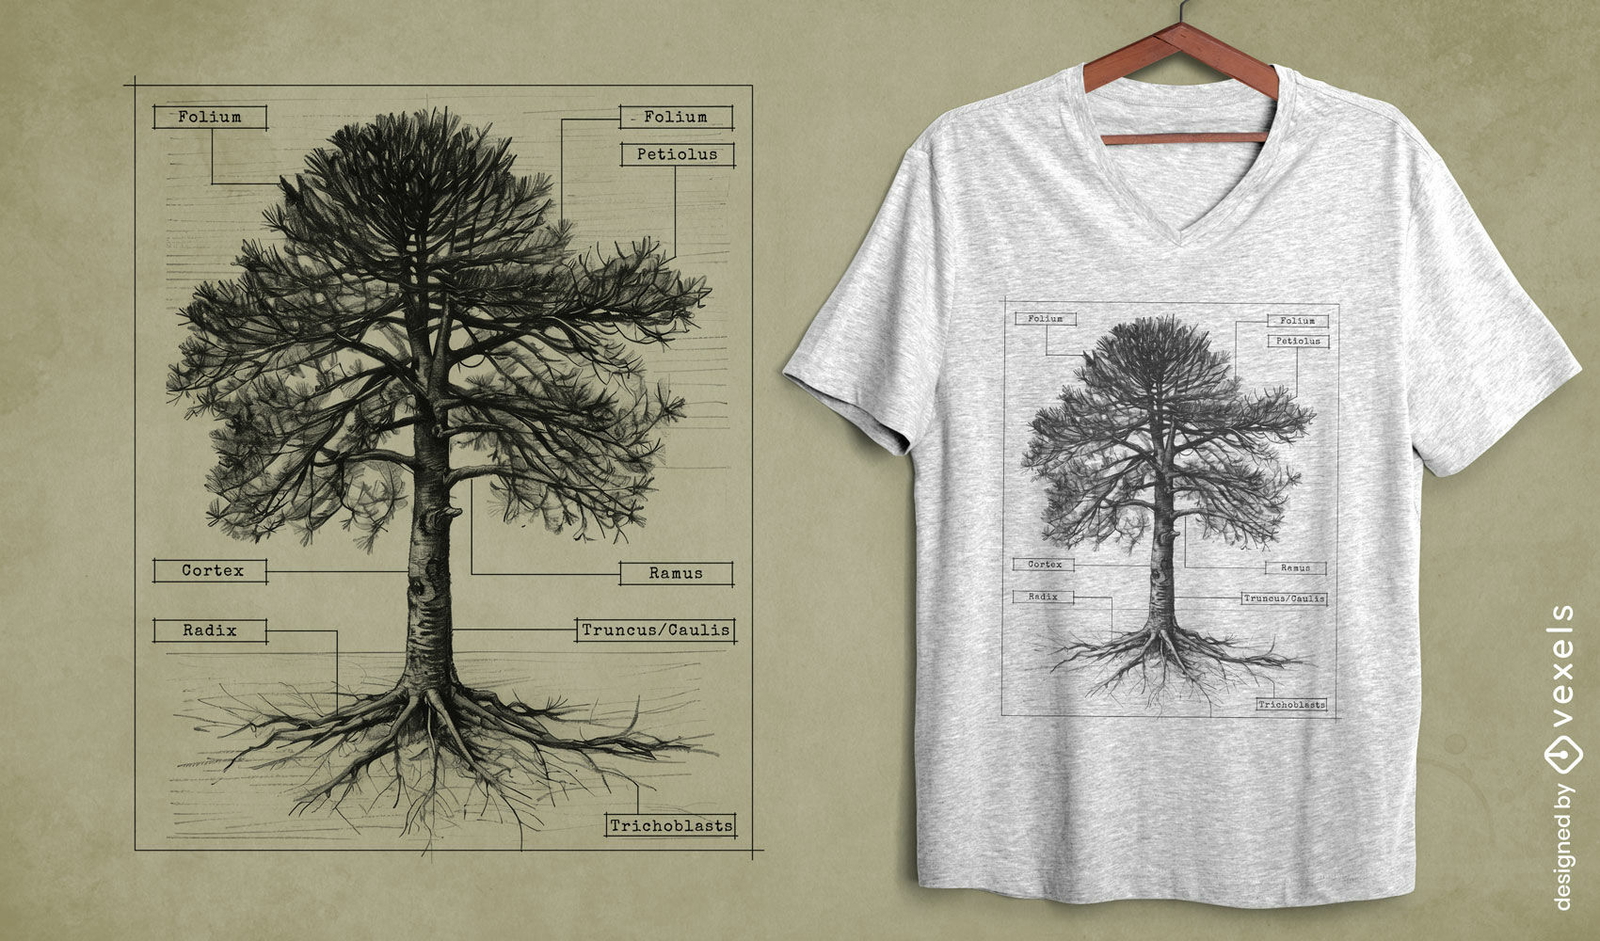
Pronto para imprimir
para Merch
Design de camiseta com anatomia de ?rvore bot?nica
Escolha uma pasta
Todos os favoritos
Criar novo
Salvar
Design de camiseta com anatomia de ?rvore bot?nica
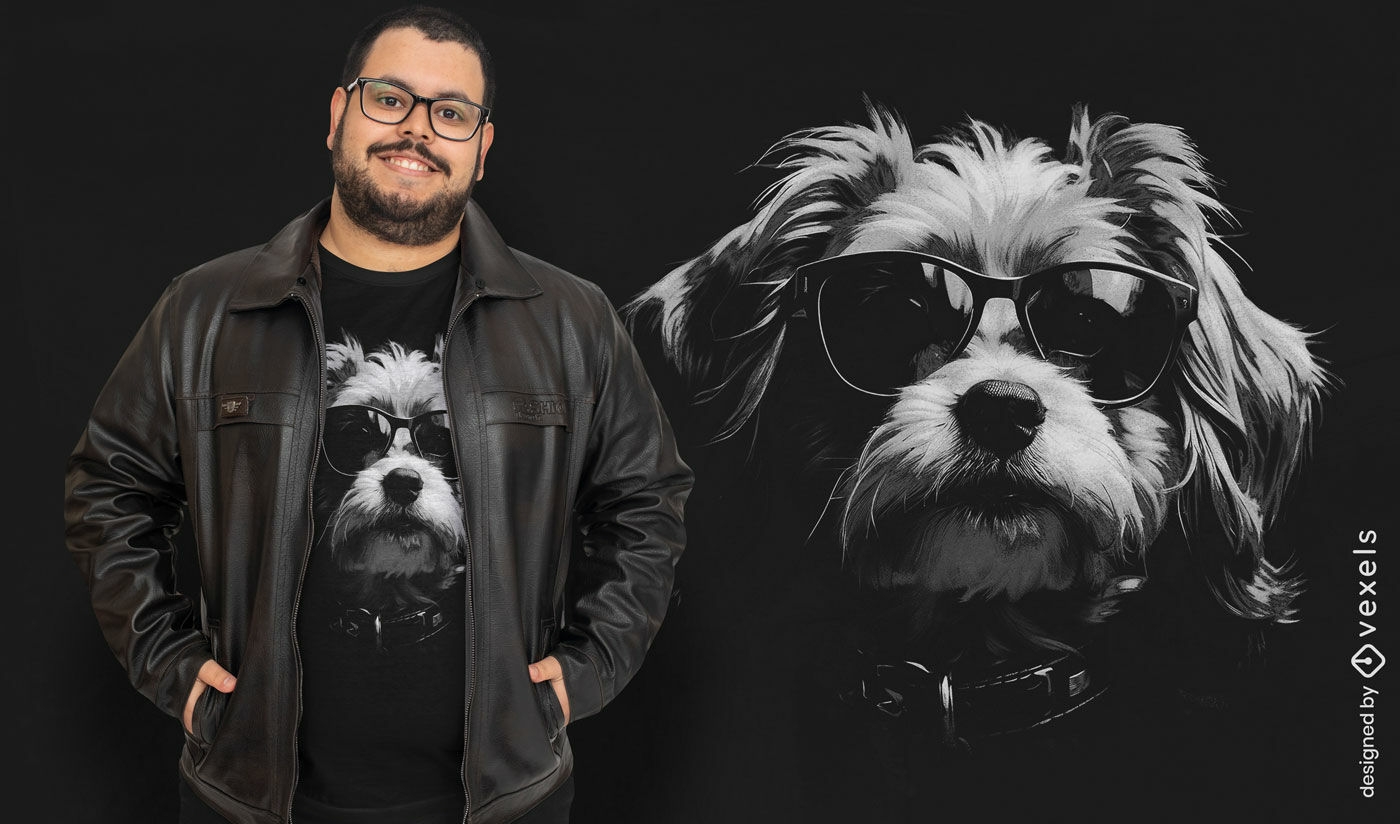
Pronto para imprimir
para Merch
Design de camiseta de cachorro fashion com ?culos de sol
Escolha uma pasta
Todos os favoritos
Criar novo
Salvar
Design de camiseta de cachorro fashion com ?culos de sol
texto editável
Pronto para imprimir
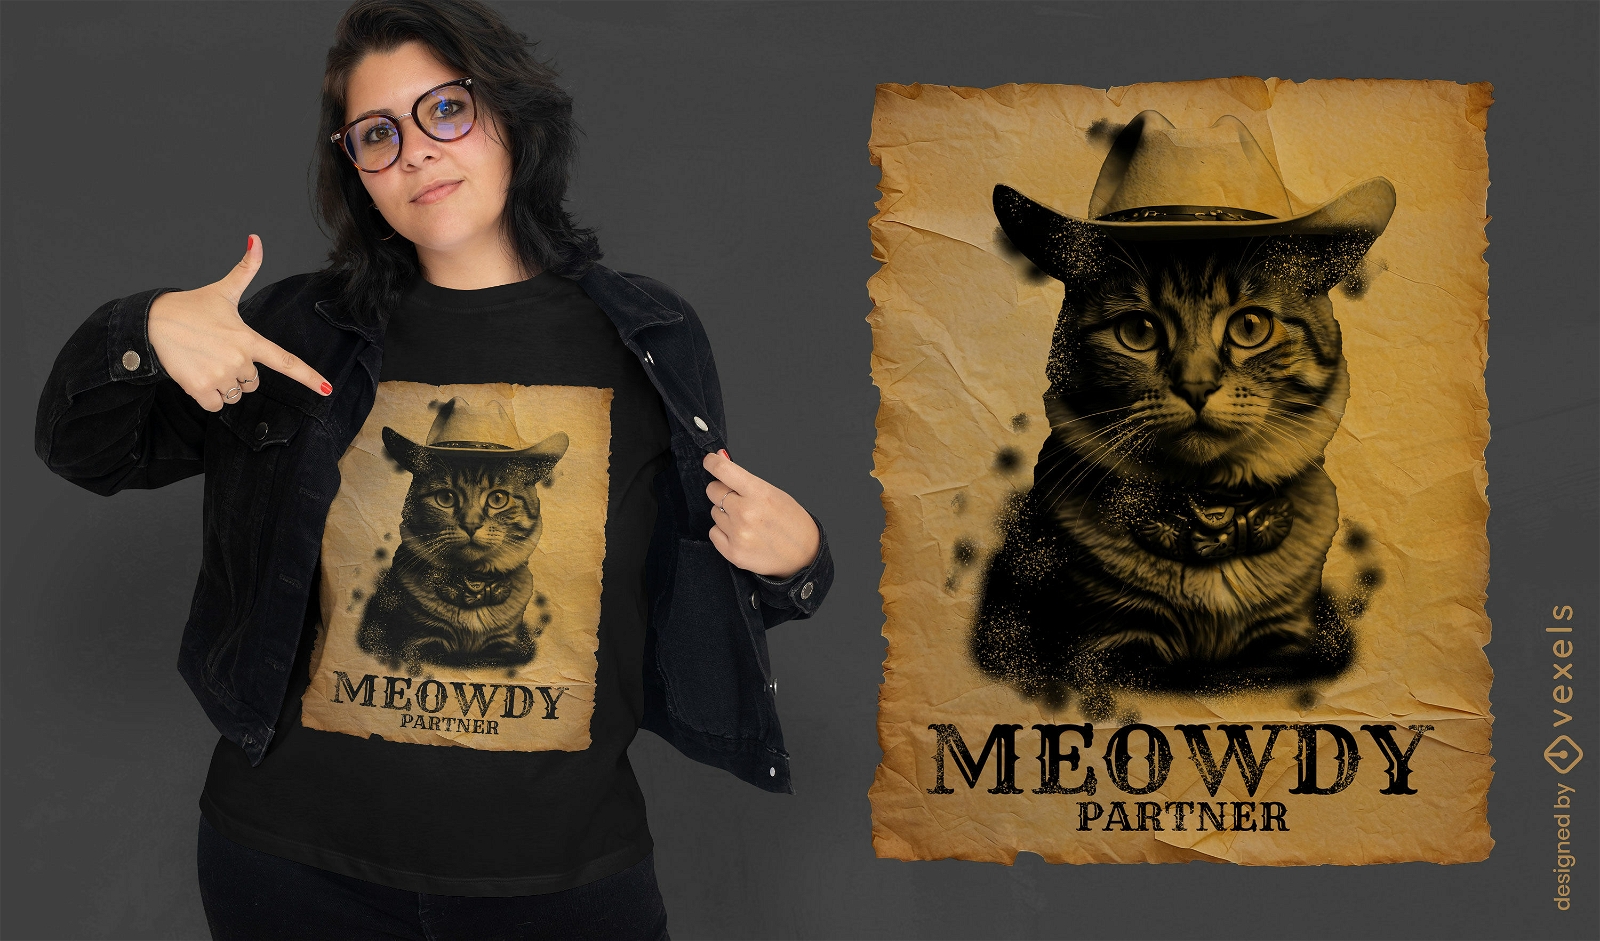
para Merch
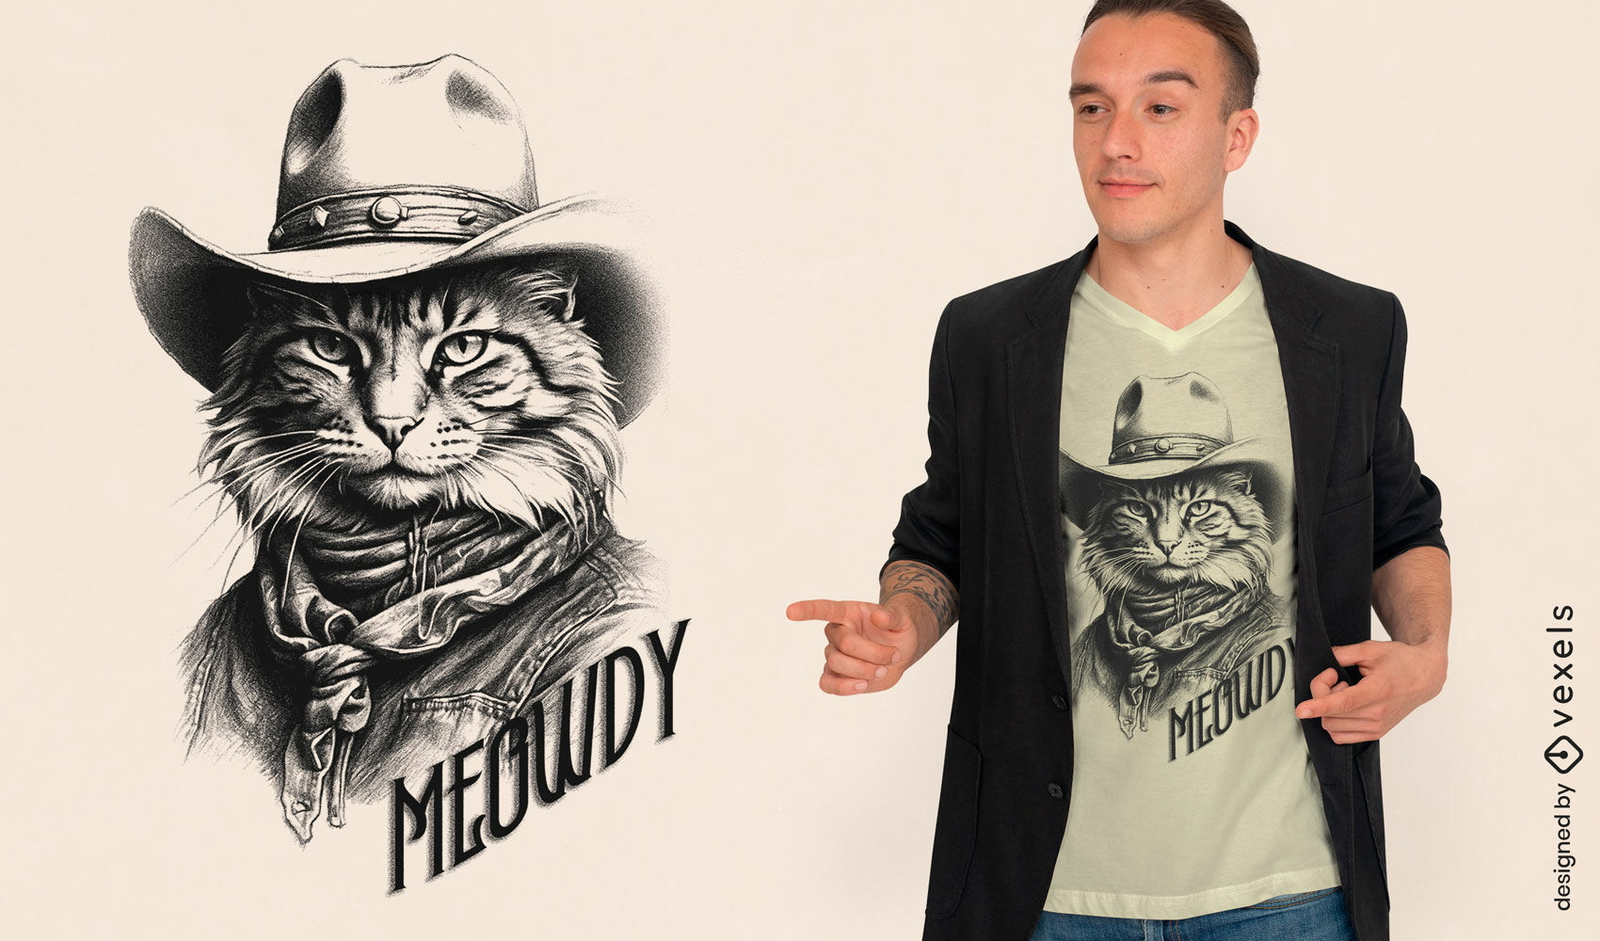
Design de camiseta de gato cowboy Meowdy
Escolha uma pasta
Todos os favoritos
Criar novo
Salvar
Design de camiseta de gato cowboy Meowdy
Gerado por IA, selecionado por nossos designers.
para Merch
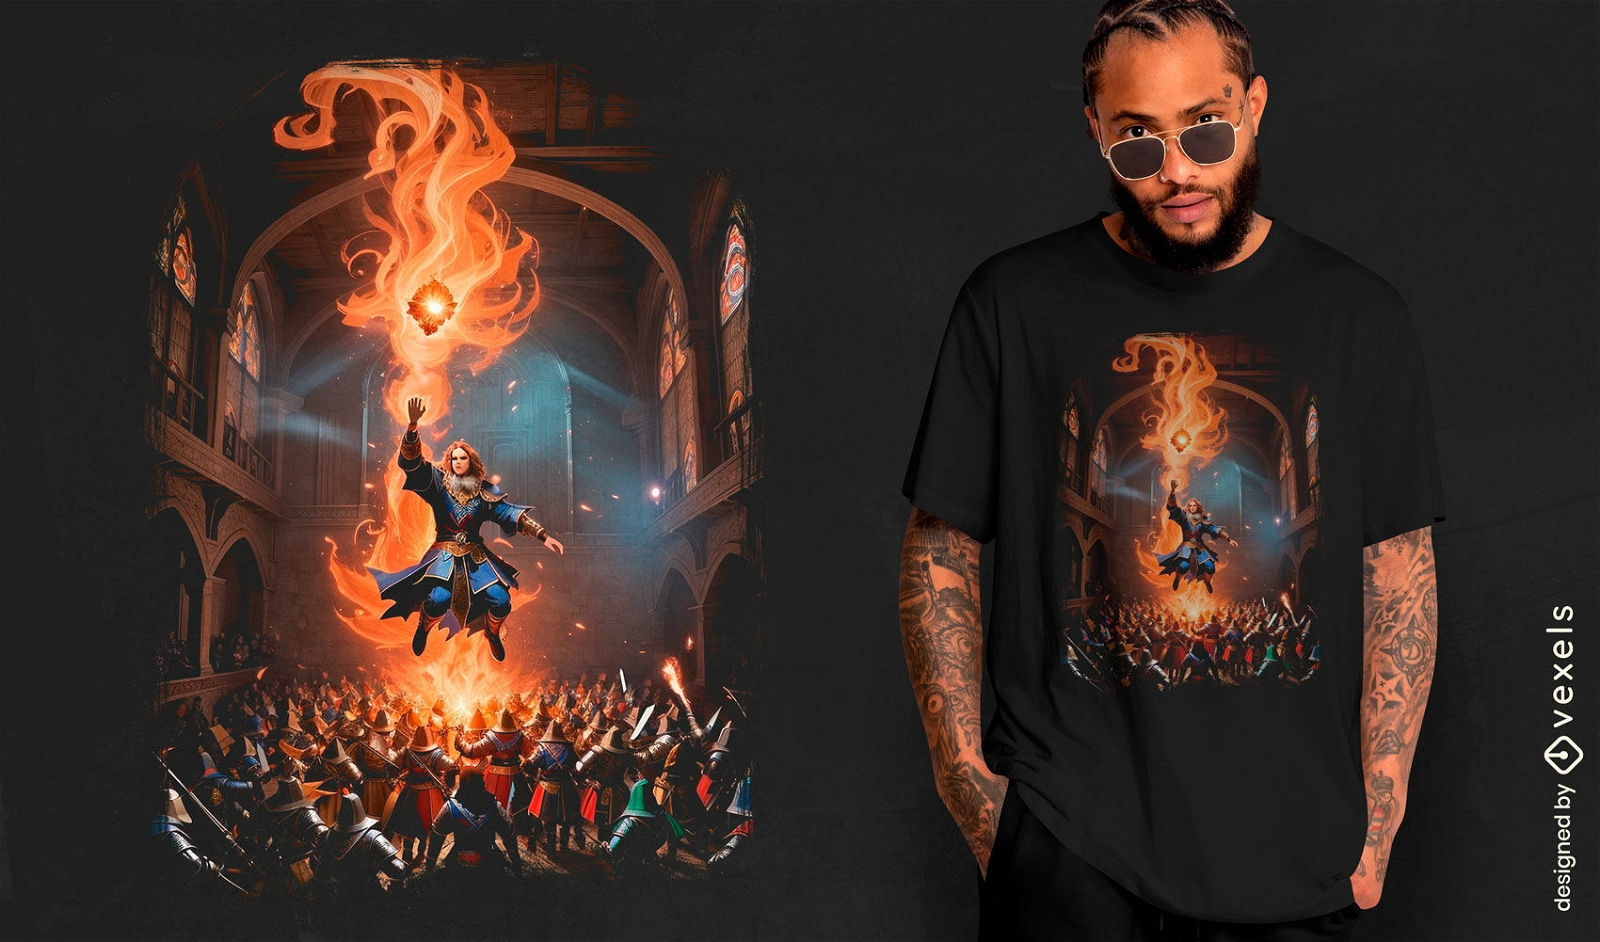
Design de camiseta de batalha de feiticeiro ardente
Escolha uma pasta
Todos os favoritos
Criar novo
Salvar
Design de camiseta de batalha de feiticeiro ardente
Gerado por IA, selecionado por nossos designers.
para Merch
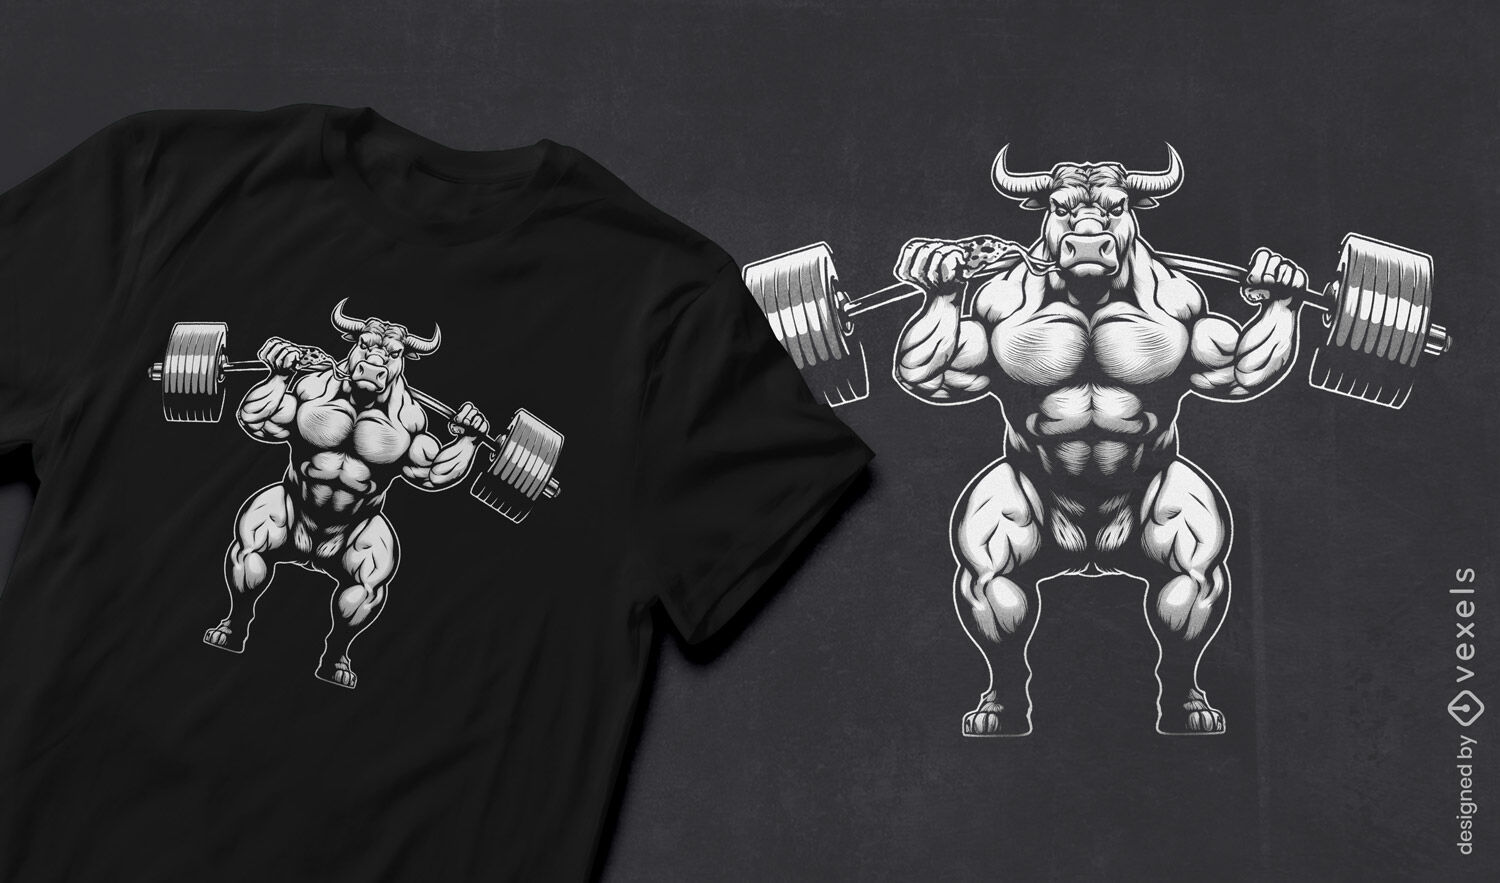
Design cômico de camiseta de vaca musculosa
Escolha uma pasta
Todos os favoritos
Criar novo
Salvar
Design cômico de camiseta de vaca musculosa
Pronto para imprimir
para Merch
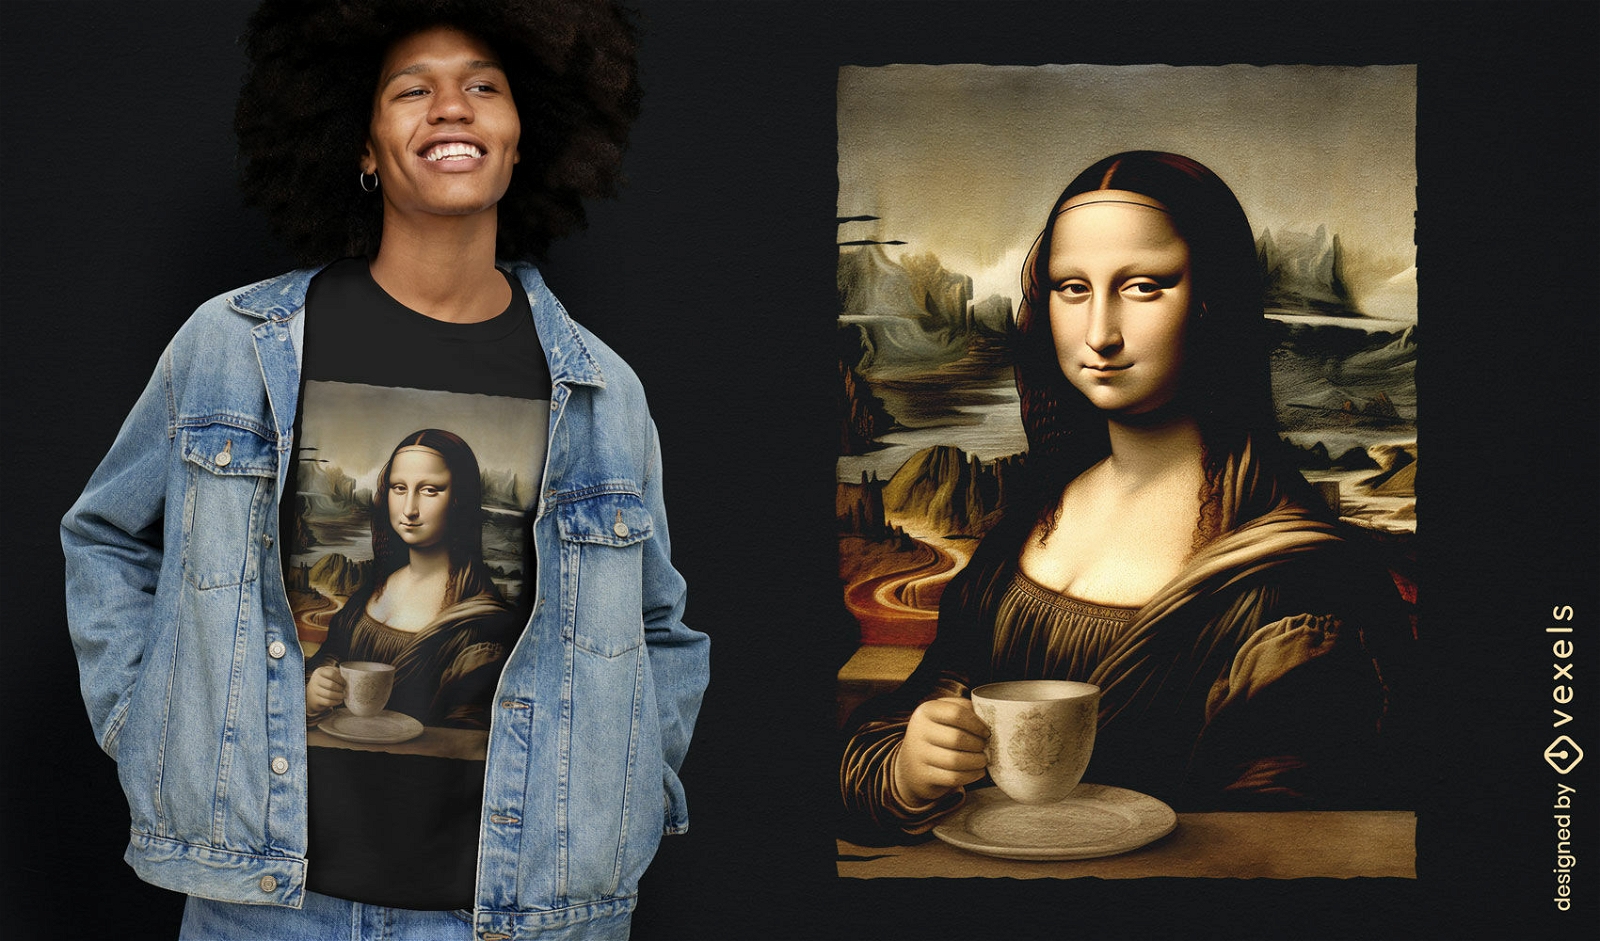
Design de camiseta com caf? Mona Lisa
Escolha uma pasta
Todos os favoritos
Criar novo
Salvar
Design de camiseta com caf? Mona Lisa
Gerado por IA, selecionado por nossos designers.
para Merch
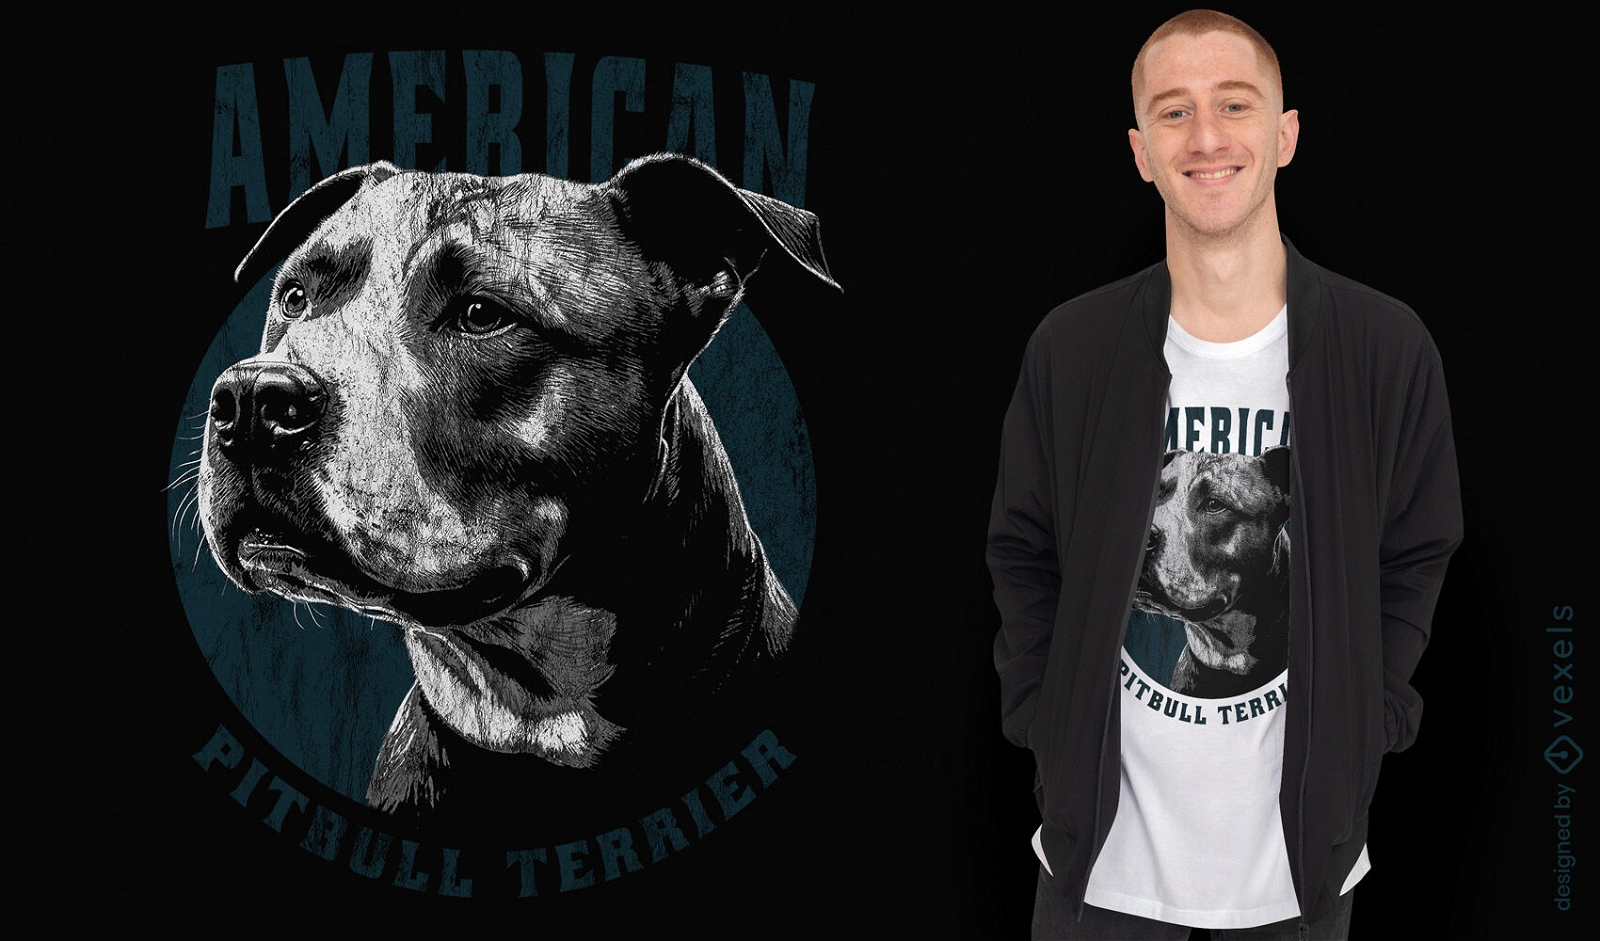
Design de camiseta American Pit Bull Terrier
Escolha uma pasta
Todos os favoritos
Criar novo
Salvar
Design de camiseta American Pit Bull Terrier
Gerado por IA, selecionado por nossos designers.
para Merch
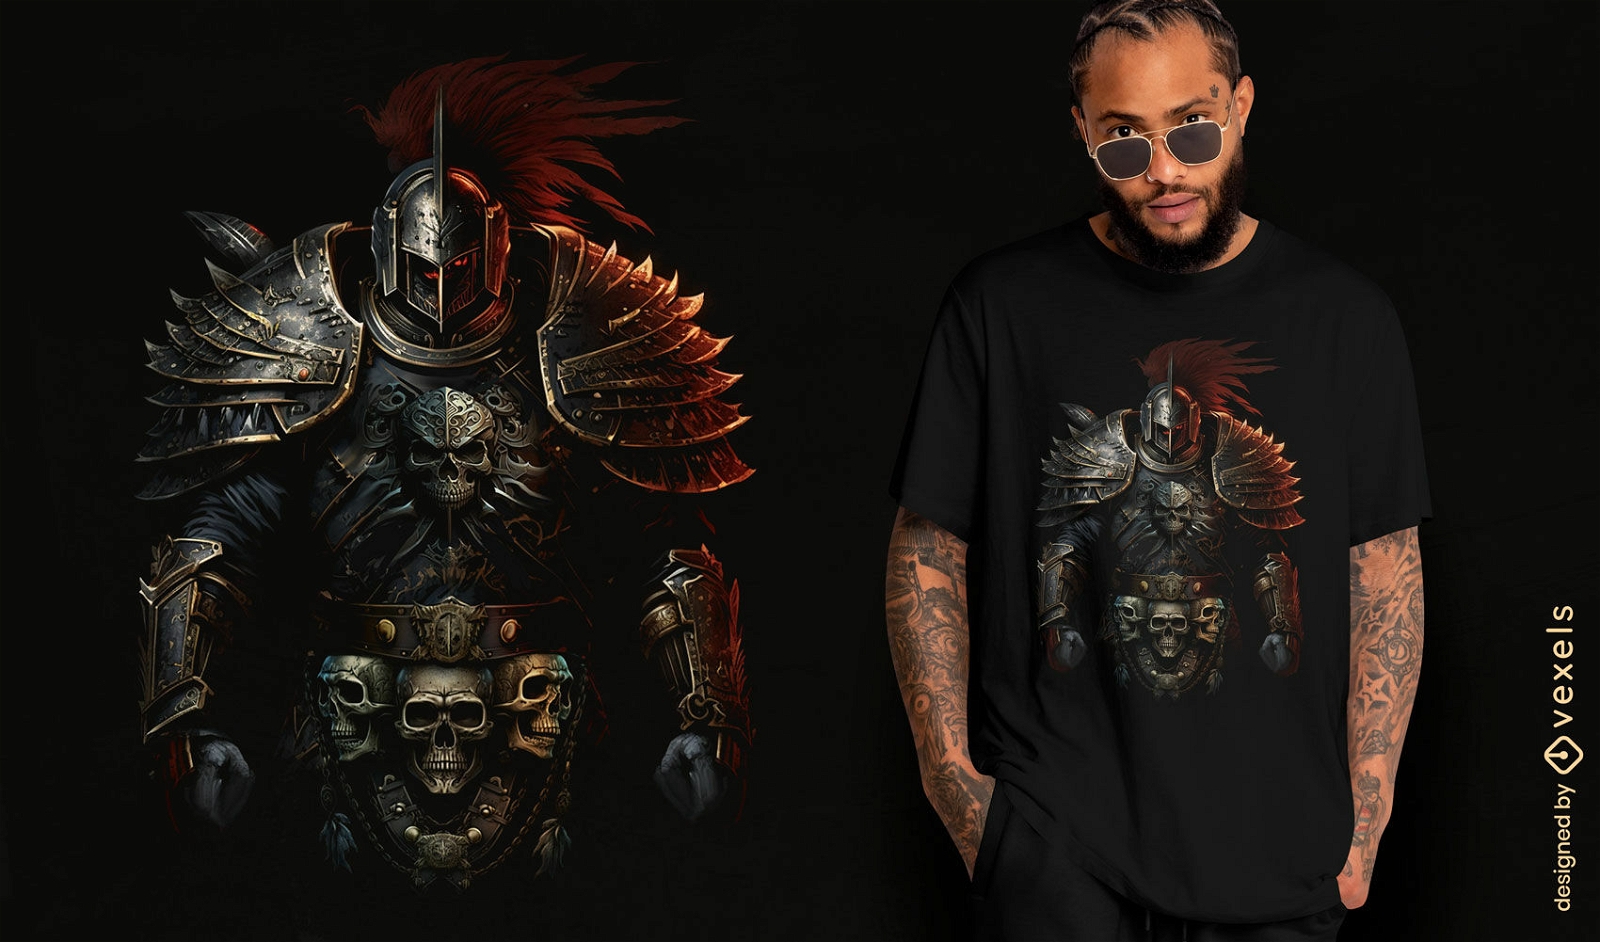
Design de camiseta com armadura de guerreiro samurai
Escolha uma pasta
Todos os favoritos
Criar novo
Salvar
Design de camiseta com armadura de guerreiro samurai
texto editável
Pronto para imprimir
para Merch
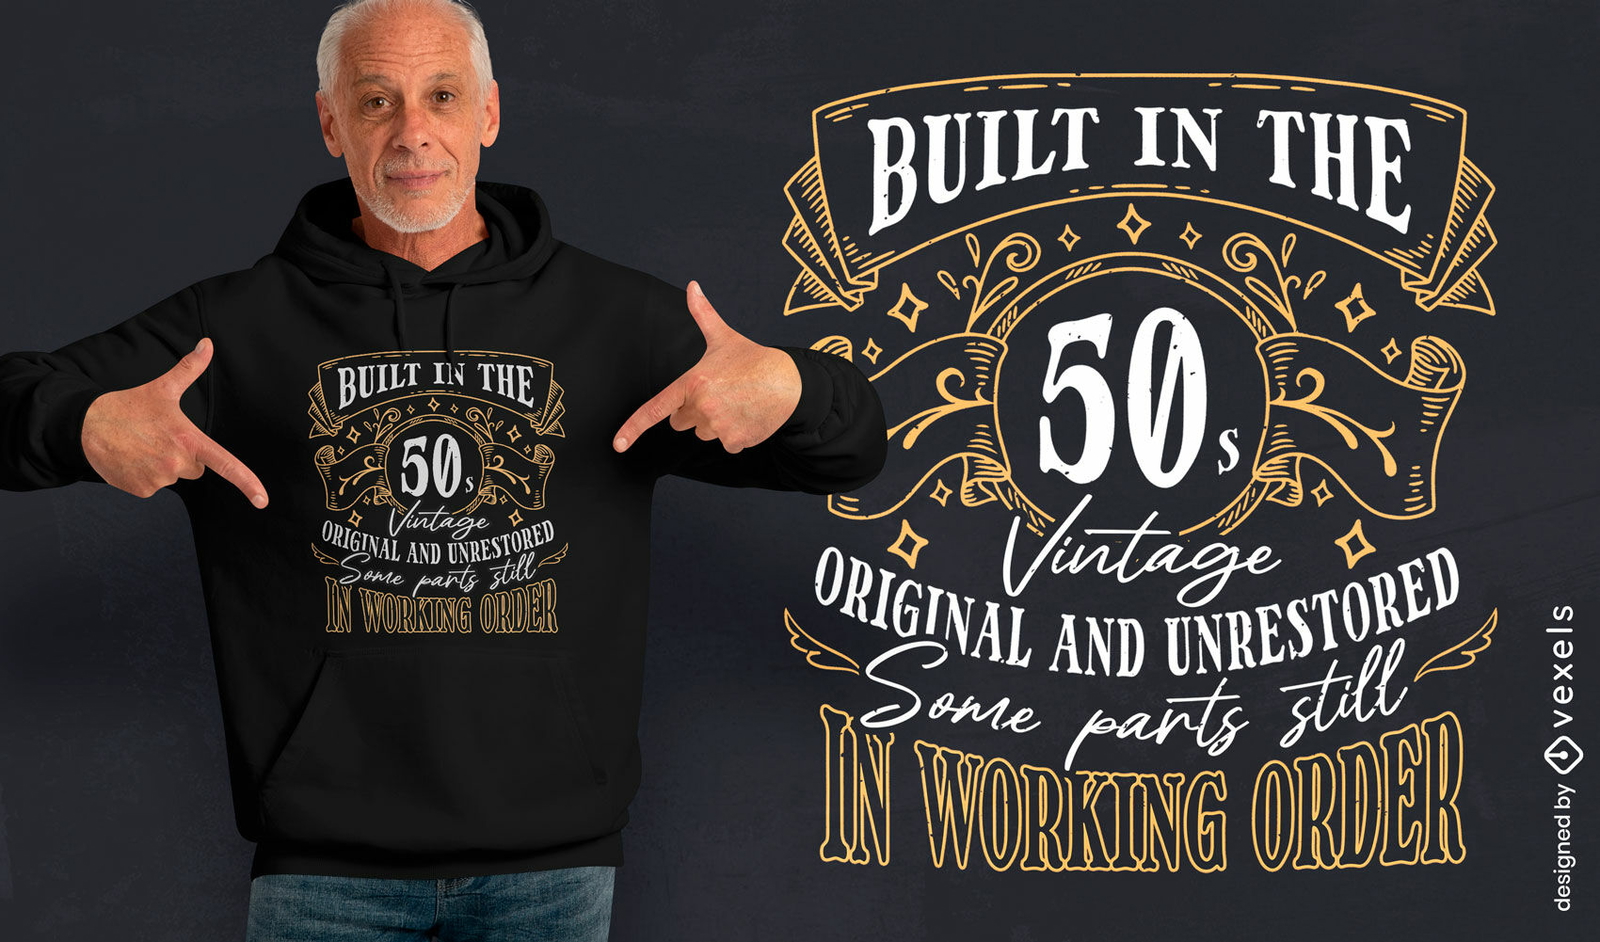
Construído no design de camisetas dos anos 50
Escolha uma pasta
Todos os favoritos
Criar novo
Salvar
Construído no design de camisetas dos anos 50
texto editável
Pronto para imprimir
para Merch
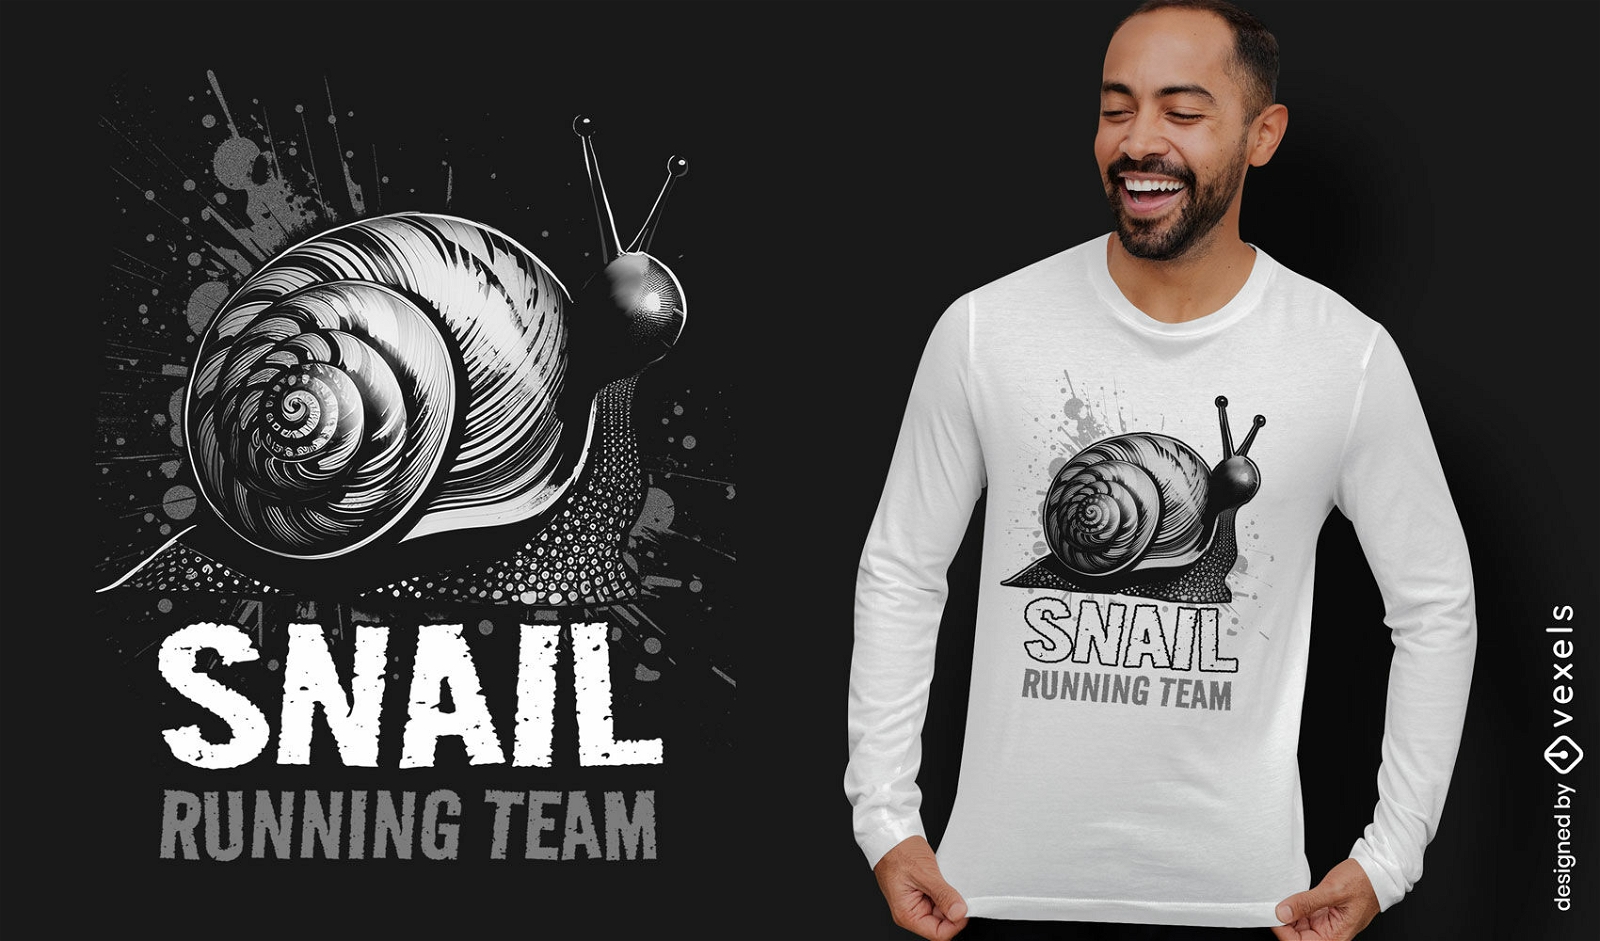
Design de camiseta da equipe de corrida de caracol
Escolha uma pasta
Todos os favoritos
Criar novo
Salvar
Design de camiseta da equipe de corrida de caracol
Pronto para imprimir
para Merch
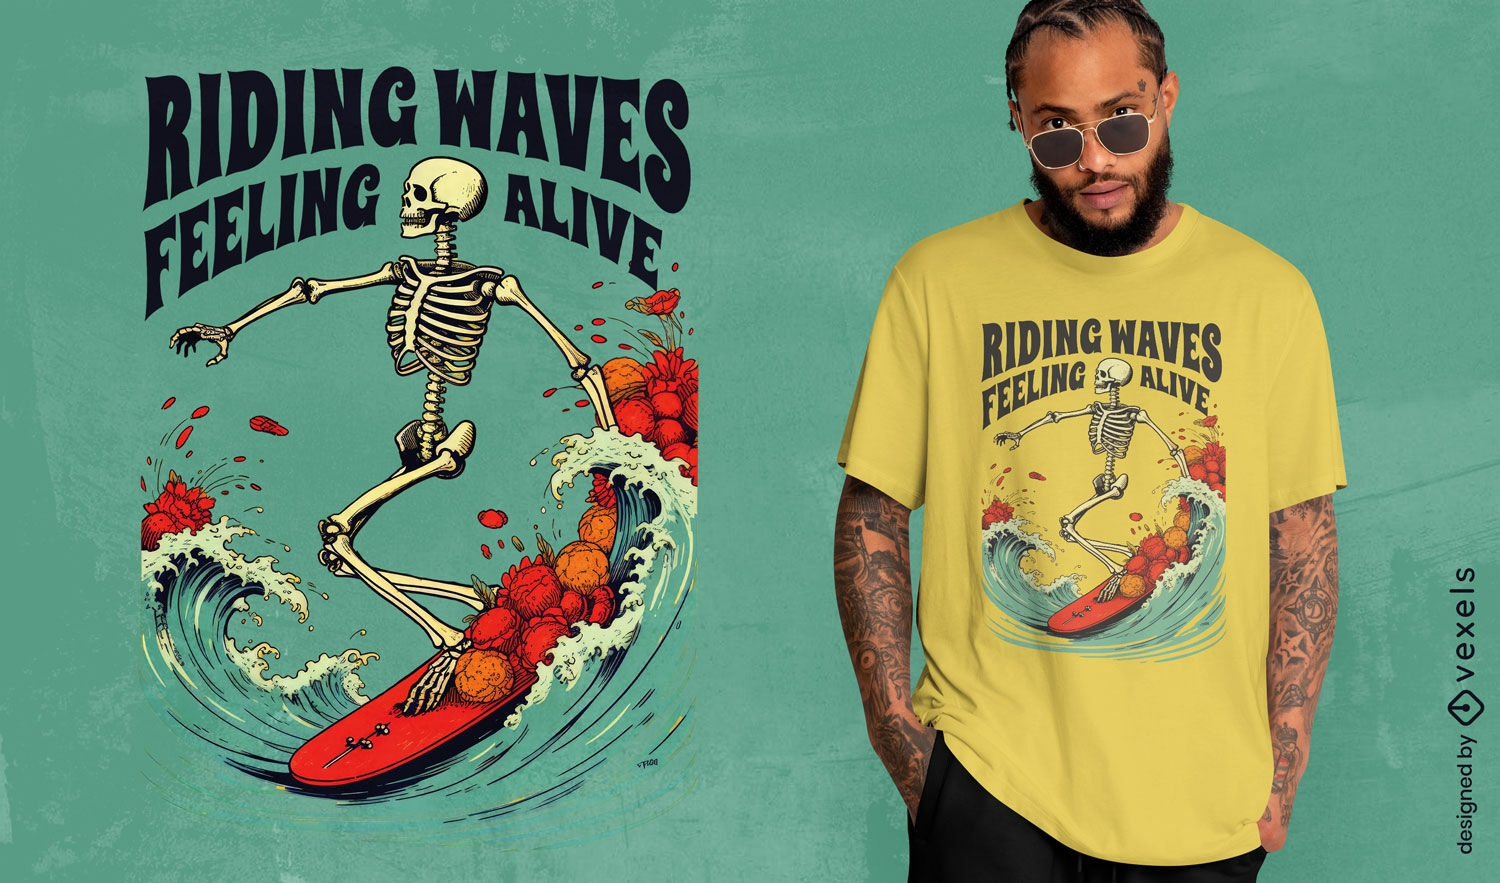
Design de camiseta de esqueleto de ondas montando
Escolha uma pasta
Todos os favoritos
Criar novo
Salvar
Design de camiseta de esqueleto de ondas montando
Pronto para imprimir
para Merch
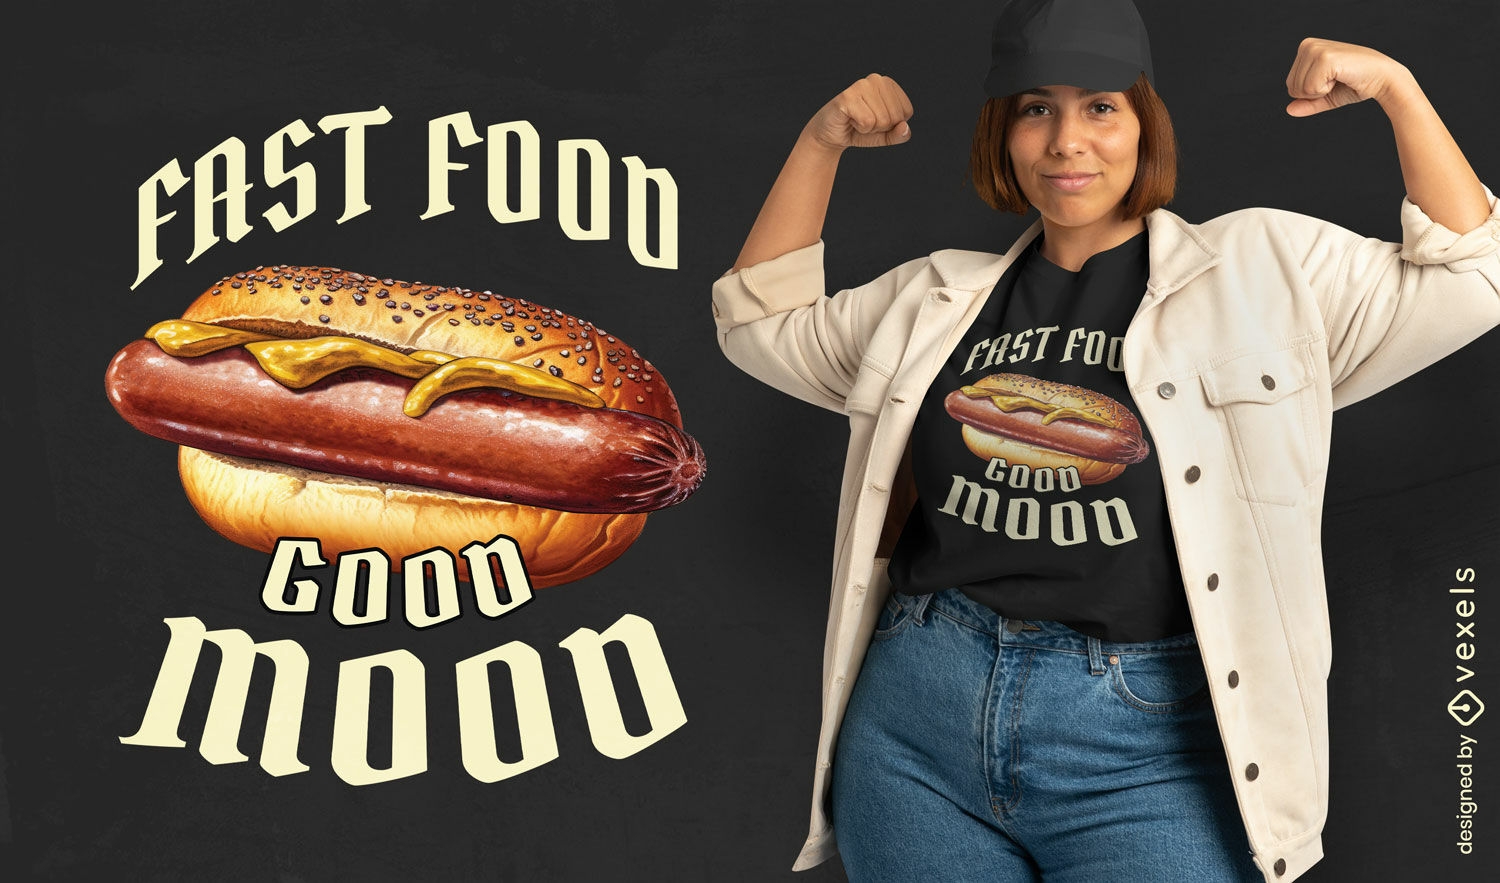
Design de camiseta de bom humor de cachorro-quente
Escolha uma pasta
Todos os favoritos
Criar novo
Salvar
Design de camiseta de bom humor de cachorro-quente
texto editável
Pronto para imprimir
para Merch
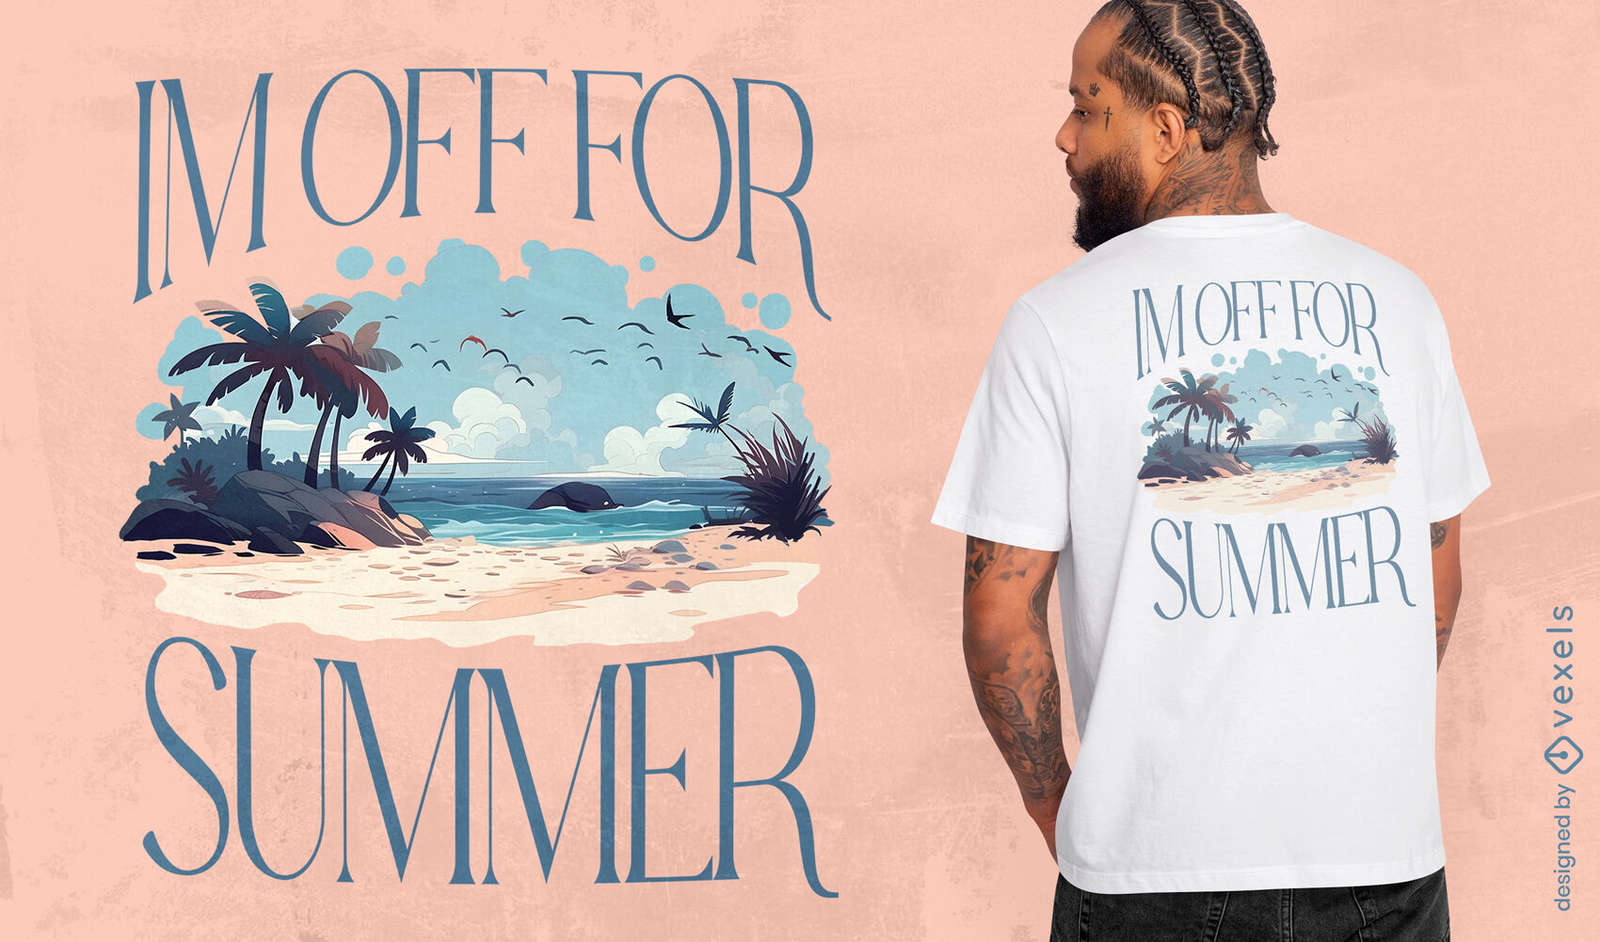
Estou indo para o design de camisetas de verão
Escolha uma pasta
Todos os favoritos
Criar novo
Salvar
Estou indo para o design de camisetas de verão
Gerado por IA, selecionado por nossos designers.
para Merch
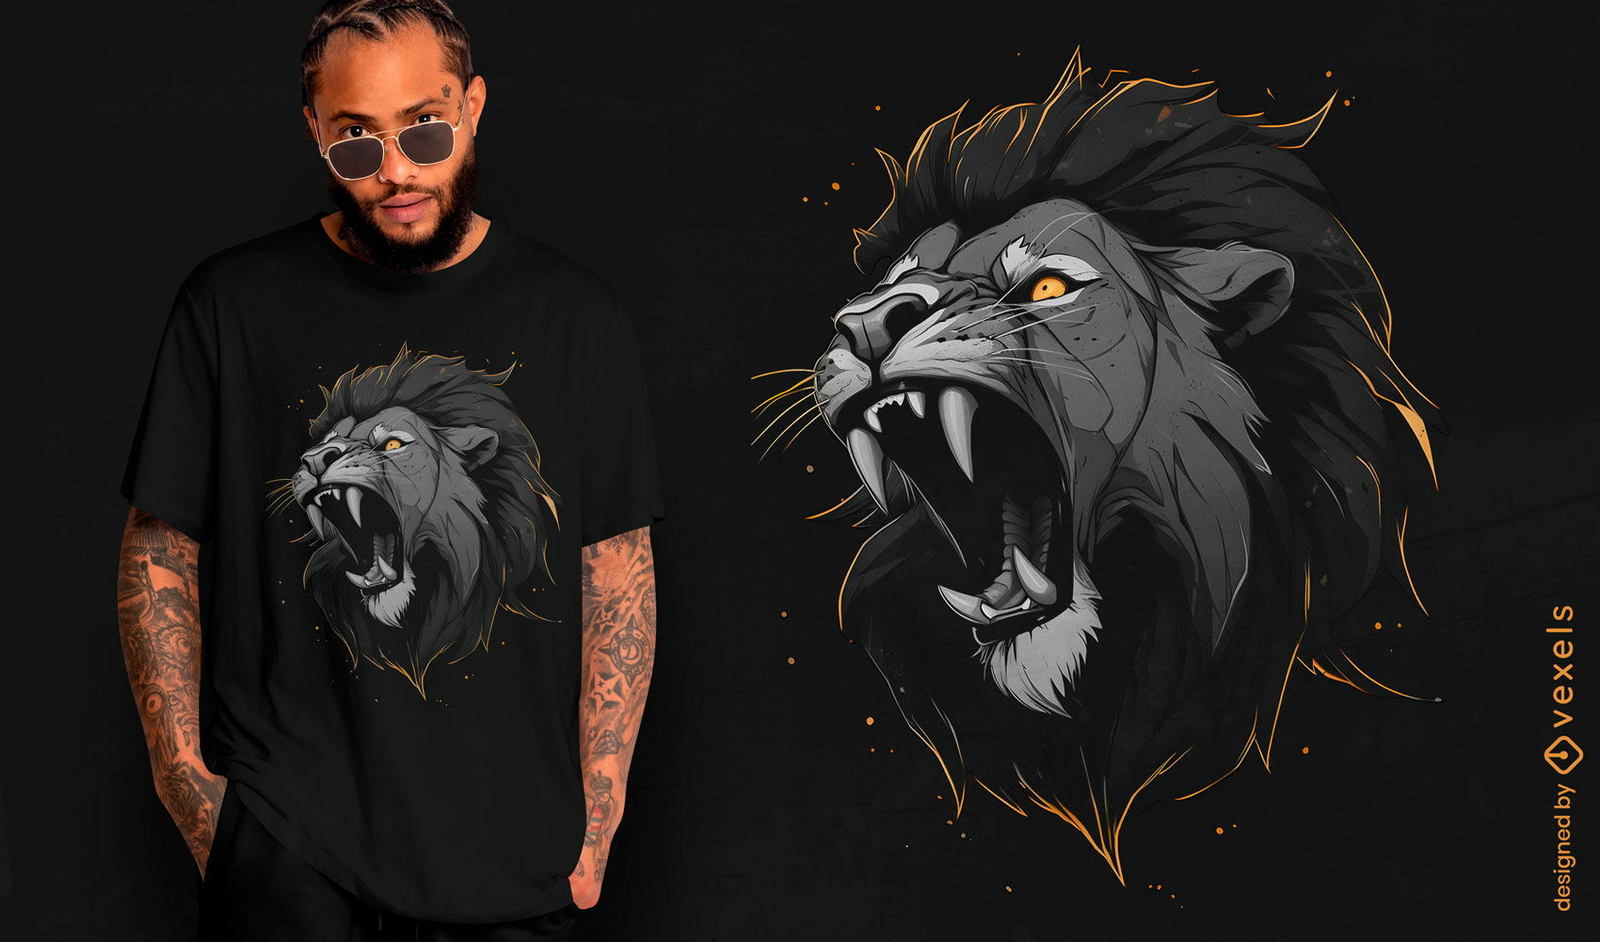
Design de camiseta com le?o rugindo
Escolha uma pasta
Todos os favoritos
Criar novo
Salvar
Design de camiseta com le?o rugindo
Pronto para imprimir
para Merch
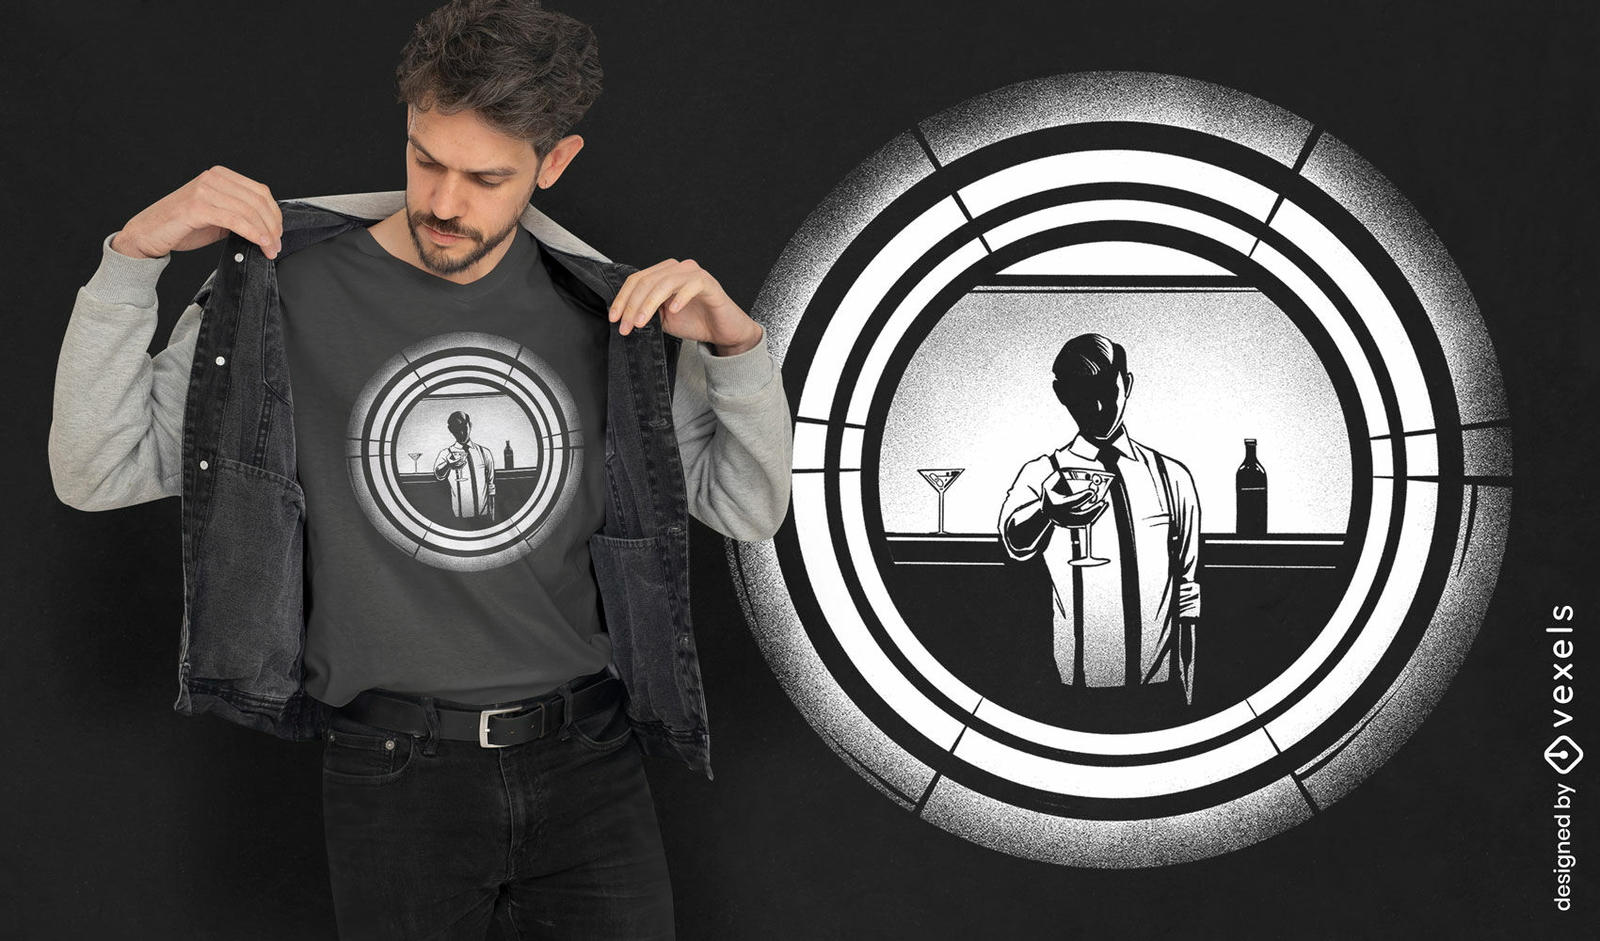
Design de camiseta de homem de bar retrô
Escolha uma pasta
Todos os favoritos
Criar novo
Salvar
Design de camiseta de homem de bar retrô
texto editável
Pronto para imprimir
para Merch
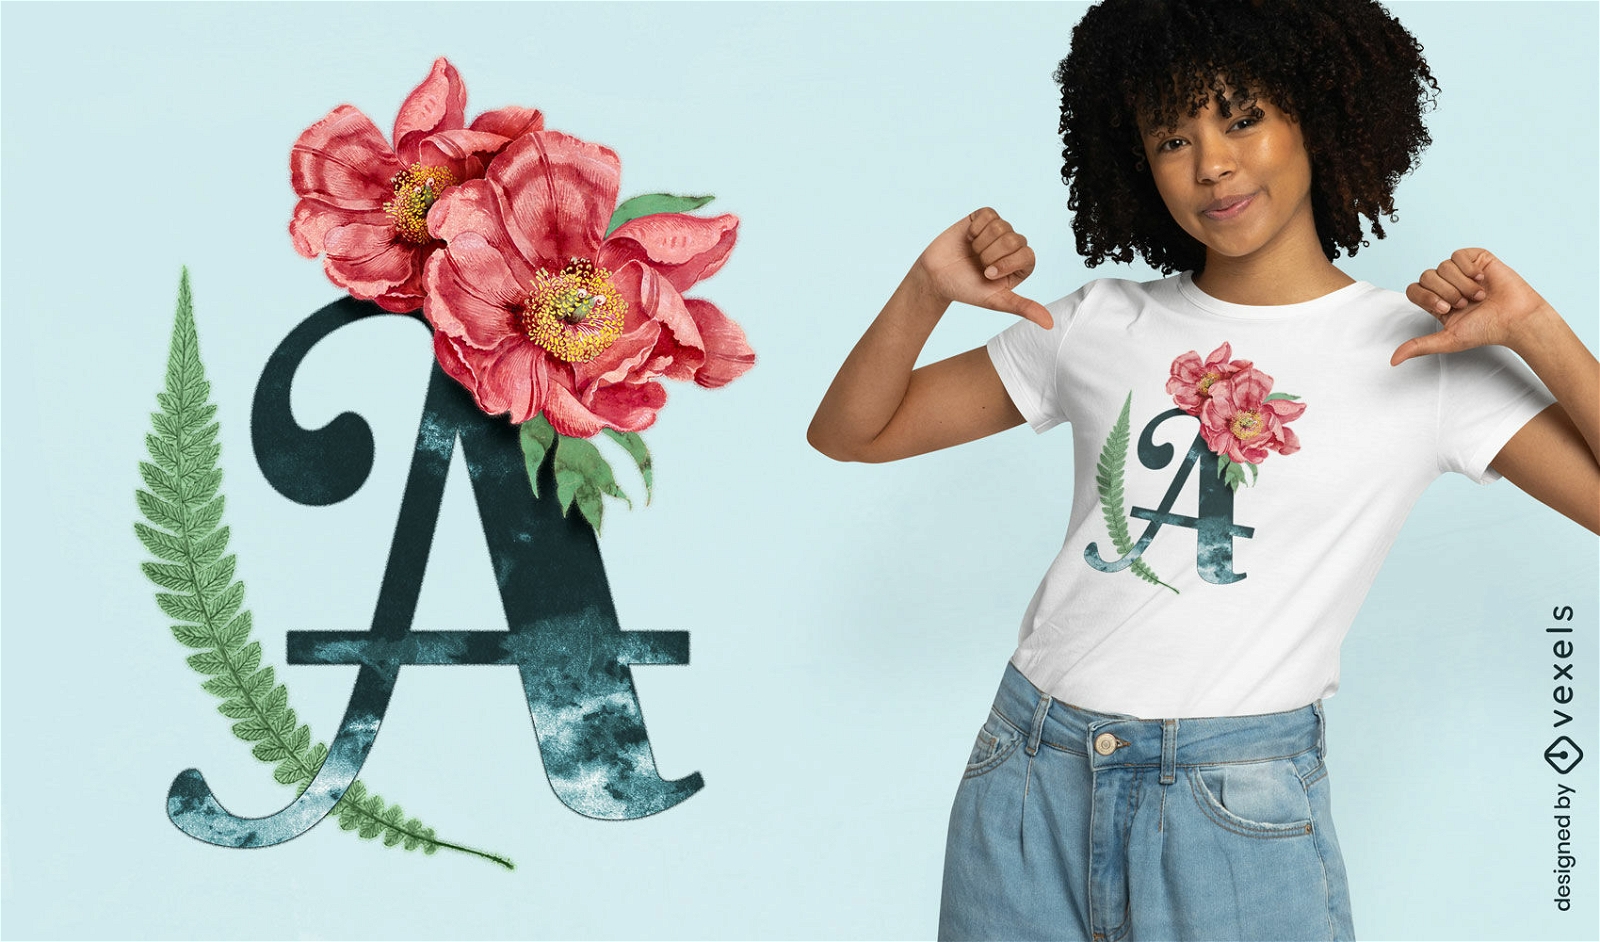
Design de camiseta floral letra A
Escolha uma pasta
Todos os favoritos
Criar novo
Salvar
Design de camiseta floral letra A
Pronto para imprimir
para Merch
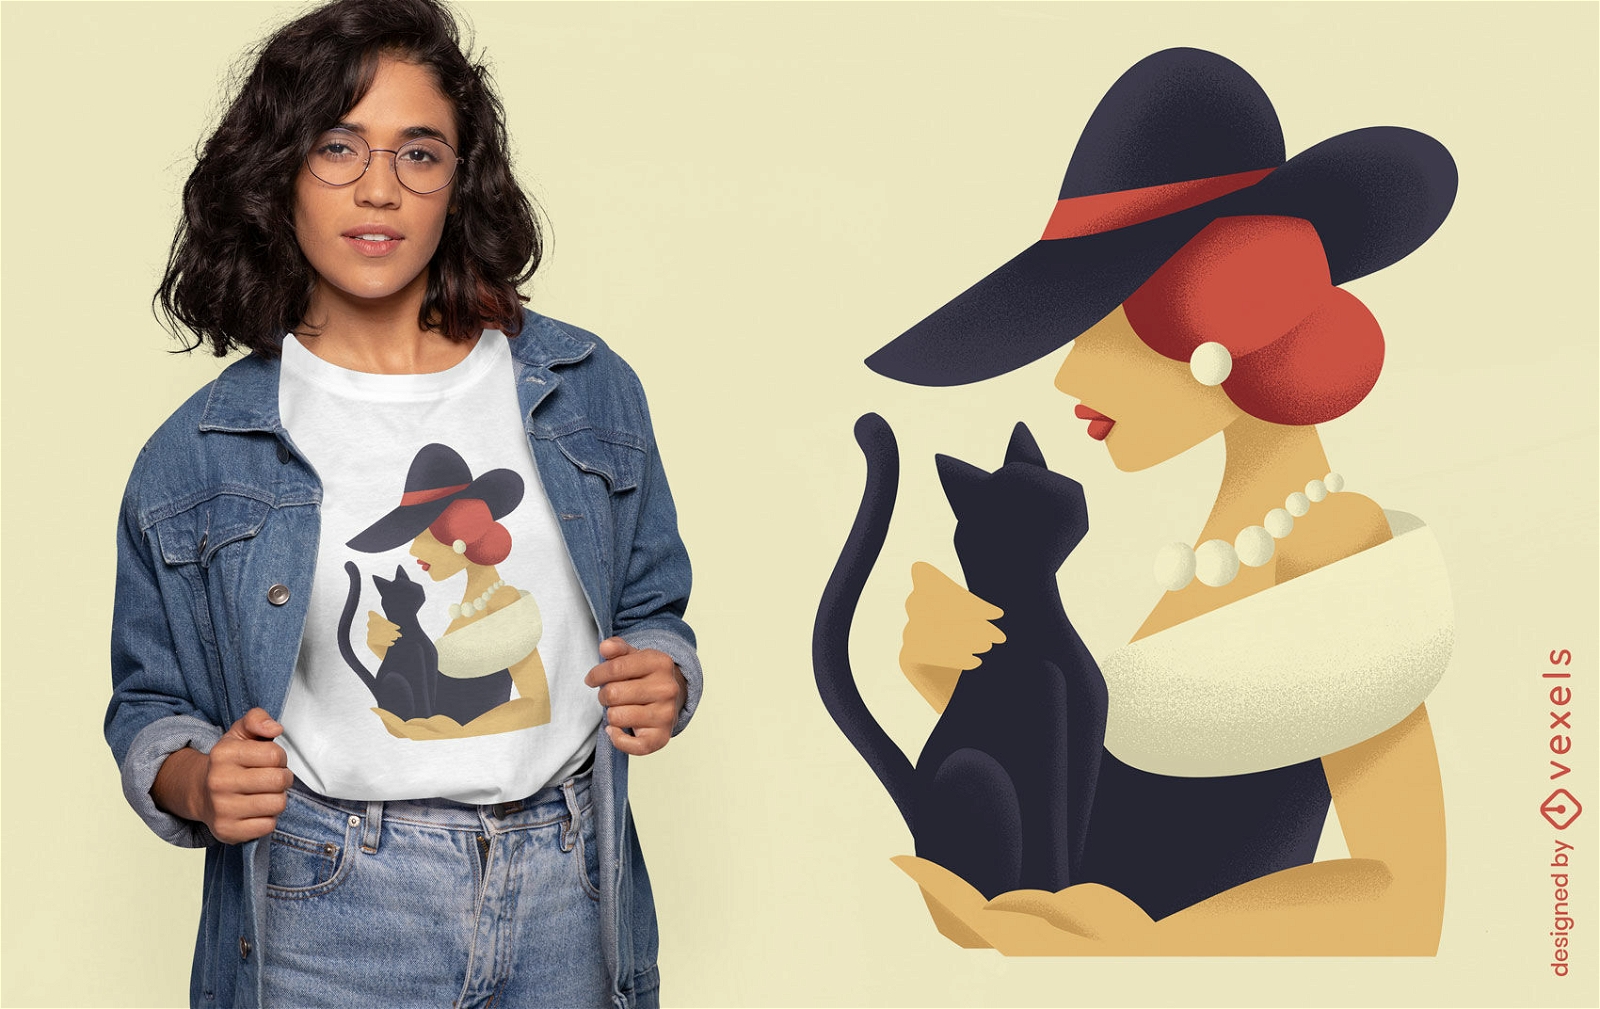
Mulher com design de camiseta de gato preto
Escolha uma pasta
Todos os favoritos
Criar novo
Salvar
Mulher com design de camiseta de gato preto
texto editável
para Merch
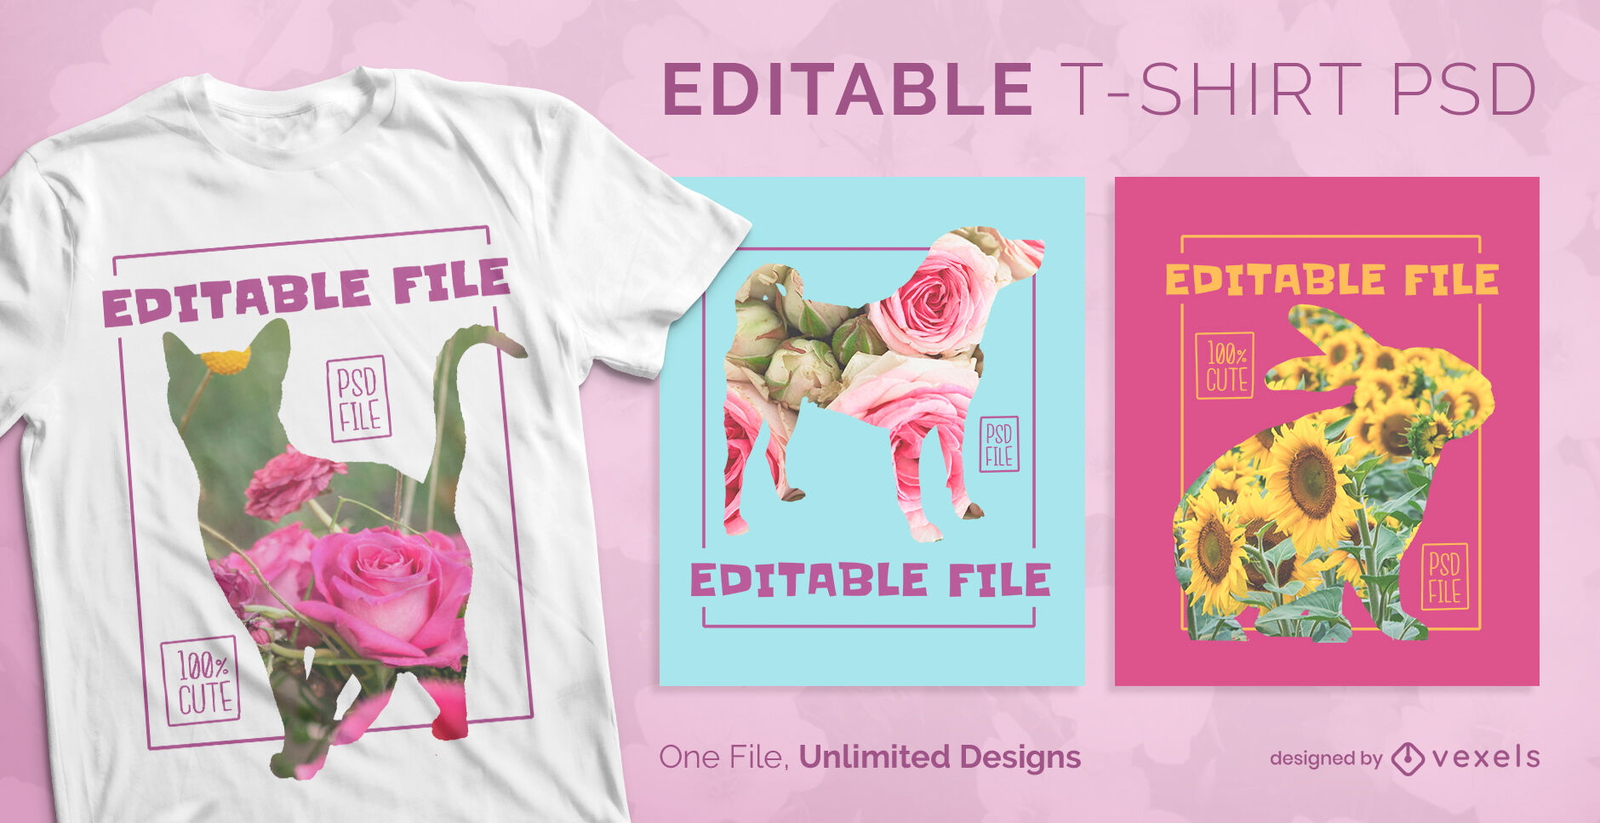
T-shirt escalável de animais florais psd
Escolha uma pasta
Todos os favoritos
Criar novo
Salvar
T-shirt escalável de animais florais psd
texto editável
Pronto para imprimir
para Merch
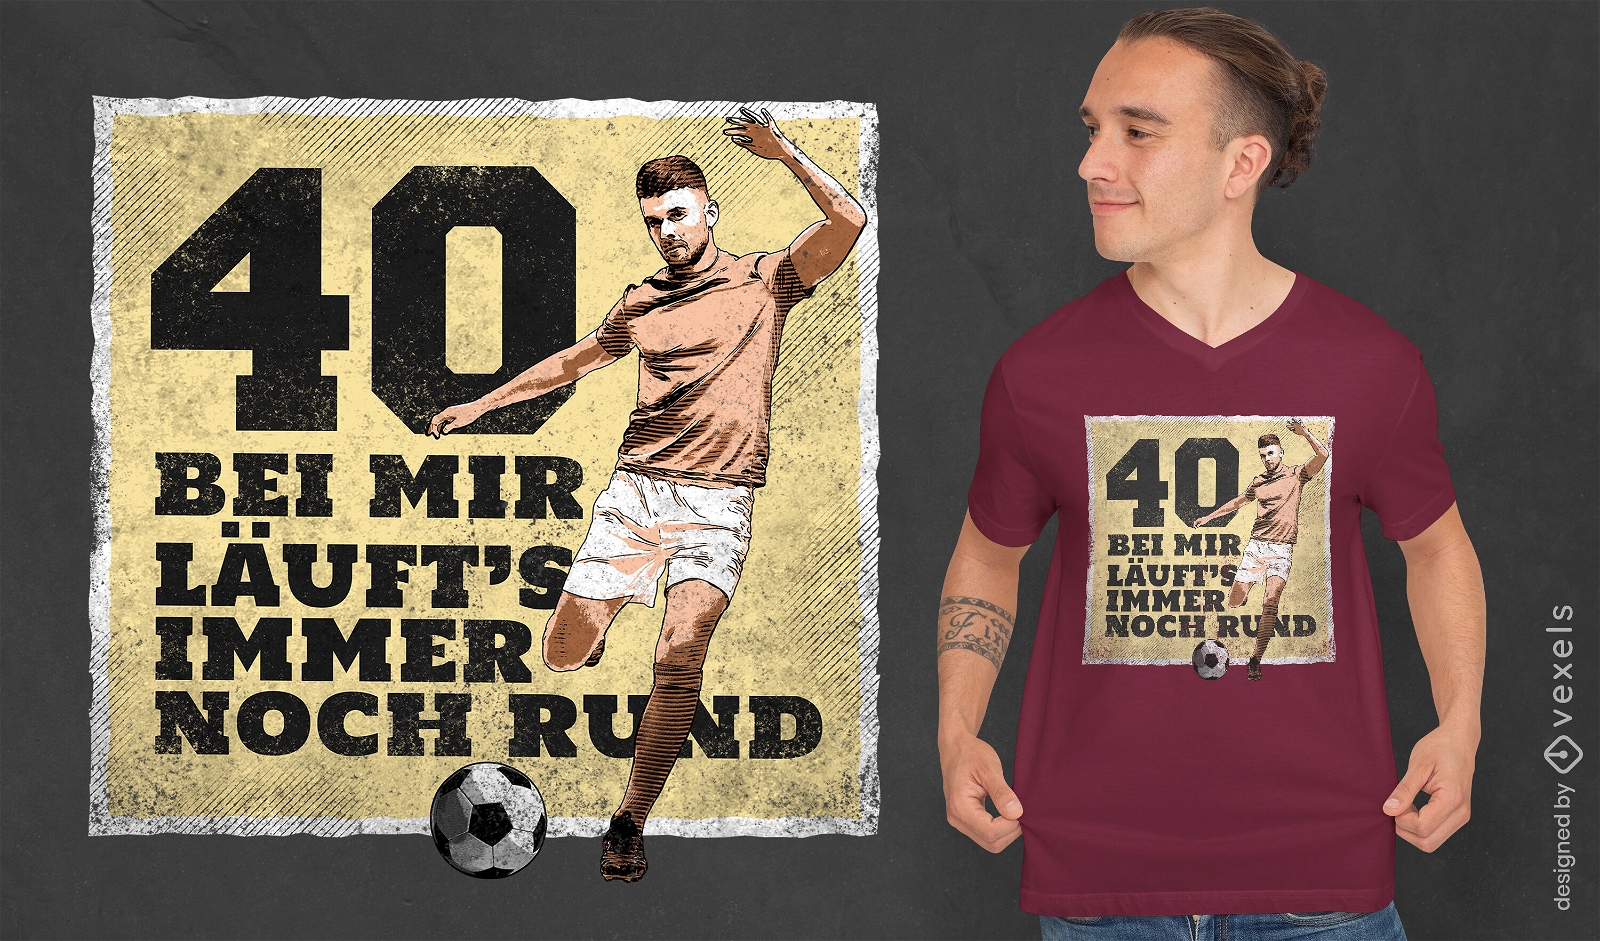
design de camiseta de jogador de futebol de 40 anos
Escolha uma pasta
Todos os favoritos
Criar novo
Salvar
design de camiseta de jogador de futebol de 40 anos
Pronto para imprimir
para Merch
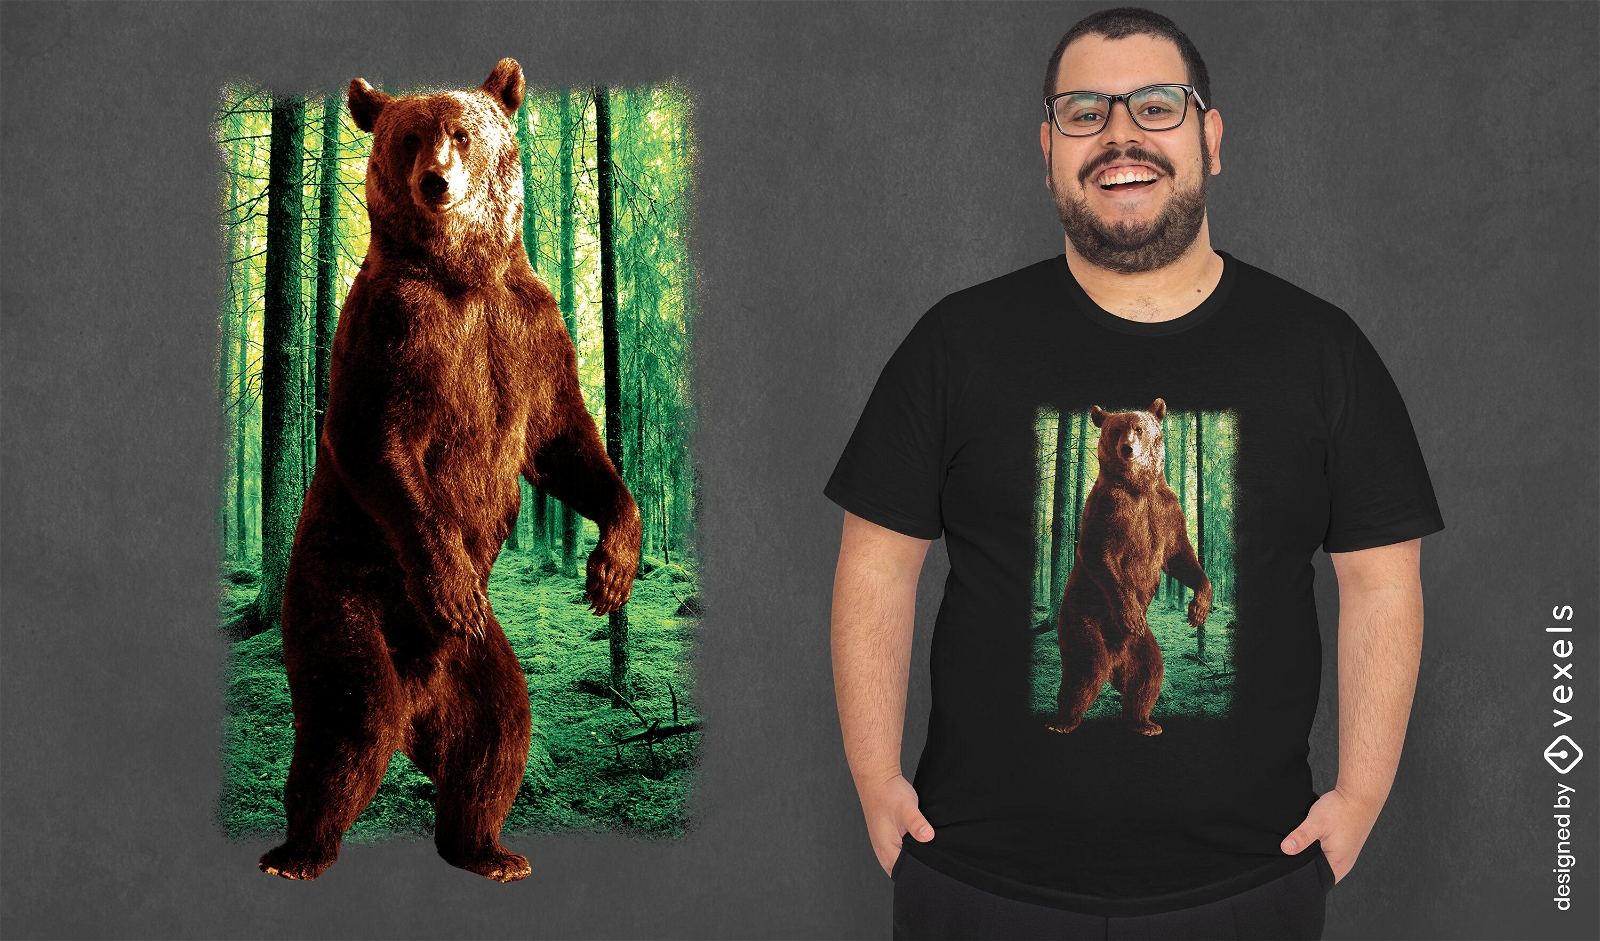
Design de camiseta de floresta de urso realista
Escolha uma pasta
Todos os favoritos
Criar novo
Salvar
Design de camiseta de floresta de urso realista
Pronto para imprimir
para Merch
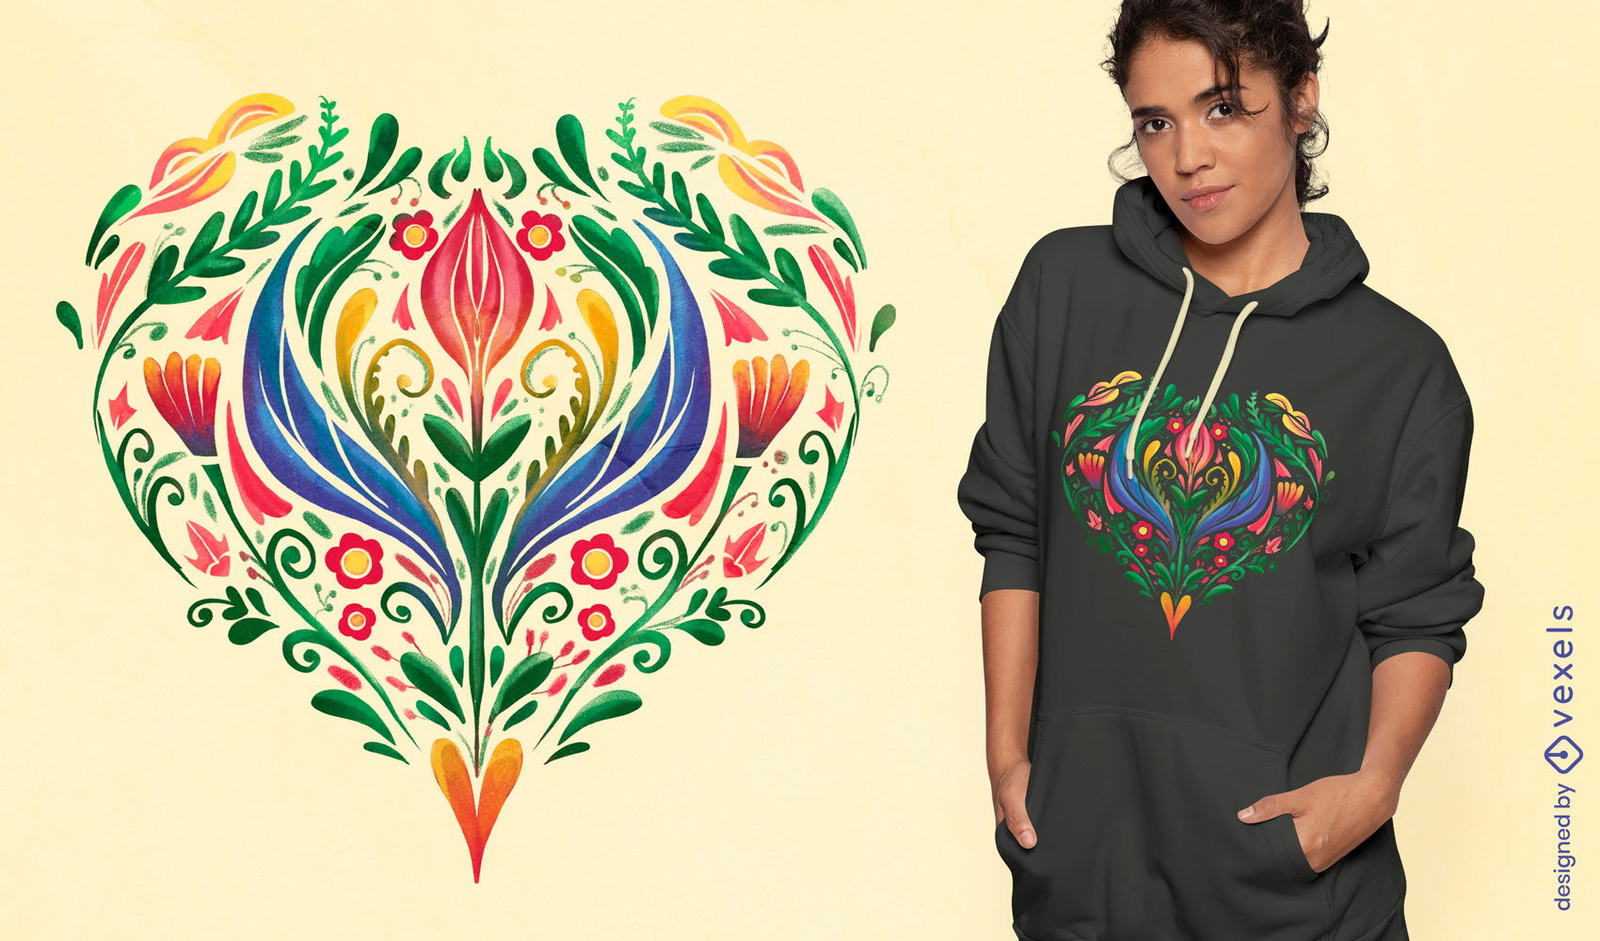
Design de camiseta de coração floral em aquarela
Escolha uma pasta
Todos os favoritos
Criar novo
Salvar
Design de camiseta de coração floral em aquarela
Impulsione seu negócio
Com a plataforma gráfica líder de mercado.
Ver planos
Próxima
do 67
prev page
next page