Biblioteca de design
Novos designs Merch
Camisetas
Vectores
Designs de Merch de Tendência
PNGs & SVGs
Mockups
Modelos de T-Shirt PSD
Explorar Desenhos
Designs KDP
Pôsteres
Canecas
Capas para celular
Sacos de compras
Almofadas
Ferramentas de desenho
Merch Designer
Novo!
Mockup Generator
Gerador de Design de AI
Vetorizador
Quote Generator
T-Shirt Maker (Antigo)
Ajuda
Merch Digest
Blog
Centro de Ajuda
Saiba mais sobre o Merch
Feedback
Soluções Corporativas
Empresa
Acesso à API
Estúdio de Design
Design em Lote
Preços
Carregando...
Inscrever-se
Conecte-se
PSD Templates
graficos
Biblioteca de design
Novos designs Merch
Camisetas
Vectores
Designs de Merch de Tendência
PNGs & SVGs
Mockups
Modelos de T-Shirt PSD
Explorar Desenhos
Designs KDP
Pôsteres
Canecas
Capas para celular
Sacos de compras
Almofadas
Ferramentas de desenho
Merch Designer
Novo!
Mockup Generator
Gerador de Design de AI
Vetorizador
Quote Generator
T-Shirt Maker (Antigo)
Ajuda
Merch Digest
Blog
Centro de Ajuda
Saiba mais sobre o Merch
Feedback
Soluções Corporativas
Empresa
Acesso à API
Estúdio de Design
Design em Lote
PLANOS
PSD Templates
graficos
3312 Designs de Camisetas e Mockups PSD de graficos
Baixar designs de camisetas ou mockups PSD editáveis de graficos
Relacionado:
graficos vetoriais
,
desenhos graficos de ações
,
graficos tridimensionais
Ordenar por
Mais relevante
Resultados patrocinados da
Ganhe 15% de desconto com o código: VEXELS15
veja mais detalhes
Pronto para imprimir
para Merch
Design de camiseta de parede de fogo de fundição de assistente
Escolha uma pasta
Todos os favoritos
Criar novo
Salvar
Design de camiseta de parede de fogo de fundição de assistente
Pronto para imprimir
para Merch
Design de camiseta realista de apanhador de moscas
Escolha uma pasta
Todos os favoritos
Criar novo
Salvar
Design de camiseta realista de apanhador de moscas
Pronto para imprimir
para Merch
Design de camiseta de coelho branco de duas cabeças
Escolha uma pasta
Todos os favoritos
Criar novo
Salvar
Design de camiseta de coelho branco de duas cabeças
Pronto para imprimir
para Merch
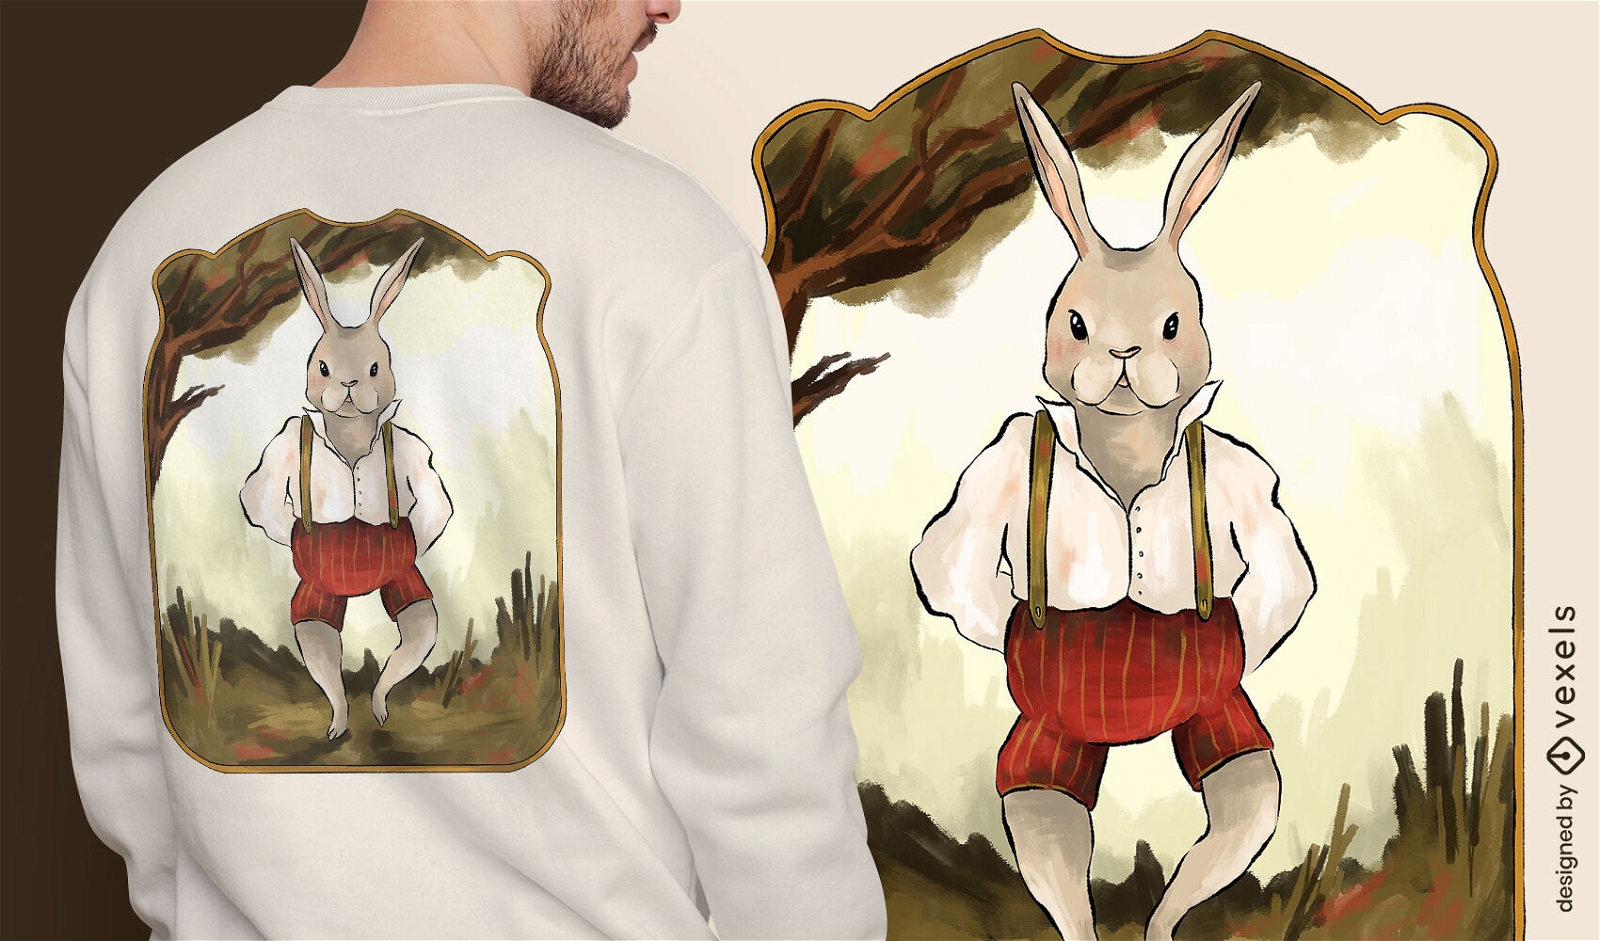
Coelho em design de camiseta de roupas vintage
Escolha uma pasta
Todos os favoritos
Criar novo
Salvar
Coelho em design de camiseta de roupas vintage
Pronto para imprimir
para Merch
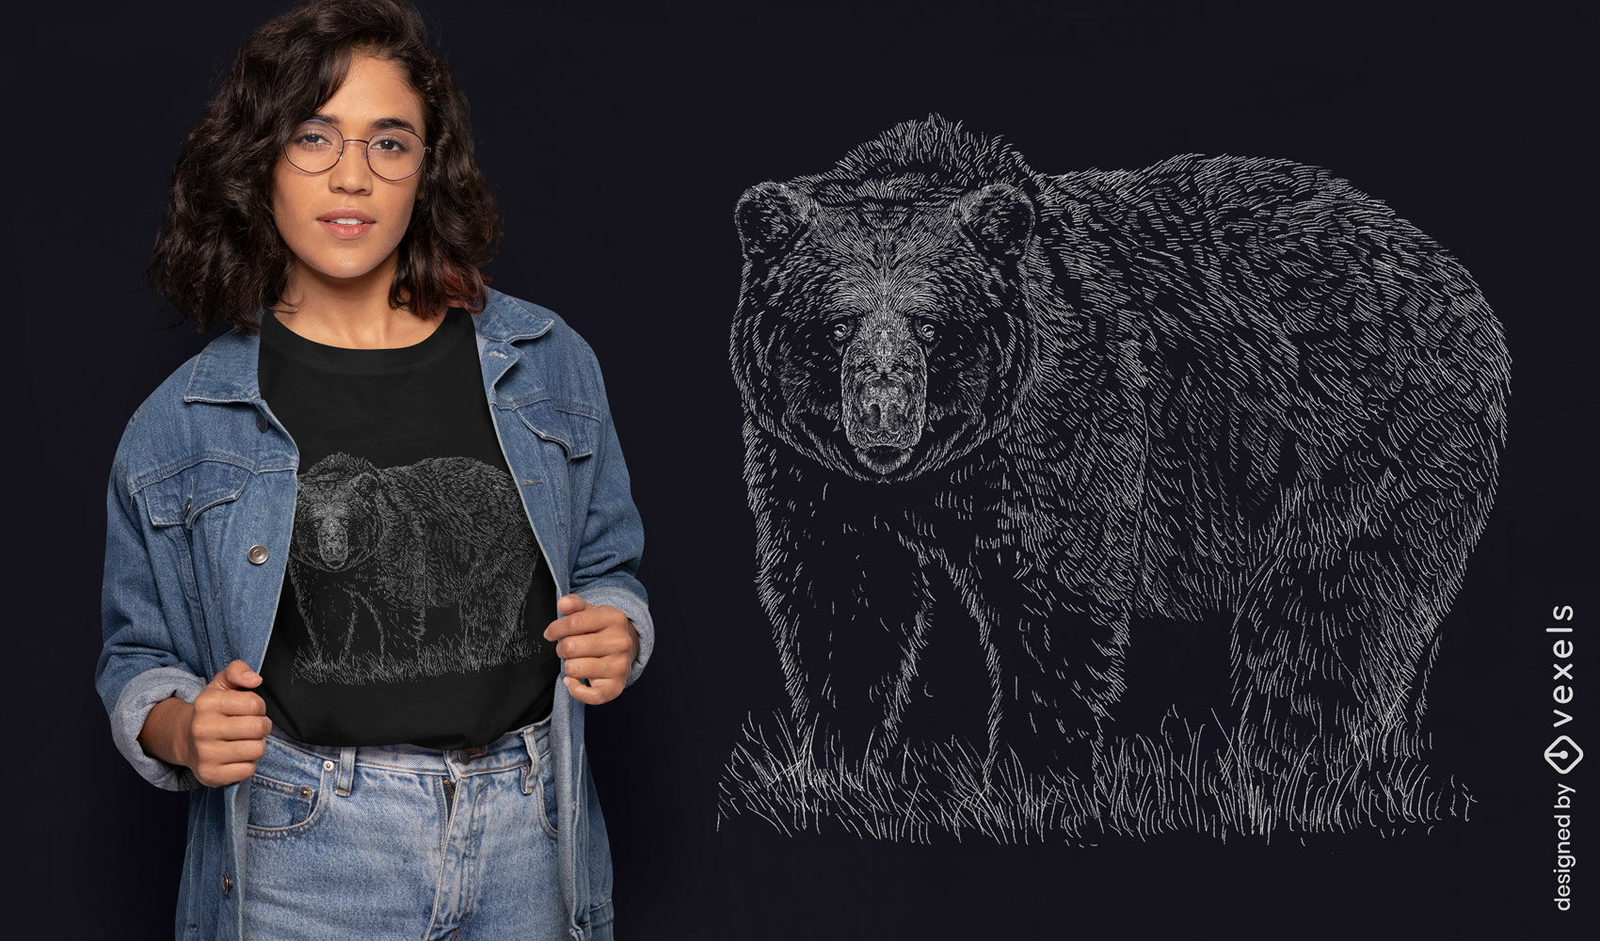
Design de camiseta de urso pardo desenhado à mão
Escolha uma pasta
Todos os favoritos
Criar novo
Salvar
Design de camiseta de urso pardo desenhado à mão
Pronto para imprimir
para Merch
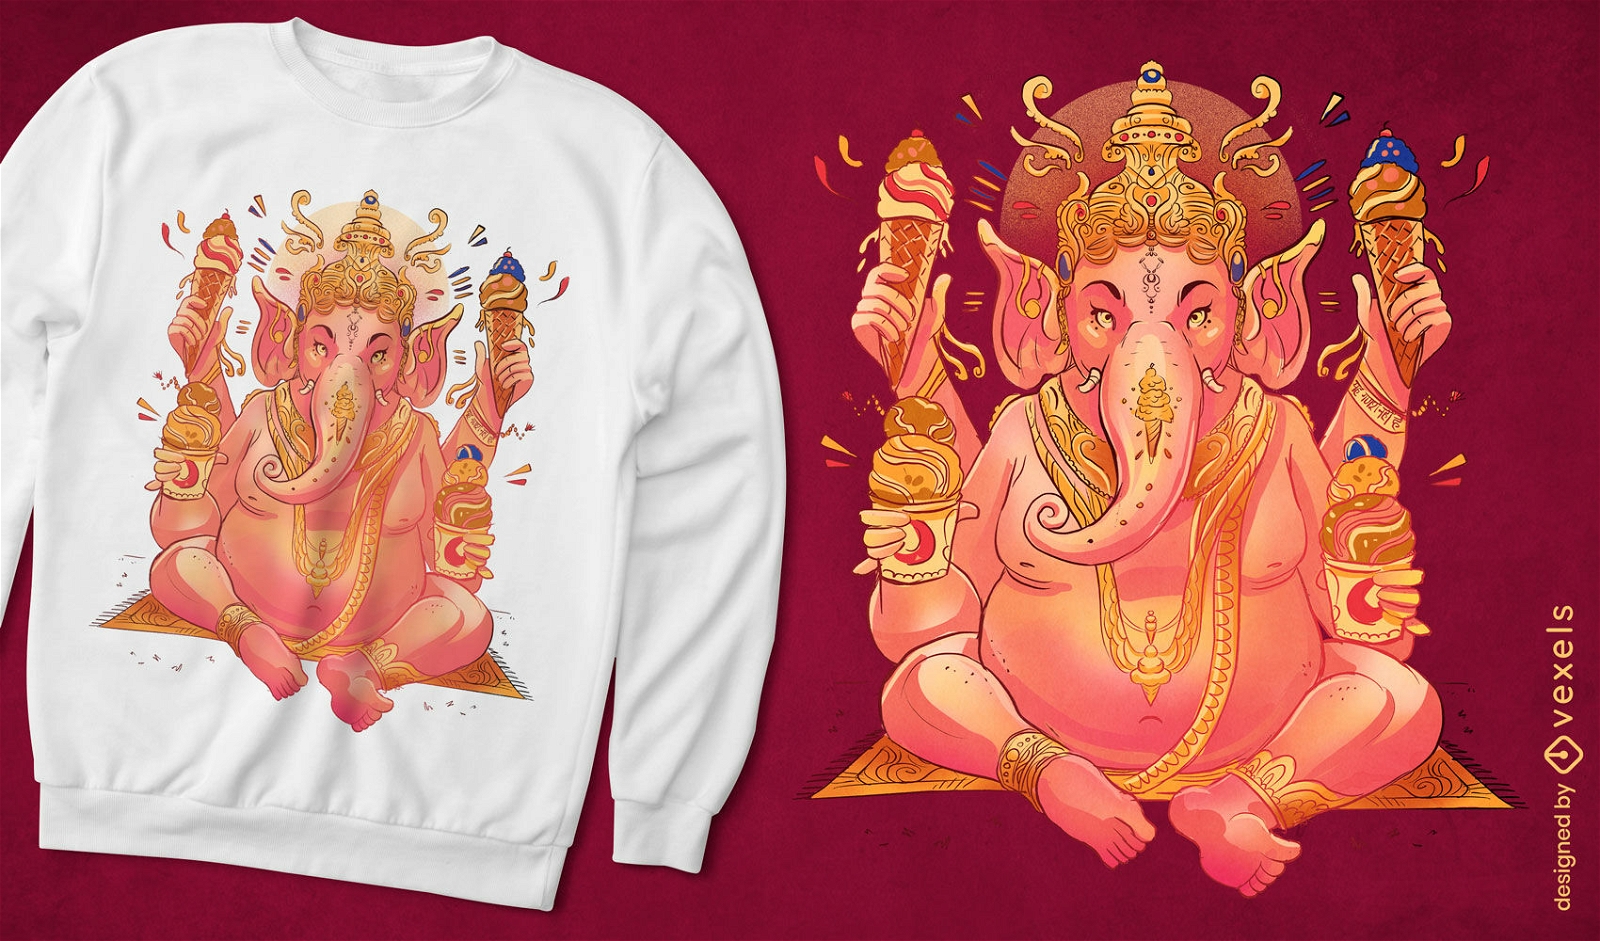
Design de camiseta de deus de sorvete Ganesha
Escolha uma pasta
Todos os favoritos
Criar novo
Salvar
Design de camiseta de deus de sorvete Ganesha
Pronto para imprimir
para Merch
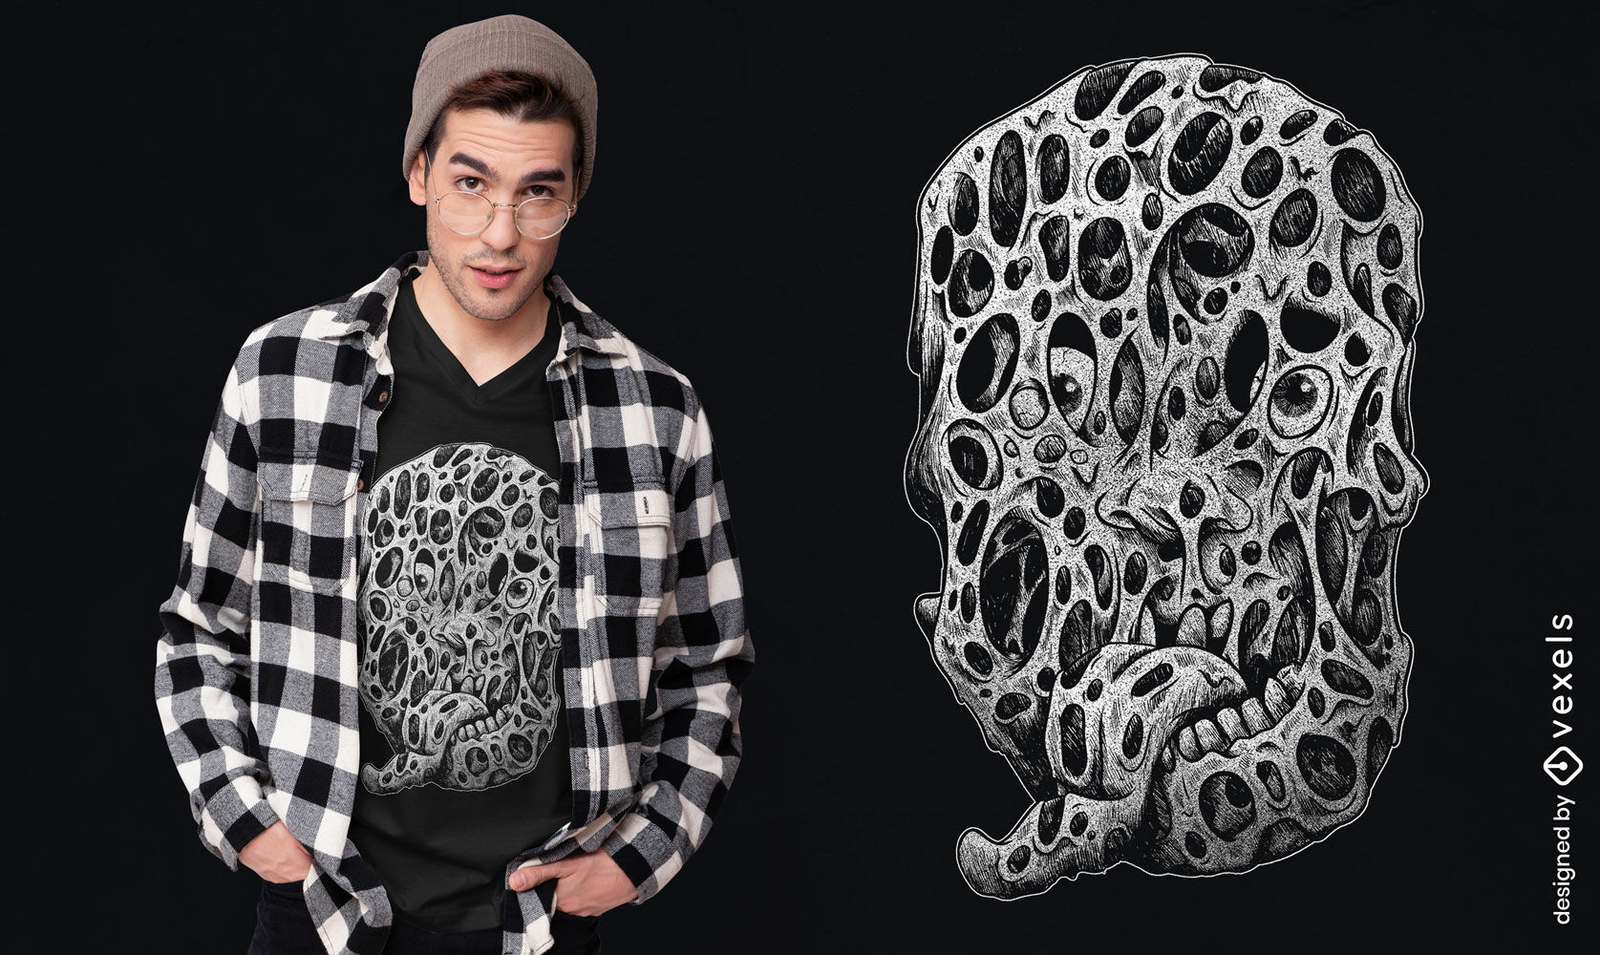
Design de t-shirt de rosto derretido assustador horrível
Escolha uma pasta
Todos os favoritos
Criar novo
Salvar
Design de t-shirt de rosto derretido assustador horrível
texto editável
Pronto para imprimir
para Merch
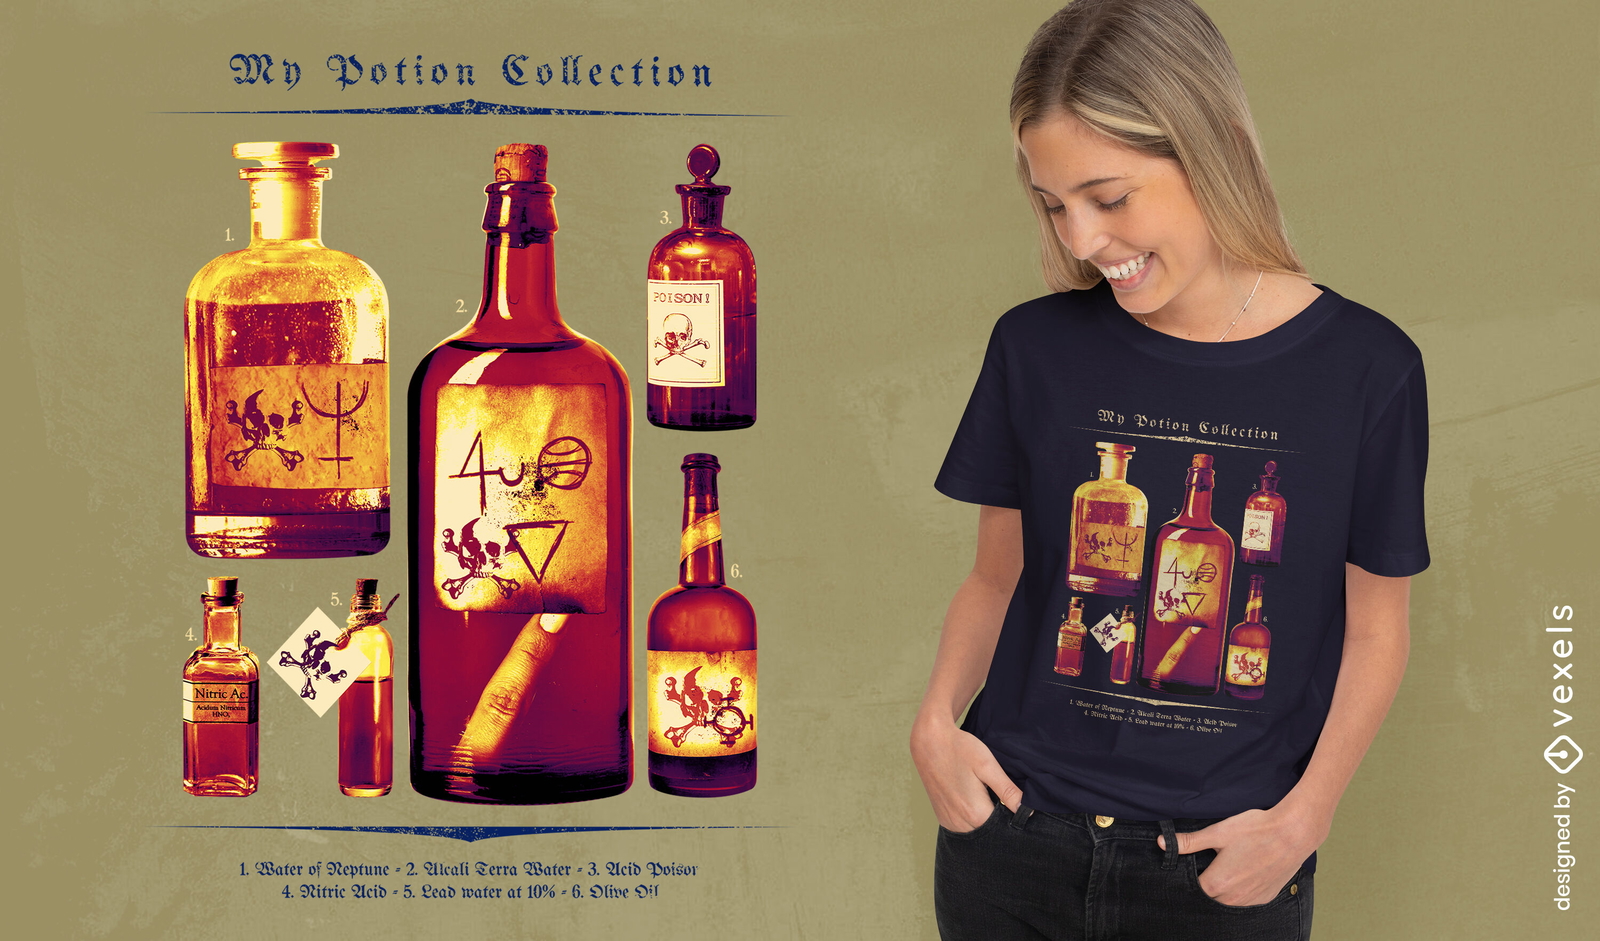
Coleção de garrafas de poção PSD design de camiseta
Escolha uma pasta
Todos os favoritos
Criar novo
Salvar
Coleção de garrafas de poção PSD design de camiseta
texto editável
Pronto para imprimir
para Merch
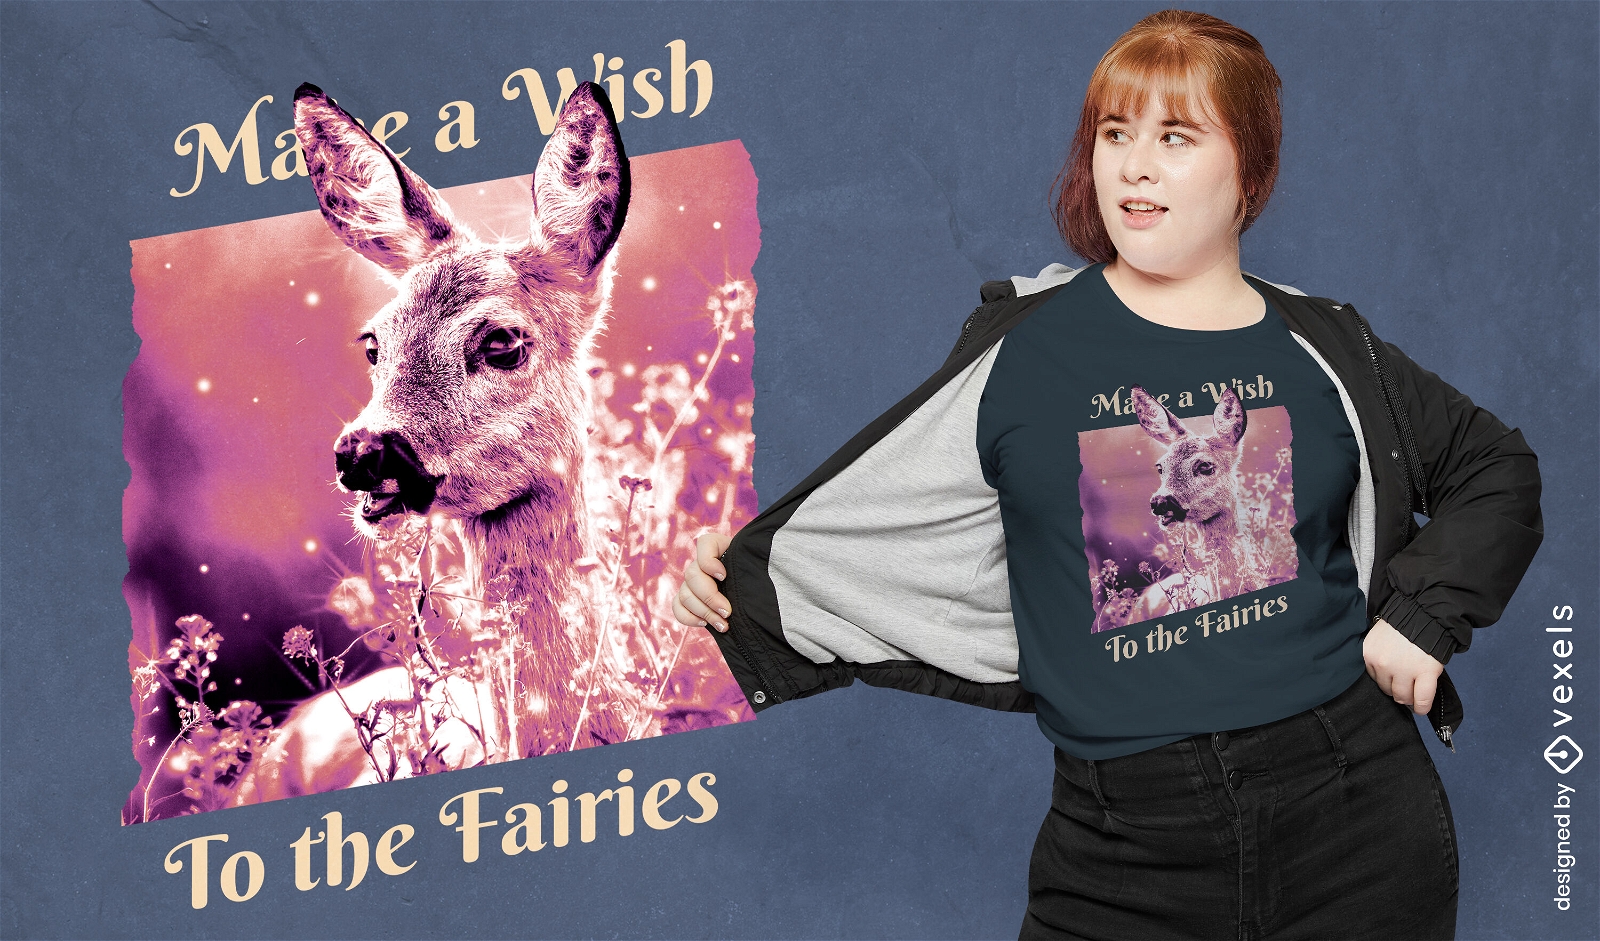
T-shirt psd brilhante animal cervo
Escolha uma pasta
Todos os favoritos
Criar novo
Salvar
T-shirt psd brilhante animal cervo
Pronto para imprimir
para Merch
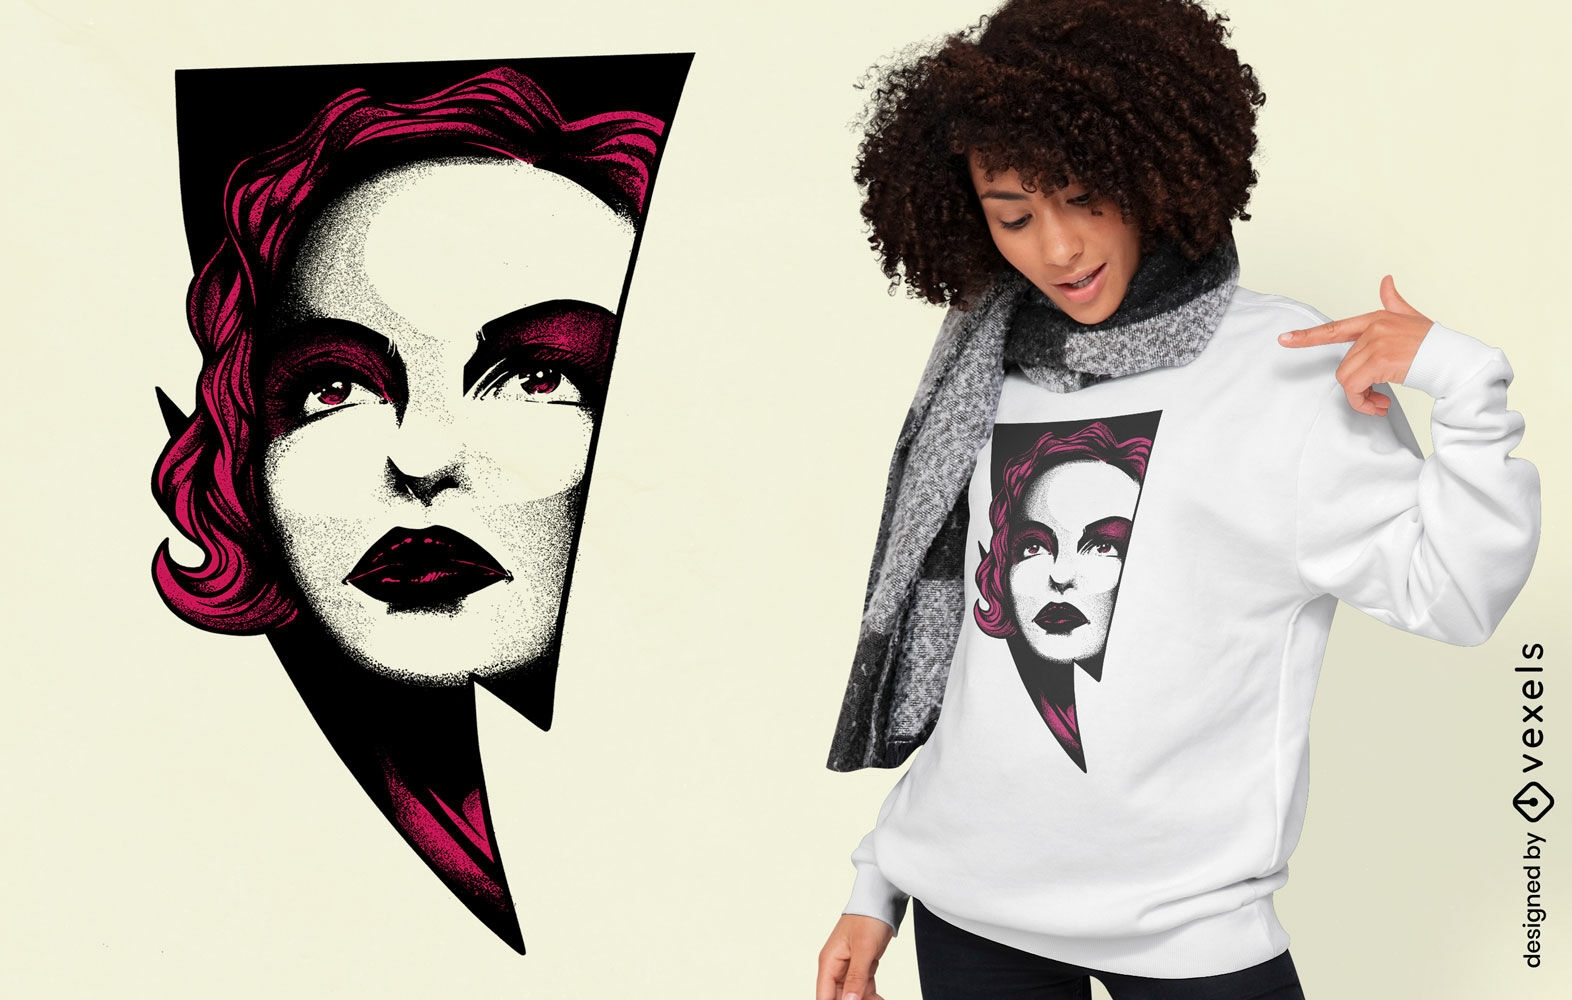
Thunder girl lindo design de camiseta psd
Escolha uma pasta
Todos os favoritos
Criar novo
Salvar
Thunder girl lindo design de camiseta psd
texto editável
Pronto para imprimir
para Merch
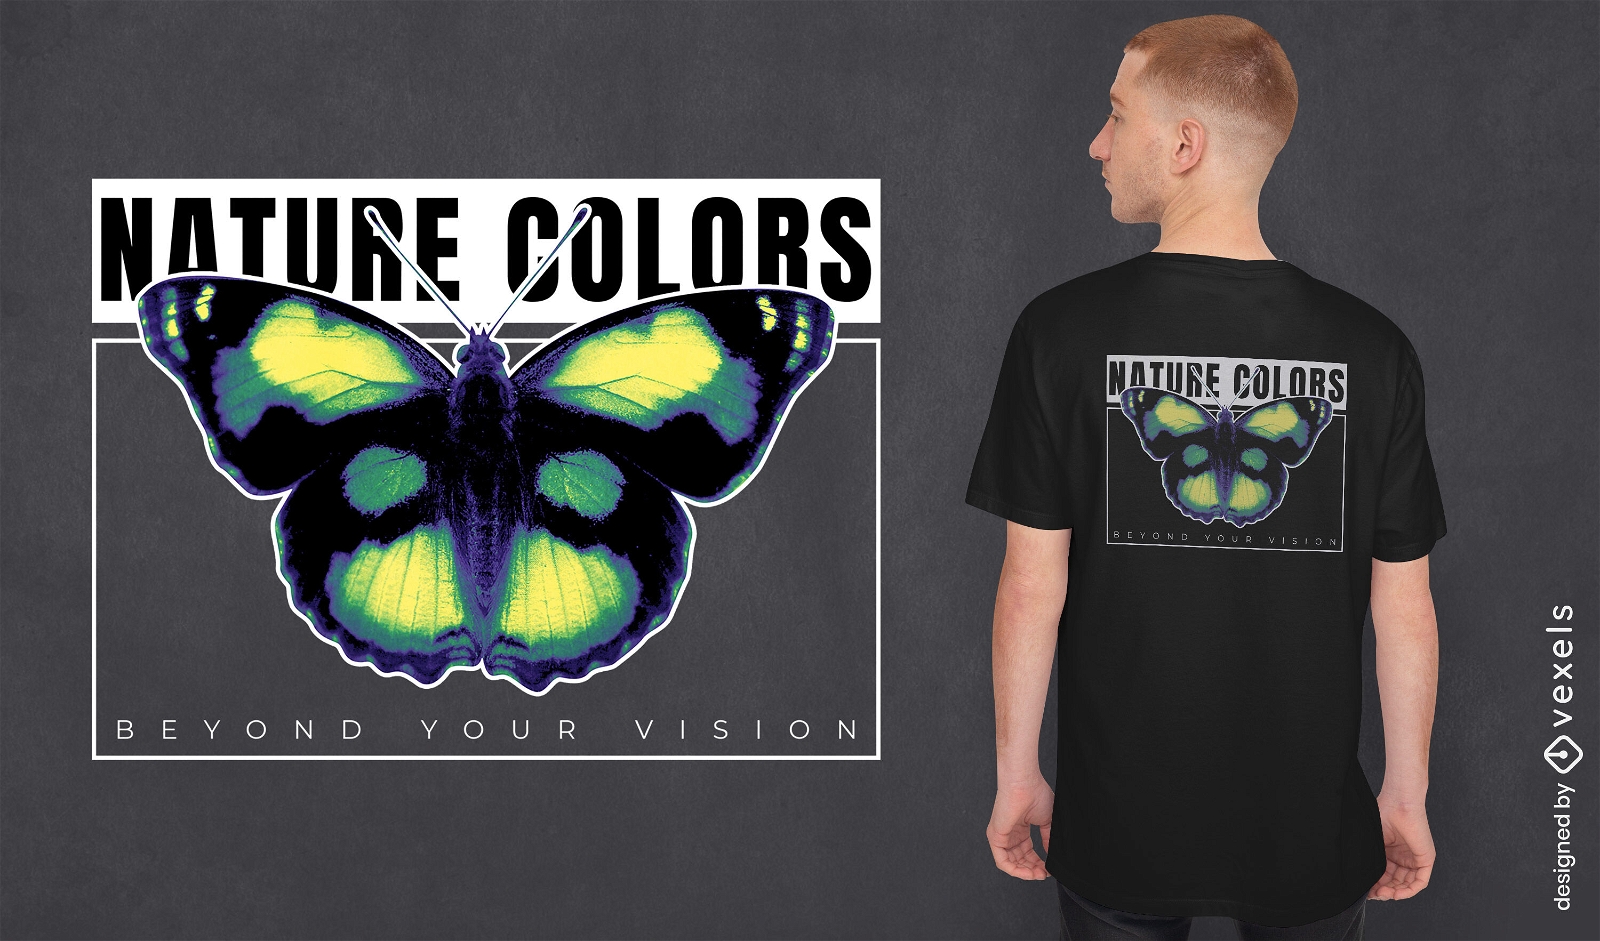
Design de camiseta de borboleta verde gradiente
Escolha uma pasta
Todos os favoritos
Criar novo
Salvar
Design de camiseta de borboleta verde gradiente
texto editável
Pronto para imprimir
para Merch
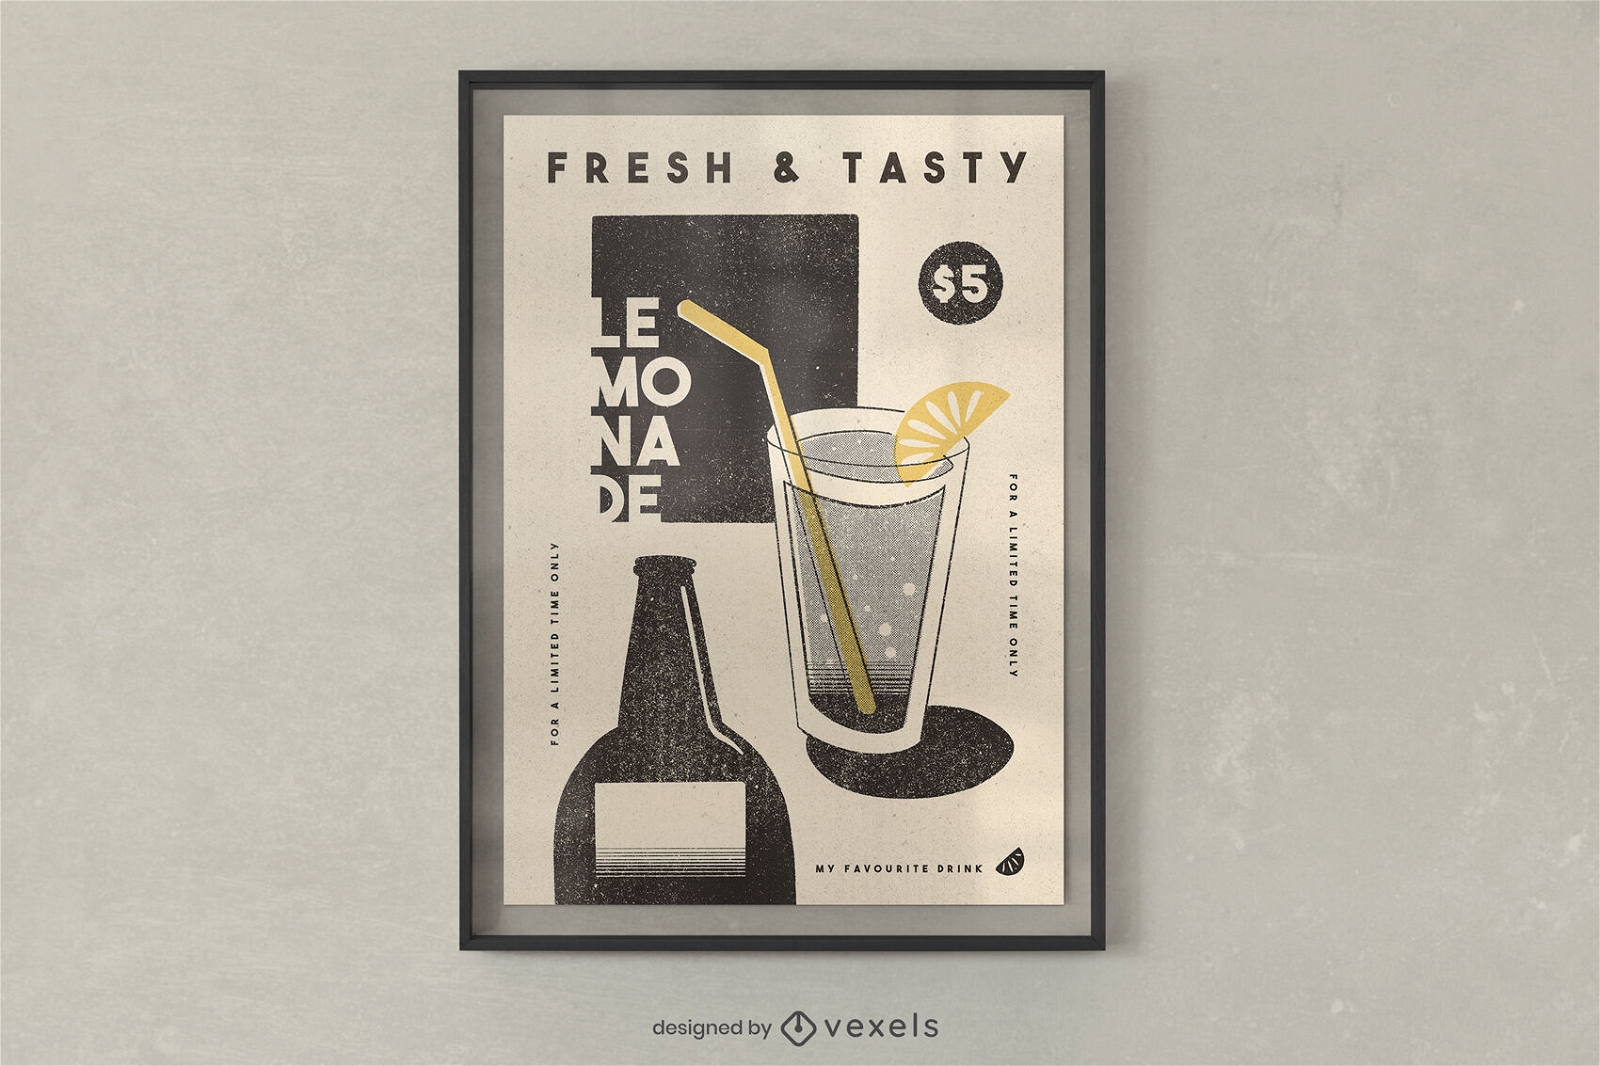
Design de t-shirt de bebida e garrafa de limonada
Escolha uma pasta
Todos os favoritos
Criar novo
Salvar
Design de t-shirt de bebida e garrafa de limonada
Pronto para imprimir
para Merch
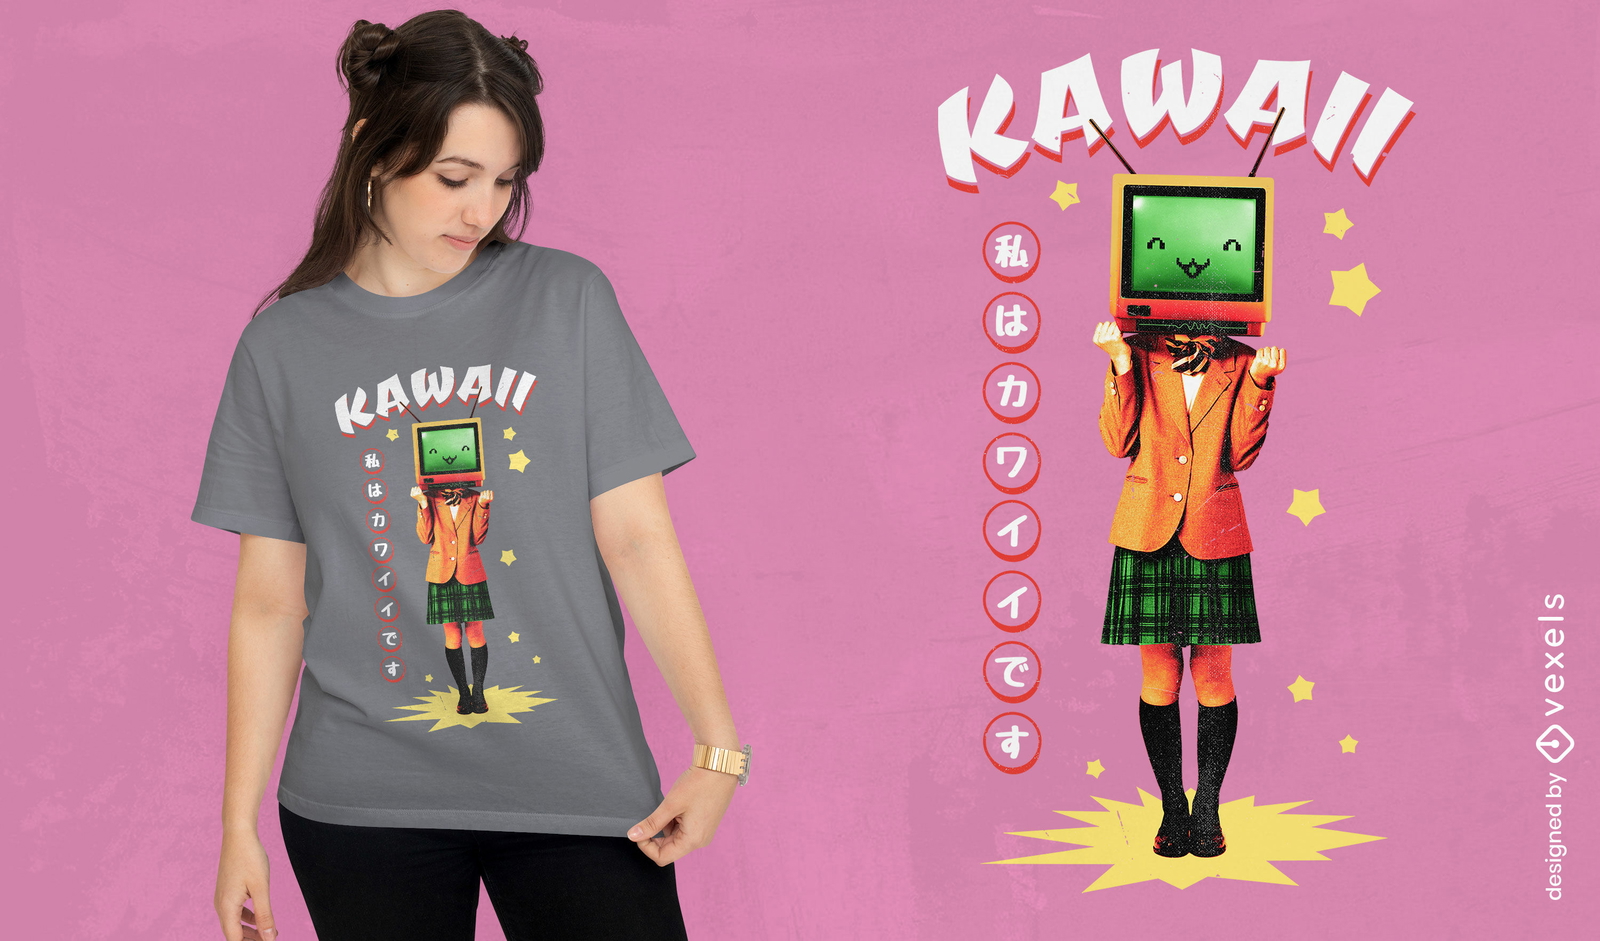
Design de camiseta de menina de televisão Kawaii
Escolha uma pasta
Todos os favoritos
Criar novo
Salvar
Design de camiseta de menina de televisão Kawaii
Pronto para imprimir
para Merch
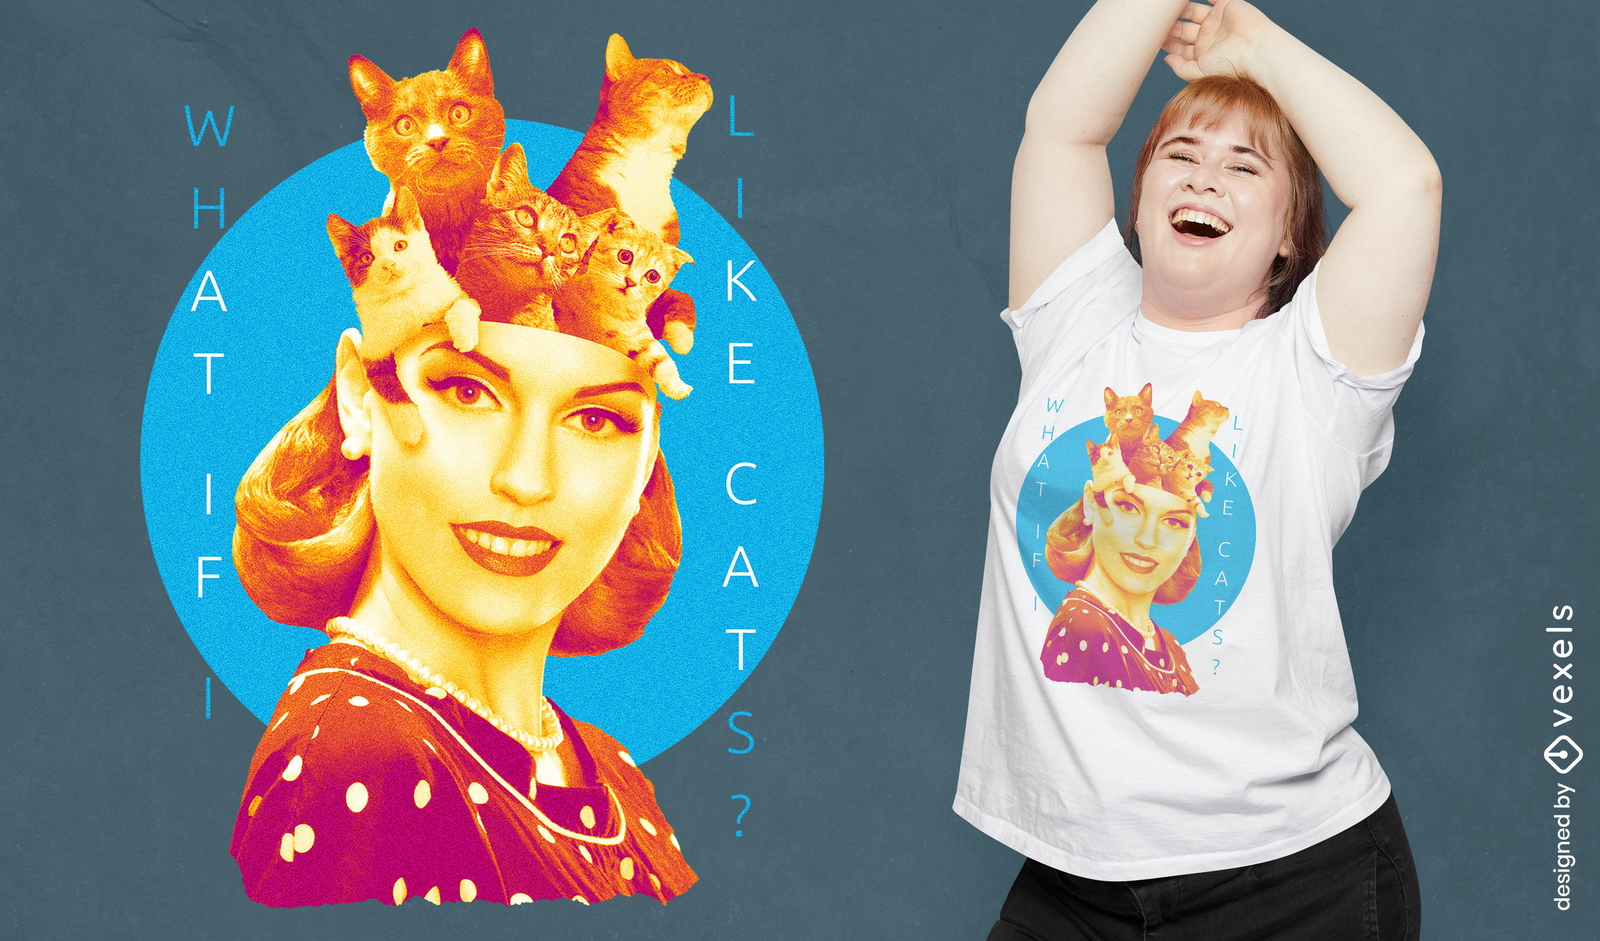
Mulher com gatinhos na cabeça design de t-shirt
Escolha uma pasta
Todos os favoritos
Criar novo
Salvar
Mulher com gatinhos na cabeça design de t-shirt
Pronto para imprimir
para Merch
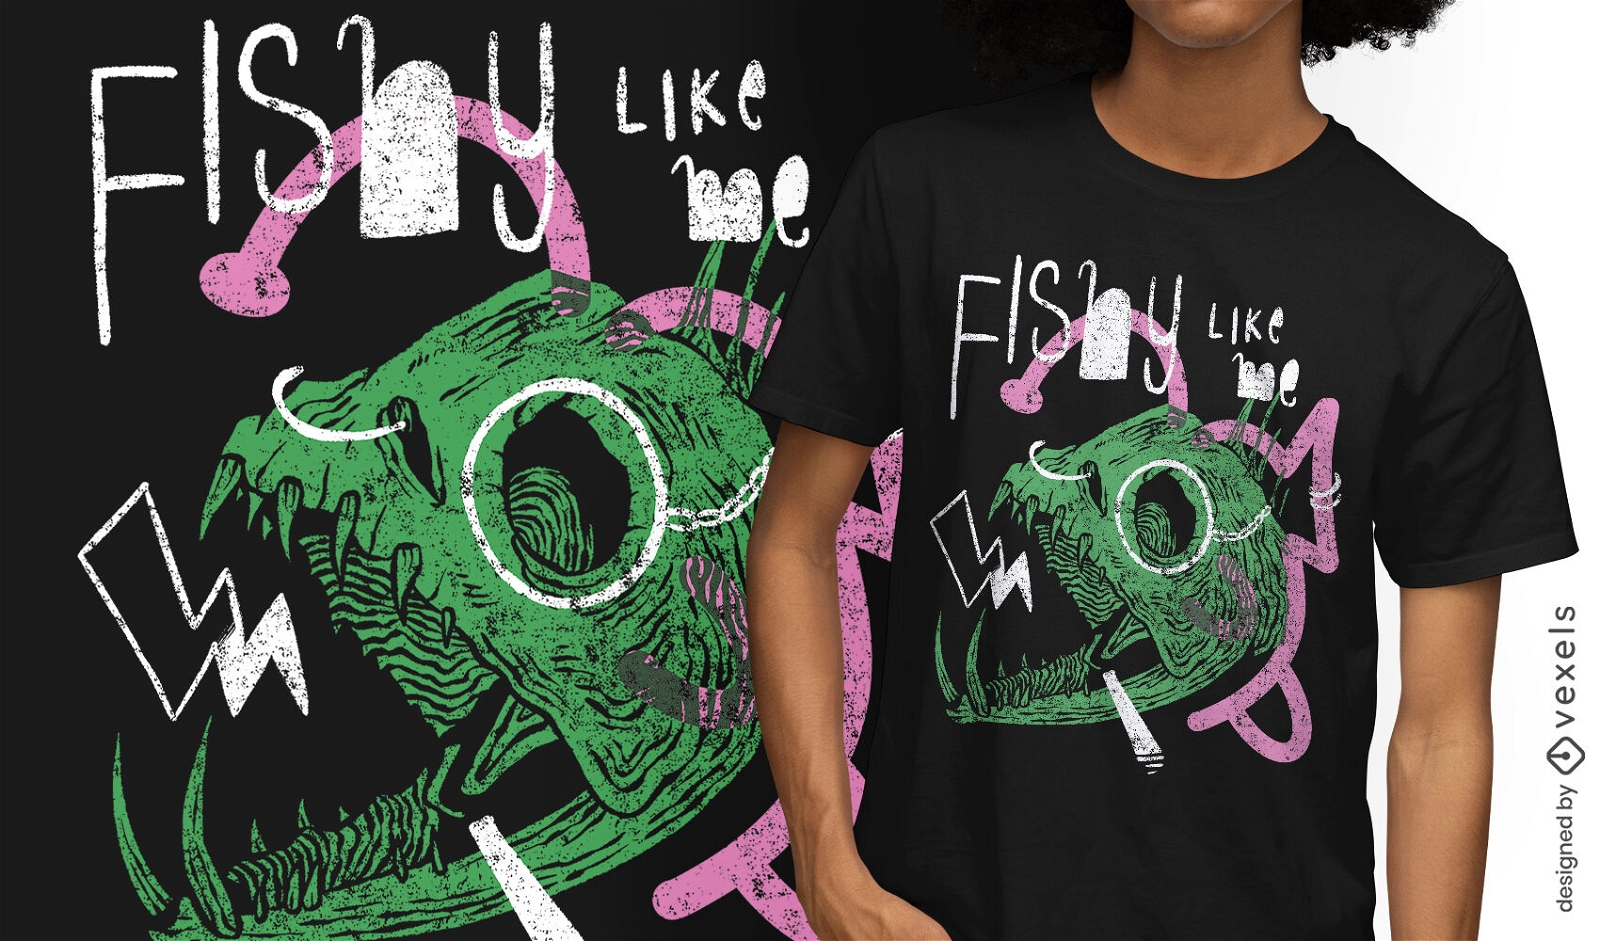
Design de camiseta de caveira de piranha
Escolha uma pasta
Todos os favoritos
Criar novo
Salvar
Design de camiseta de caveira de piranha
Pronto para imprimir
para Merch
Design de camiseta de formas abstratas Illuminati
Escolha uma pasta
Todos os favoritos
Criar novo
Salvar
Design de camiseta de formas abstratas Illuminati
Pronto para imprimir
para Merch
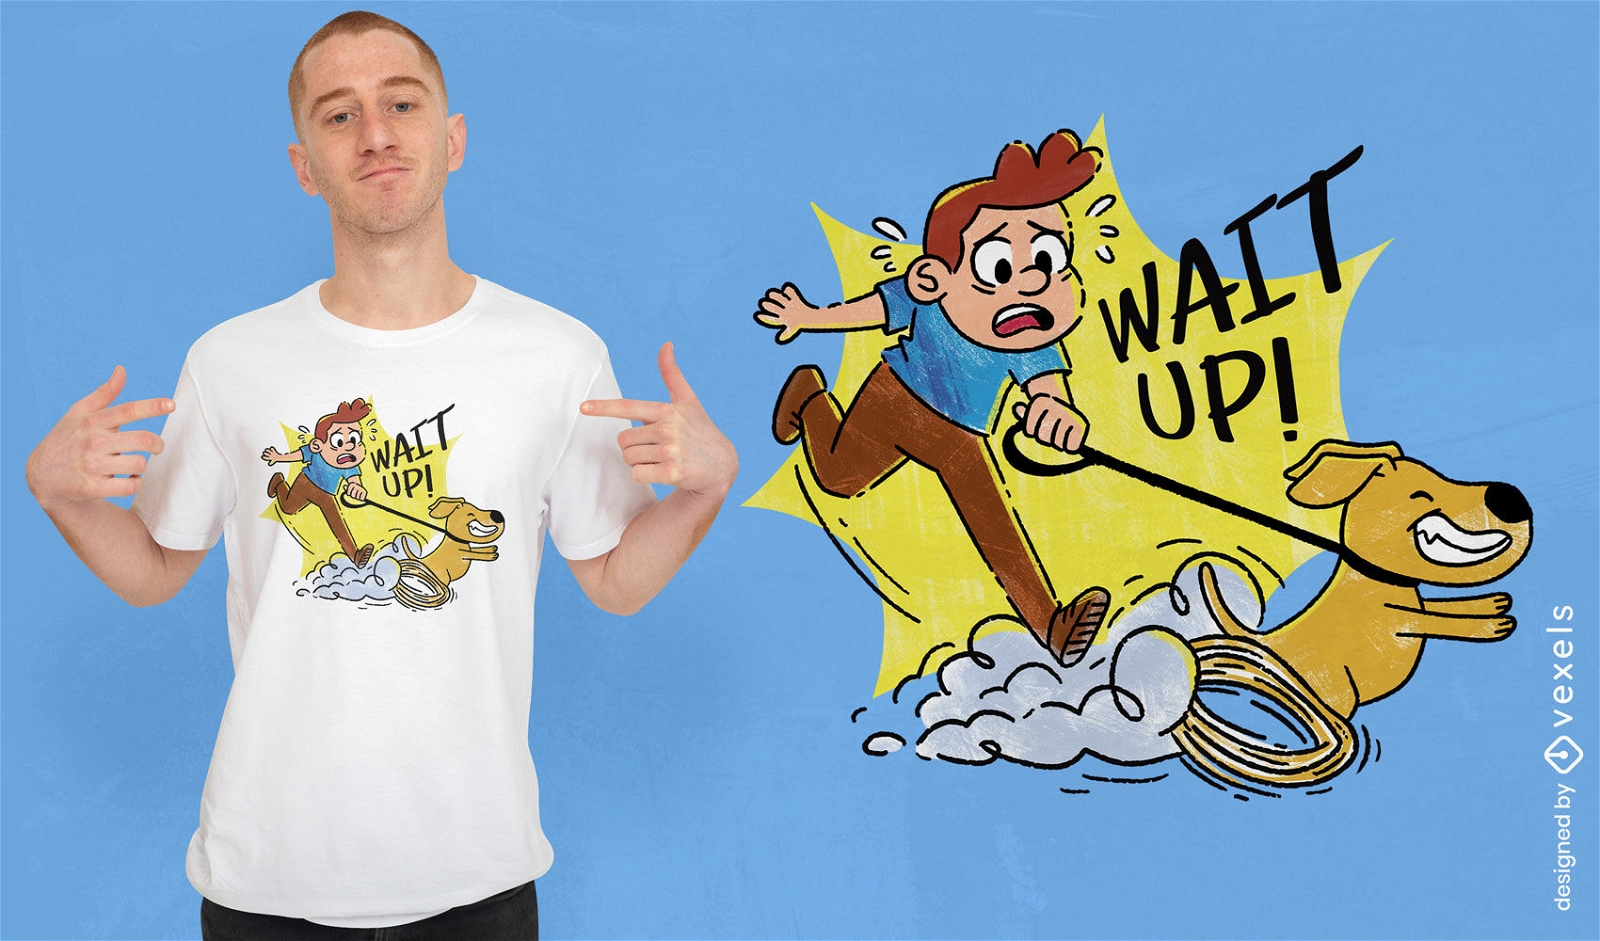
Design de camiseta de desenho animado de cachorro andando de homem
Escolha uma pasta
Todos os favoritos
Criar novo
Salvar
Design de camiseta de desenho animado de cachorro andando de homem
Pronto para imprimir
para Merch
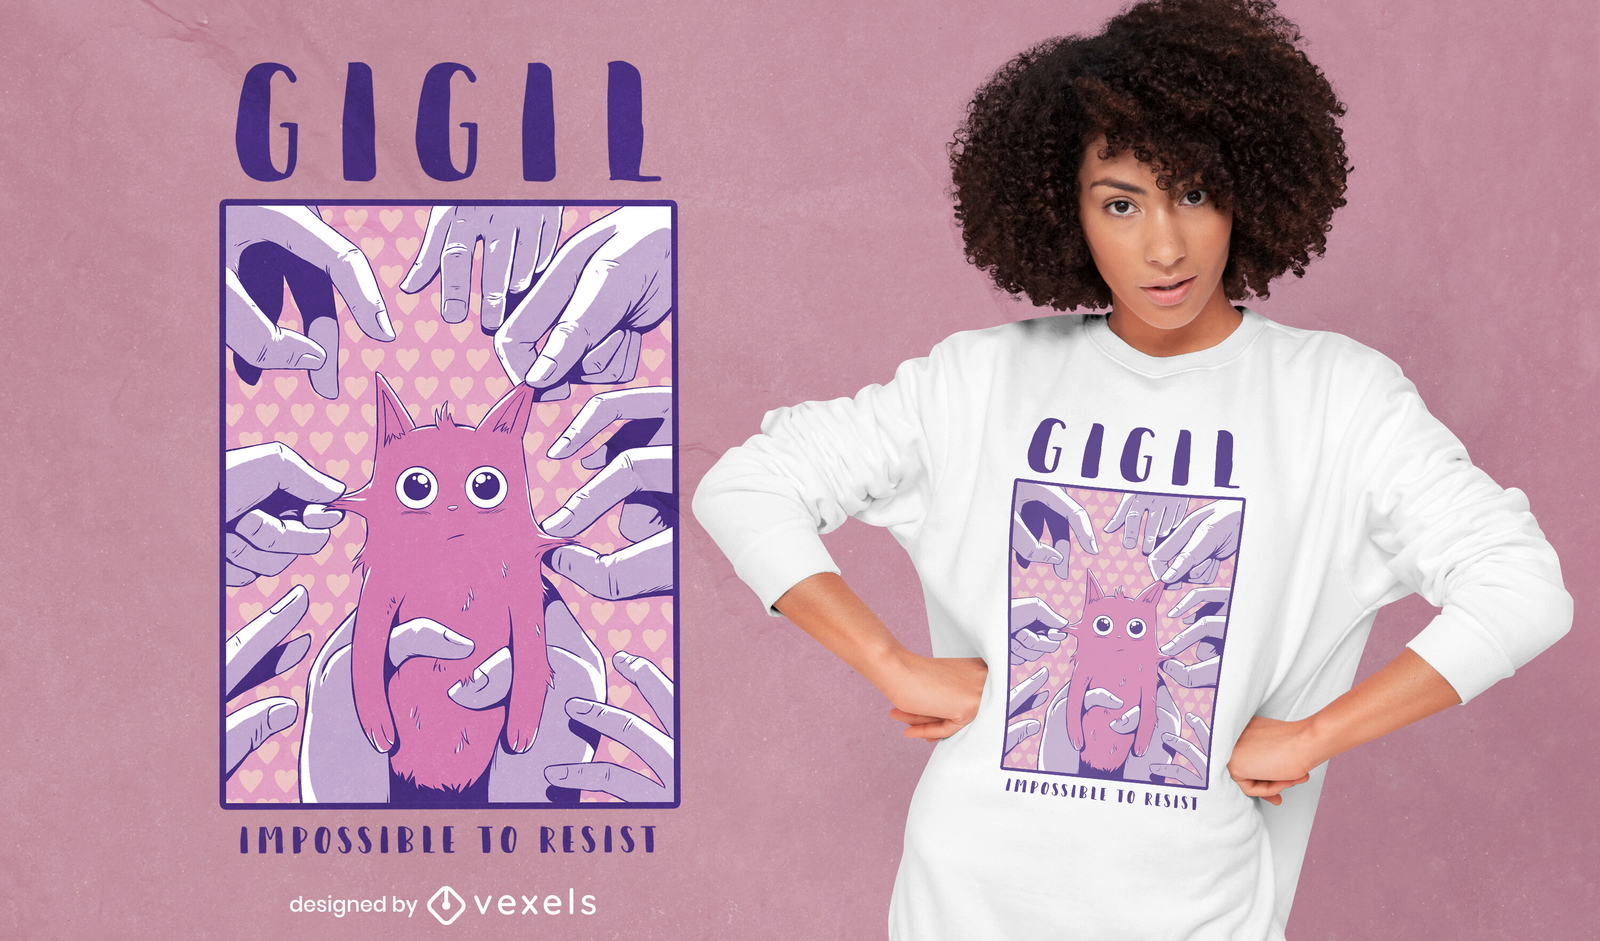
Lindo gato e mãos com design de t-shirt psd
Escolha uma pasta
Todos os favoritos
Criar novo
Salvar
Lindo gato e mãos com design de t-shirt psd
Pronto para imprimir
para Merch
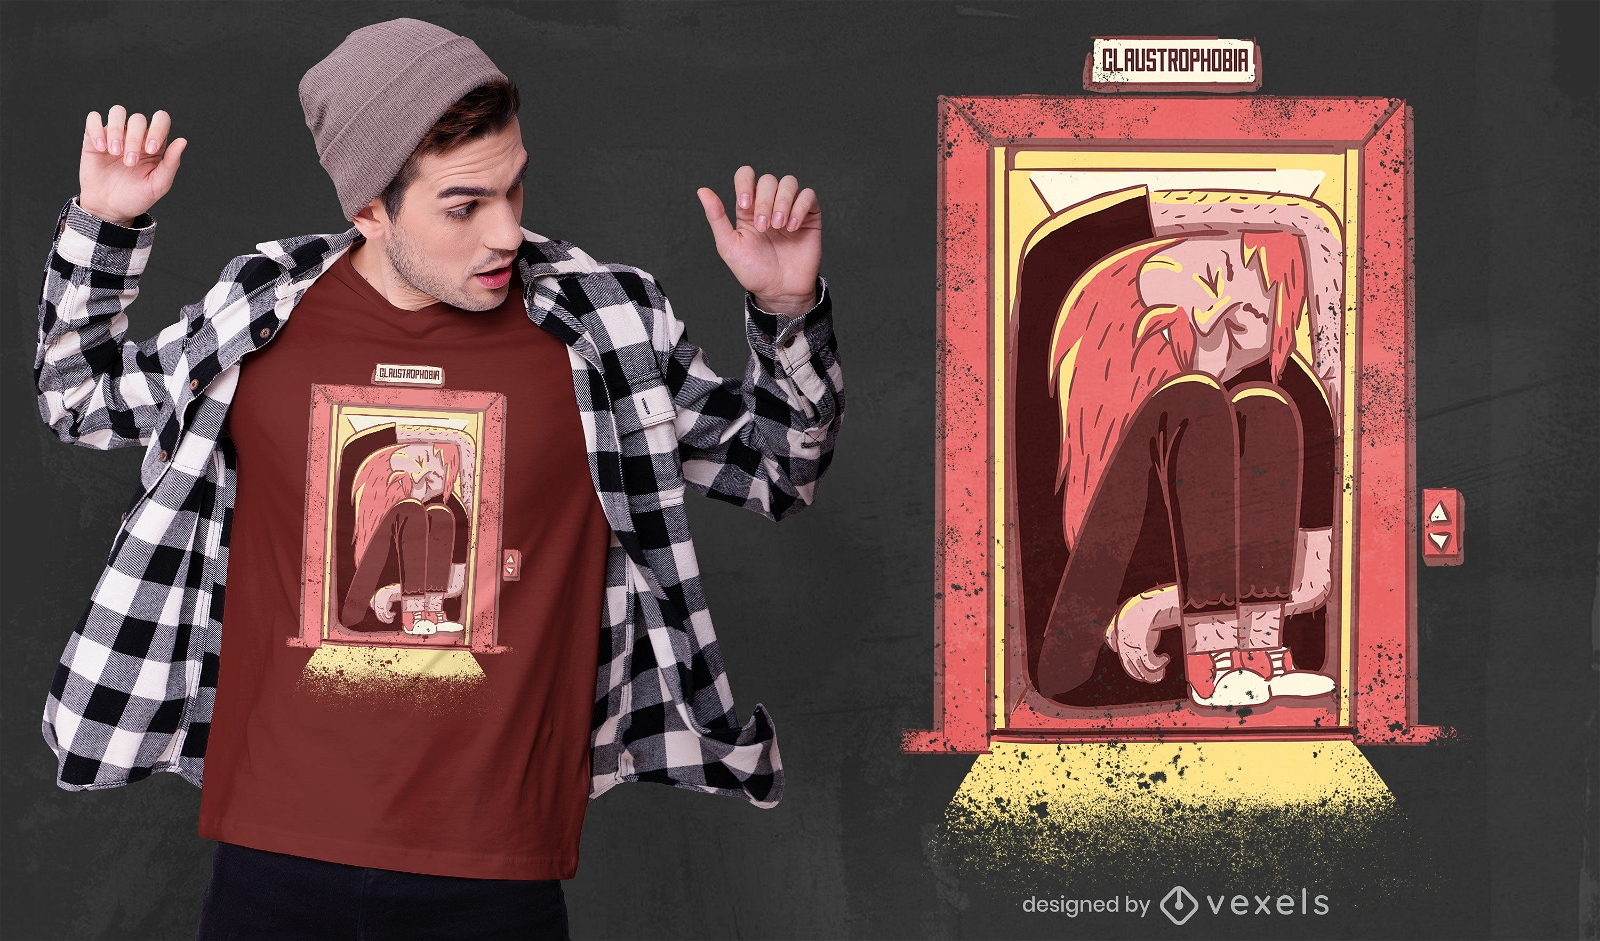
Claustrofobia psd design de camiseta
Escolha uma pasta
Todos os favoritos
Criar novo
Salvar
Claustrofobia psd design de camiseta
Pronto para imprimir
para Merch
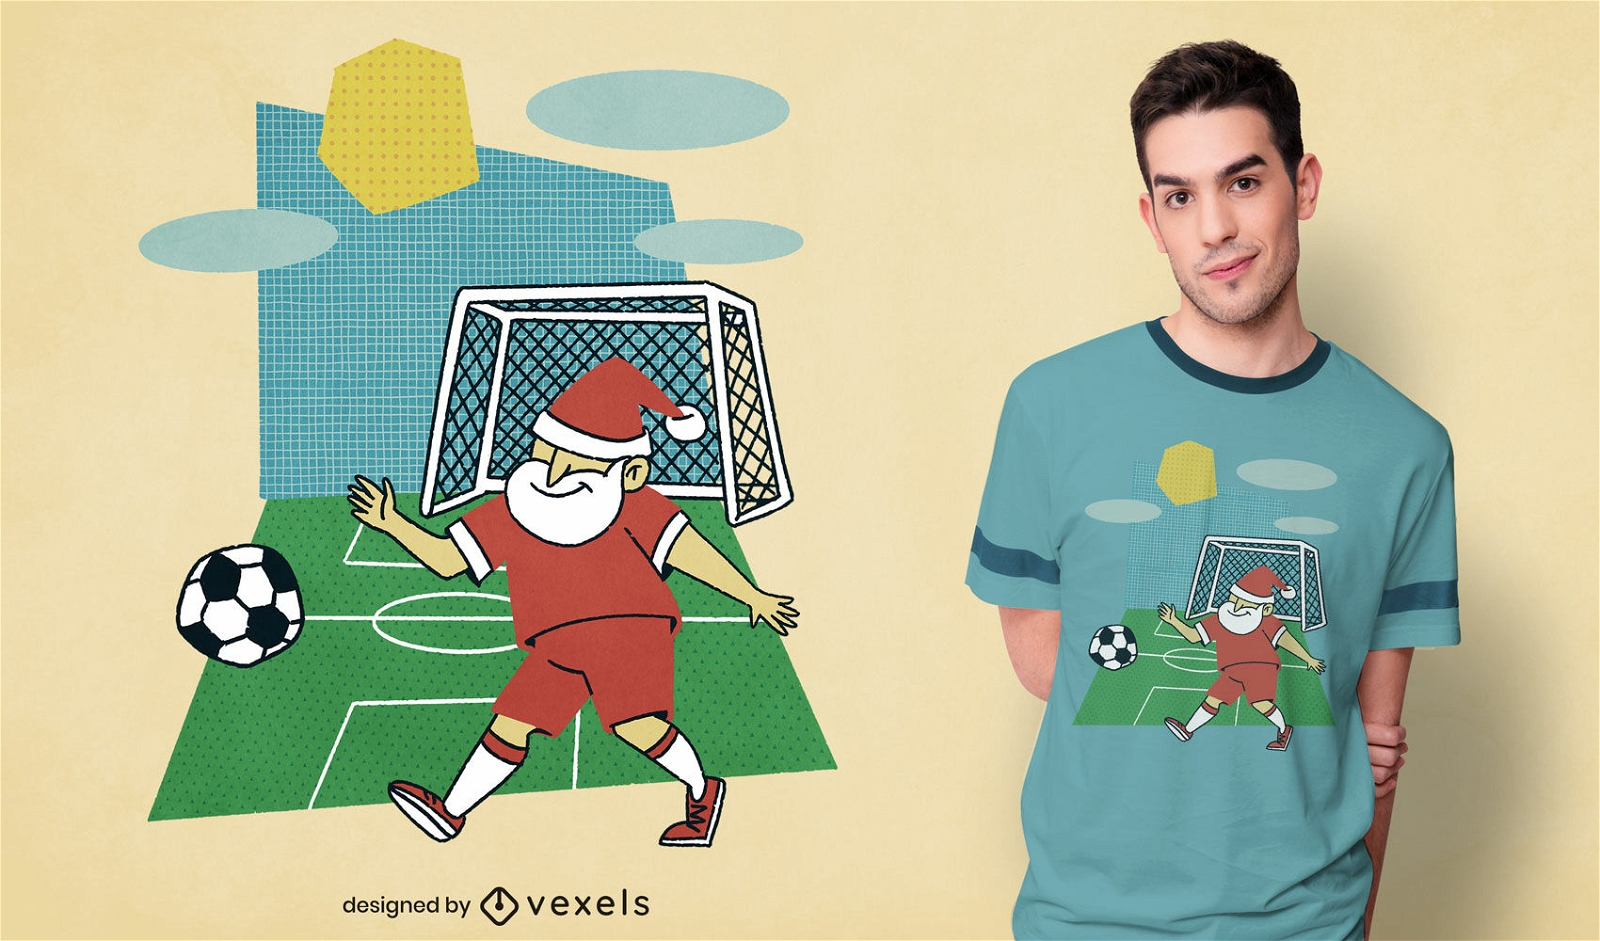
Papai Noel jogando futebol camiseta psd
Escolha uma pasta
Todos os favoritos
Criar novo
Salvar
Papai Noel jogando futebol camiseta psd
Pronto para imprimir
para Merch
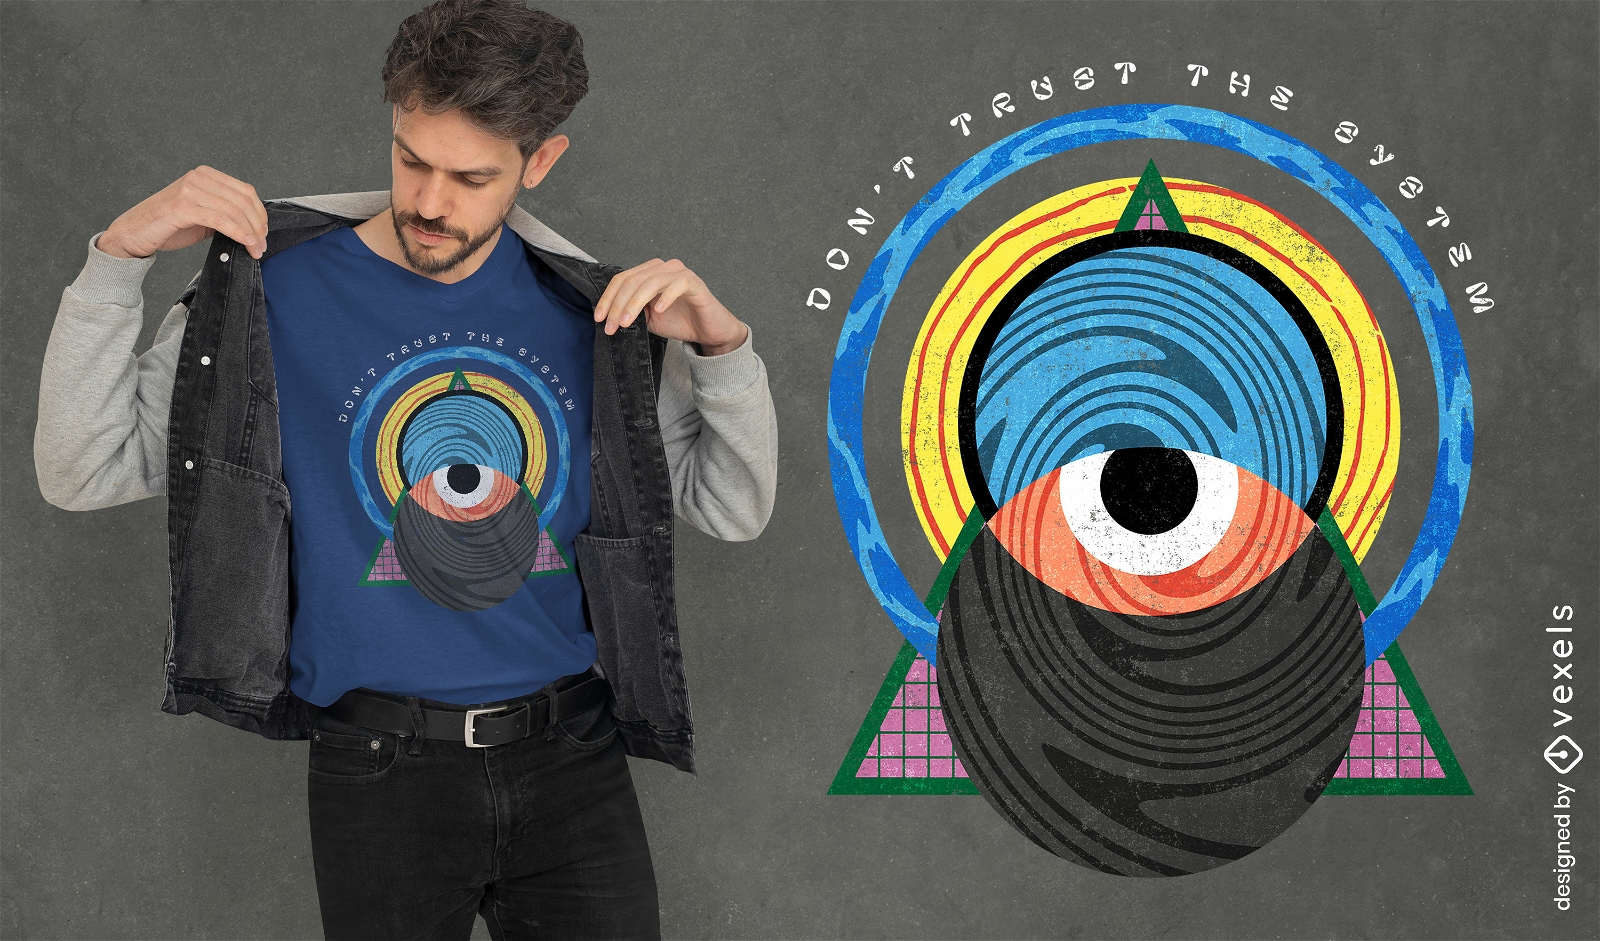
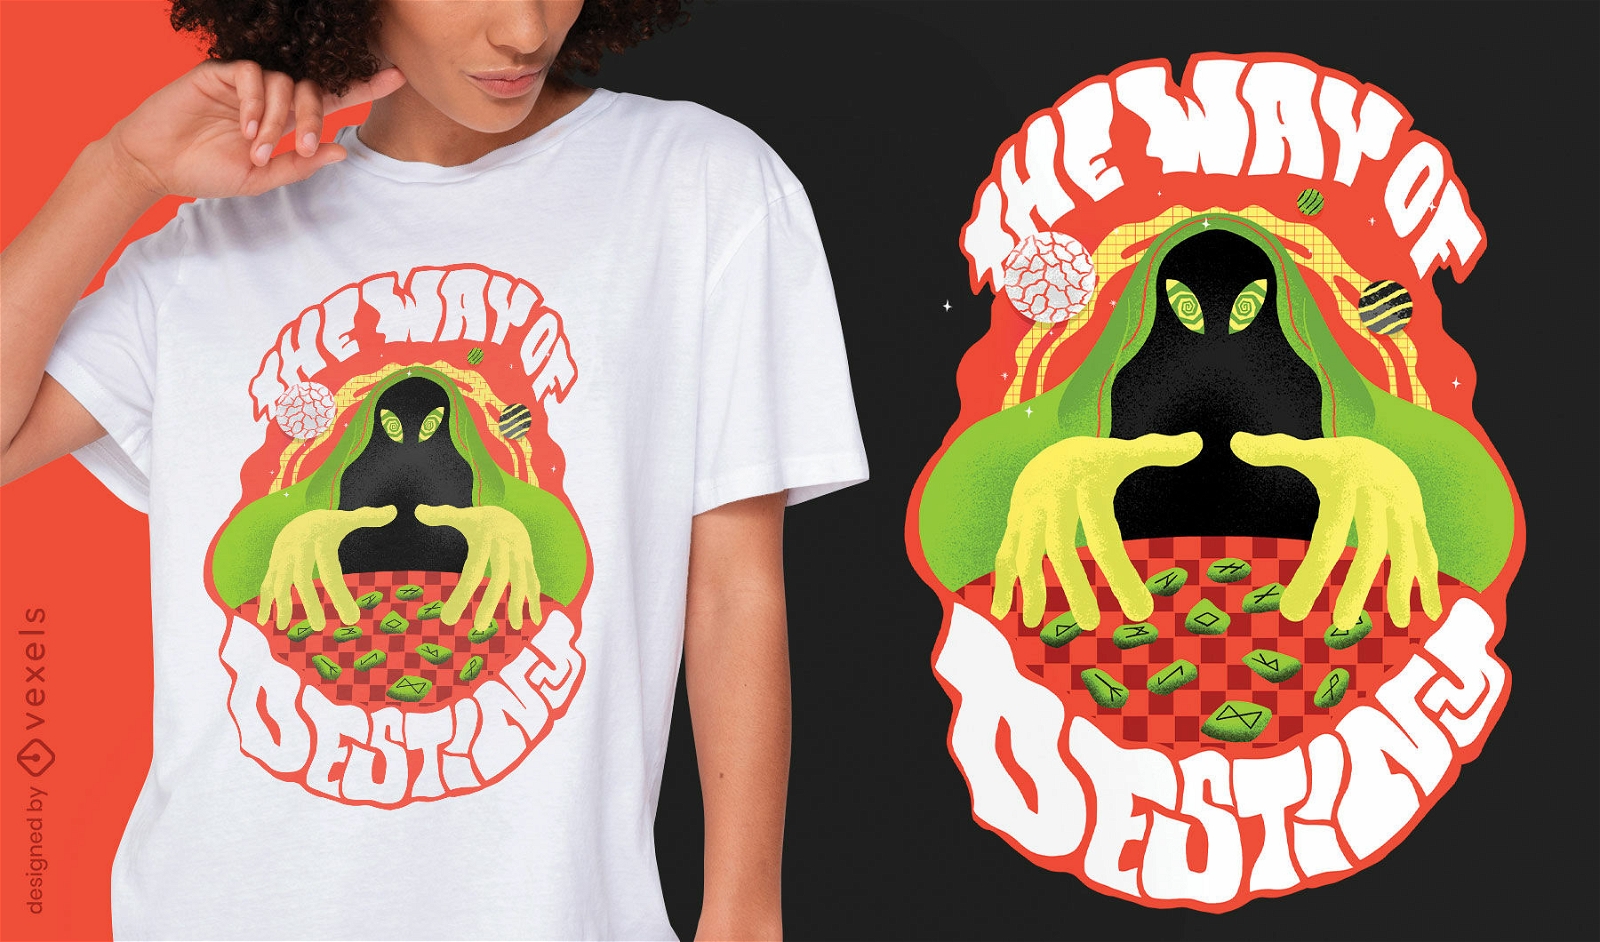
O caminho do destino trippy psd t-shirt design
Escolha uma pasta
Todos os favoritos
Criar novo
Salvar
O caminho do destino trippy psd t-shirt design
Pronto para imprimir
para Merch
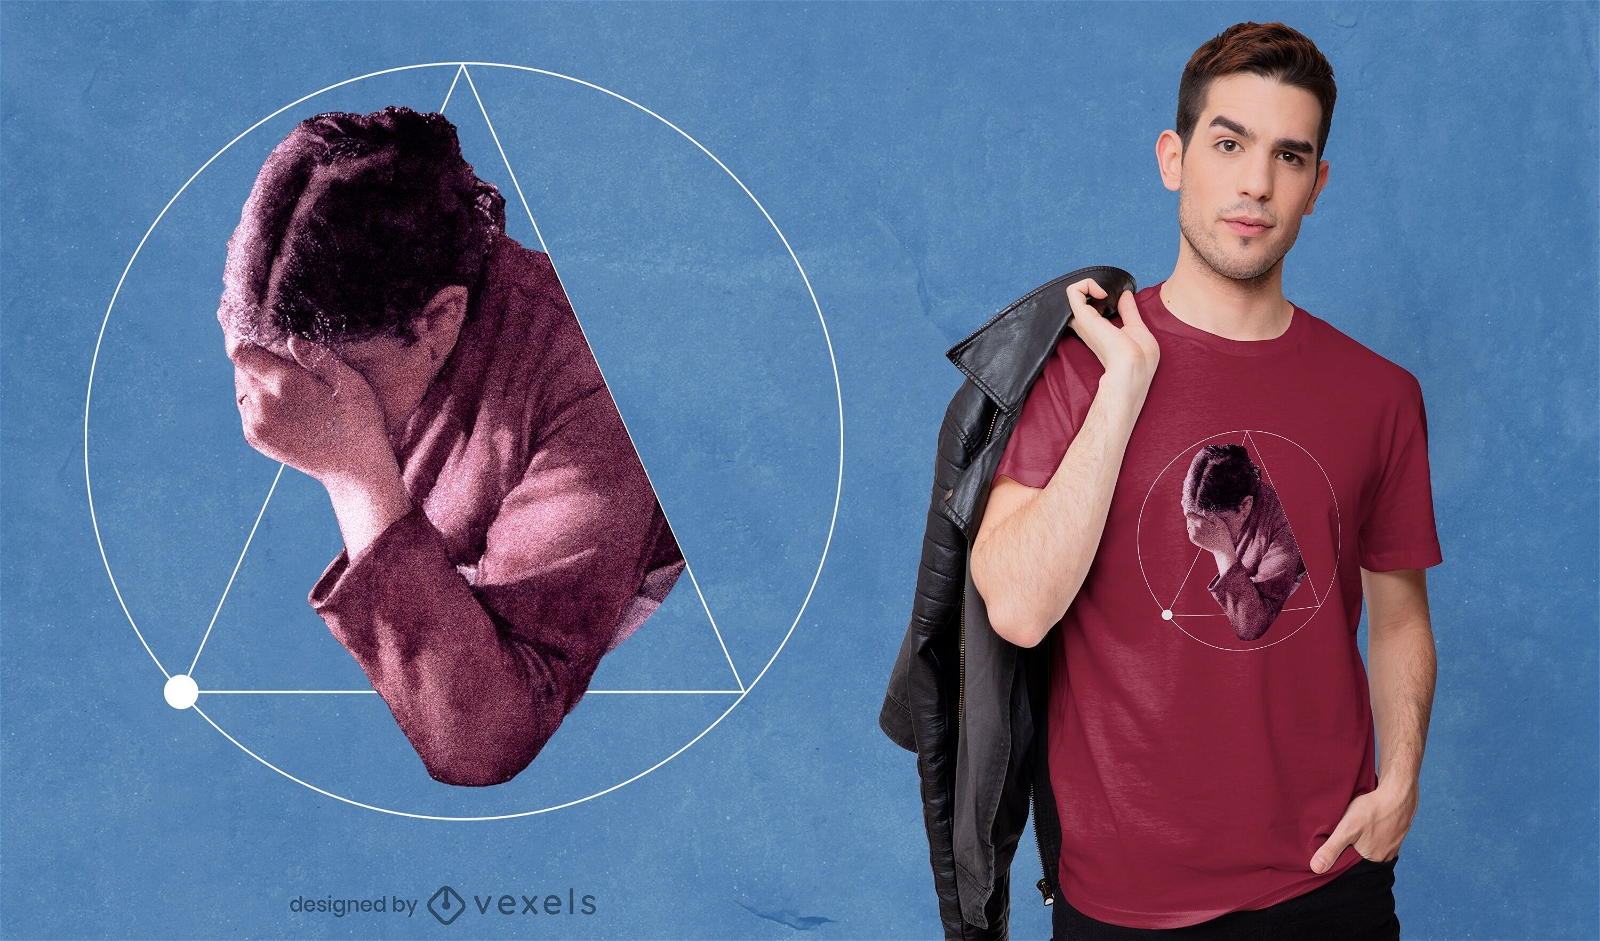
Geometric person cut PSD t-shirt design
Escolha uma pasta
Todos os favoritos
Criar novo
Salvar
Geometric person cut PSD t-shirt design
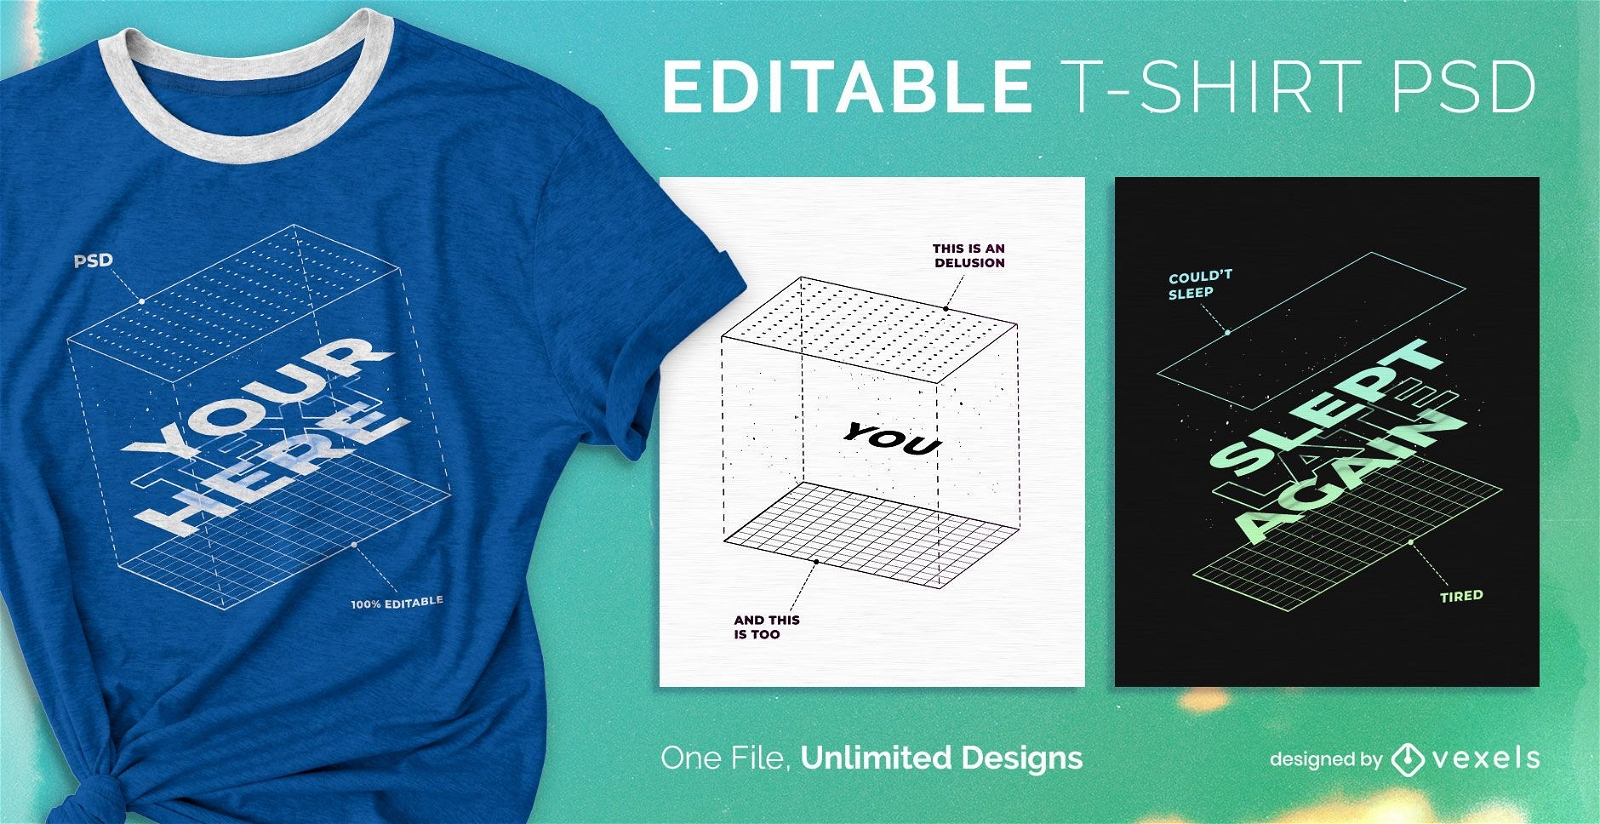
Camiseta PSD escalável
para Merch
T-shirt PSD escalável Box
Escolha uma pasta
Todos os favoritos
Criar novo
Salvar
T-shirt PSD escalável Box
Pronto para imprimir
para Merch
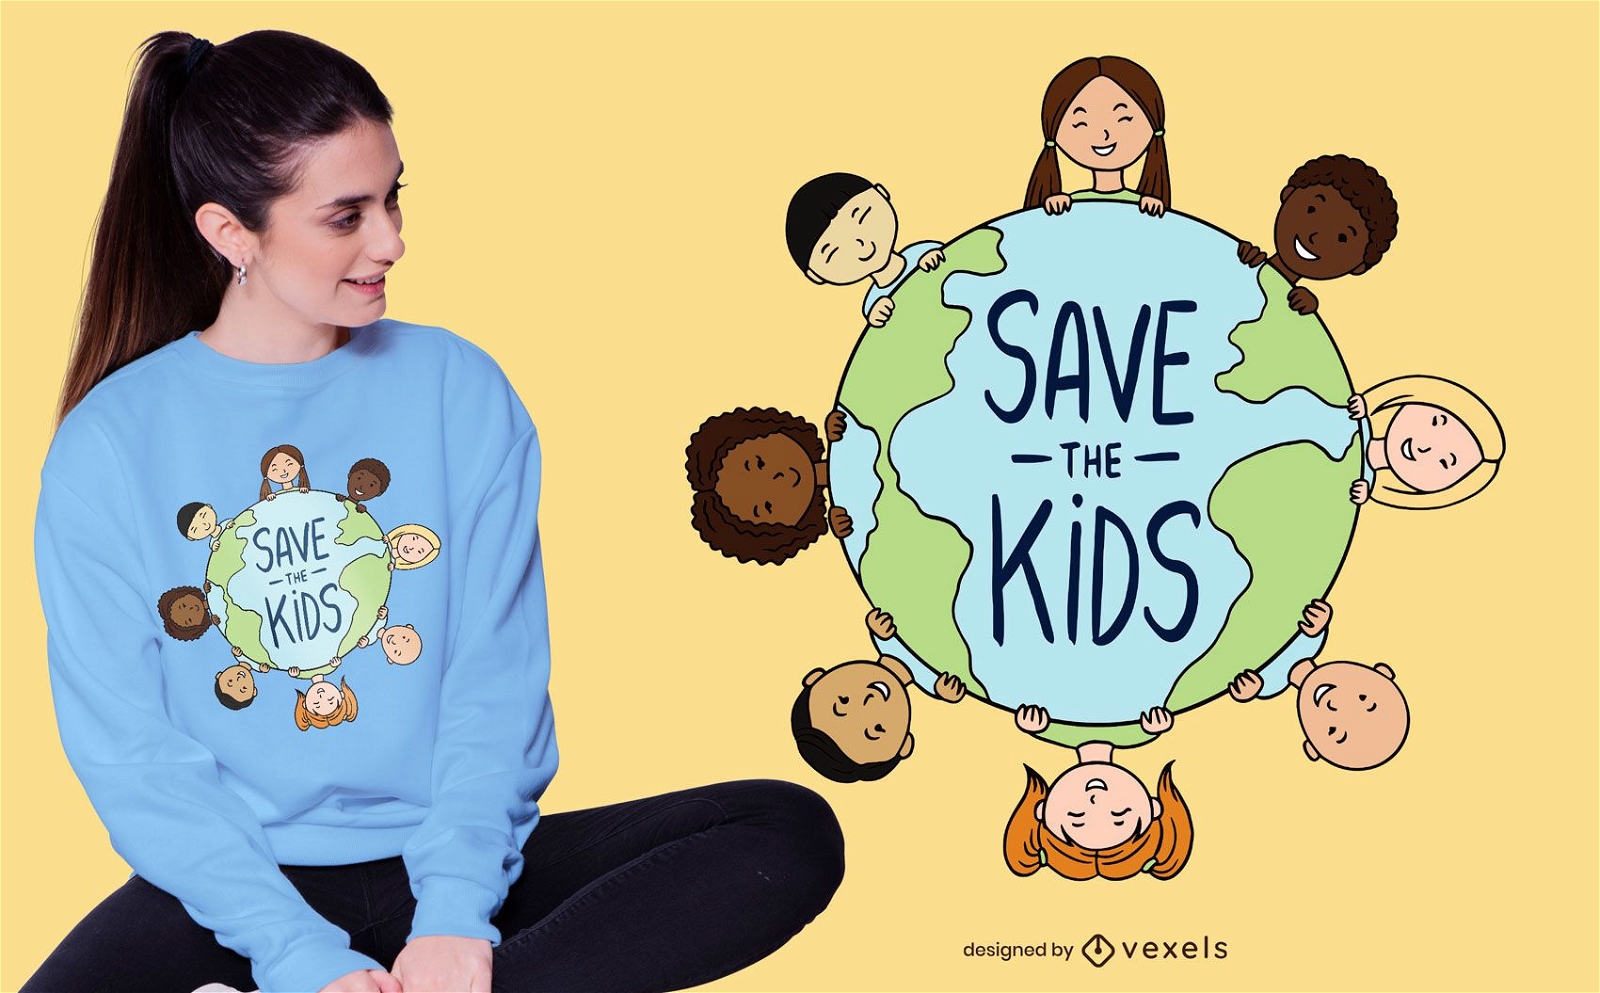
Save the Kids T-shirt Design
Escolha uma pasta
Todos os favoritos
Criar novo
Salvar
Save the Kids T-shirt Design
Pronto para imprimir
para Merch
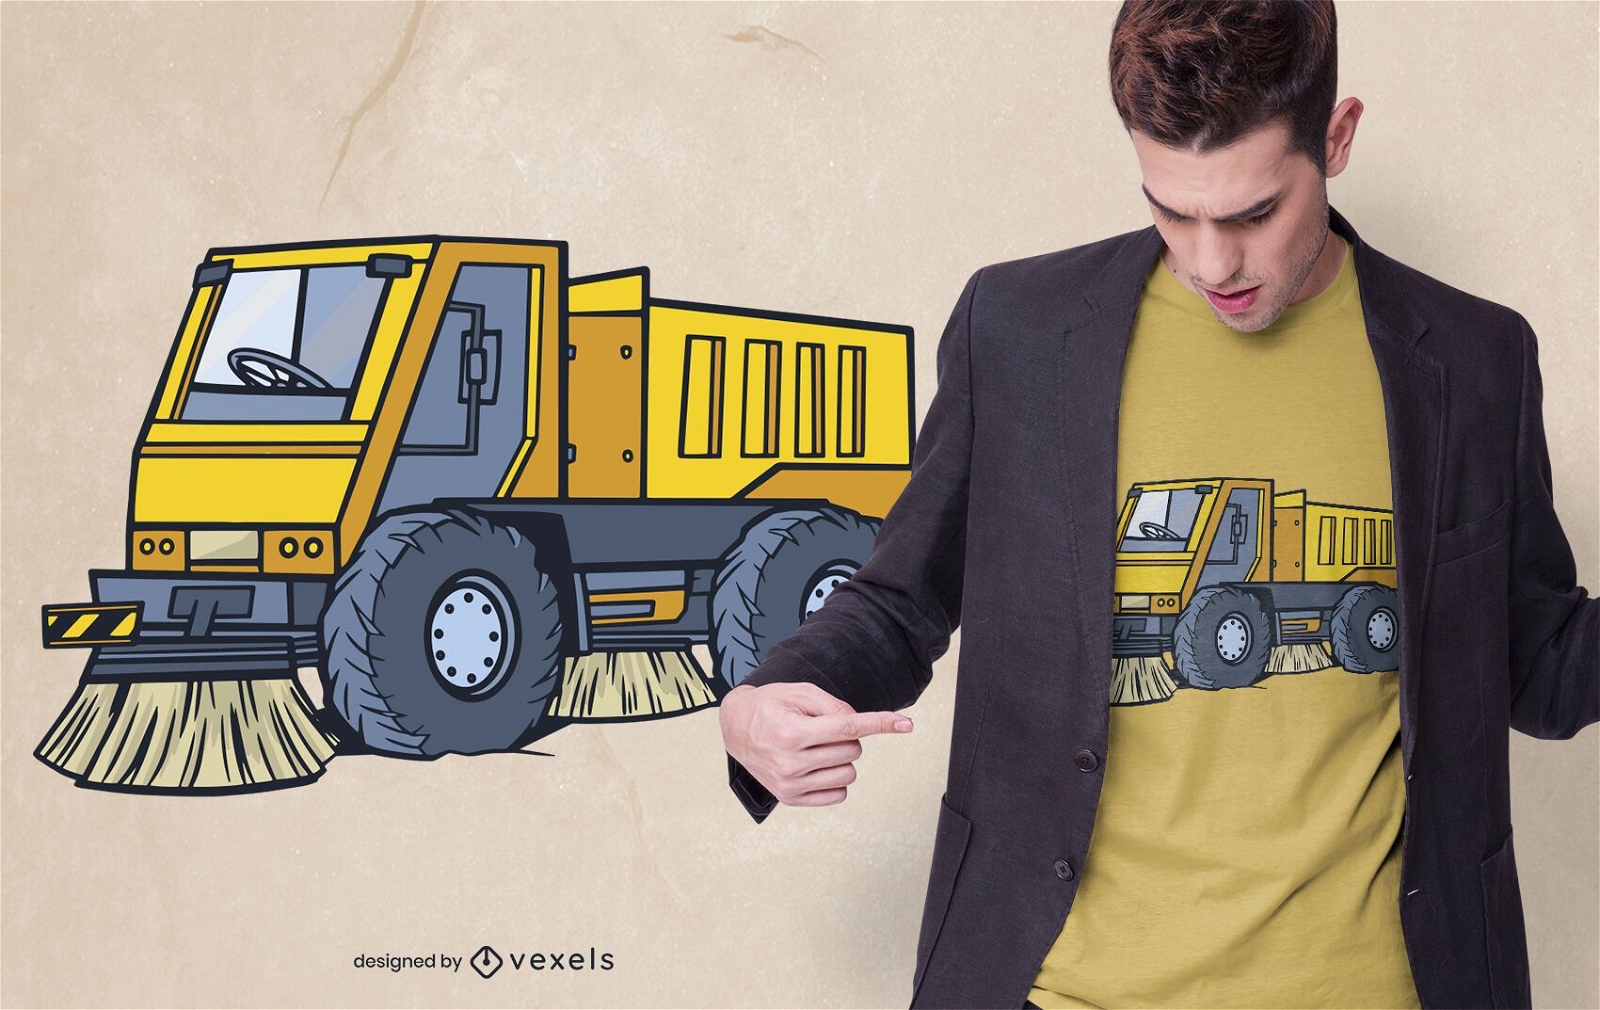
Design de camiseta do Street Sweeper Truck
Escolha uma pasta
Todos os favoritos
Criar novo
Salvar
Design de camiseta do Street Sweeper Truck
Gerado por IA, selecionado por nossos designers.
para Merch
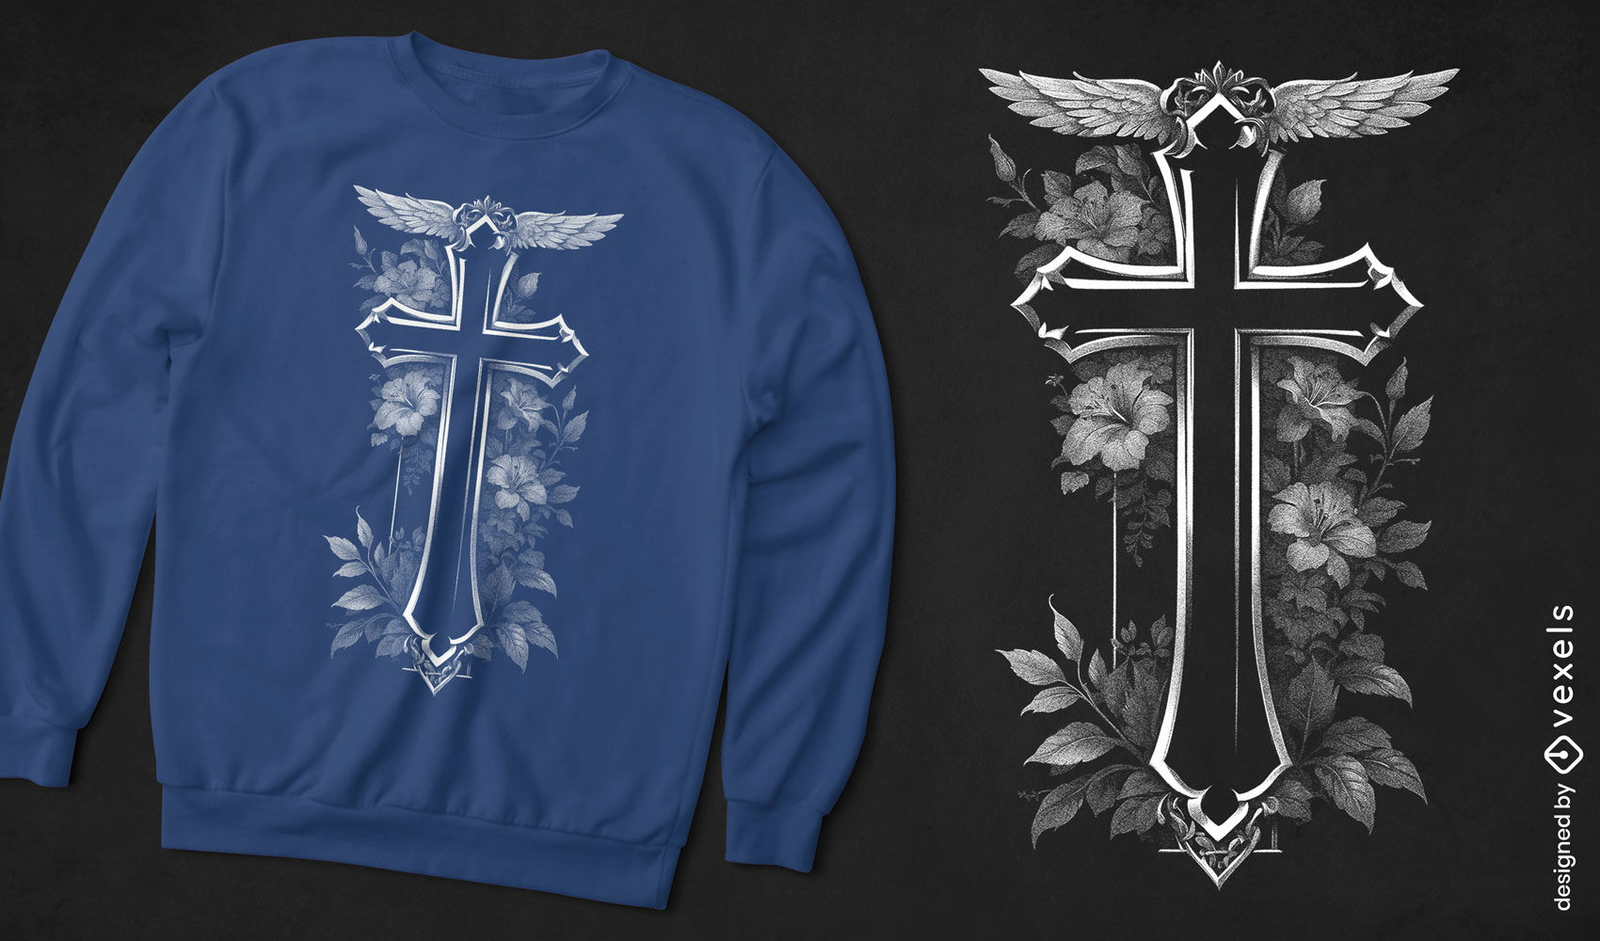
Cruz de fé com design de camiseta com flores
Escolha uma pasta
Todos os favoritos
Criar novo
Salvar
Cruz de fé com design de camiseta com flores
texto editável
Pronto para imprimir
para Merch
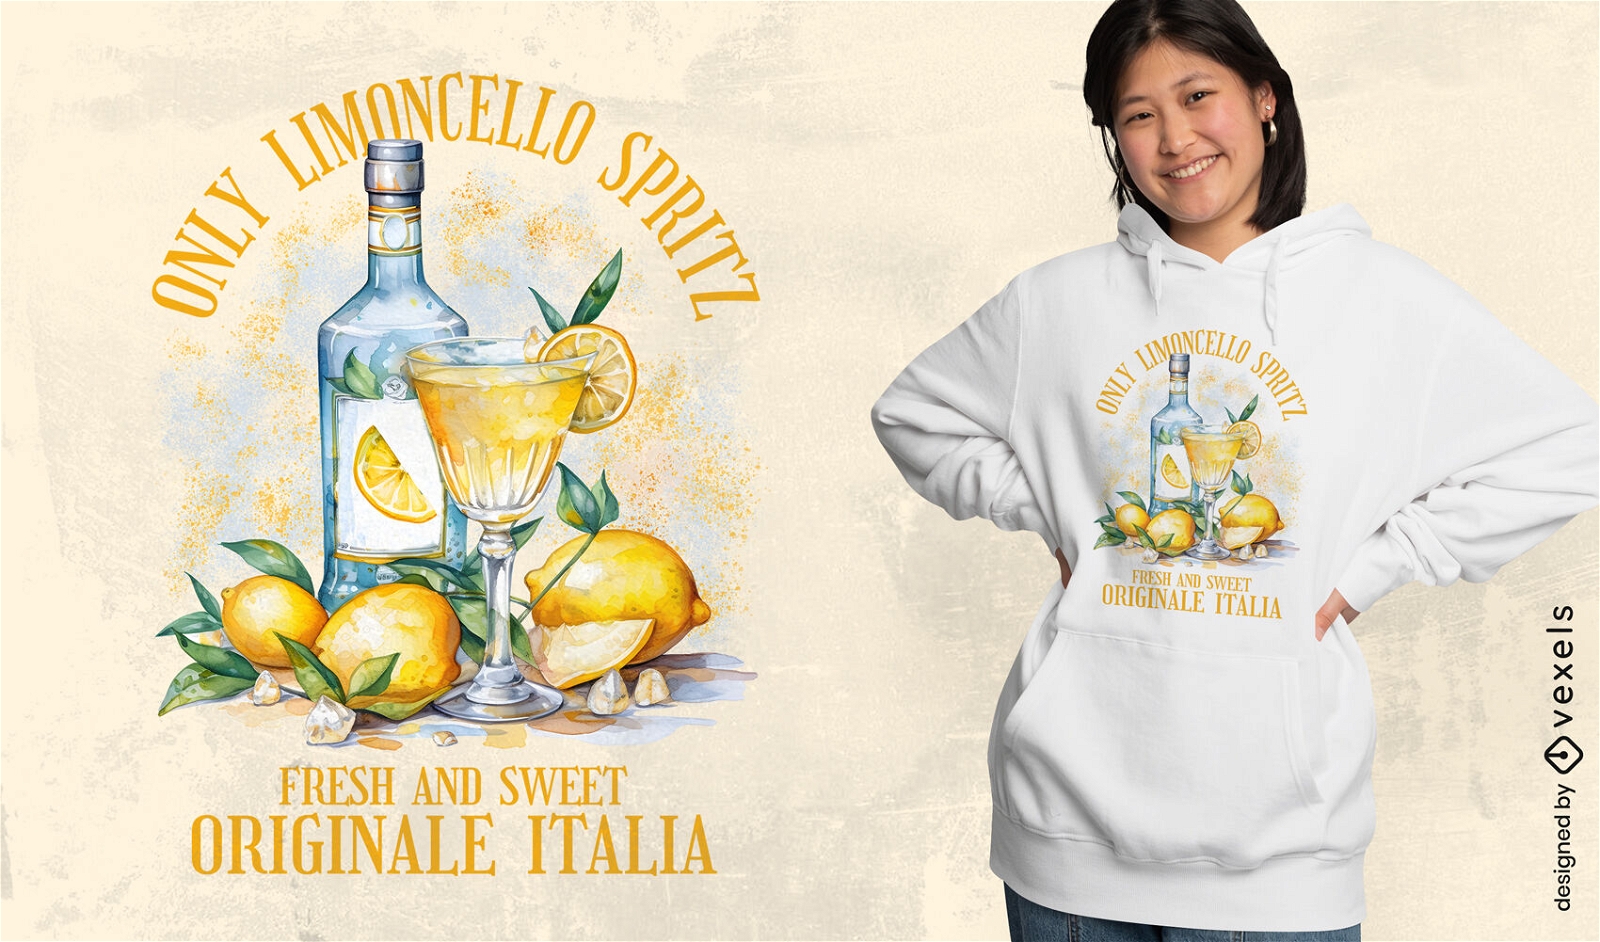
Design de camiseta com receita de Limoncello Spritz
Escolha uma pasta
Todos os favoritos
Criar novo
Salvar
Design de camiseta com receita de Limoncello Spritz
Gerado por IA, selecionado por nossos designers.
para Merch
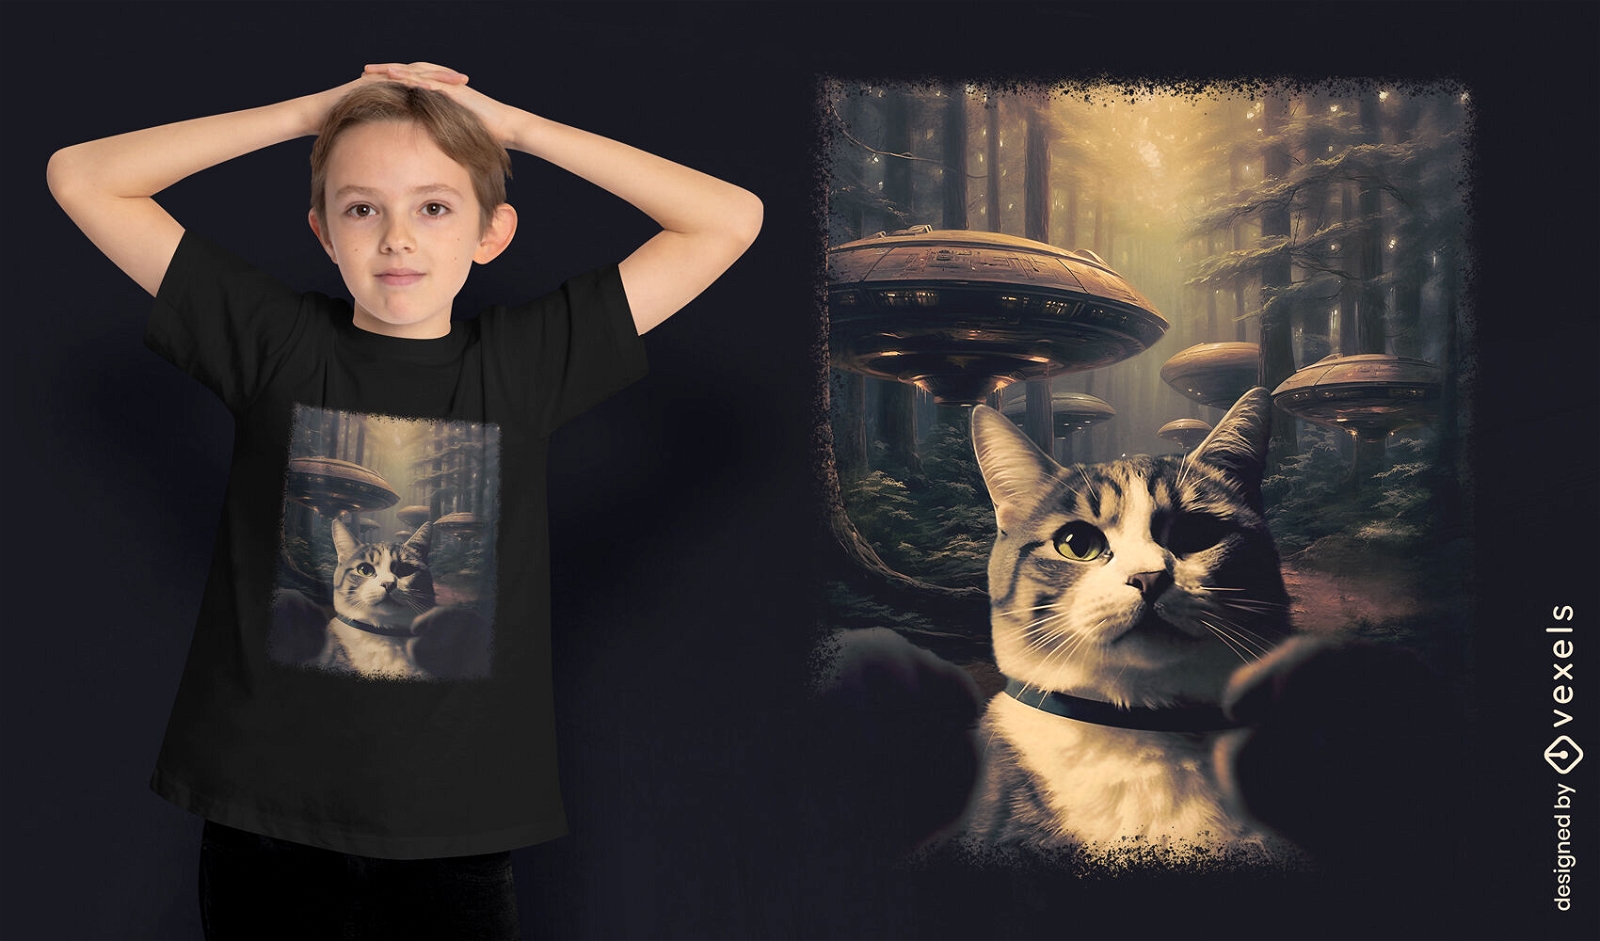
Design de camiseta fantasia de gato e OVNI
Escolha uma pasta
Todos os favoritos
Criar novo
Salvar
Design de camiseta fantasia de gato e OVNI
Gerado por IA, selecionado por nossos designers.
para Merch
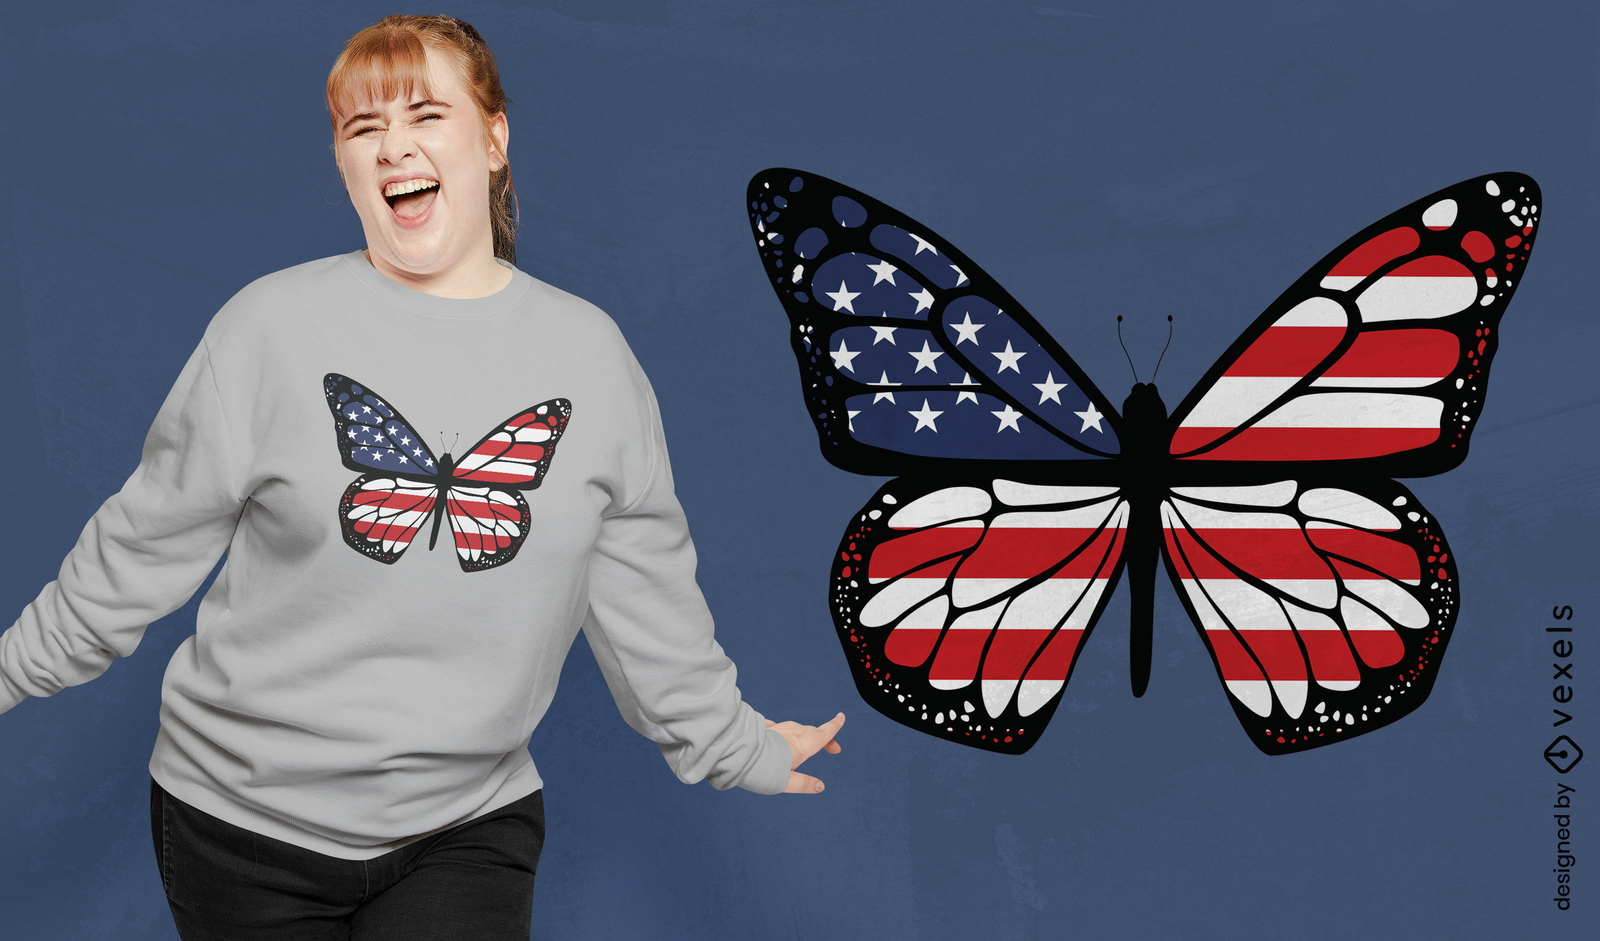
Design patri?tico de camiseta com borboleta
Escolha uma pasta
Todos os favoritos
Criar novo
Salvar
Design patri?tico de camiseta com borboleta
Gerado por IA, selecionado por nossos designers.
para Merch
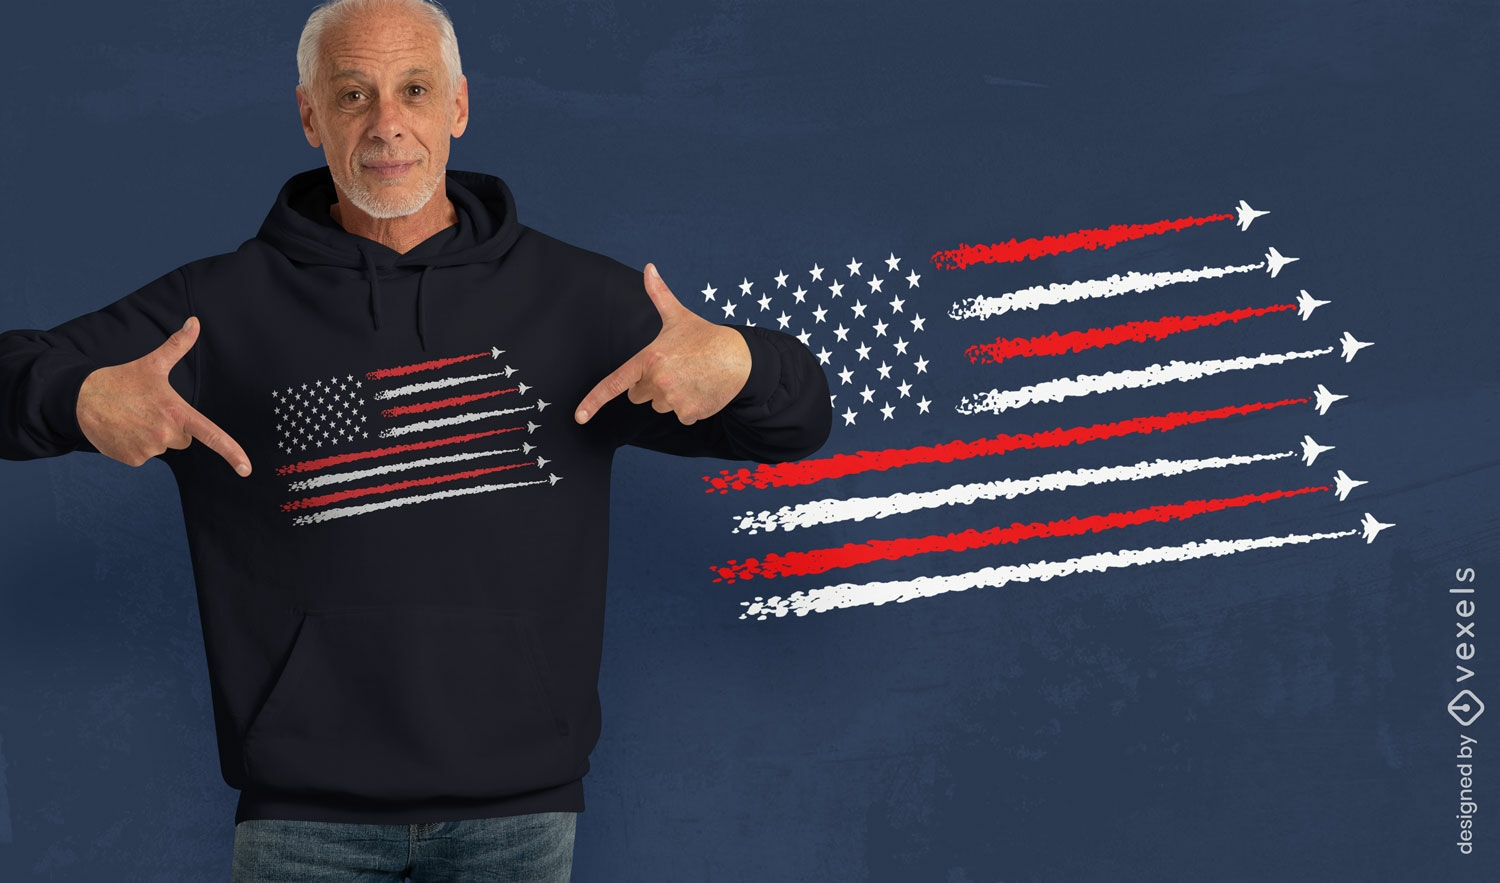
Design de camiseta com setas da bandeira americana
Escolha uma pasta
Todos os favoritos
Criar novo
Salvar
Design de camiseta com setas da bandeira americana
Gerado por IA, selecionado por nossos designers.
para Merch
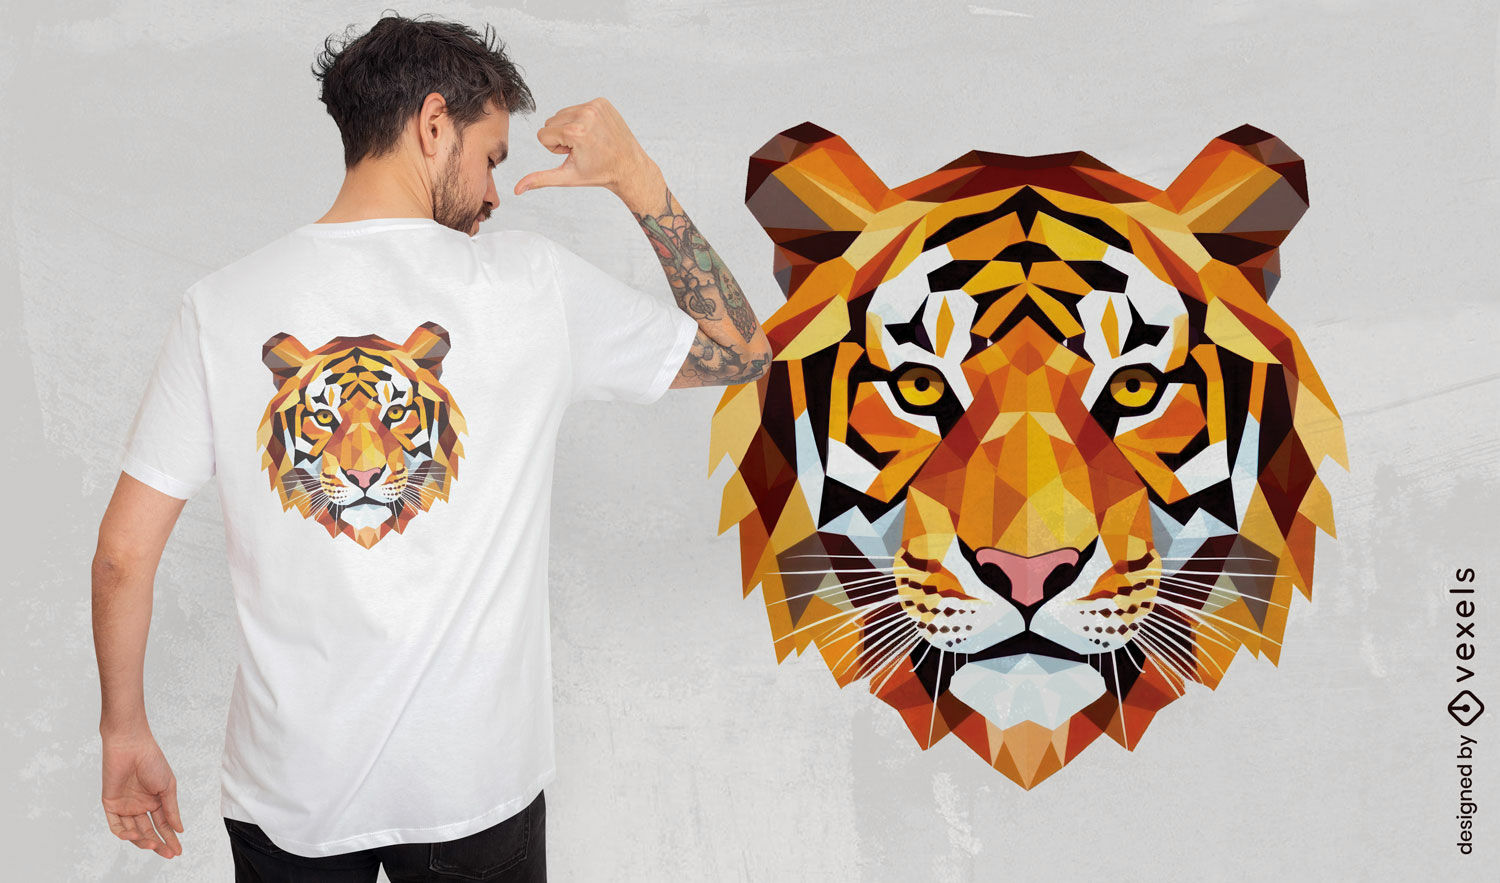
Design geométrico de camiseta com cara de tigre
Escolha uma pasta
Todos os favoritos
Criar novo
Salvar
Design geométrico de camiseta com cara de tigre
Gerado por IA, selecionado por nossos designers.
para Merch
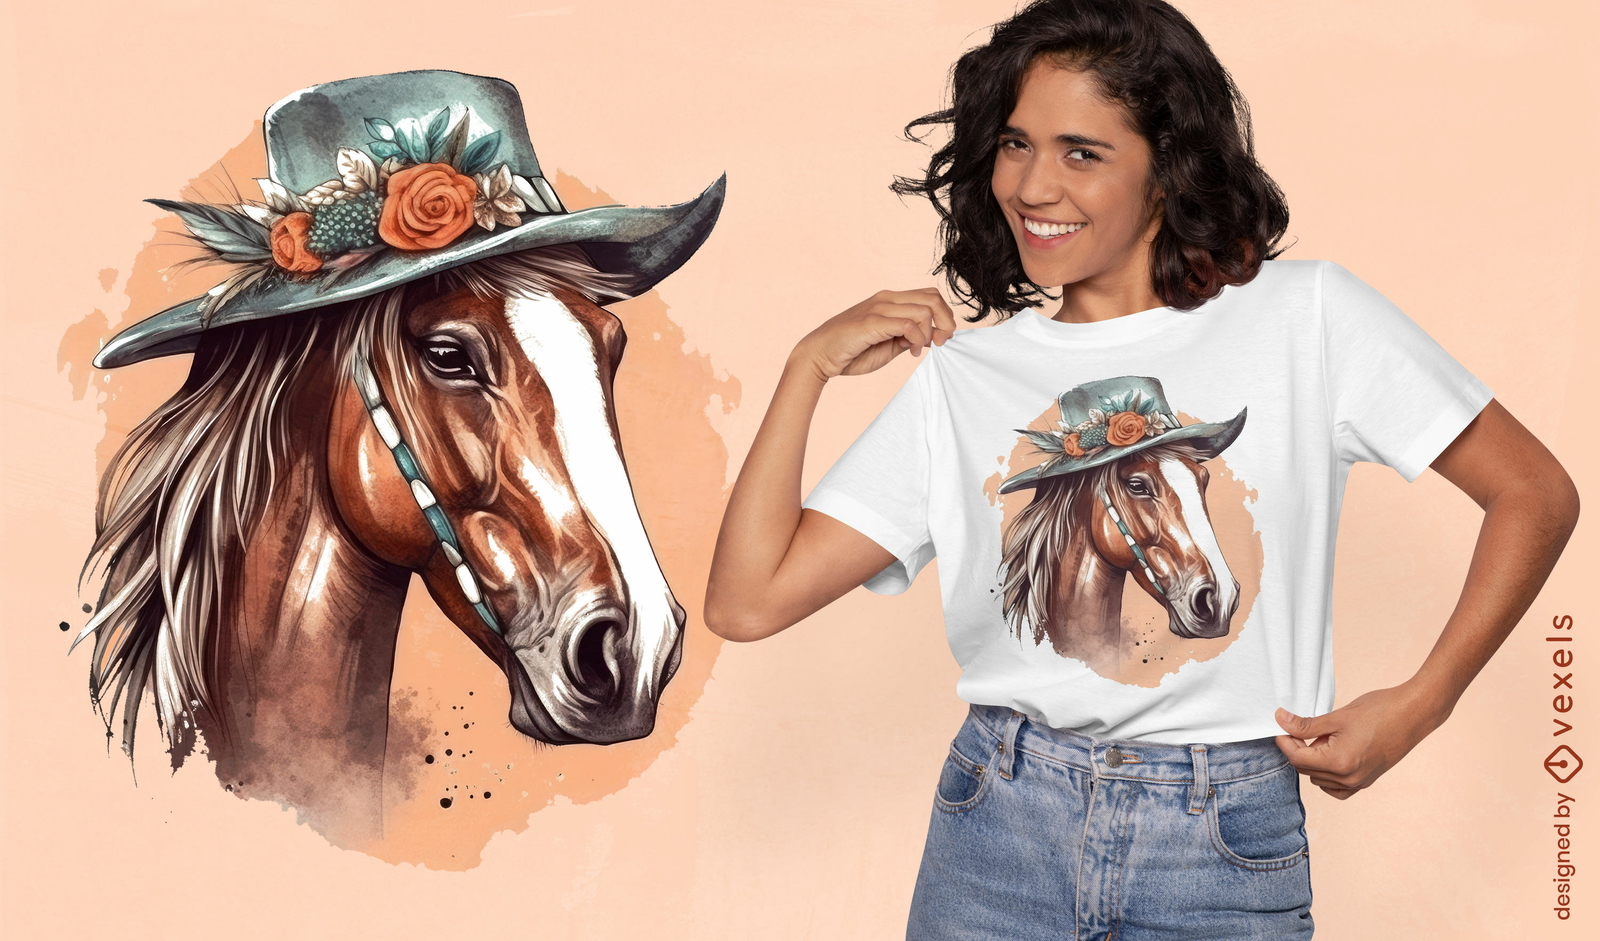
Design de camiseta de cavalo boêmio
Escolha uma pasta
Todos os favoritos
Criar novo
Salvar
Design de camiseta de cavalo boêmio
Gerado por IA, selecionado por nossos designers.
para Merch
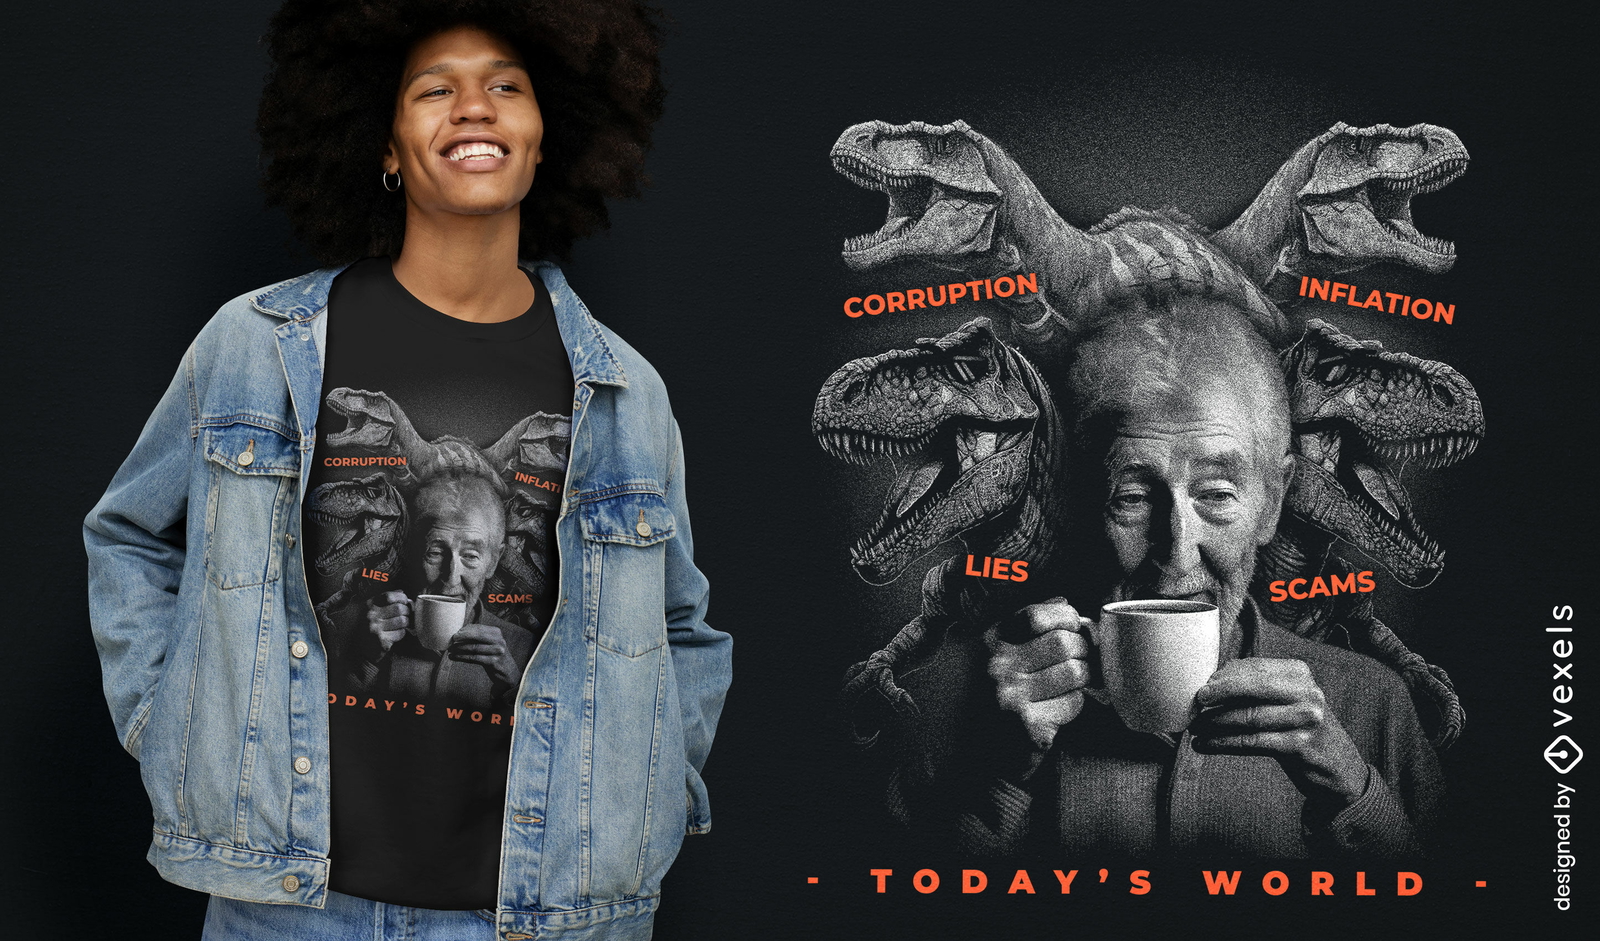
Design satírico de camiseta com caricatura de político
Escolha uma pasta
Todos os favoritos
Criar novo
Salvar
Design satírico de camiseta com caricatura de político
Gerado por IA, selecionado por nossos designers.
para Merch
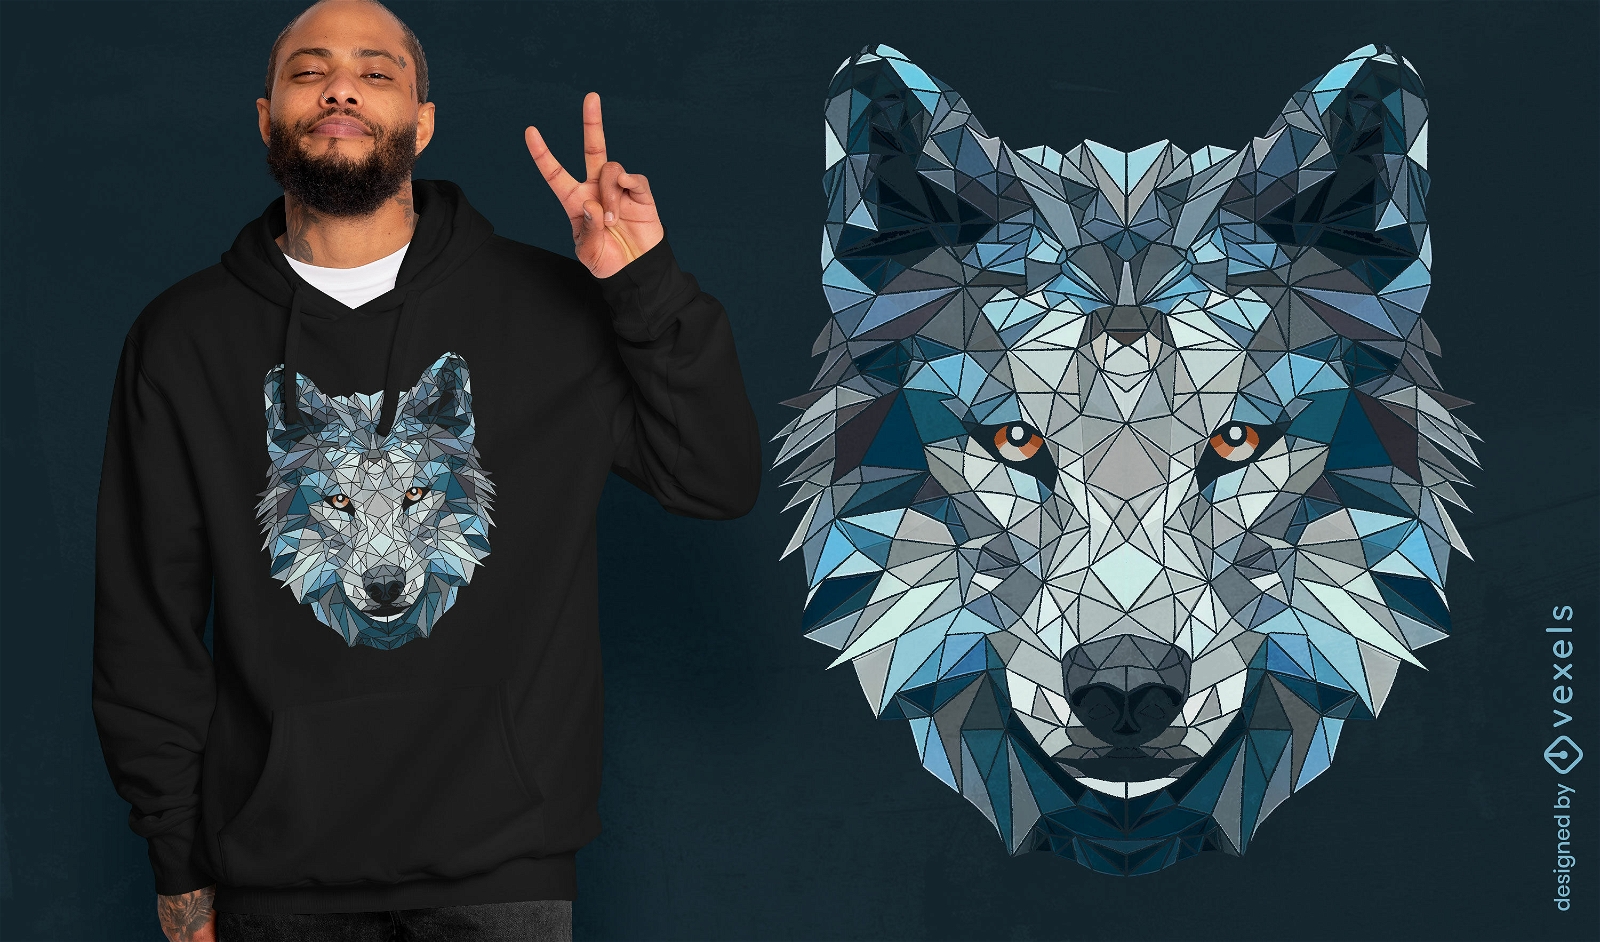
Design poligonal de camiseta lobo branco
Escolha uma pasta
Todos os favoritos
Criar novo
Salvar
Design poligonal de camiseta lobo branco
Pronto para imprimir
para Merch
Design de camiseta com sapos Cottagecore em barco de folhas
Escolha uma pasta
Todos os favoritos
Criar novo
Salvar
Design de camiseta com sapos Cottagecore em barco de folhas
Pronto para imprimir
para Merch
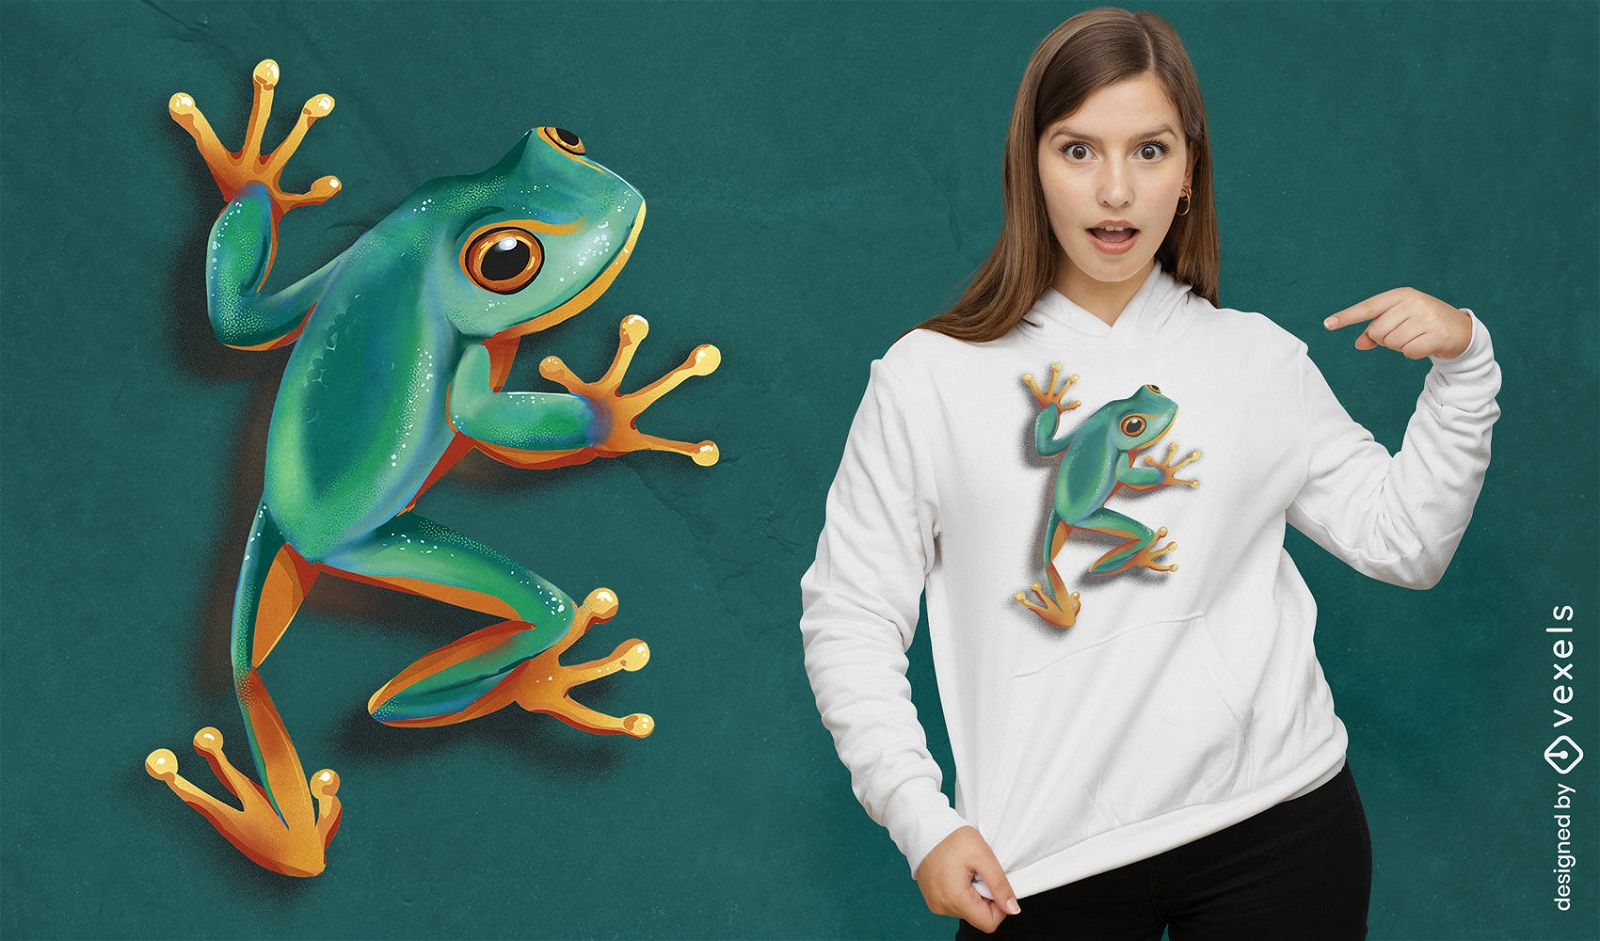
Design realista de camiseta sapo verde
Escolha uma pasta
Todos os favoritos
Criar novo
Salvar
Design realista de camiseta sapo verde
Gerado por IA, selecionado por nossos designers.
para Merch
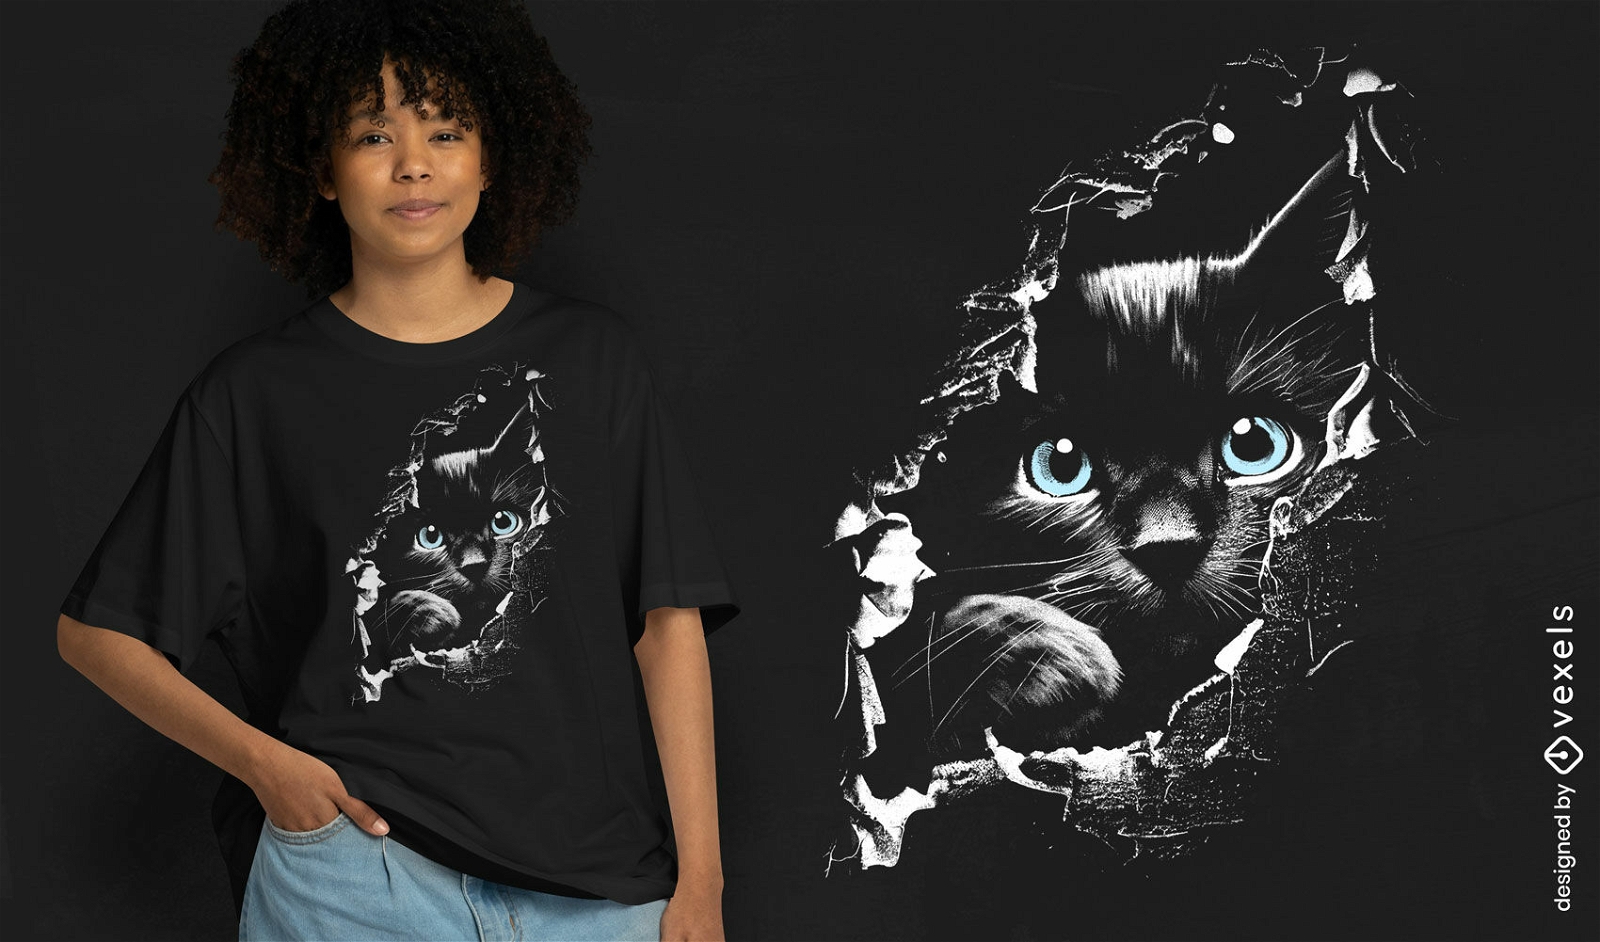
Design emergente de camisetas para gatos
Escolha uma pasta
Todos os favoritos
Criar novo
Salvar
Design emergente de camisetas para gatos
Gerado por IA, selecionado por nossos designers.
para Merch
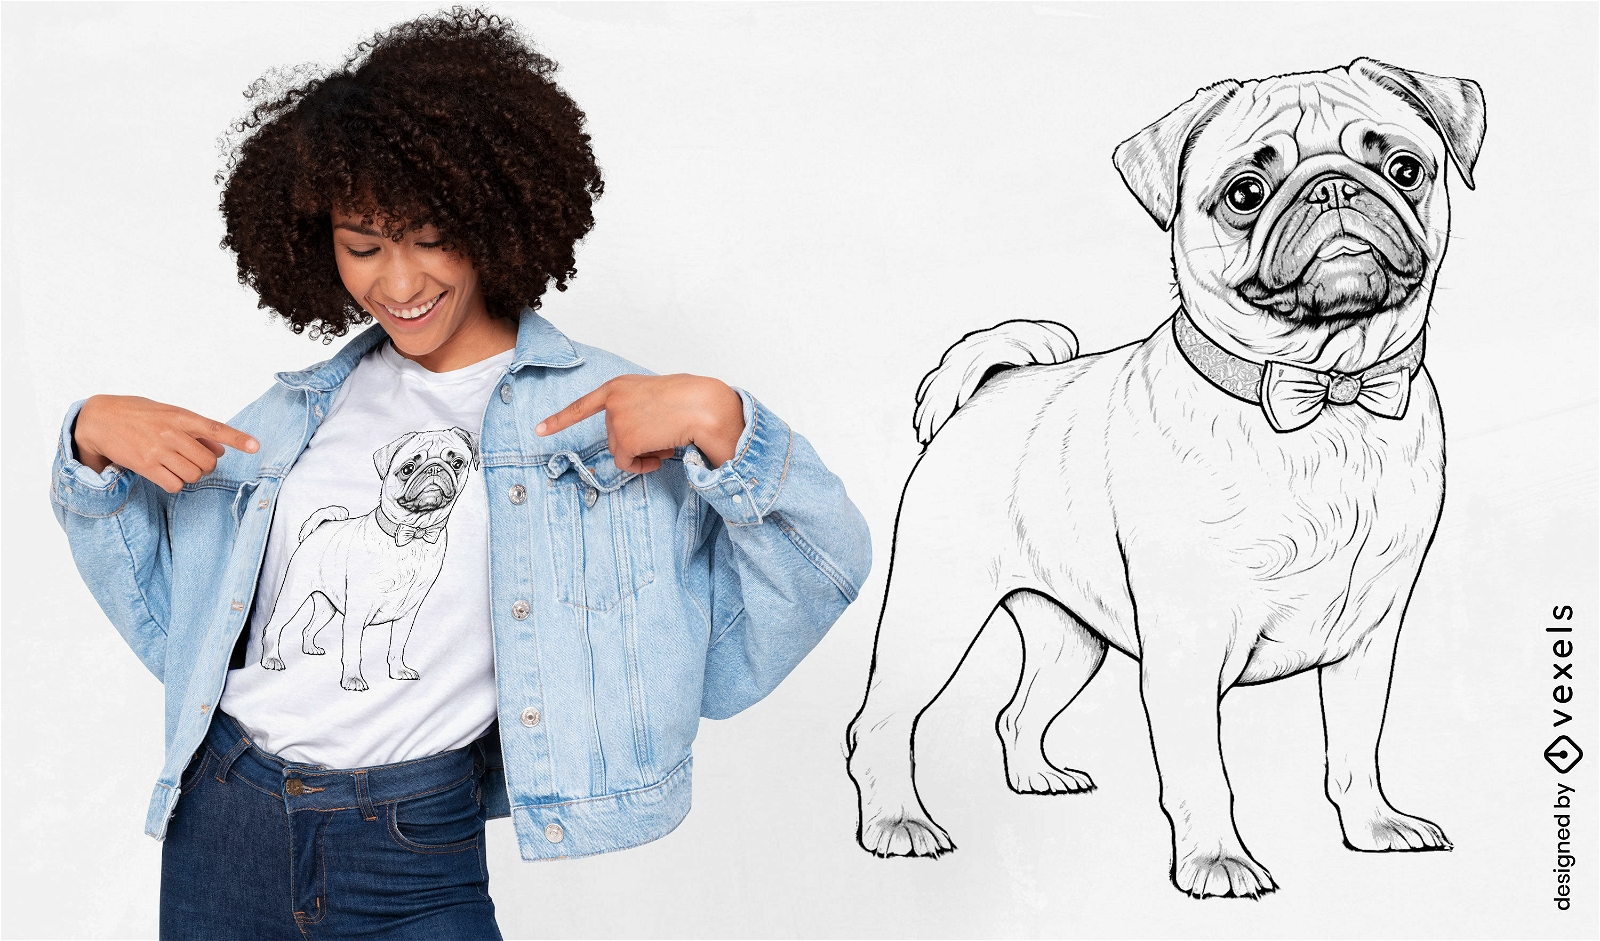
Design encantador de camiseta para cachorro pug
Escolha uma pasta
Todos os favoritos
Criar novo
Salvar
Design encantador de camiseta para cachorro pug
Pronto para imprimir
para Merch
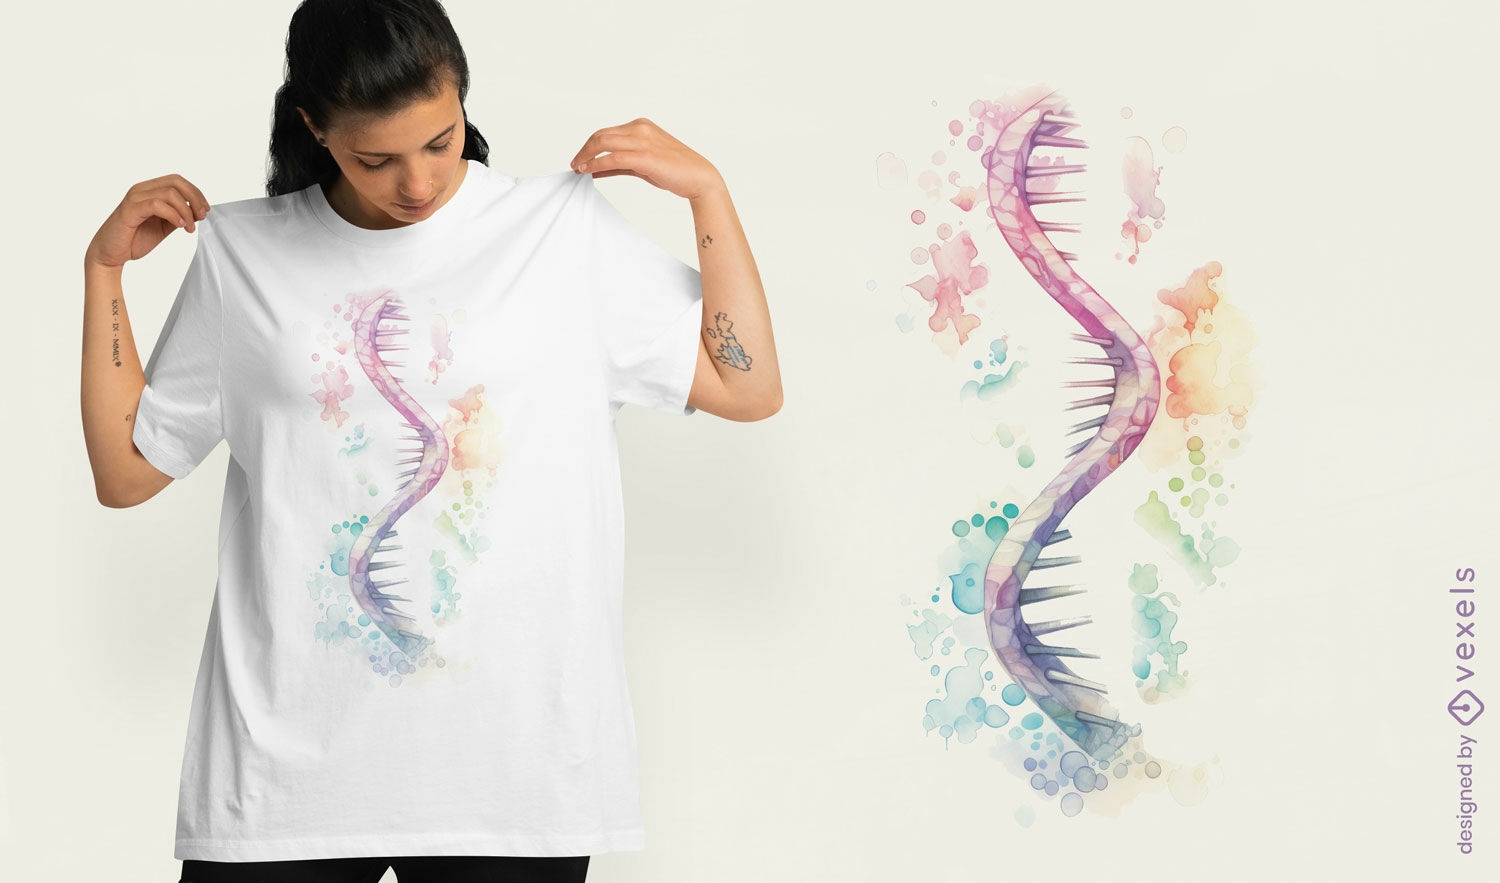
Design de camiseta RNA em aquarela
Escolha uma pasta
Todos os favoritos
Criar novo
Salvar
Design de camiseta RNA em aquarela
Pronto para imprimir
para Merch
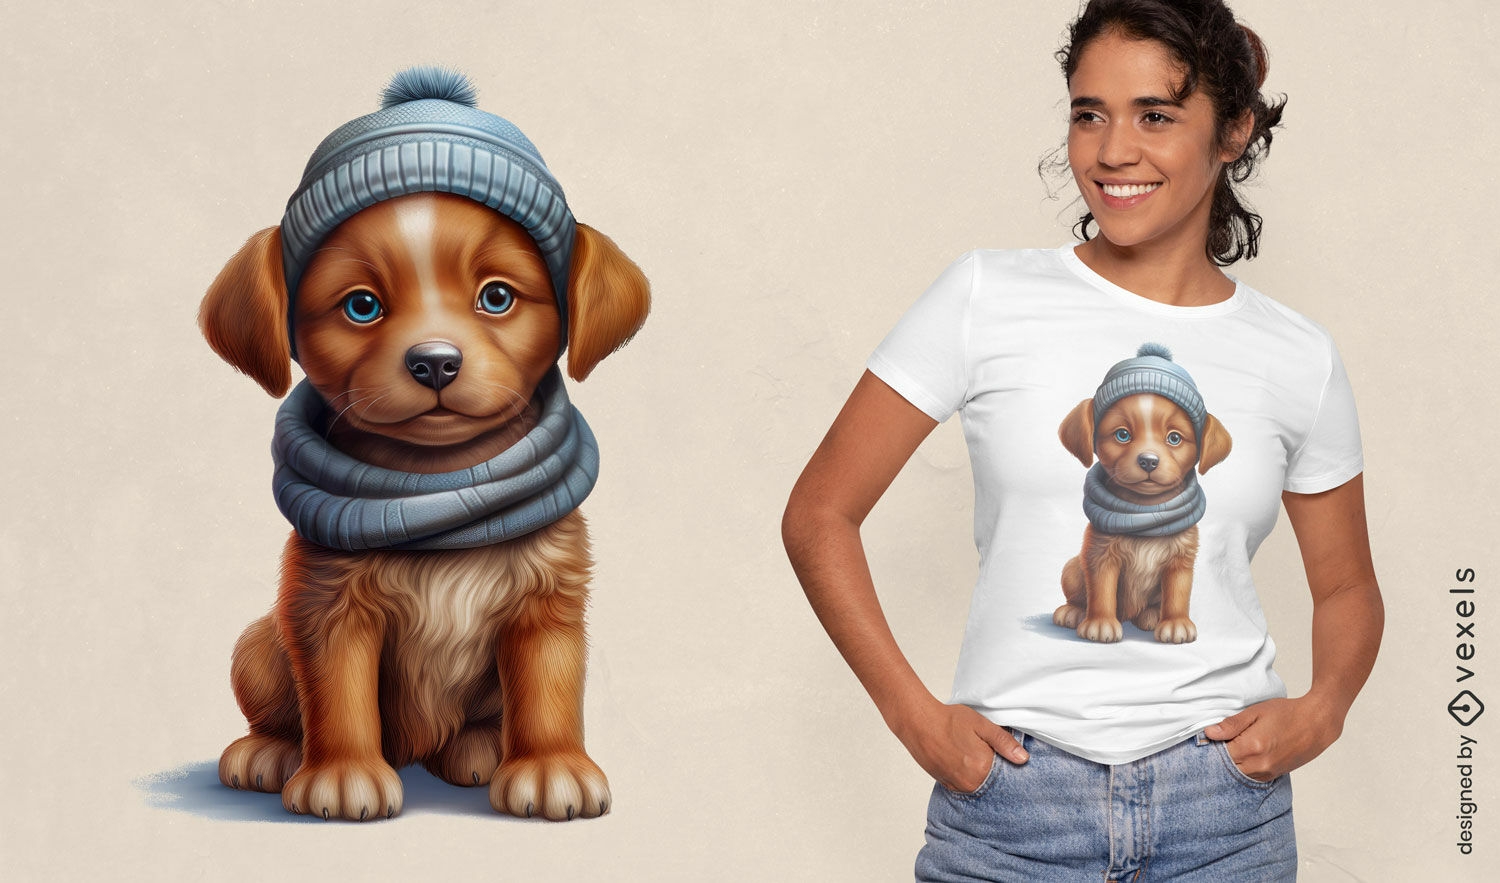
Design de camiseta de inverno para cachorro
Escolha uma pasta
Todos os favoritos
Criar novo
Salvar
Design de camiseta de inverno para cachorro
Pronto para imprimir
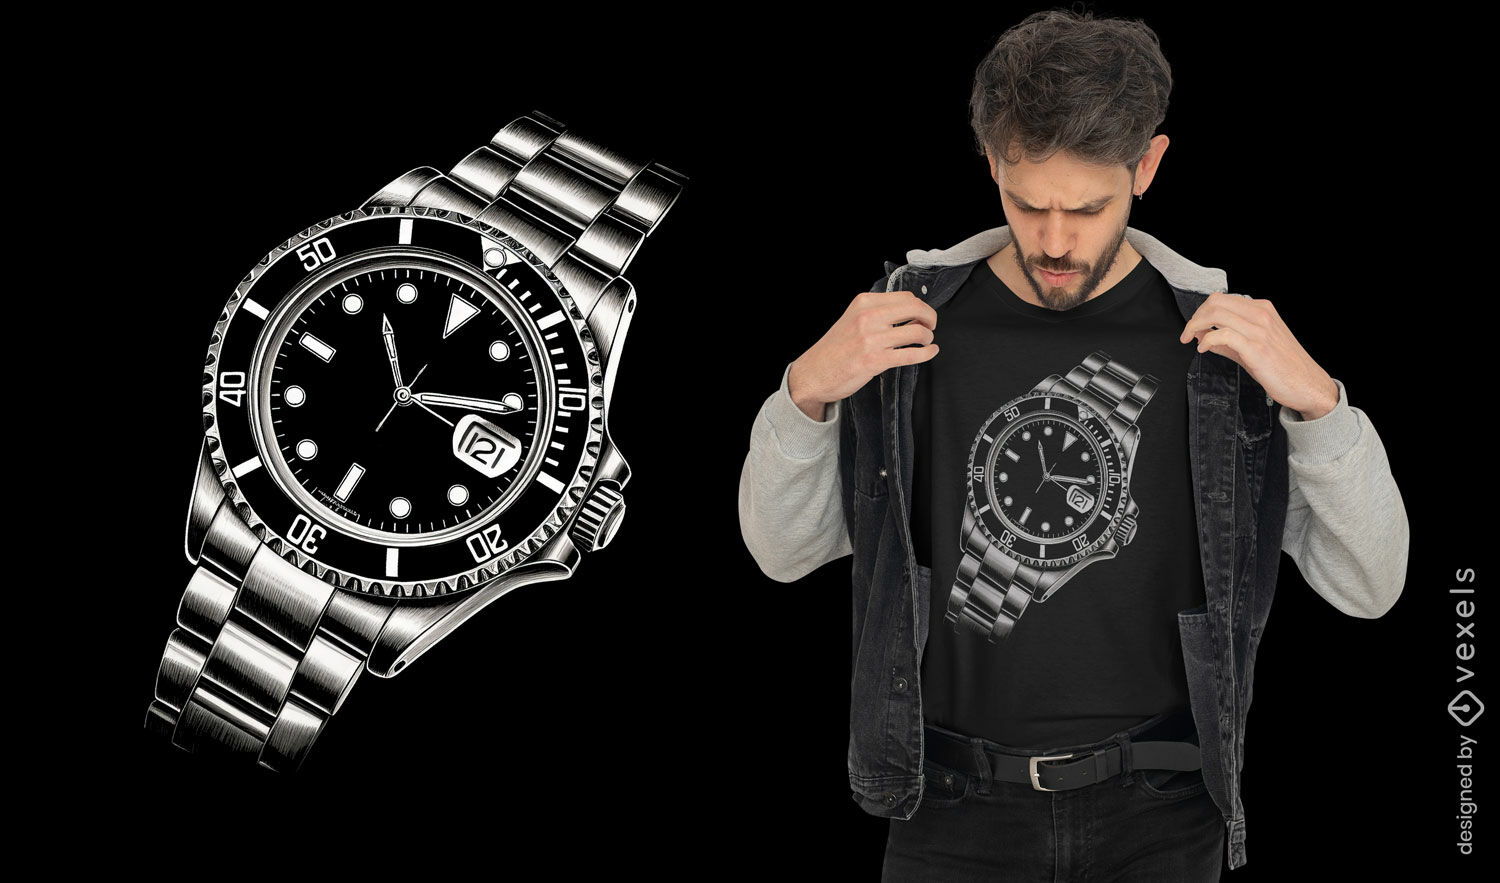
para Merch
Design de camiseta para rel?gio de pulso
Escolha uma pasta
Todos os favoritos
Criar novo
Salvar
Design de camiseta para rel?gio de pulso
Pronto para imprimir
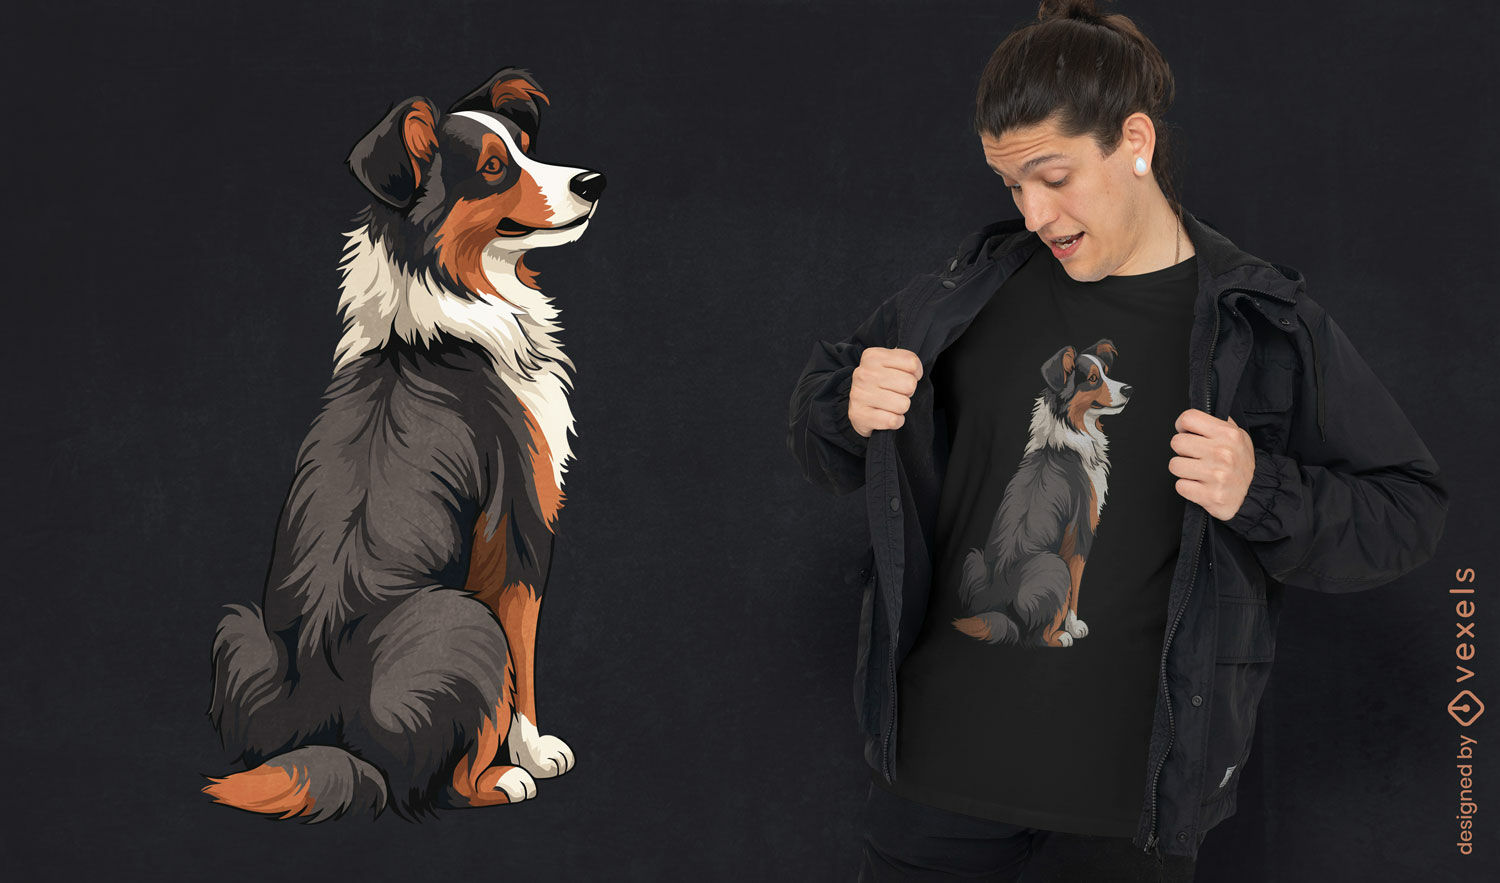
para Merch
Design de camiseta com ilustra??o de cachorro pastor
Escolha uma pasta
Todos os favoritos
Criar novo
Salvar
Design de camiseta com ilustra??o de cachorro pastor
Pronto para imprimir
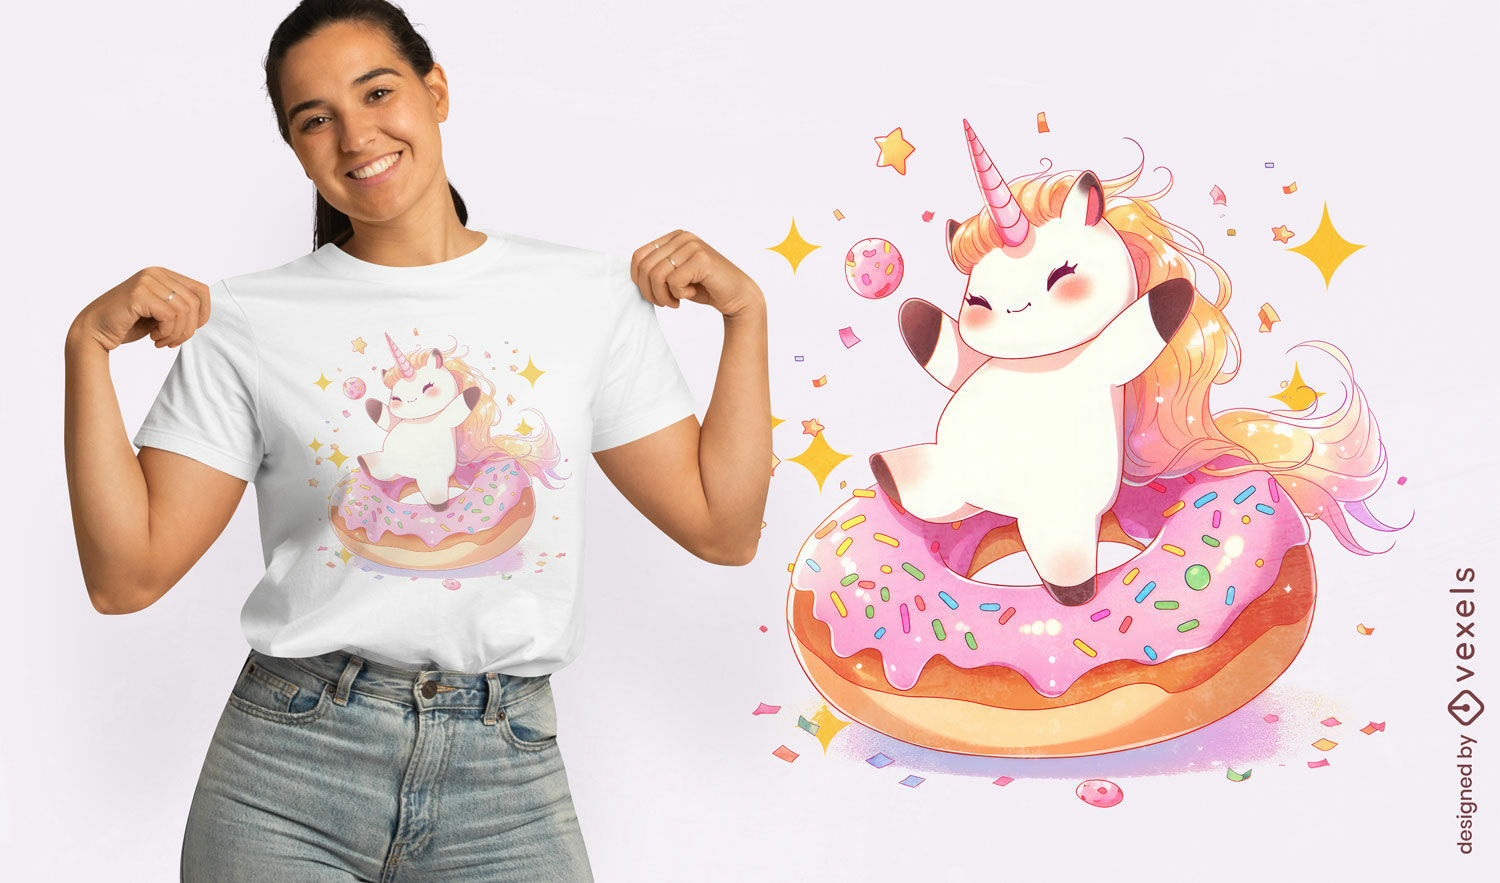
para Merch
Design de camiseta de donut de unicórnio feliz
Escolha uma pasta
Todos os favoritos
Criar novo
Salvar
Design de camiseta de donut de unicórnio feliz
Pronto para imprimir
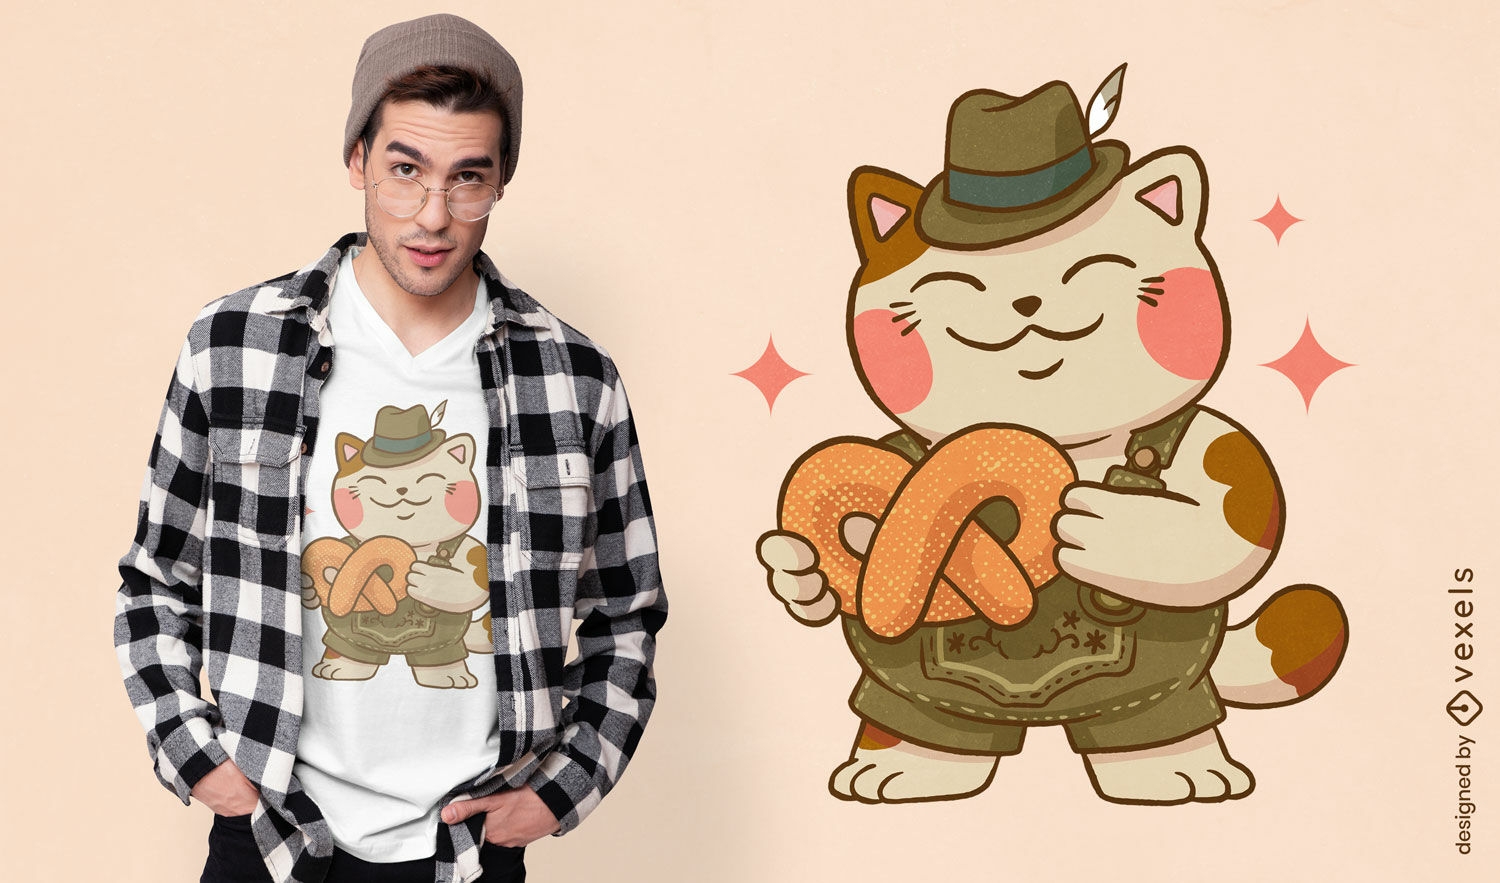
para Merch
Design de camiseta com pretzel de gato da Oktoberfest
Escolha uma pasta
Todos os favoritos
Criar novo
Salvar
Design de camiseta com pretzel de gato da Oktoberfest
texto editável
Pronto para imprimir
para Merch
Design de camiseta psd vintage de suco de maçã
Escolha uma pasta
Todos os favoritos
Criar novo
Salvar
Design de camiseta psd vintage de suco de maçã
texto editável
Pronto para imprimir
para Merch
Design de camiseta psd de lenda de futebol
Escolha uma pasta
Todos os favoritos
Criar novo
Salvar
Design de camiseta psd de lenda de futebol
texto editável
Pronto para imprimir
para Merch
Design de camiseta de livros de falcão
Escolha uma pasta
Todos os favoritos
Criar novo
Salvar
Design de camiseta de livros de falcão
texto editável
Pronto para imprimir
para Merch
Peixe americano orgulhoso e design de camiseta psd de bandeira
Escolha uma pasta
Todos os favoritos
Criar novo
Salvar
Peixe americano orgulhoso e design de camiseta psd de bandeira
Pronto para imprimir
para Merch
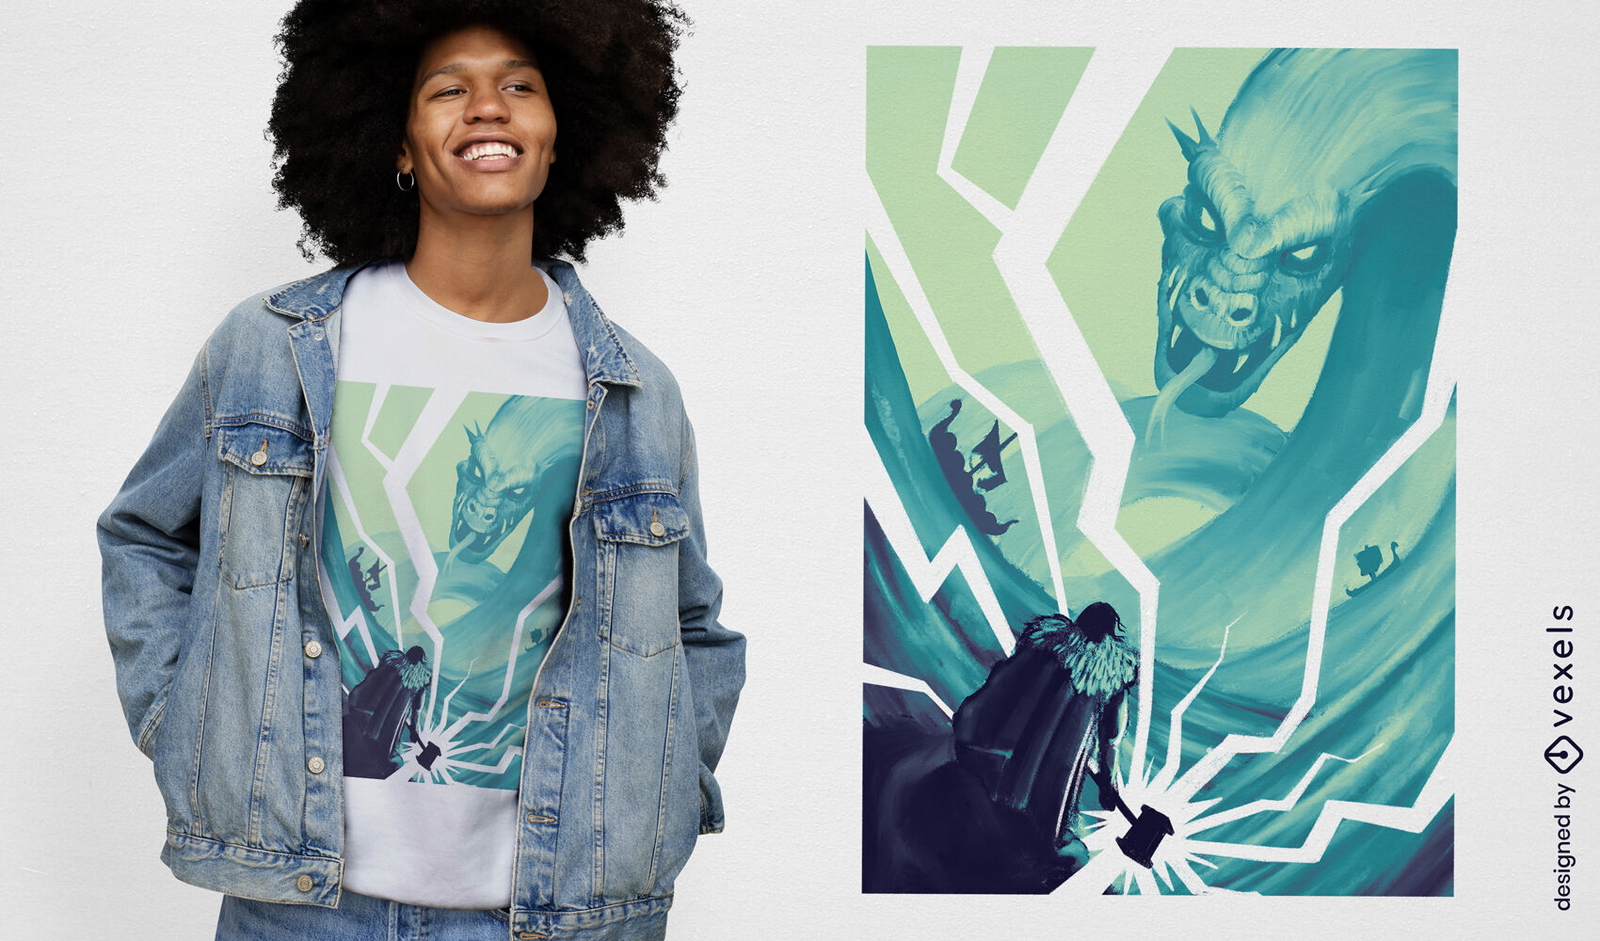
Design de camiseta épica Viking e monstro
Escolha uma pasta
Todos os favoritos
Criar novo
Salvar
Design de camiseta épica Viking e monstro
texto editável
Pronto para imprimir
para Merch
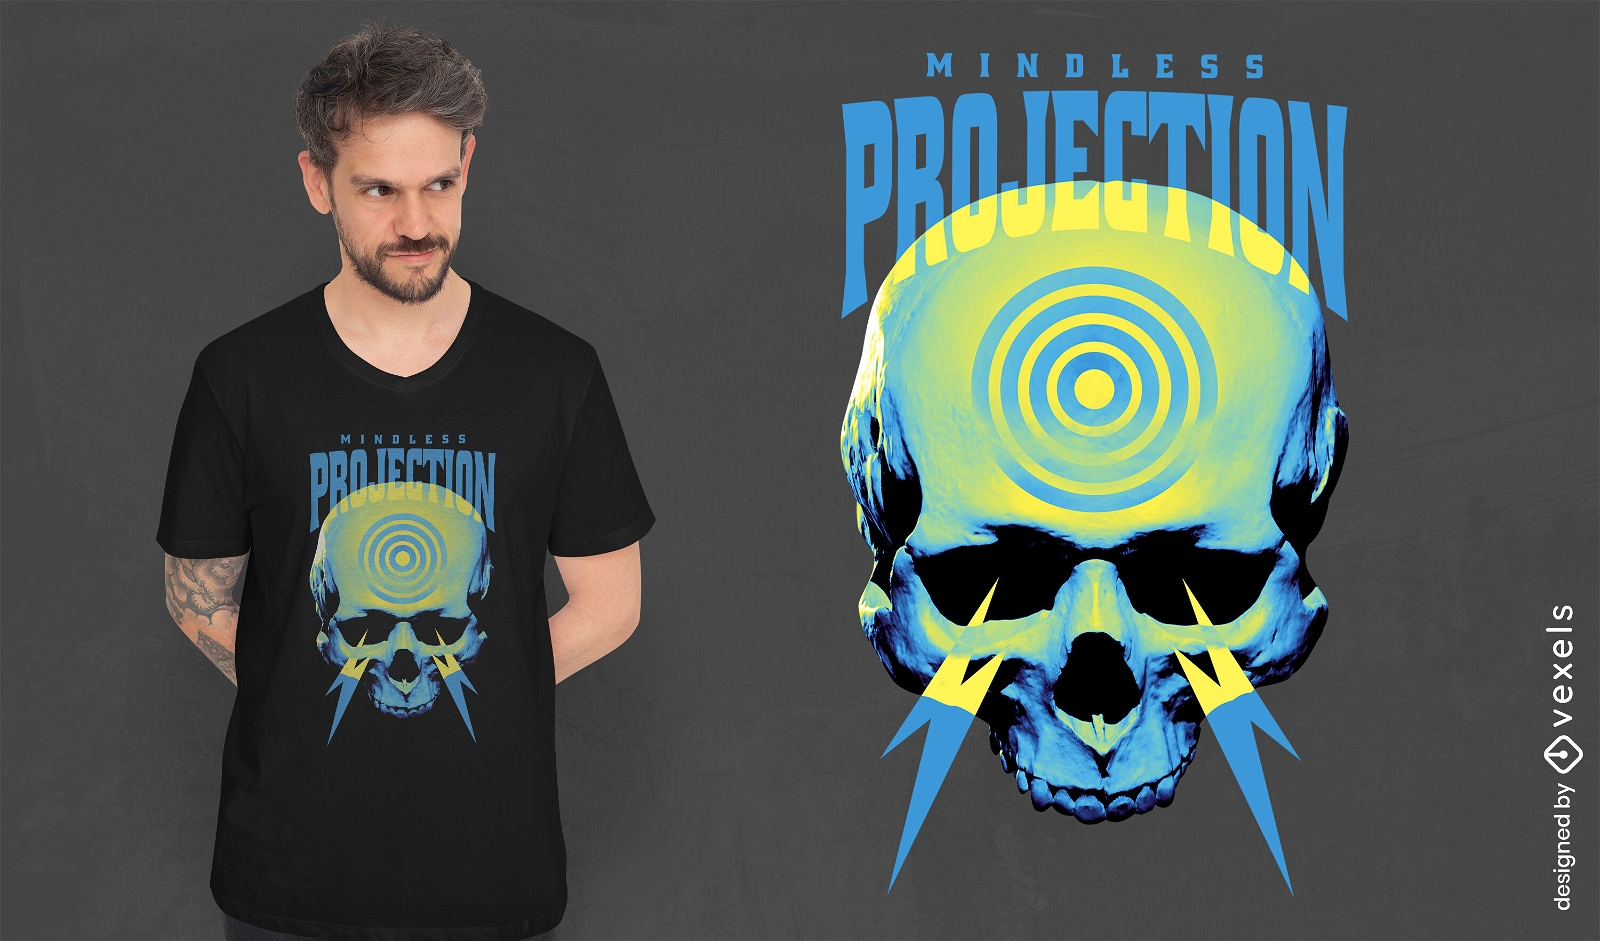
Design de camiseta de mente de caveira psd
Escolha uma pasta
Todos os favoritos
Criar novo
Salvar
Design de camiseta de mente de caveira psd
Impulsione seu negócio
Com a plataforma gráfica líder de mercado.
Ver planos
Próxima
do 67
prev page
next page