Biblioteca de design
Novos designs Merch
Camisetas
Vectores
Designs de Merch de Tendência
PNGs & SVGs
Mockups
Modelos de T-Shirt PSD
Explorar Desenhos
Designs KDP
Pôsteres
Canecas
Capas para celular
Sacos de compras
Almofadas
Ferramentas de desenho
Merch Designer
Novo!
Mockup Generator
Gerador de Design de AI
Vetorizador
Quote Generator
T-Shirt Maker (Antigo)
Ajuda
Merch Digest
Blog
Centro de Ajuda
Saiba mais sobre o Merch
Feedback
Soluções Corporativas
Empresa
Acesso à API
Estúdio de Design
Design em Lote
Preços
Carregando...
Inscrever-se
Conecte-se
PSD Templates
graficos
Biblioteca de design
Novos designs Merch
Camisetas
Vectores
Designs de Merch de Tendência
PNGs & SVGs
Mockups
Modelos de T-Shirt PSD
Explorar Desenhos
Designs KDP
Pôsteres
Canecas
Capas para celular
Sacos de compras
Almofadas
Ferramentas de desenho
Merch Designer
Novo!
Mockup Generator
Gerador de Design de AI
Vetorizador
Quote Generator
T-Shirt Maker (Antigo)
Ajuda
Merch Digest
Blog
Centro de Ajuda
Saiba mais sobre o Merch
Feedback
Soluções Corporativas
Empresa
Acesso à API
Estúdio de Design
Design em Lote
PLANOS
PSD Templates
graficos
3312 Designs de Camisetas e Mockups PSD de graficos
Baixar designs de camisetas ou mockups PSD editáveis de graficos
Relacionado:
graficos vetoriais
,
desenhos graficos de ações
,
graficos tridimensionais
Ordenar por
Mais relevante
Resultados patrocinados da
Ganhe 15% de desconto com o código: VEXELS15
veja mais detalhes
Pronto para imprimir
para Merch
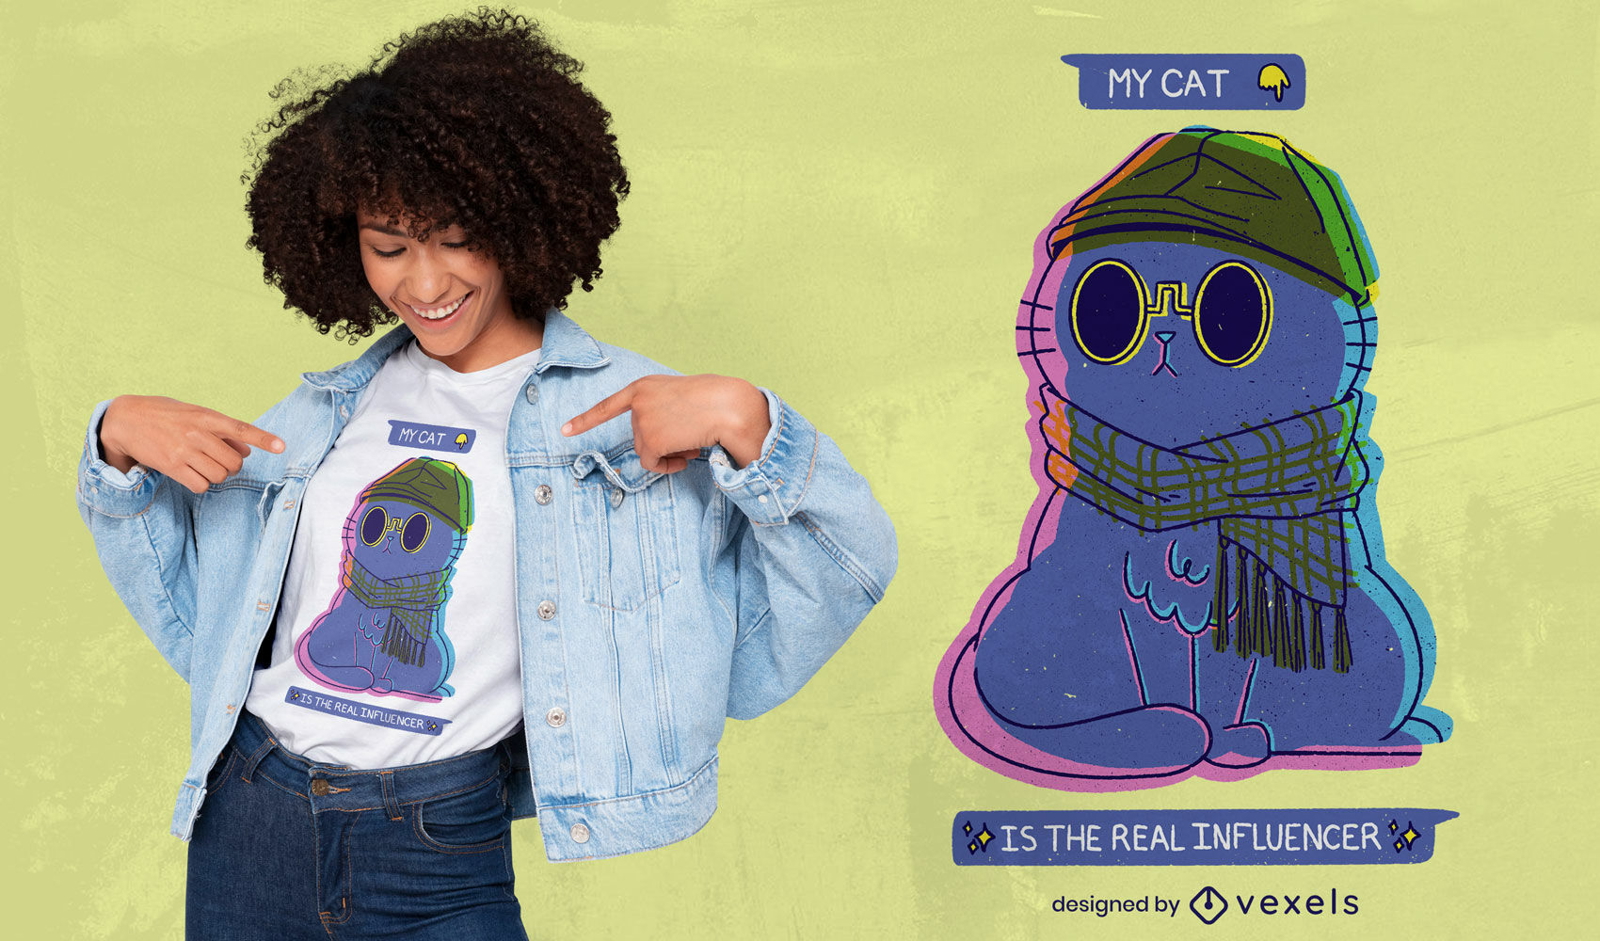
Influenciador desenho animado gato psd t-shirt design
Escolha uma pasta
Todos os favoritos
Criar novo
Salvar
Influenciador desenho animado gato psd t-shirt design
Pronto para imprimir
para Merch
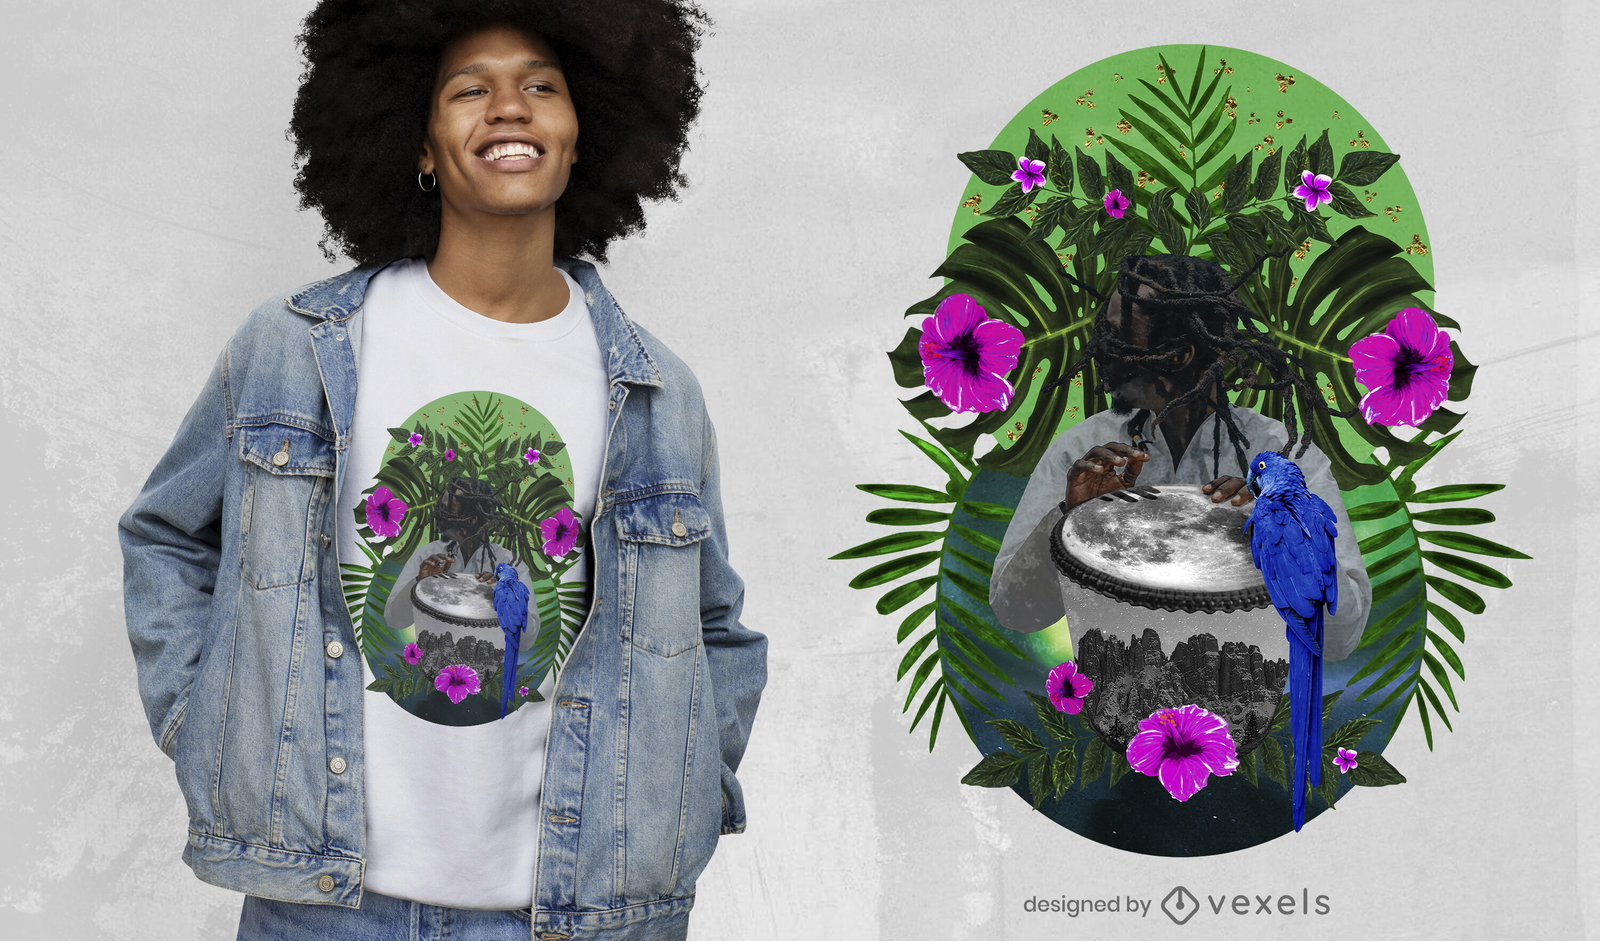
Camiseta de colagem fotográfica de natureza exótica psd
Escolha uma pasta
Todos os favoritos
Criar novo
Salvar
Camiseta de colagem fotográfica de natureza exótica psd
Pronto para imprimir
para Merch
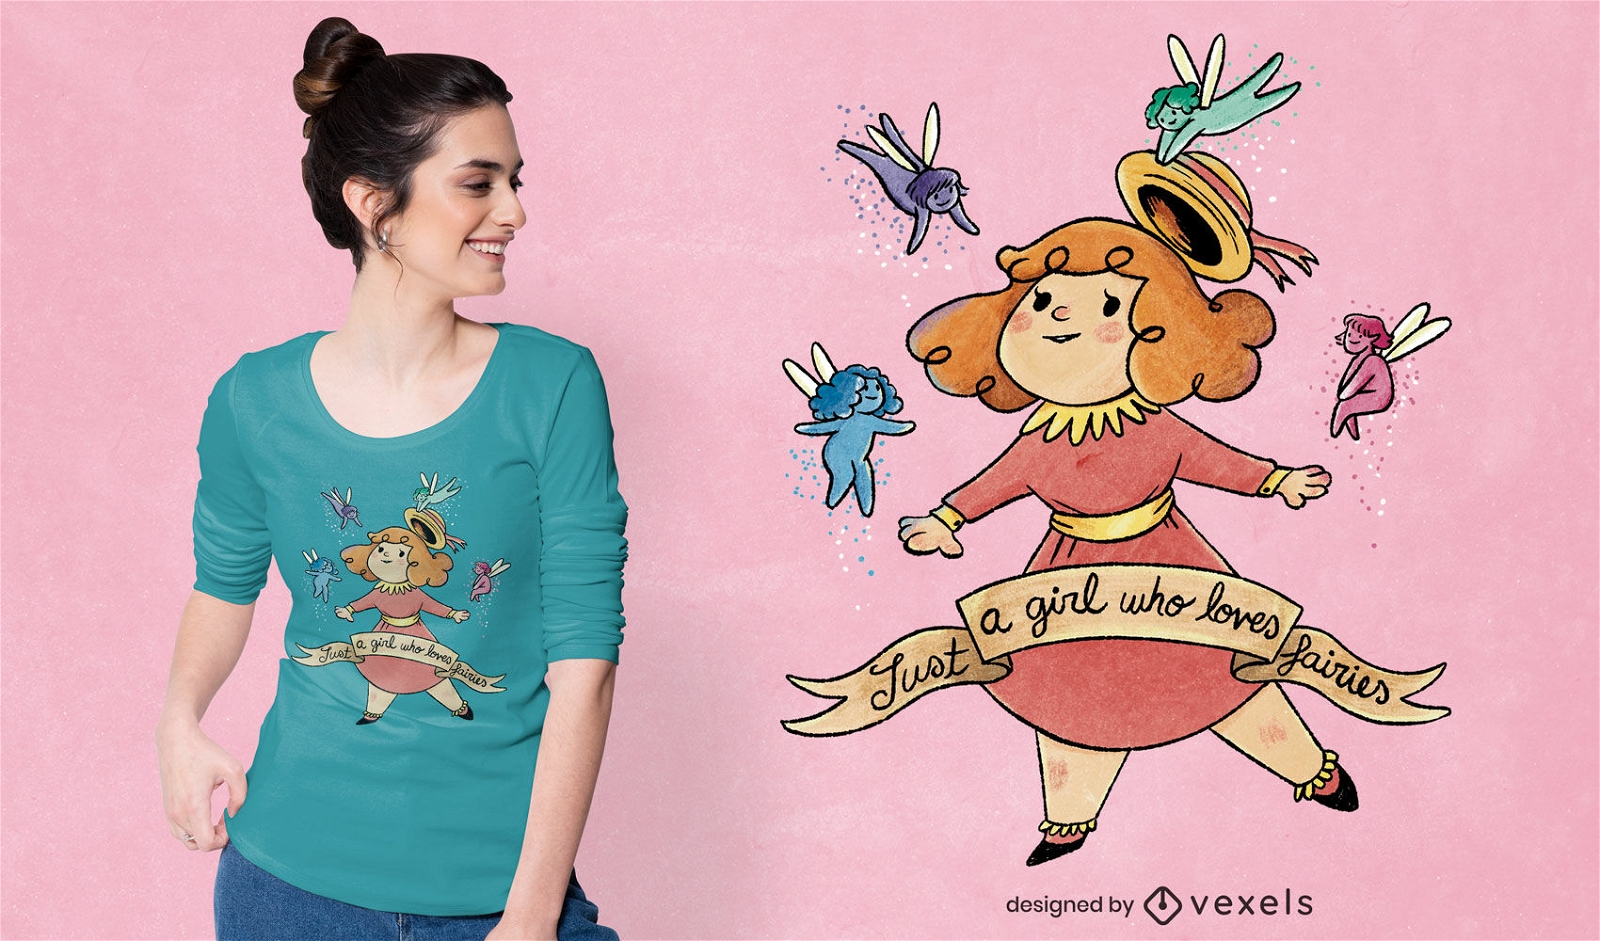
T-shirt de fantasia de menina e fadas doodle psd
Escolha uma pasta
Todos os favoritos
Criar novo
Salvar
T-shirt de fantasia de menina e fadas doodle psd
Pronto para imprimir
para Merch
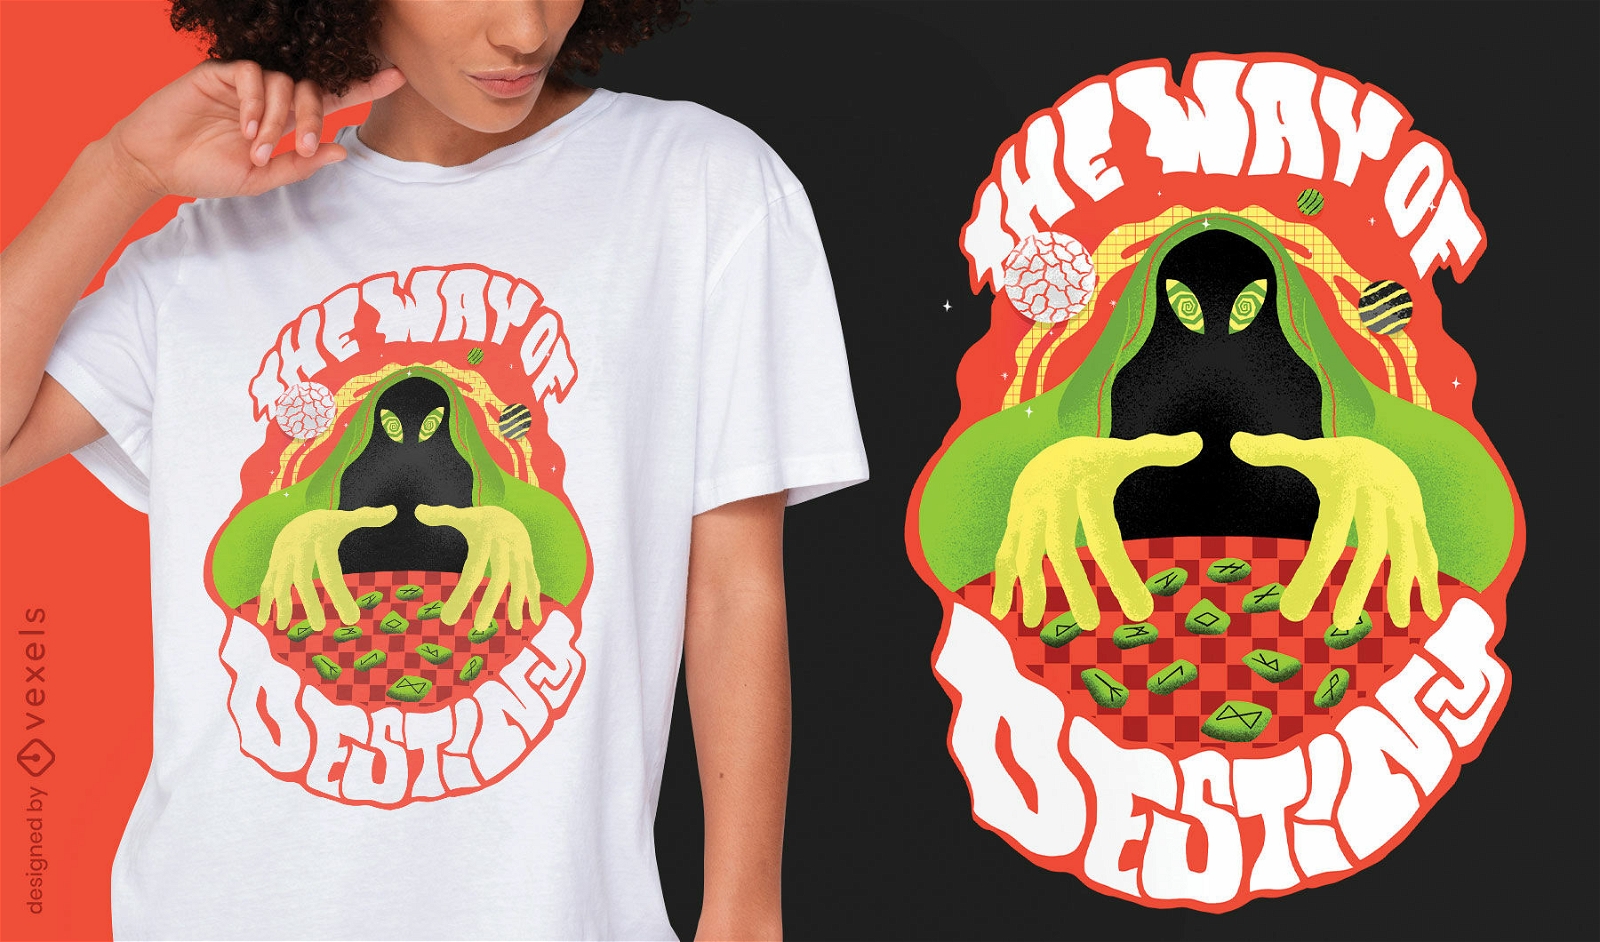
O caminho do destino trippy psd t-shirt design
Escolha uma pasta
Todos os favoritos
Criar novo
Salvar
O caminho do destino trippy psd t-shirt design
Pronto para imprimir
para Merch
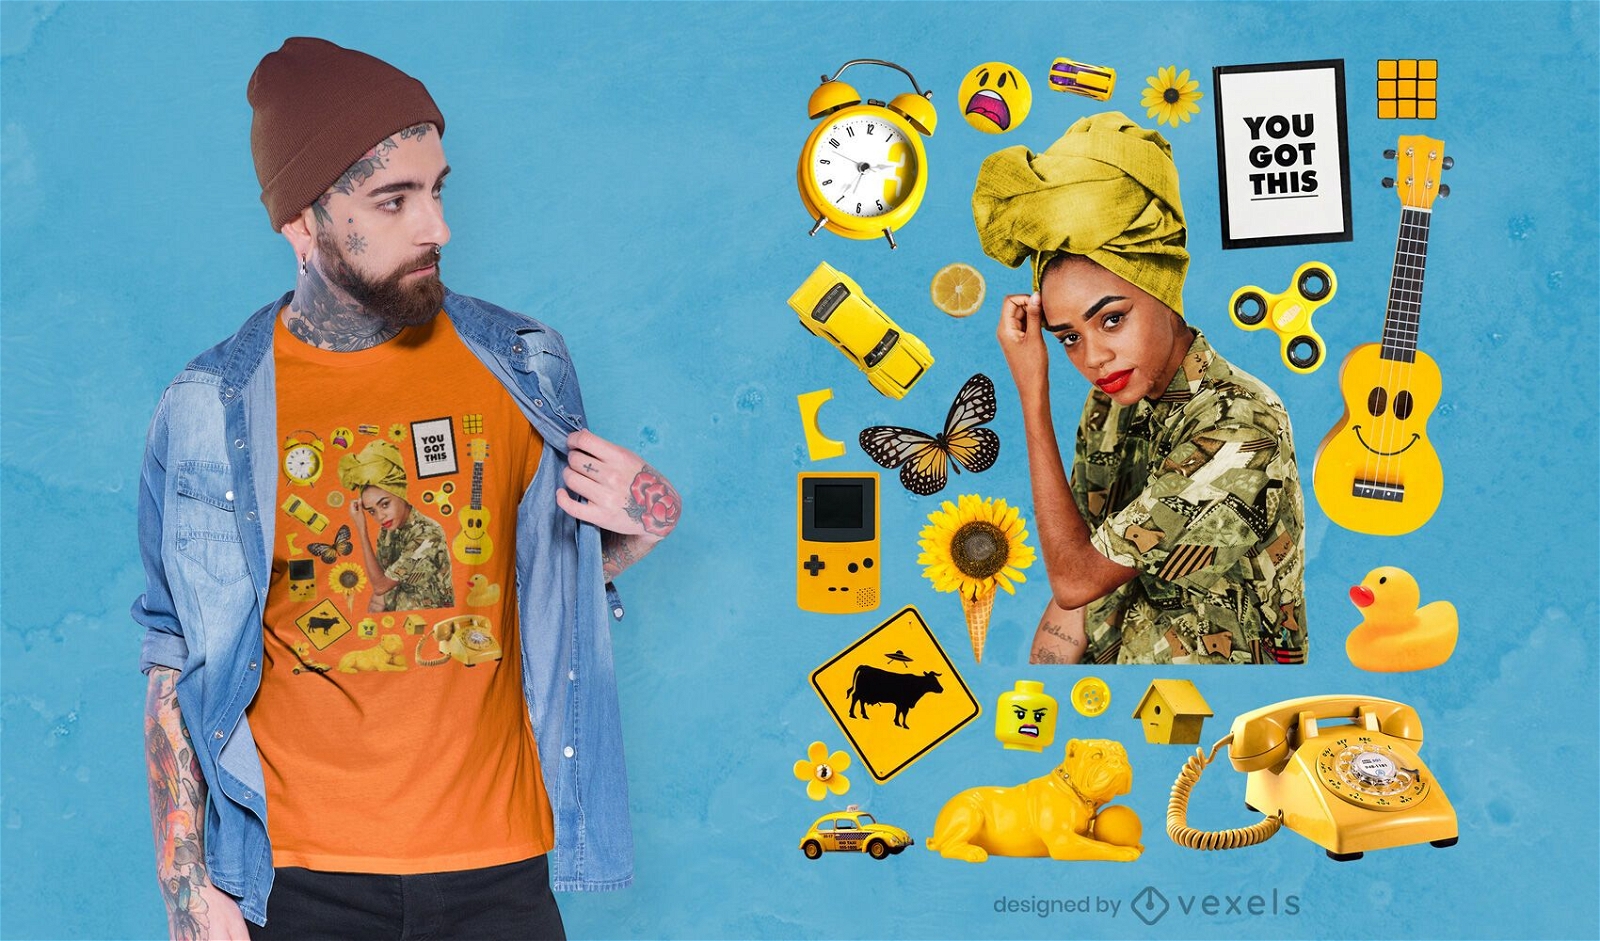
T-shirt psd com elementos amarelos
Escolha uma pasta
Todos os favoritos
Criar novo
Salvar
T-shirt psd com elementos amarelos
PSD Mockup
para Merch
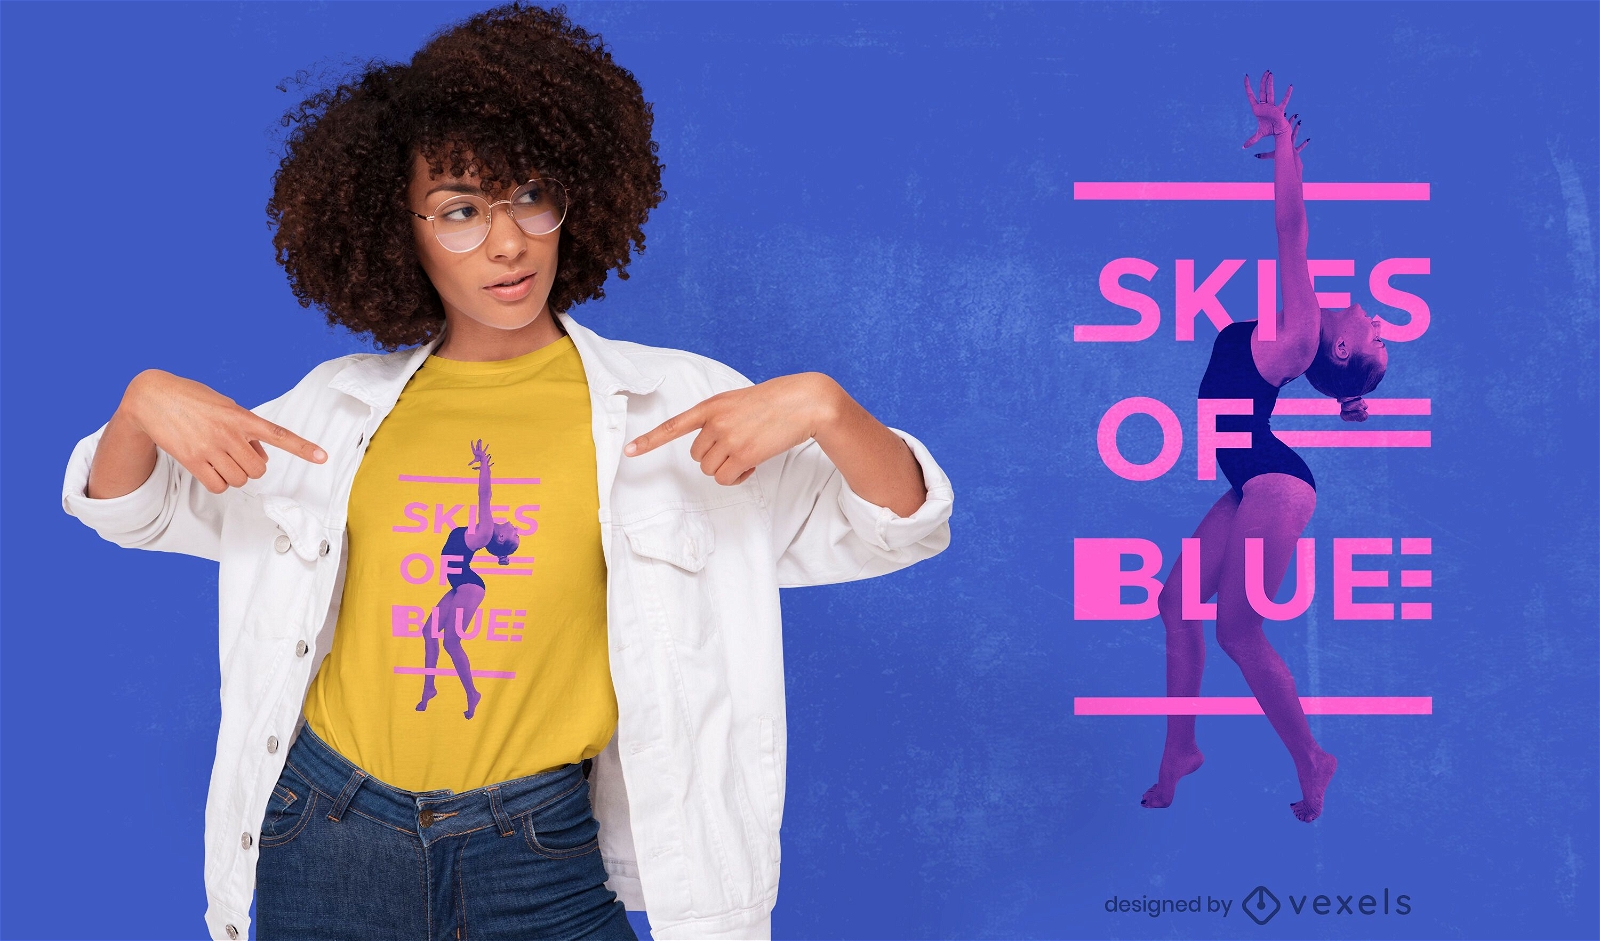
Design de t-shirt PSD com frase de ginasta
Escolha uma pasta
Todos os favoritos
Criar novo
Salvar
Design de t-shirt PSD com frase de ginasta
Camiseta PSD escalável
para Merch
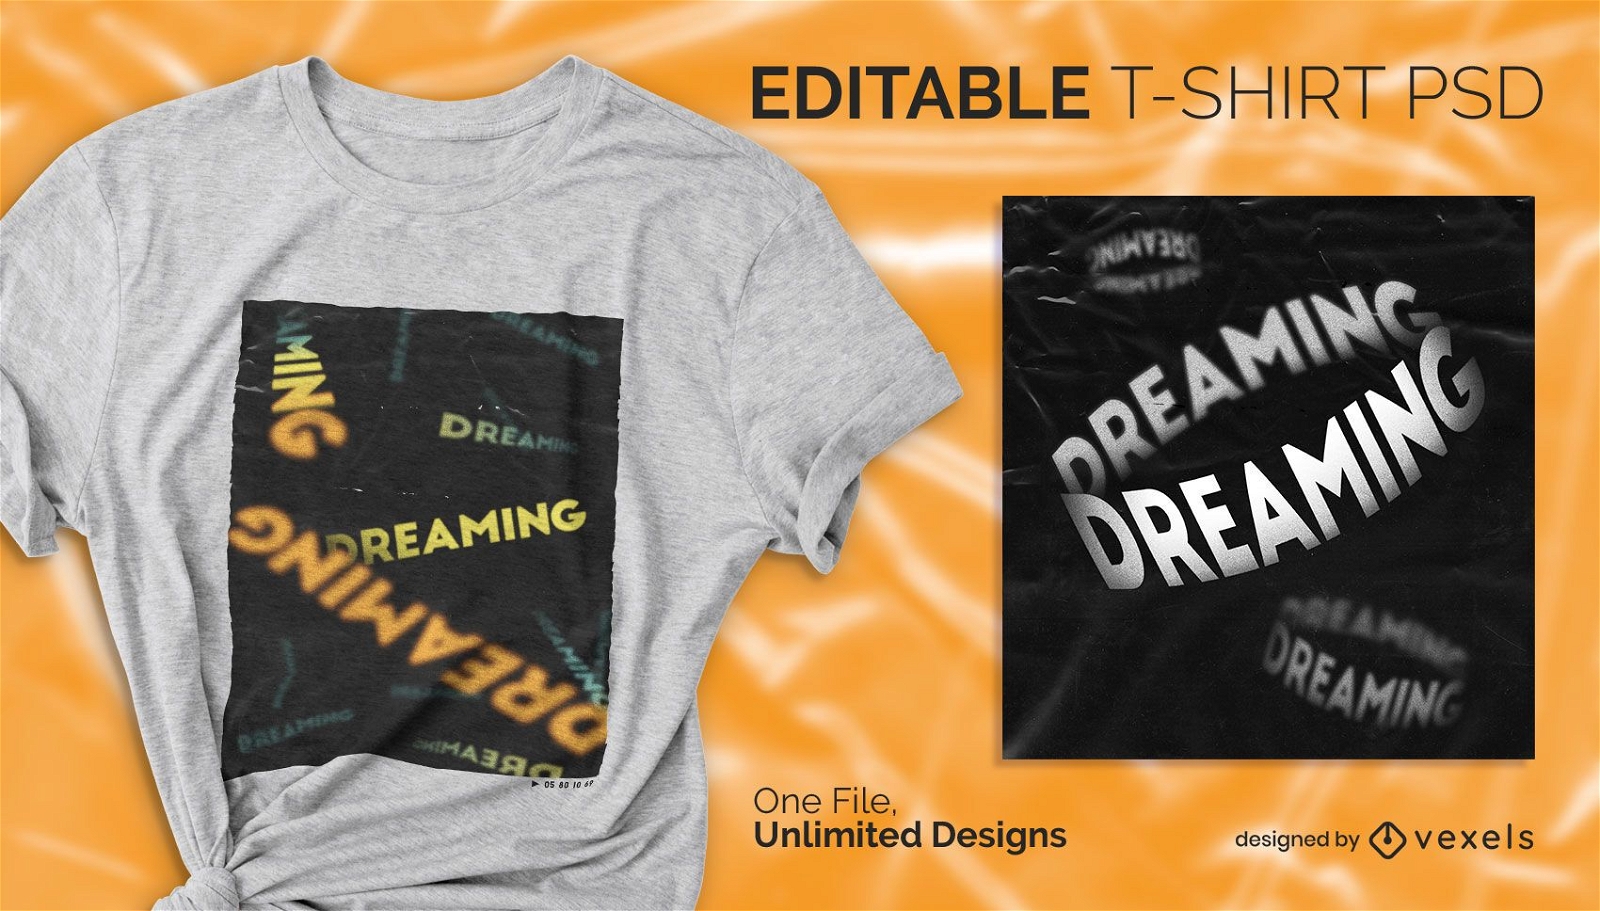
T-shirt escalável com texto decrescente psd
Escolha uma pasta
Todos os favoritos
Criar novo
Salvar
T-shirt escalável com texto decrescente psd
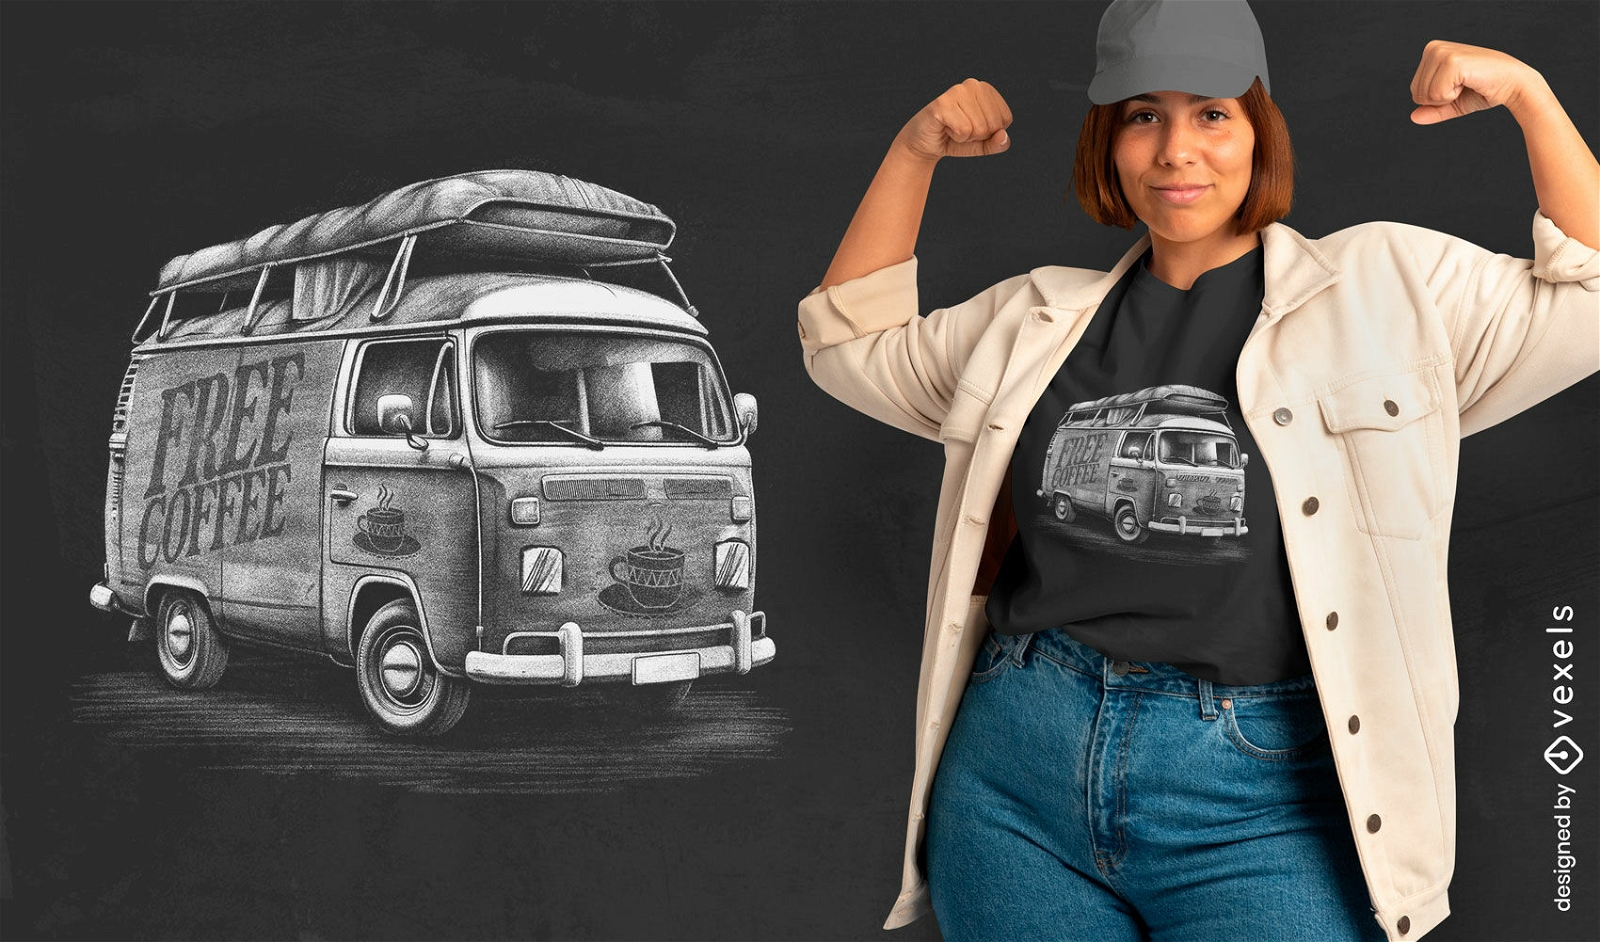
Gerado por IA, selecionado por nossos designers.
para Merch
Design de van vintage e camiseta de caf?
Escolha uma pasta
Todos os favoritos
Criar novo
Salvar
Design de van vintage e camiseta de caf?
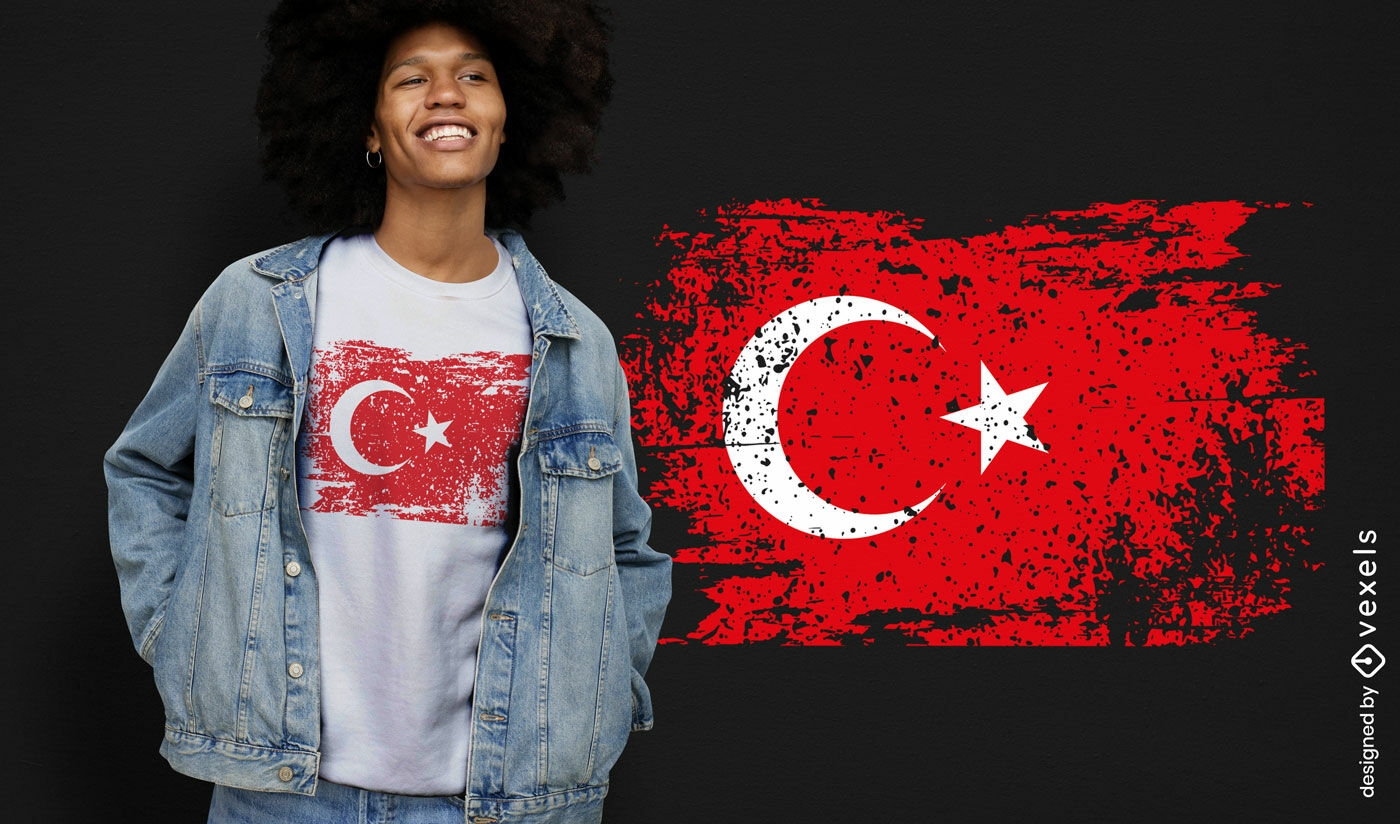
Pronto para imprimir
para Merch
Design de camiseta grunge com bandeira turca
Escolha uma pasta
Todos os favoritos
Criar novo
Salvar
Design de camiseta grunge com bandeira turca
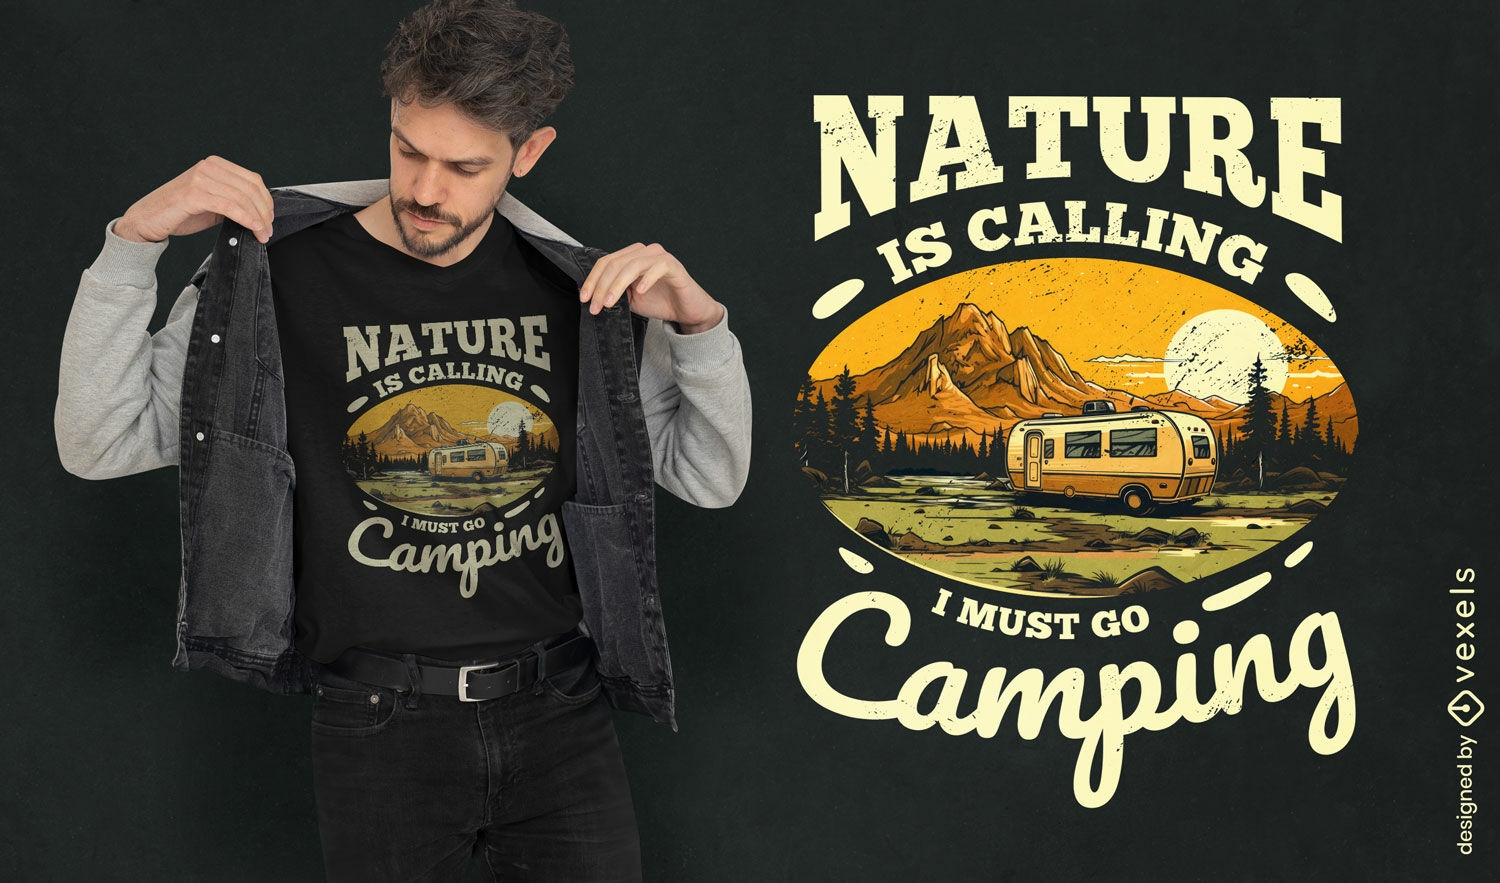
Gerado por IA, selecionado por nossos designers.
para Merch
Design de camiseta para acampamento chamado da natureza
Escolha uma pasta
Todos os favoritos
Criar novo
Salvar
Design de camiseta para acampamento chamado da natureza
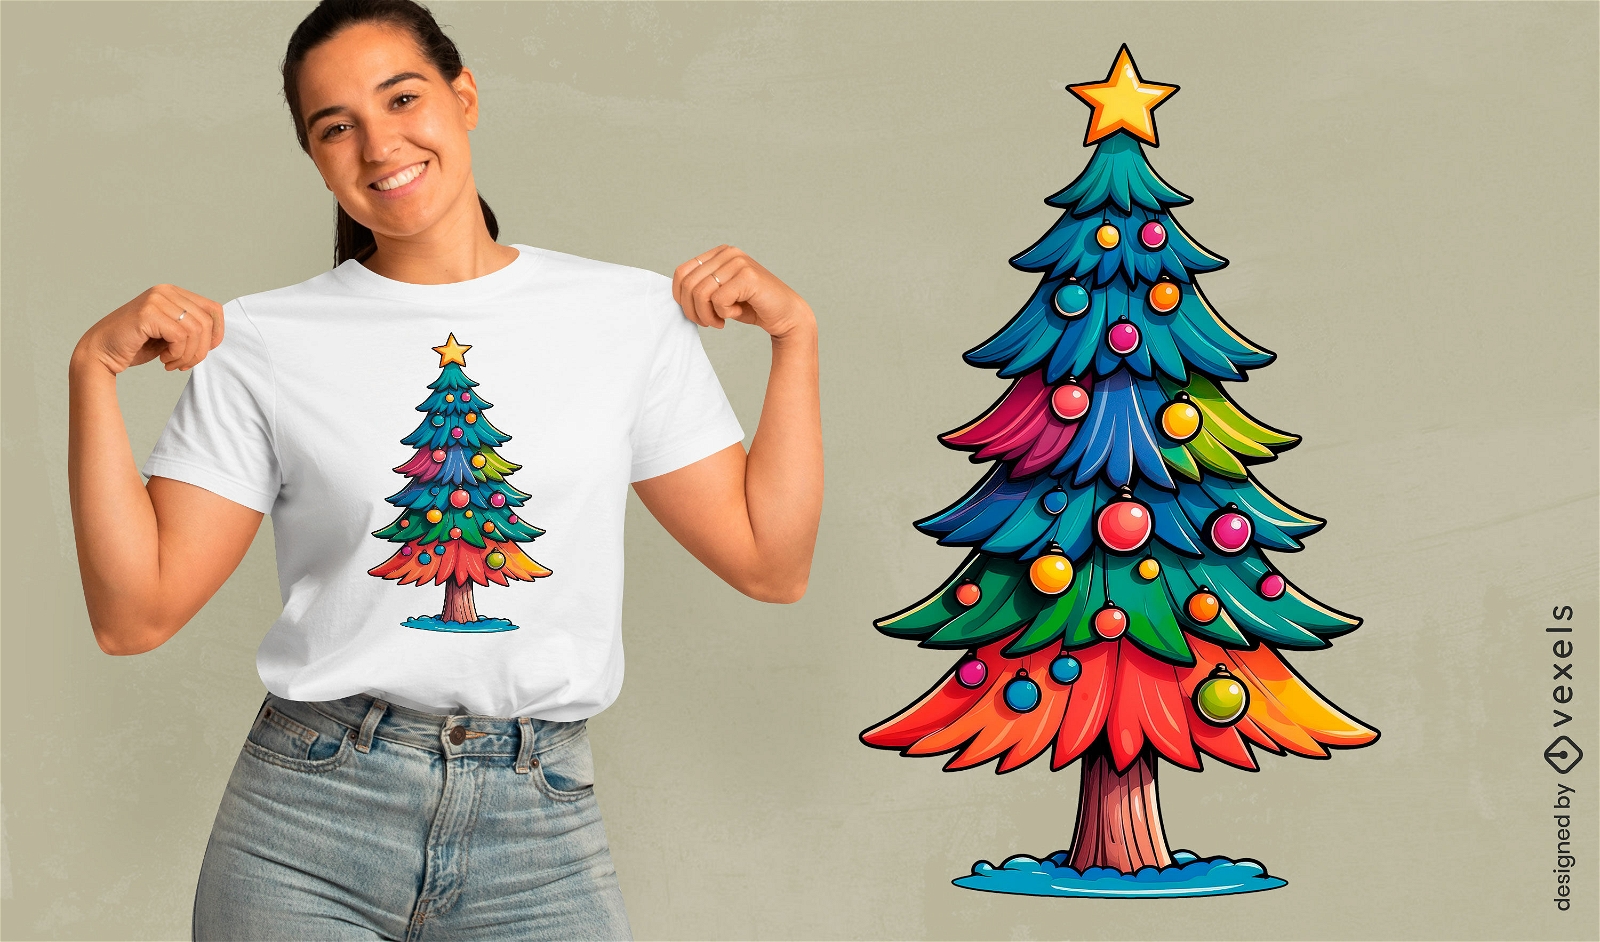
Pronto para imprimir
para Merch
Design festivo de camiseta com ?rvore de Natal
Escolha uma pasta
Todos os favoritos
Criar novo
Salvar
Design festivo de camiseta com ?rvore de Natal
Gerado por IA, selecionado por nossos designers.
para Merch
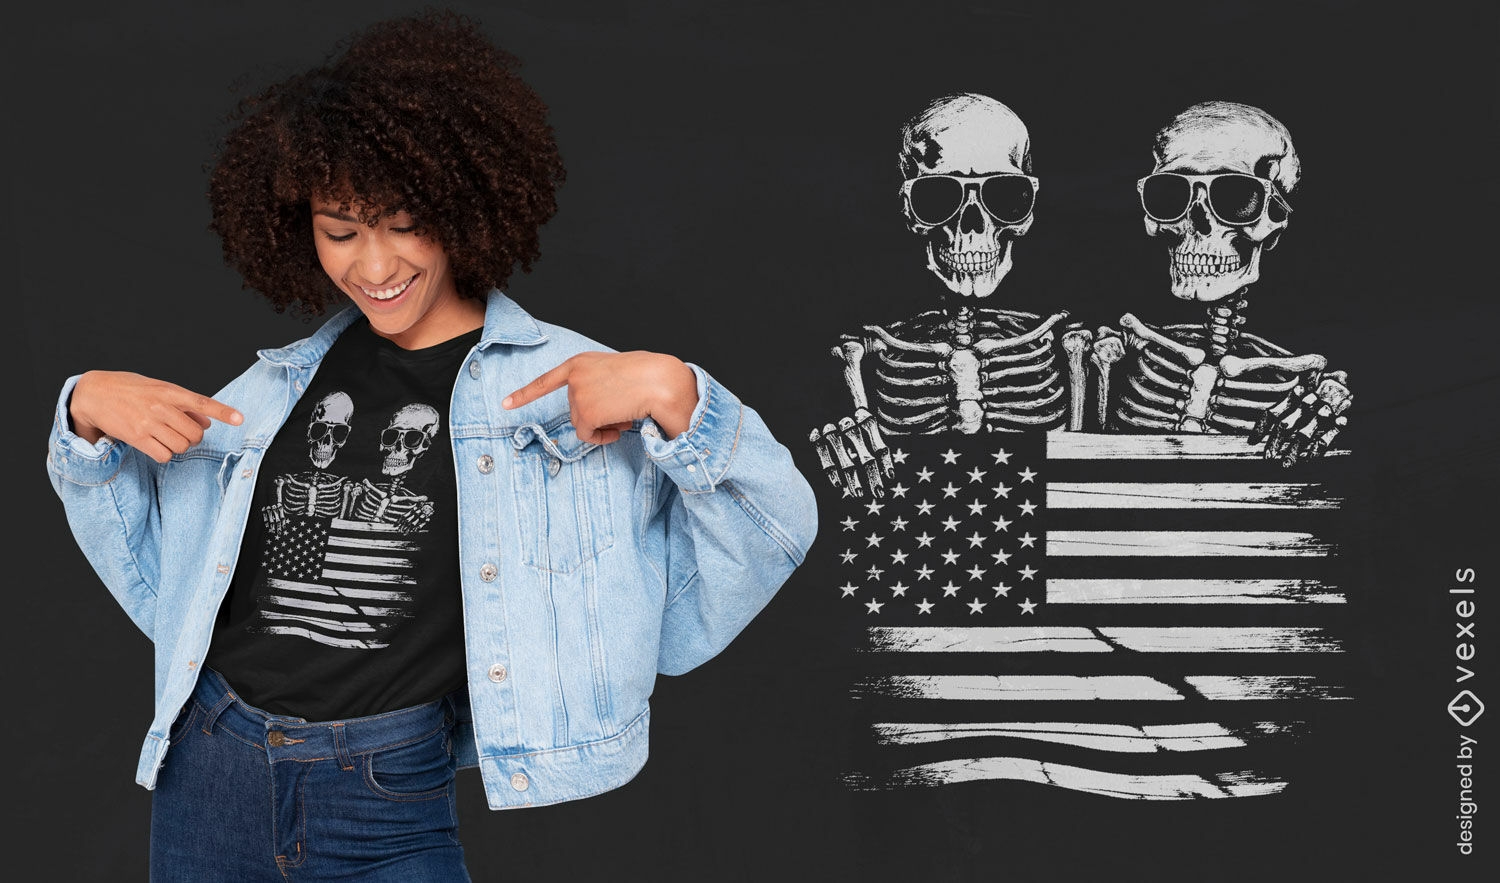
Esqueletos com design de camiseta com bandeira americana
Escolha uma pasta
Todos os favoritos
Criar novo
Salvar
Esqueletos com design de camiseta com bandeira americana
Gerado por IA, selecionado por nossos designers.
para Merch
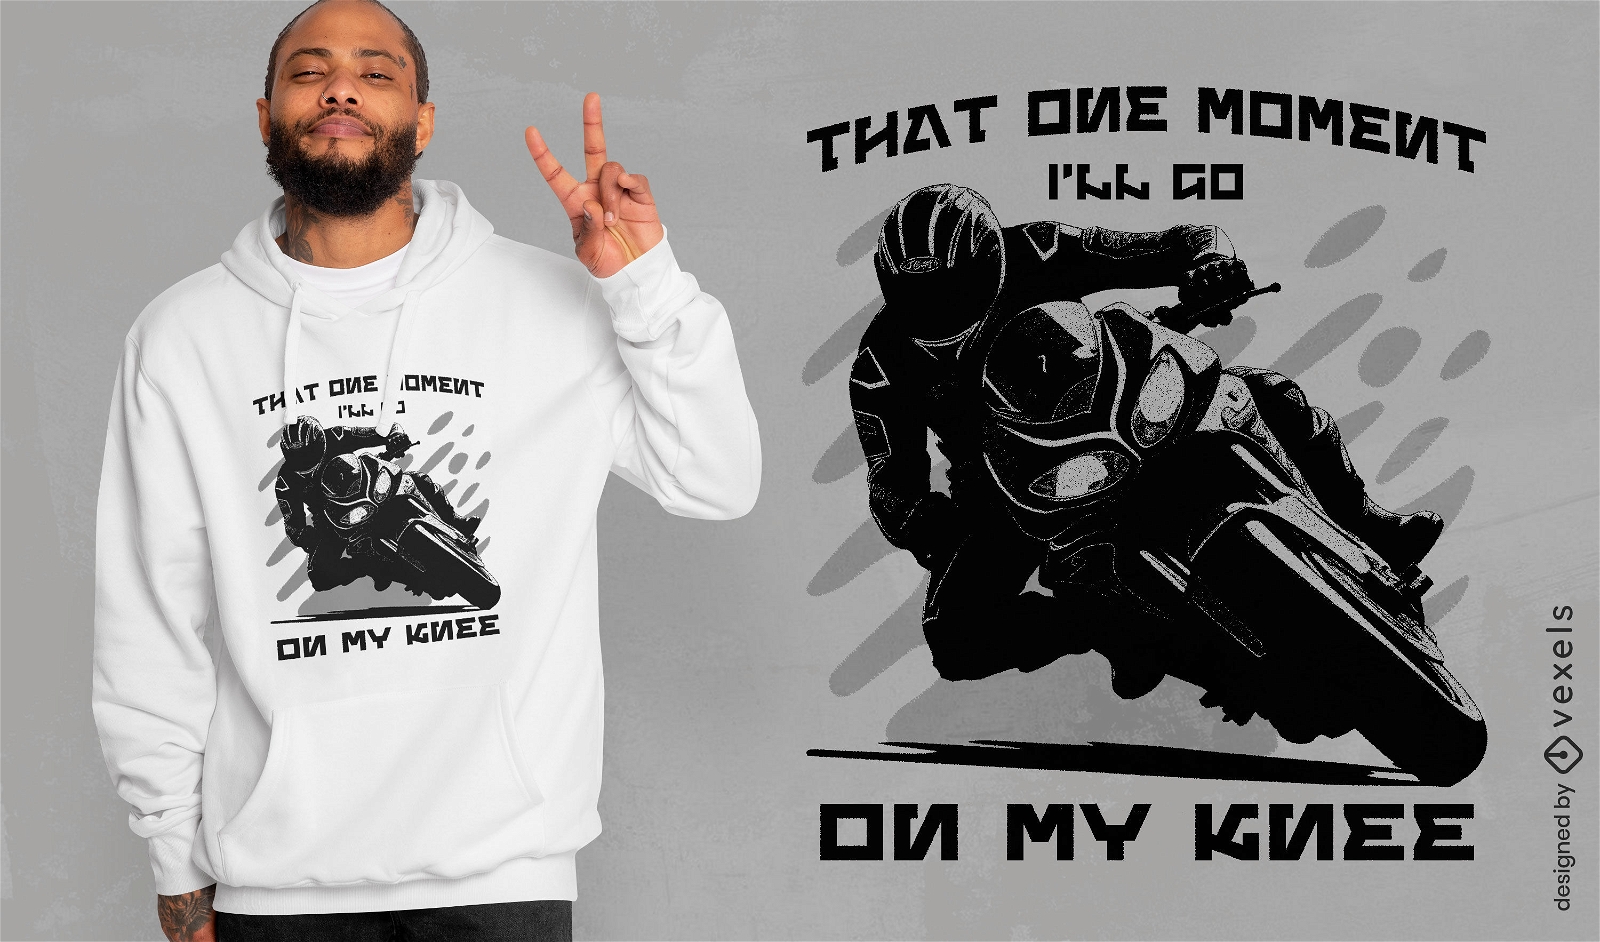
Design de camiseta para moto com joelho para baixo
Escolha uma pasta
Todos os favoritos
Criar novo
Salvar
Design de camiseta para moto com joelho para baixo
Gerado por IA, selecionado por nossos designers.
para Merch
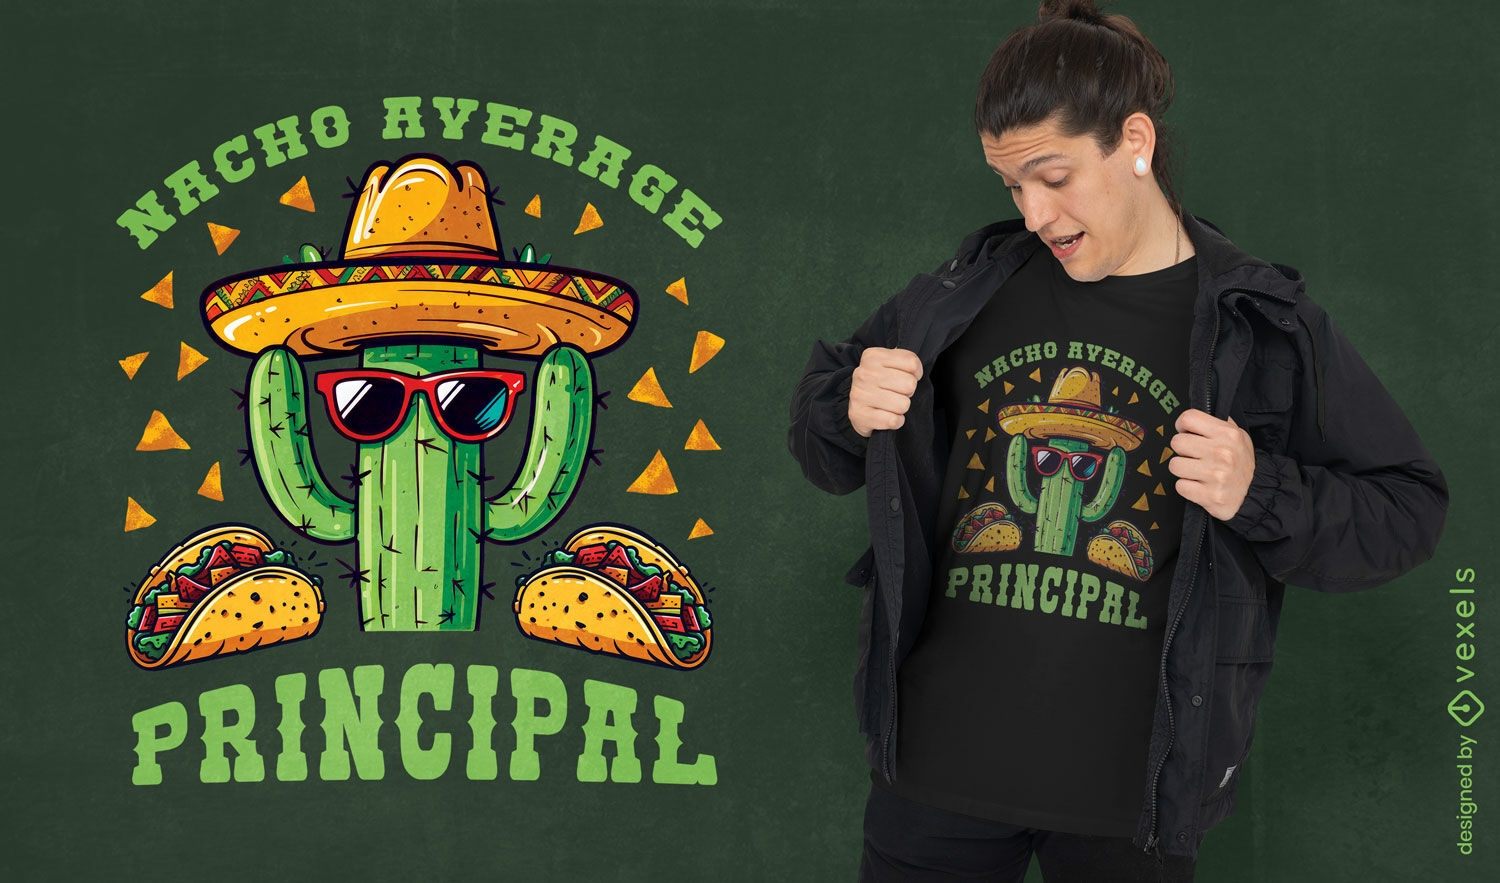
Design de camiseta de cacto mexicano
Escolha uma pasta
Todos os favoritos
Criar novo
Salvar
Design de camiseta de cacto mexicano
Gerado por IA, selecionado por nossos designers.
para Merch
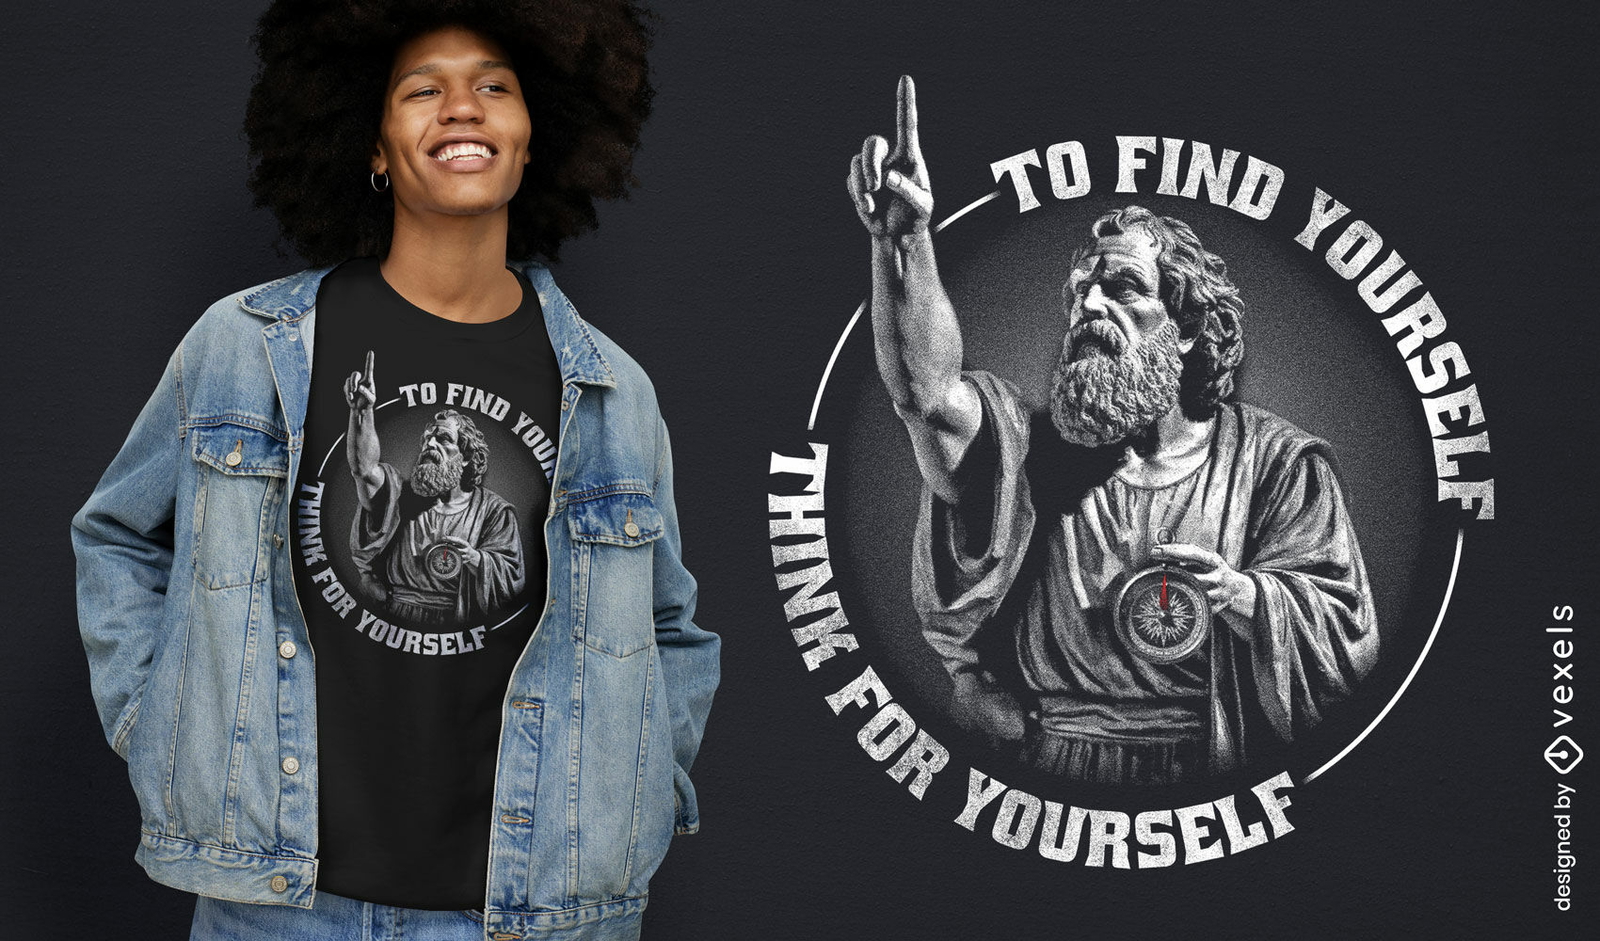
Design de camiseta com cita??o da sabedoria de Sócrates
Escolha uma pasta
Todos os favoritos
Criar novo
Salvar
Design de camiseta com cita??o da sabedoria de Sócrates
Gerado por IA, selecionado por nossos designers.
para Merch
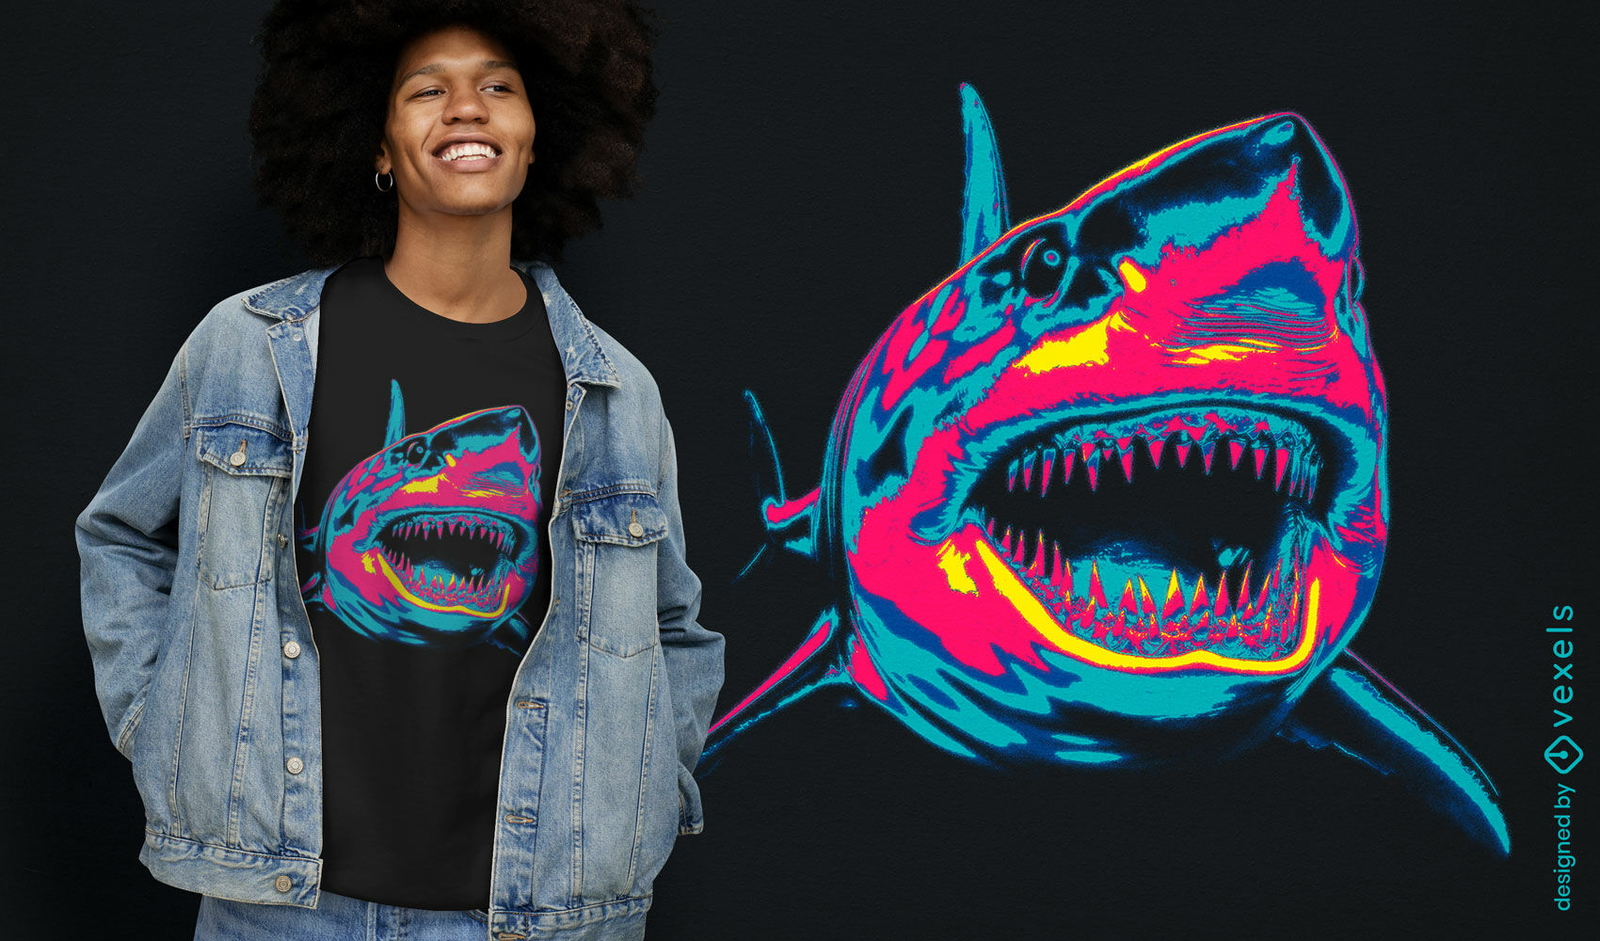
Design de camiseta de tubar?o neon
Escolha uma pasta
Todos os favoritos
Criar novo
Salvar
Design de camiseta de tubar?o neon
Pronto para imprimir
para Merch
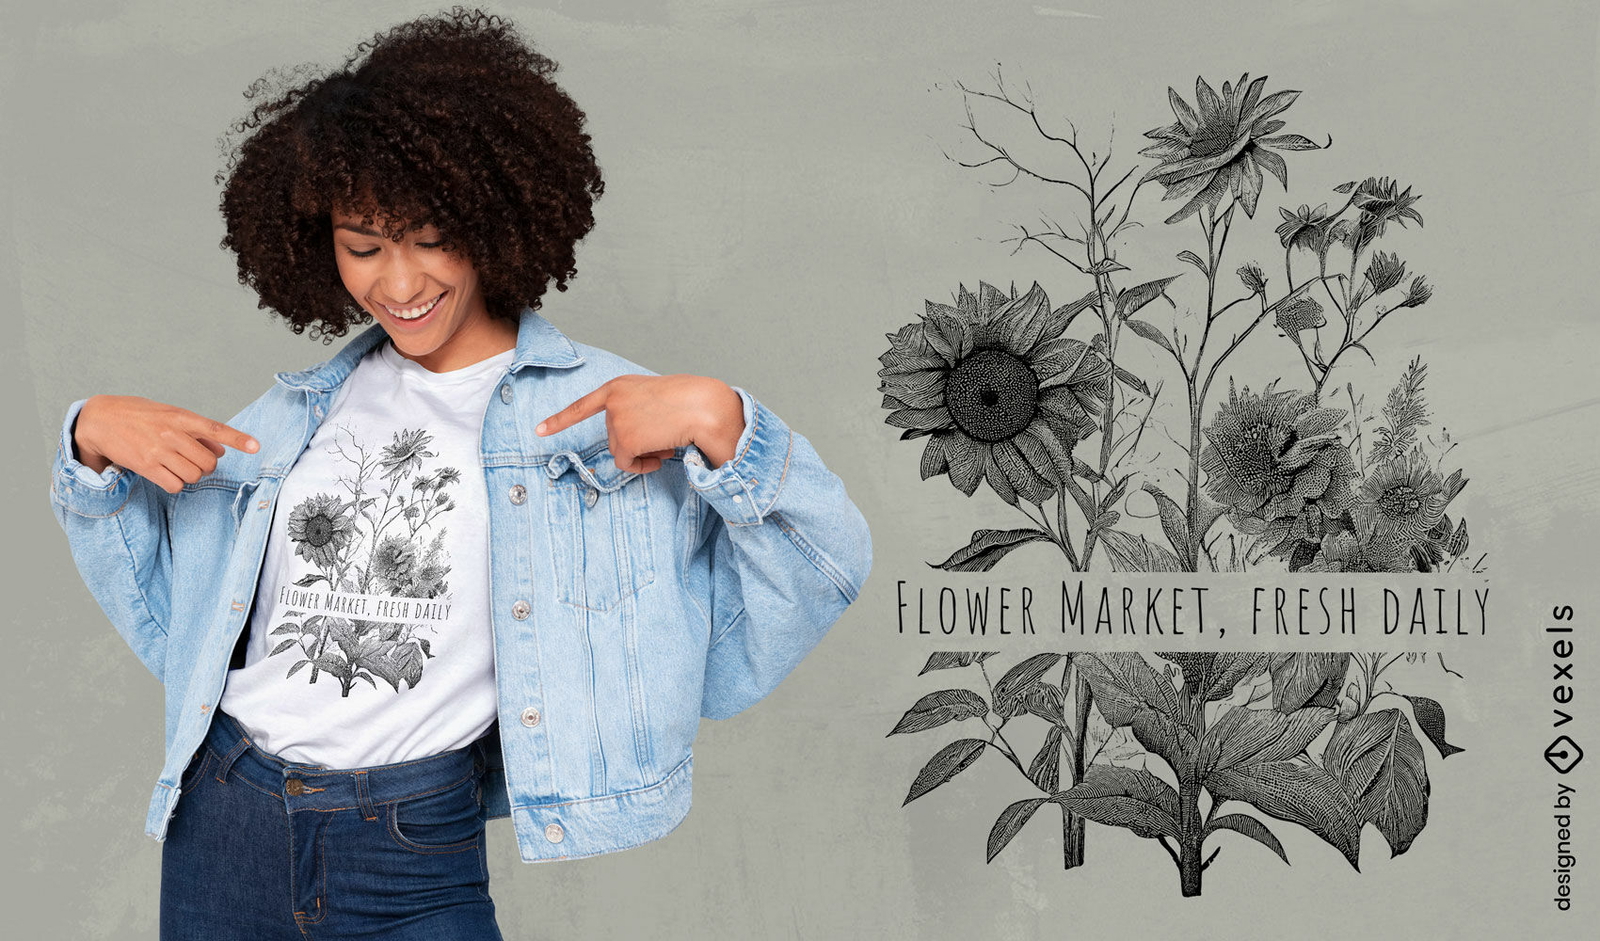
Design de camiseta do mercado de flores botânicas
Escolha uma pasta
Todos os favoritos
Criar novo
Salvar
Design de camiseta do mercado de flores botânicas
Pronto para imprimir
para Merch
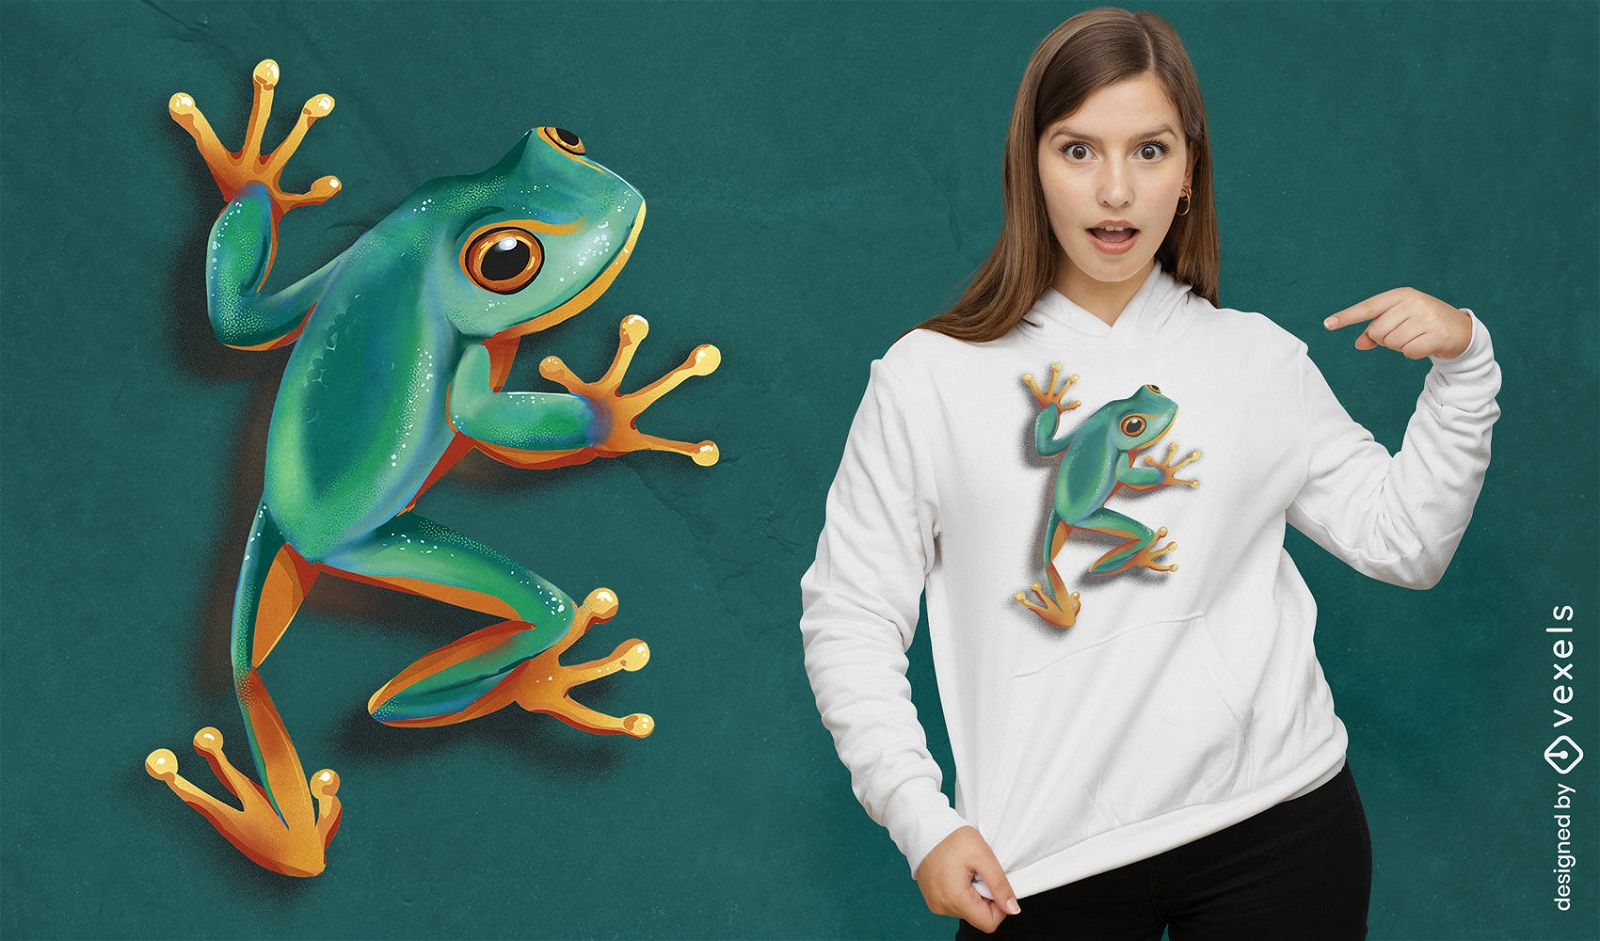
Design realista de camiseta sapo verde
Escolha uma pasta
Todos os favoritos
Criar novo
Salvar
Design realista de camiseta sapo verde
Pronto para imprimir
para Merch
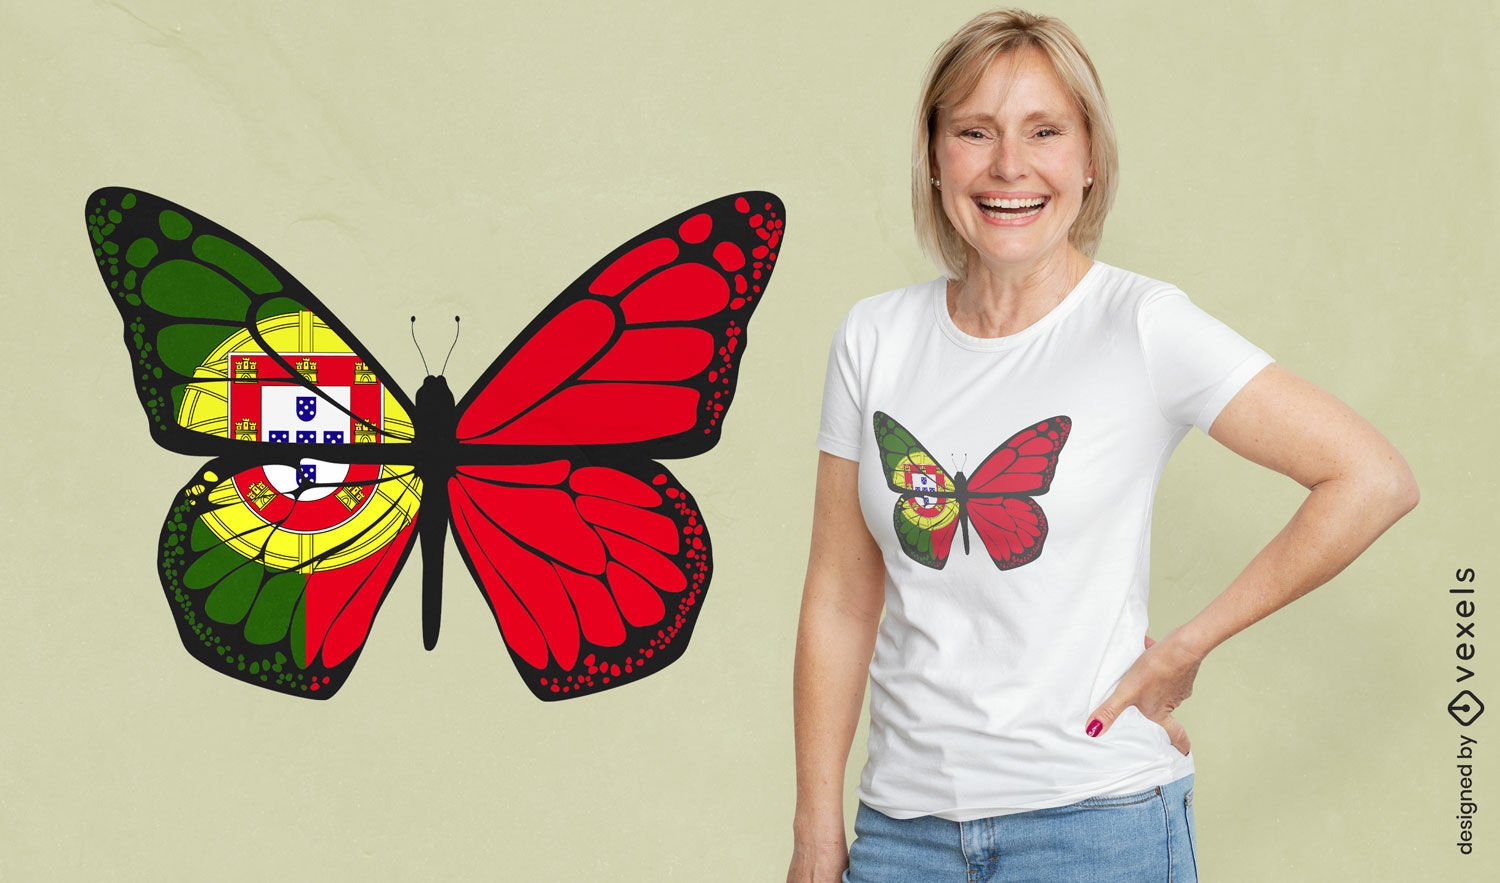
Design de camiseta borboleta de Portugal
Escolha uma pasta
Todos os favoritos
Criar novo
Salvar
Design de camiseta borboleta de Portugal
Pronto para imprimir
para Merch
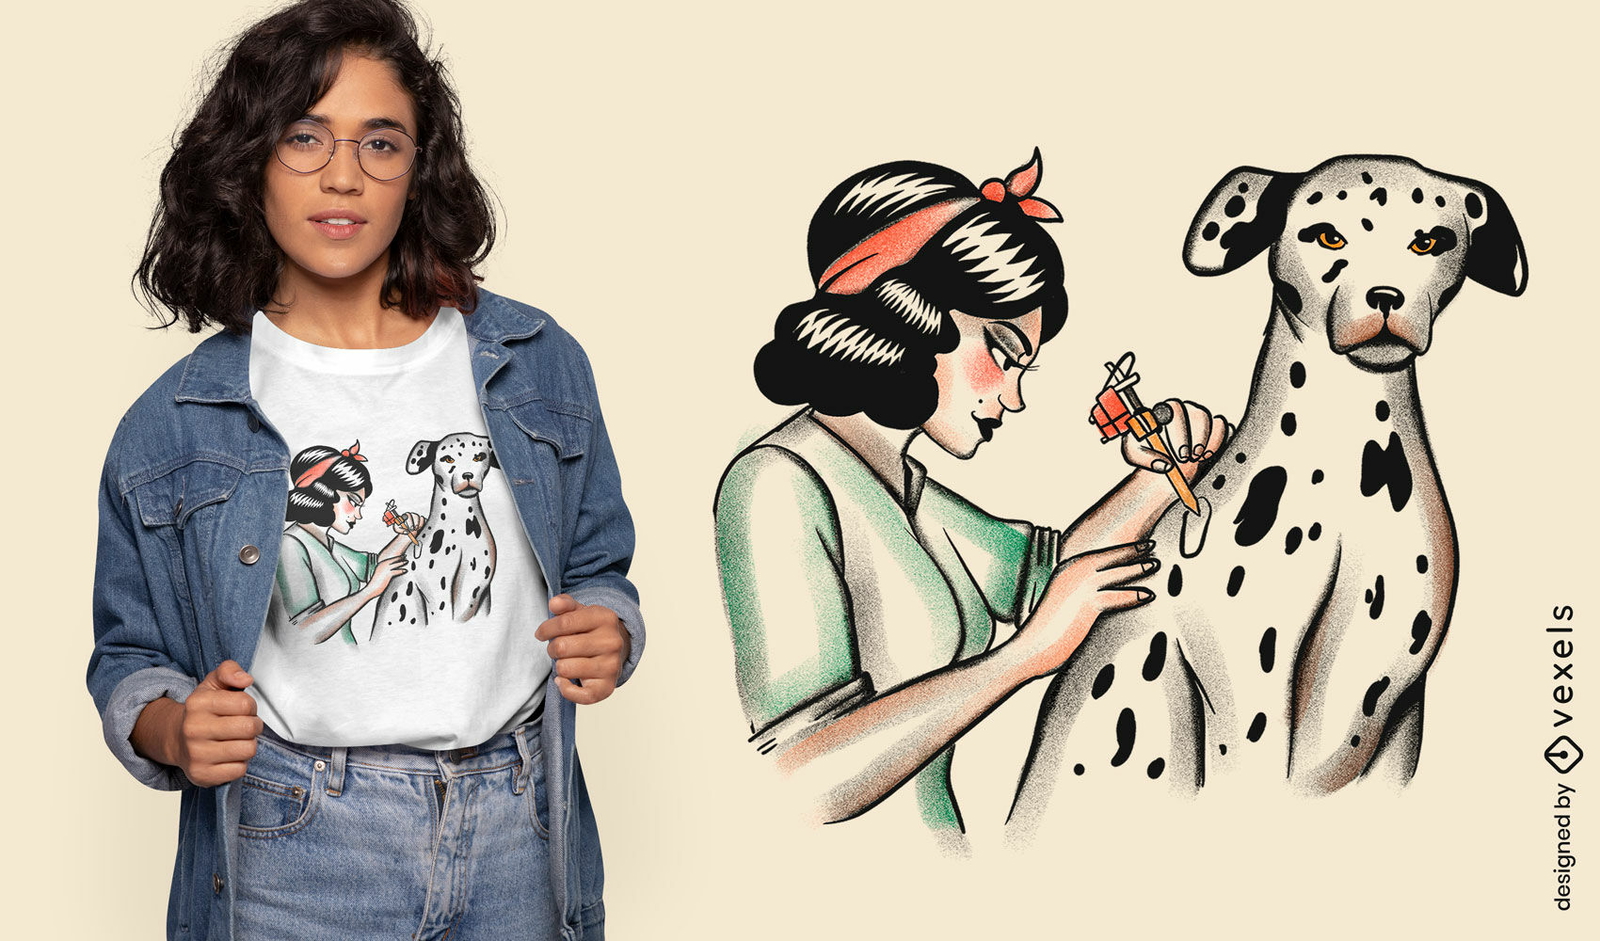
Design de camiseta feminina com tatuagem dálmata
Escolha uma pasta
Todos os favoritos
Criar novo
Salvar
Design de camiseta feminina com tatuagem dálmata
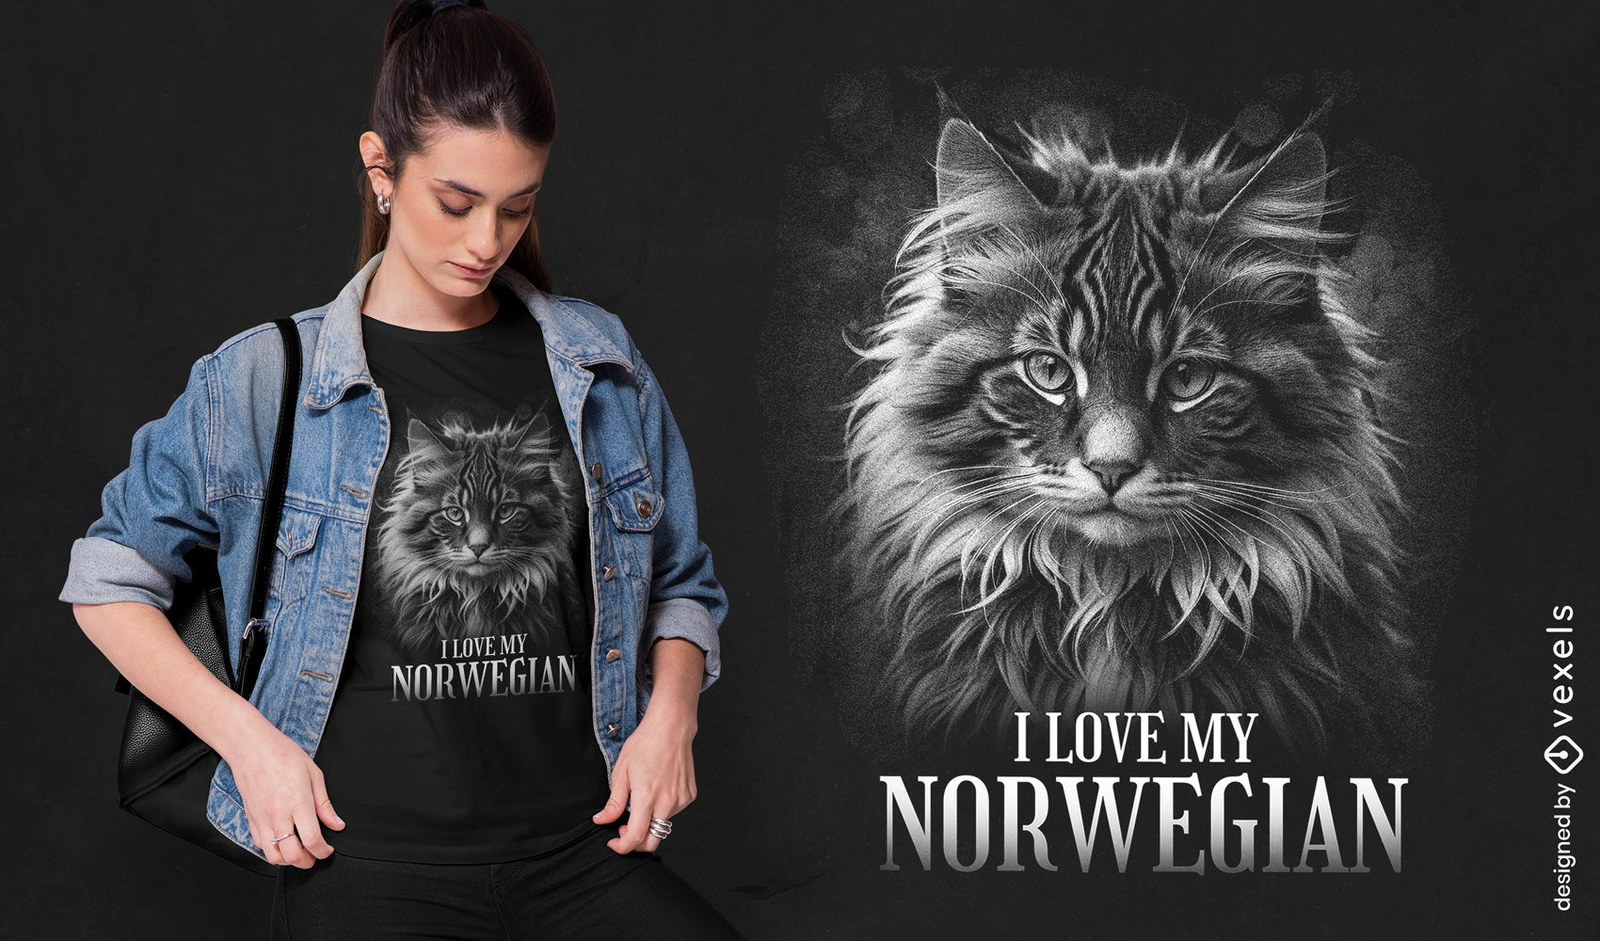
texto editável
Pronto para imprimir
para Merch
Eu amo o design da minha camiseta de gato norueguês
Escolha uma pasta
Todos os favoritos
Criar novo
Salvar
Eu amo o design da minha camiseta de gato norueguês
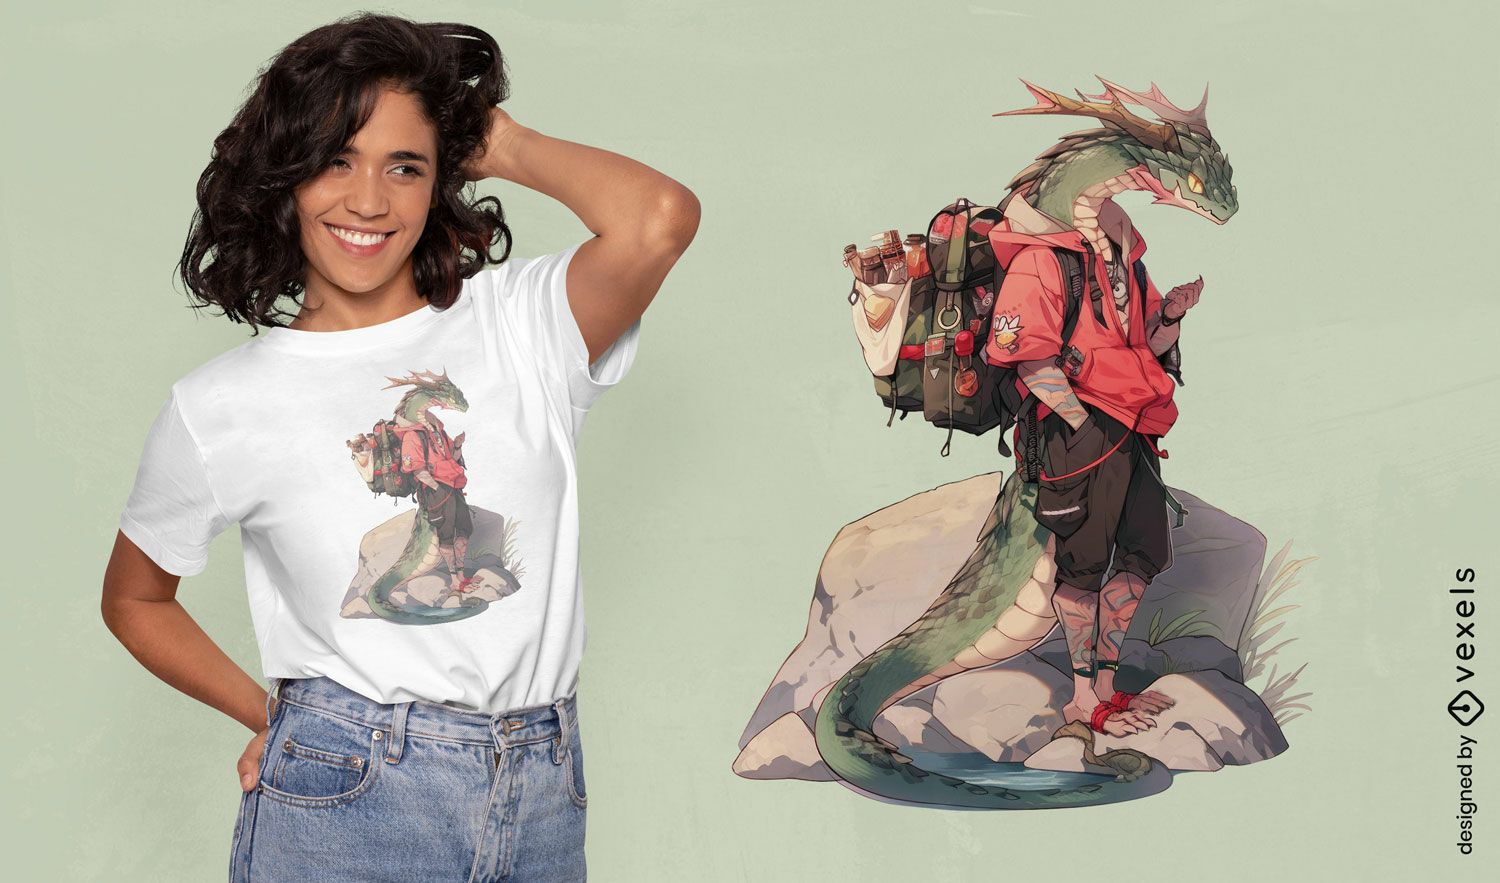
Pronto para imprimir
para Merch
Design de camiseta para caminhada com drag?o
Escolha uma pasta
Todos os favoritos
Criar novo
Salvar
Design de camiseta para caminhada com drag?o
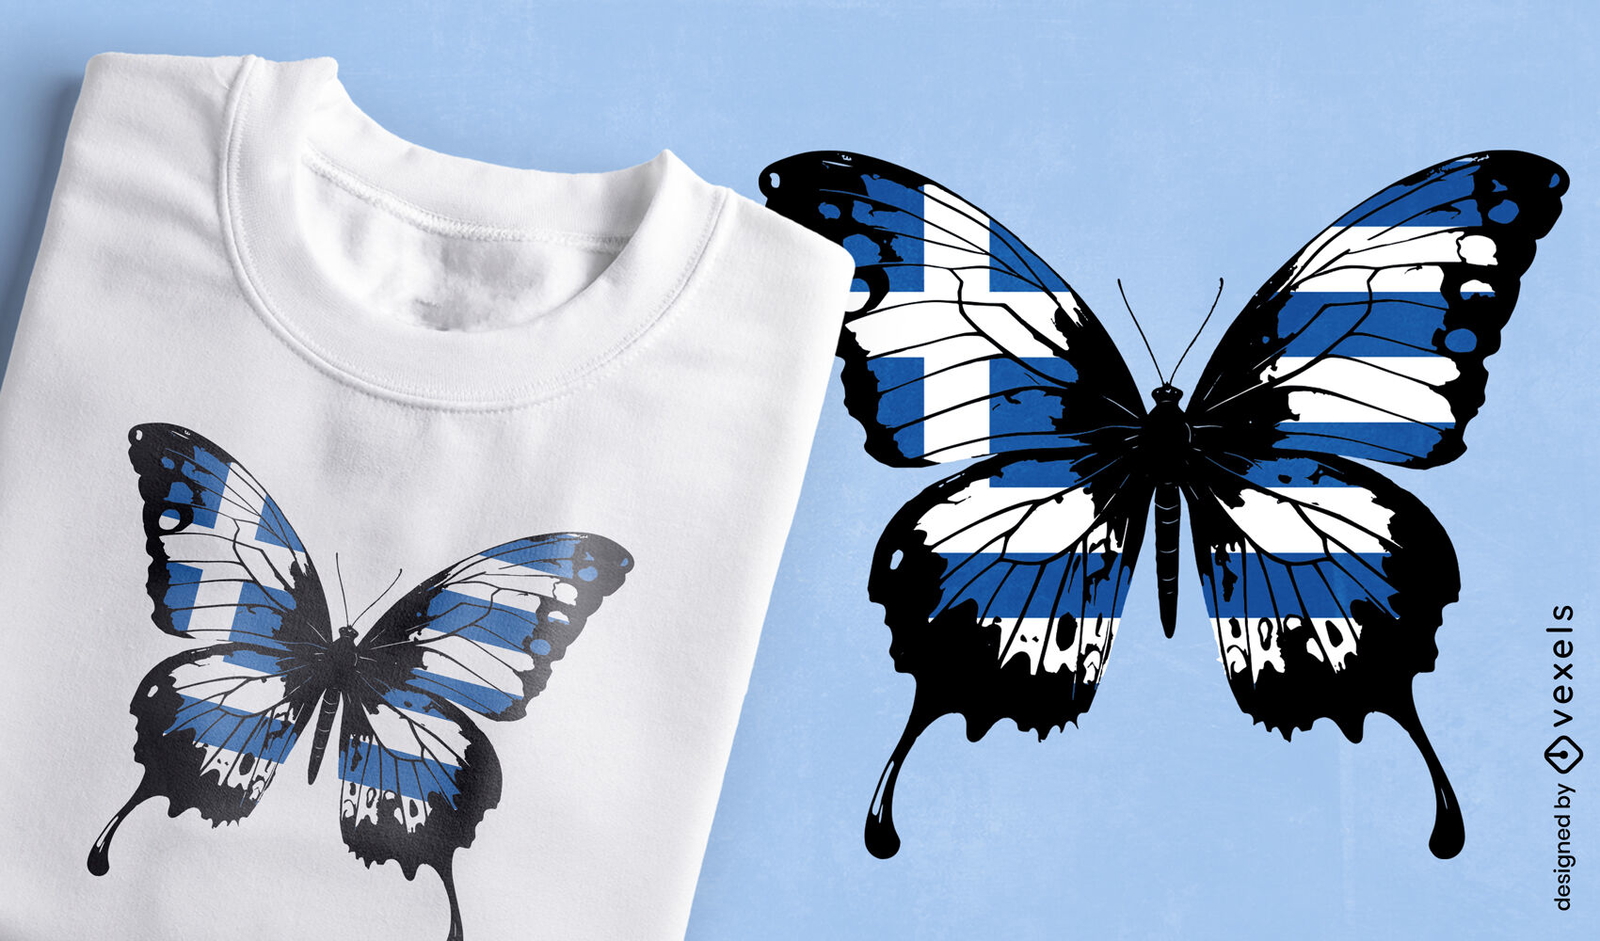
Pronto para imprimir
para Merch
Design de camiseta de borboleta de bandeira da Grécia
Escolha uma pasta
Todos os favoritos
Criar novo
Salvar
Design de camiseta de borboleta de bandeira da Grécia
Pronto para imprimir
para Merch
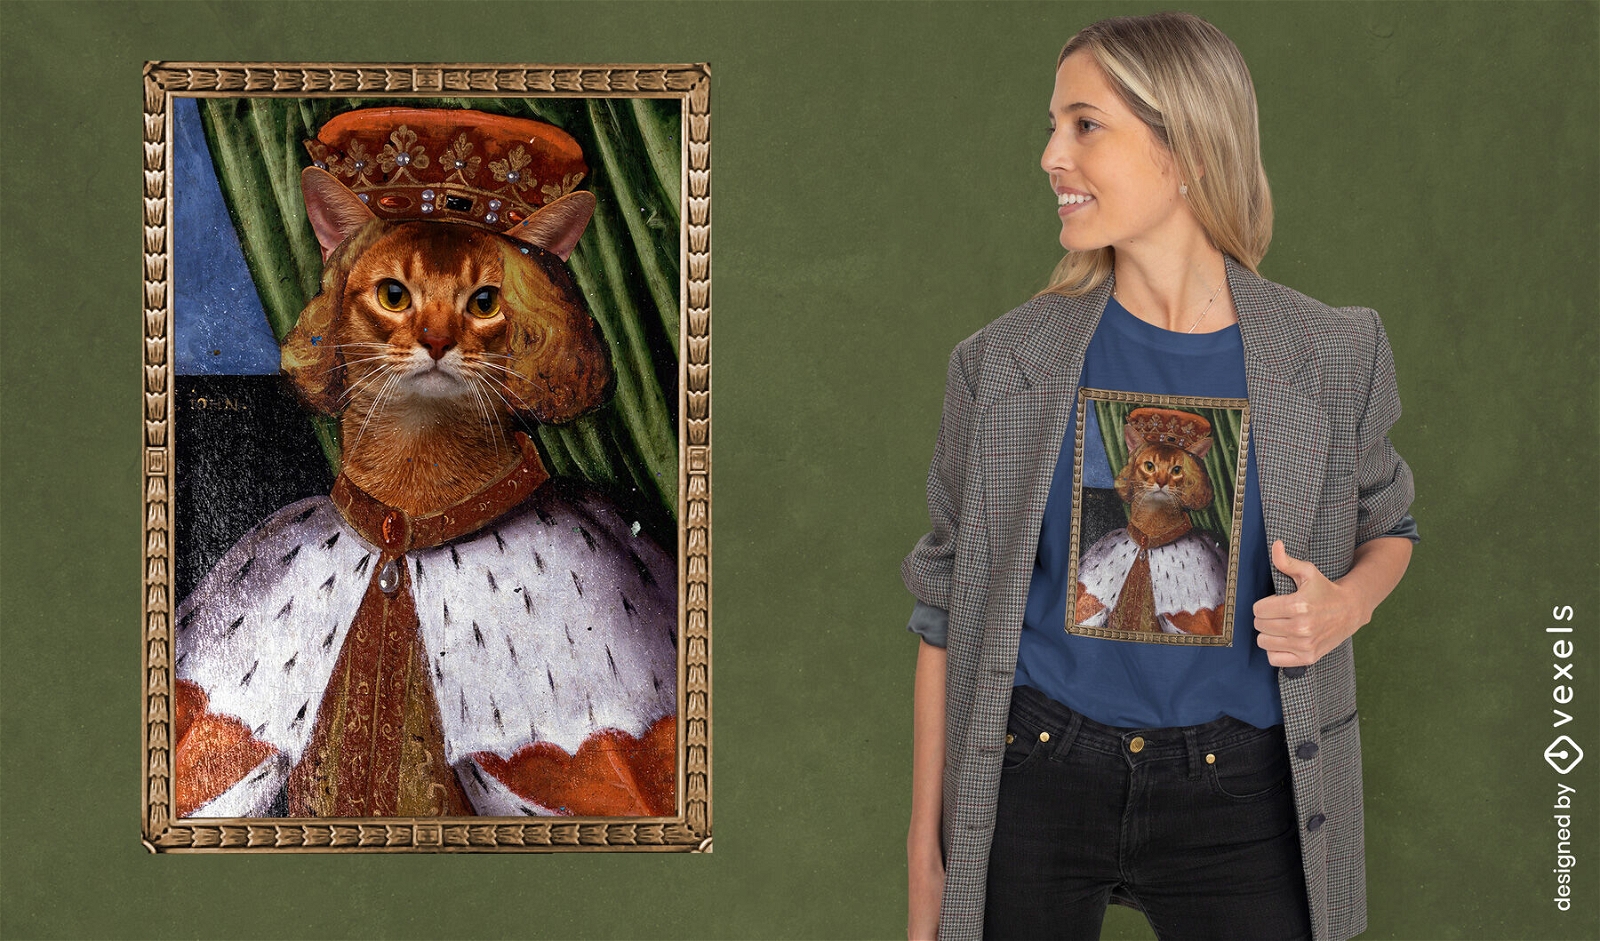
Design de camiseta psd do rei gato
Escolha uma pasta
Todos os favoritos
Criar novo
Salvar
Design de camiseta psd do rei gato
texto editável
Pronto para imprimir
para Merch
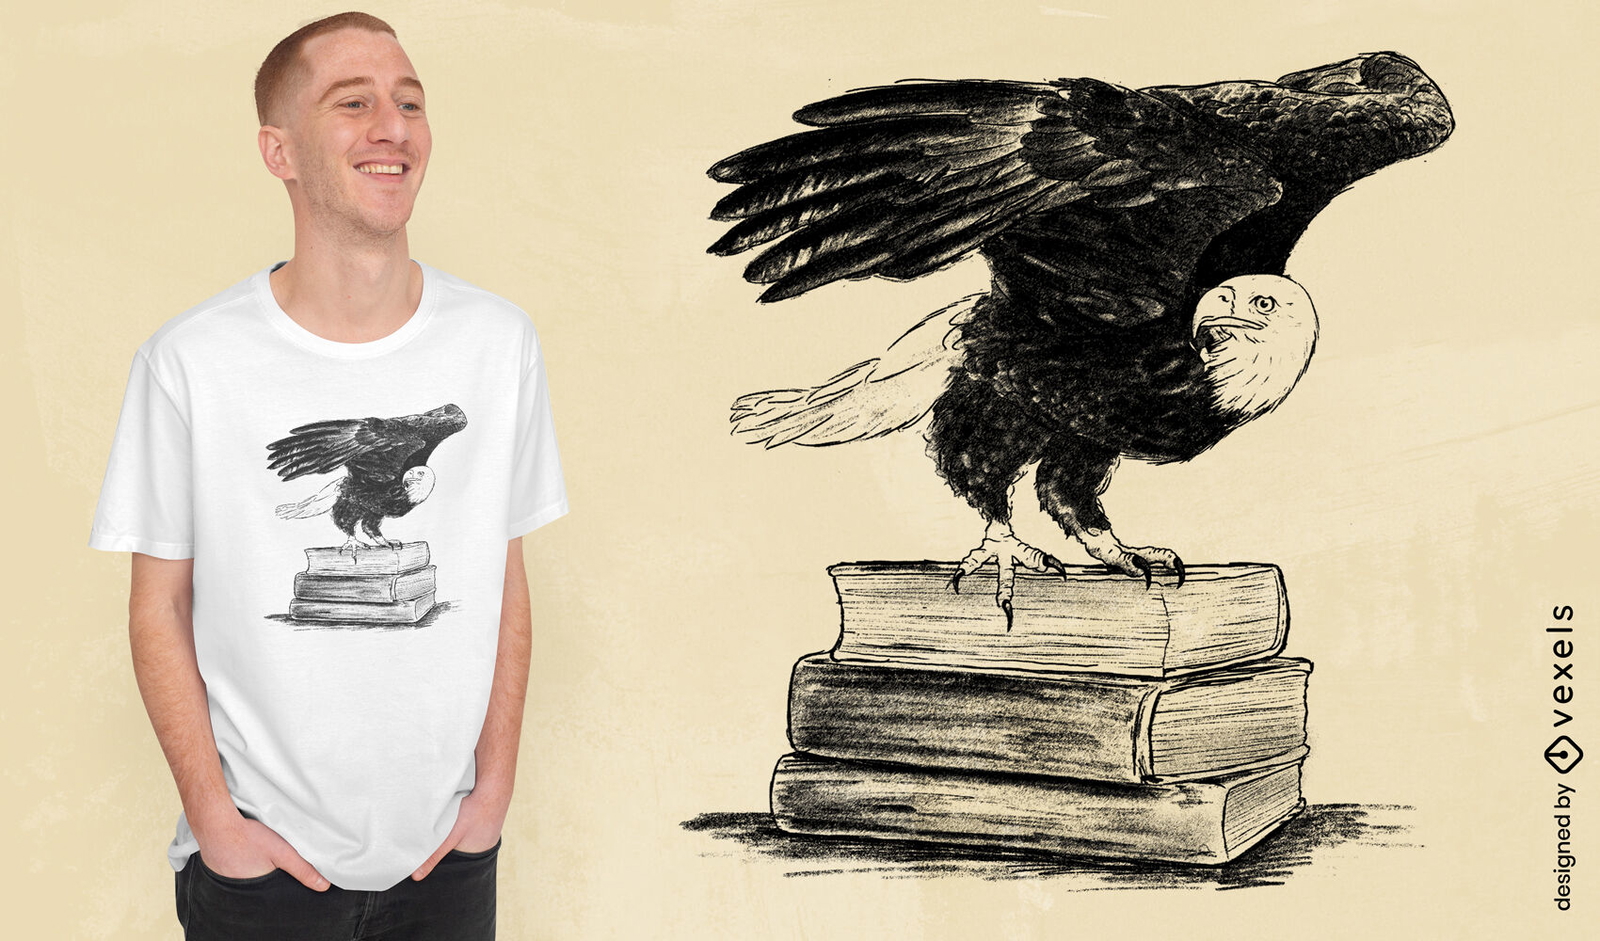
Design de camiseta de livros de falcão
Escolha uma pasta
Todos os favoritos
Criar novo
Salvar
Design de camiseta de livros de falcão
Pronto para imprimir
para Merch
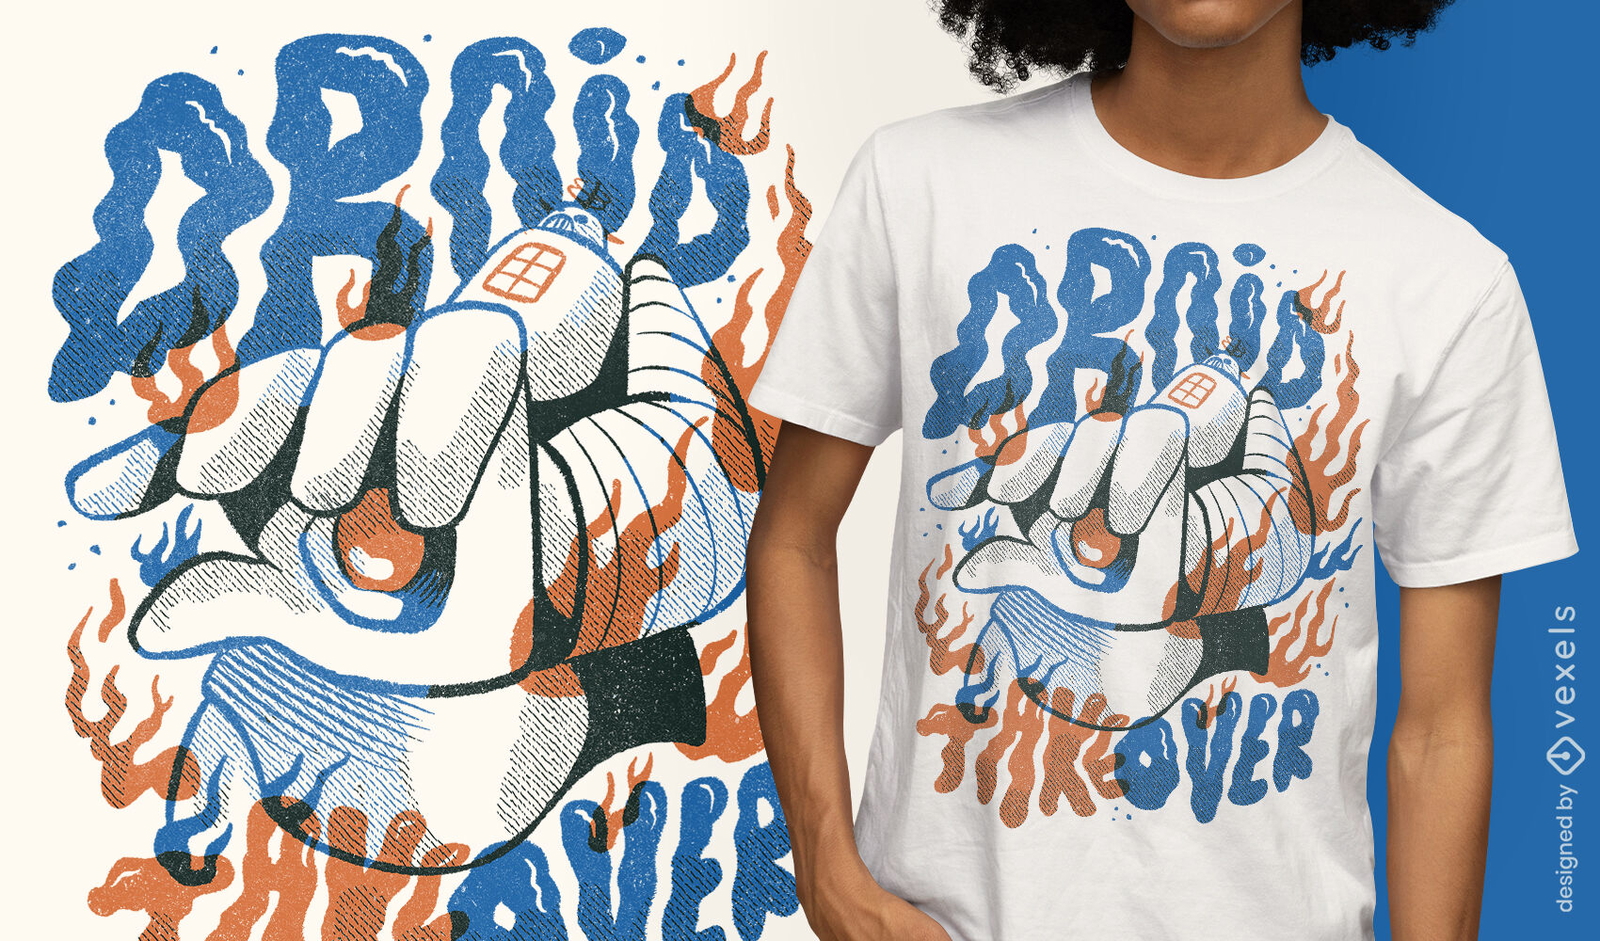
Design de camiseta de aquisição de robôs
Escolha uma pasta
Todos os favoritos
Criar novo
Salvar
Design de camiseta de aquisição de robôs
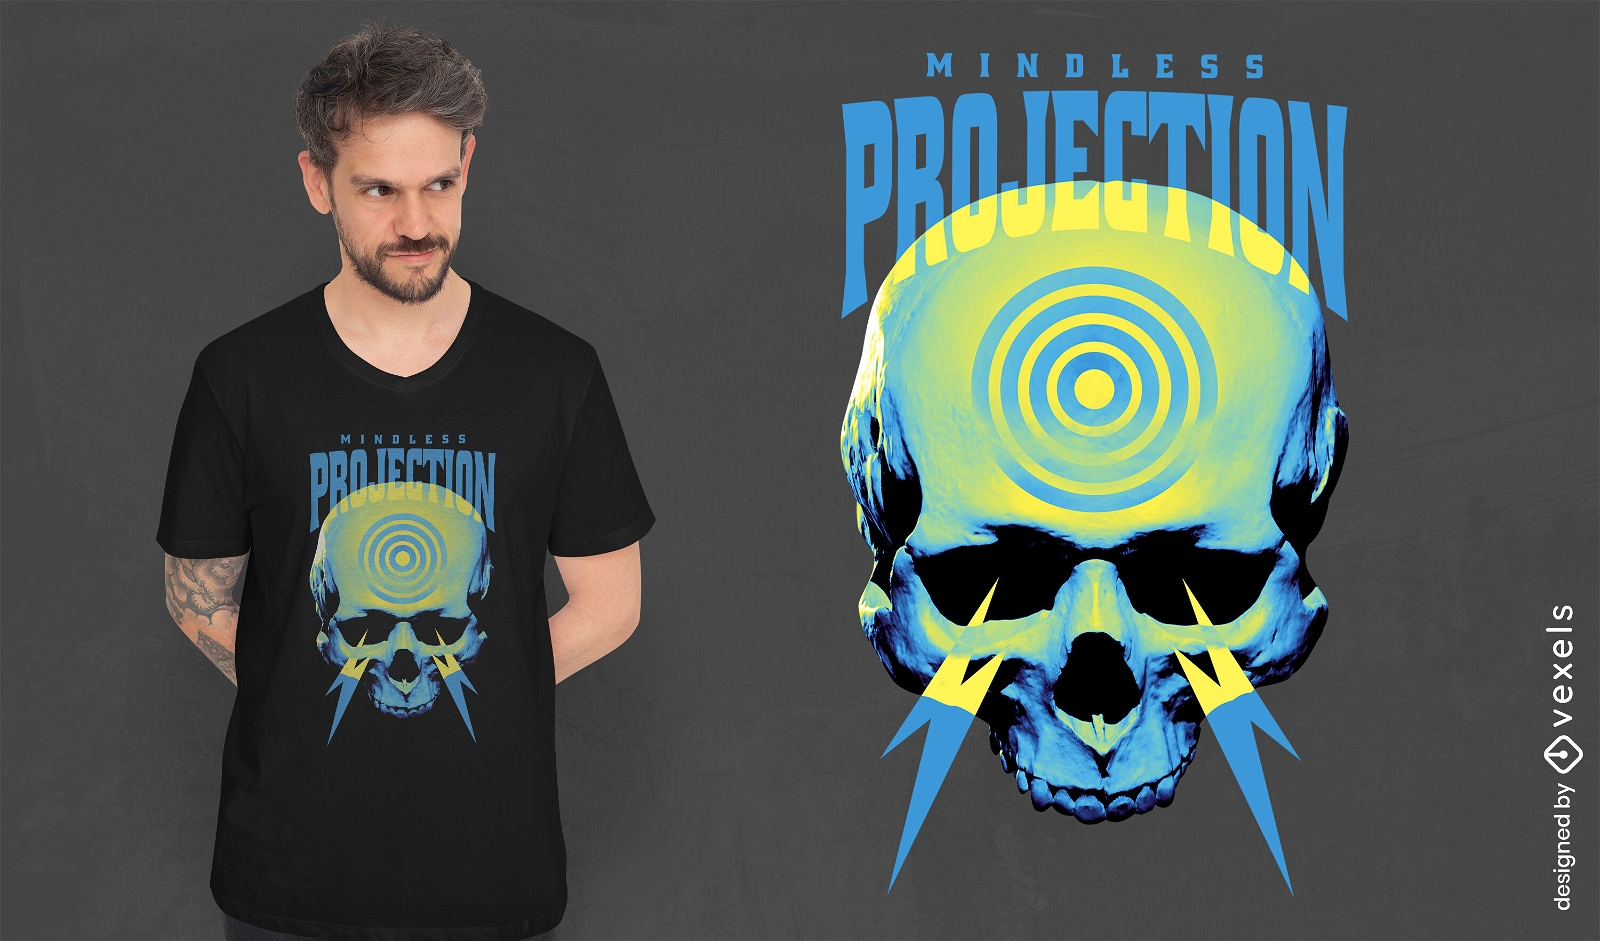
texto editável
Pronto para imprimir
para Merch
Design de camiseta de mente de caveira psd
Escolha uma pasta
Todos os favoritos
Criar novo
Salvar
Design de camiseta de mente de caveira psd
texto editável
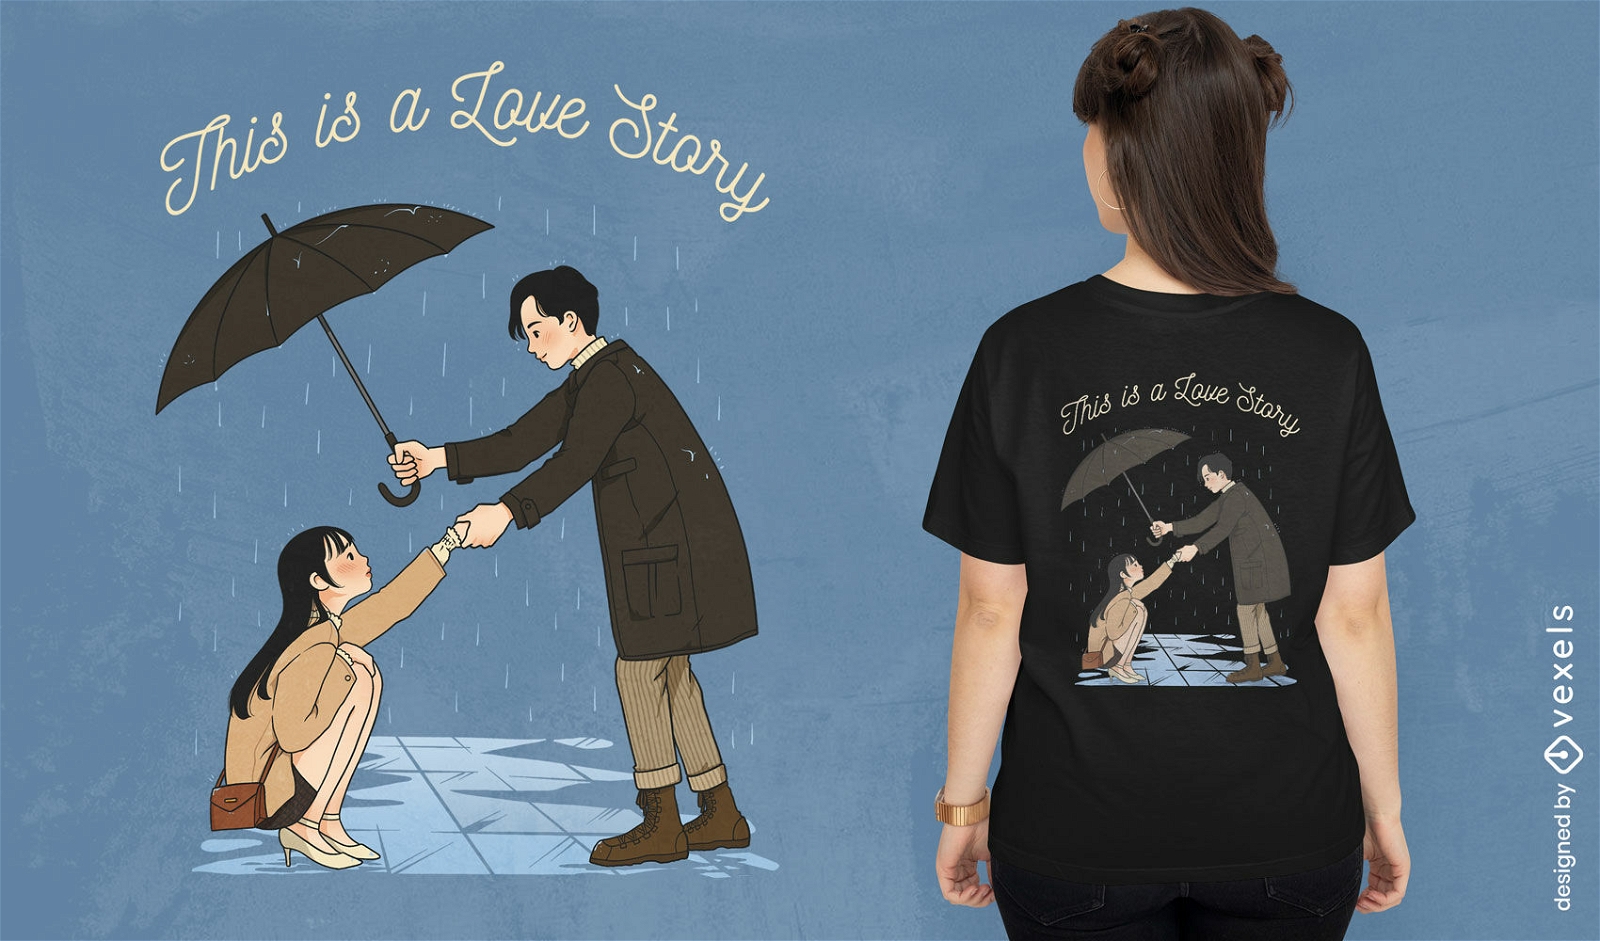
Pronto para imprimir
para Merch
Casal coreano no design de camiseta de chuva
Escolha uma pasta
Todos os favoritos
Criar novo
Salvar
Casal coreano no design de camiseta de chuva
texto editável
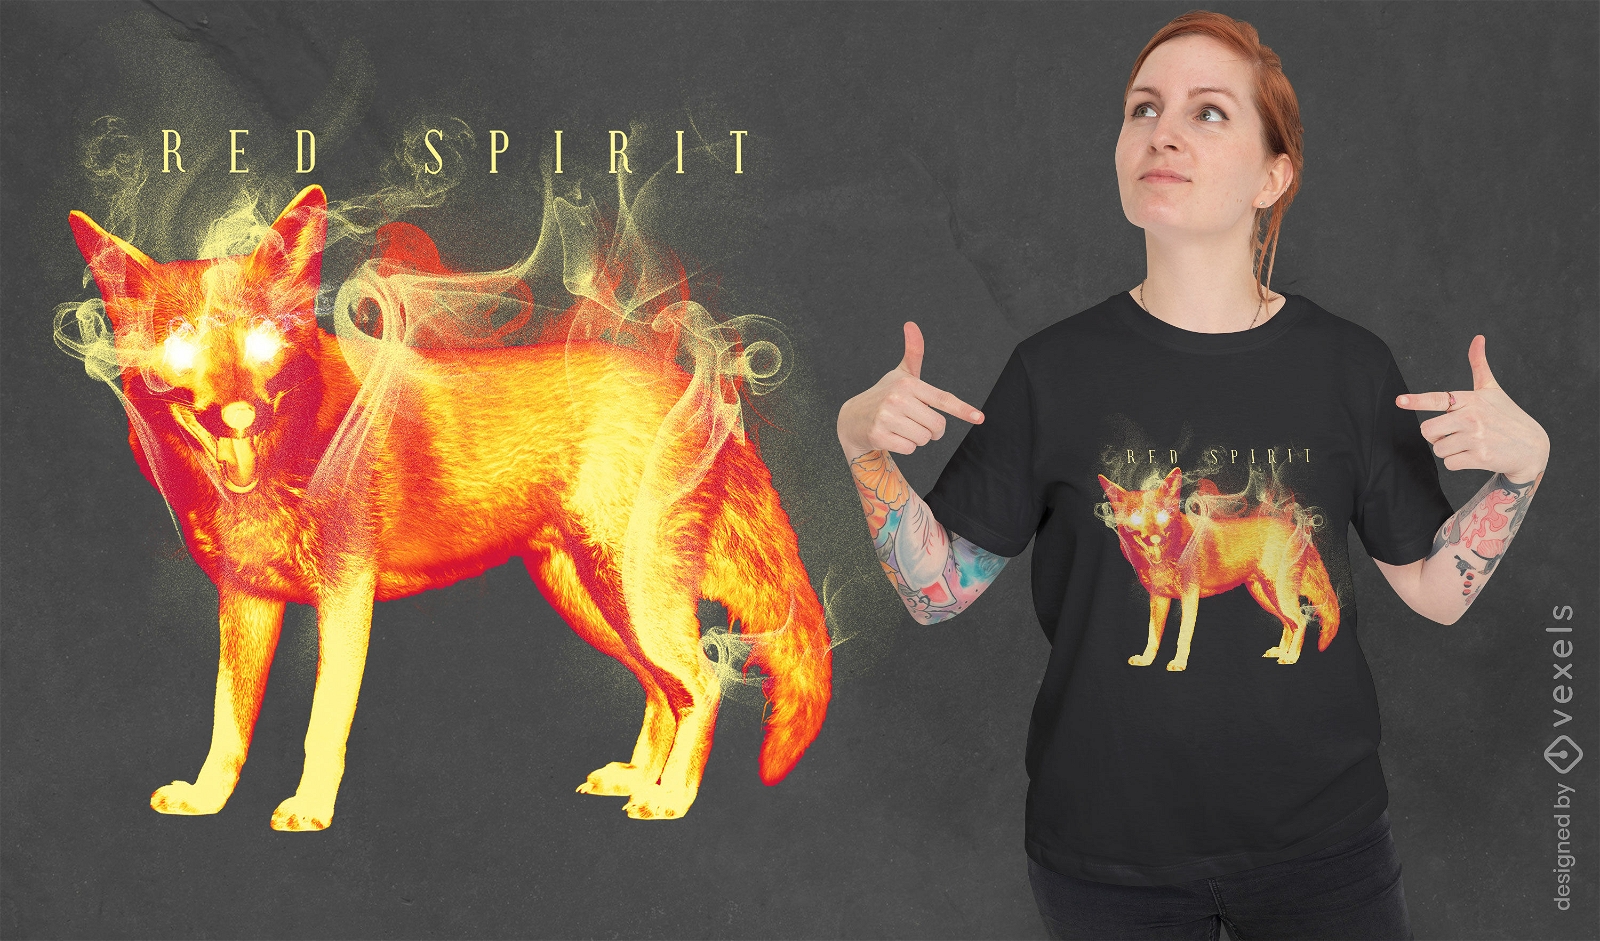
Pronto para imprimir
para Merch
Design de t-shirt Fox animal spirit on fire
Escolha uma pasta
Todos os favoritos
Criar novo
Salvar
Design de t-shirt Fox animal spirit on fire
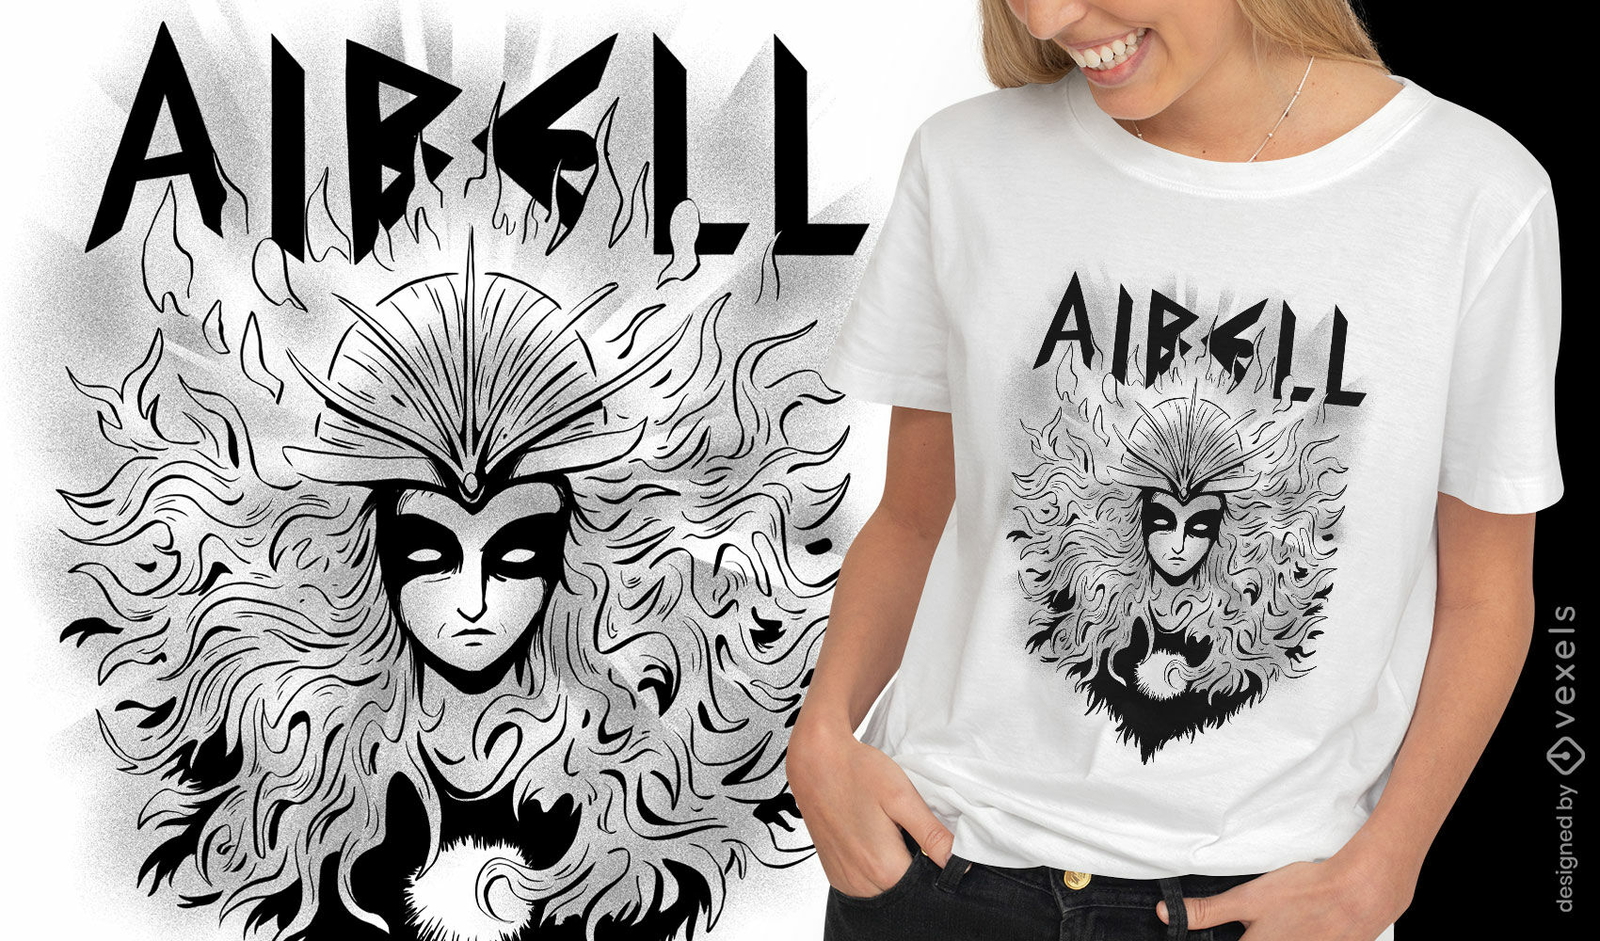
Pronto para imprimir
para Merch
Design de camiseta de criatura mítica celta
Escolha uma pasta
Todos os favoritos
Criar novo
Salvar
Design de camiseta de criatura mítica celta
texto editável
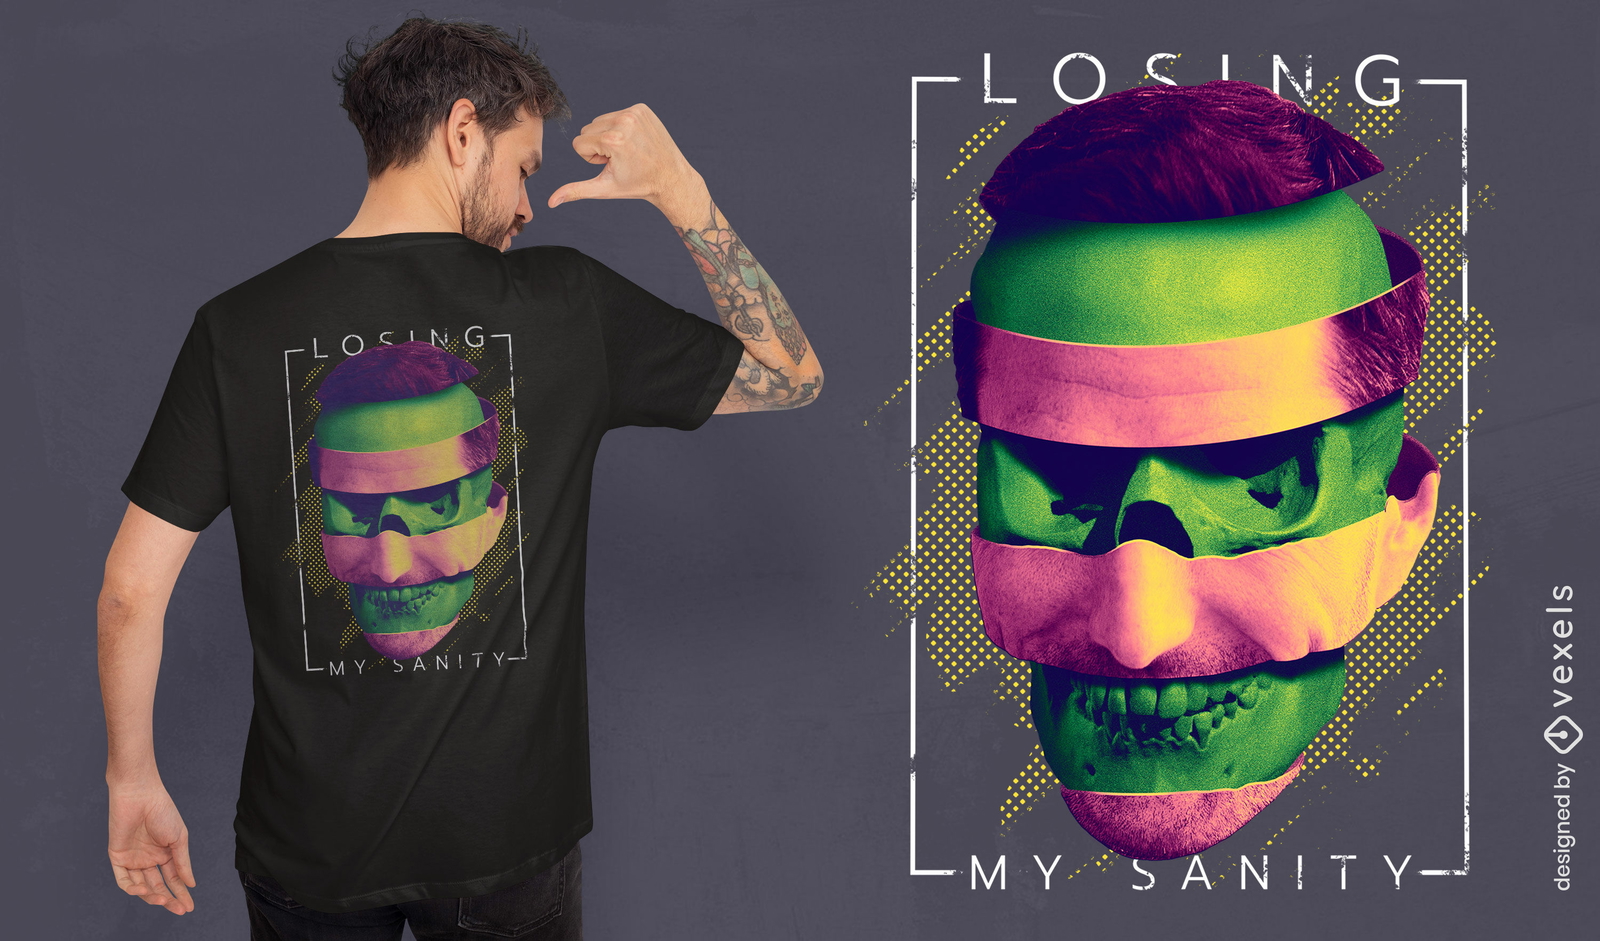
Pronto para imprimir
para Merch
Design de camiseta de cabeça de esqueleto cortada
Escolha uma pasta
Todos os favoritos
Criar novo
Salvar
Design de camiseta de cabeça de esqueleto cortada
Pronto para imprimir
para Merch
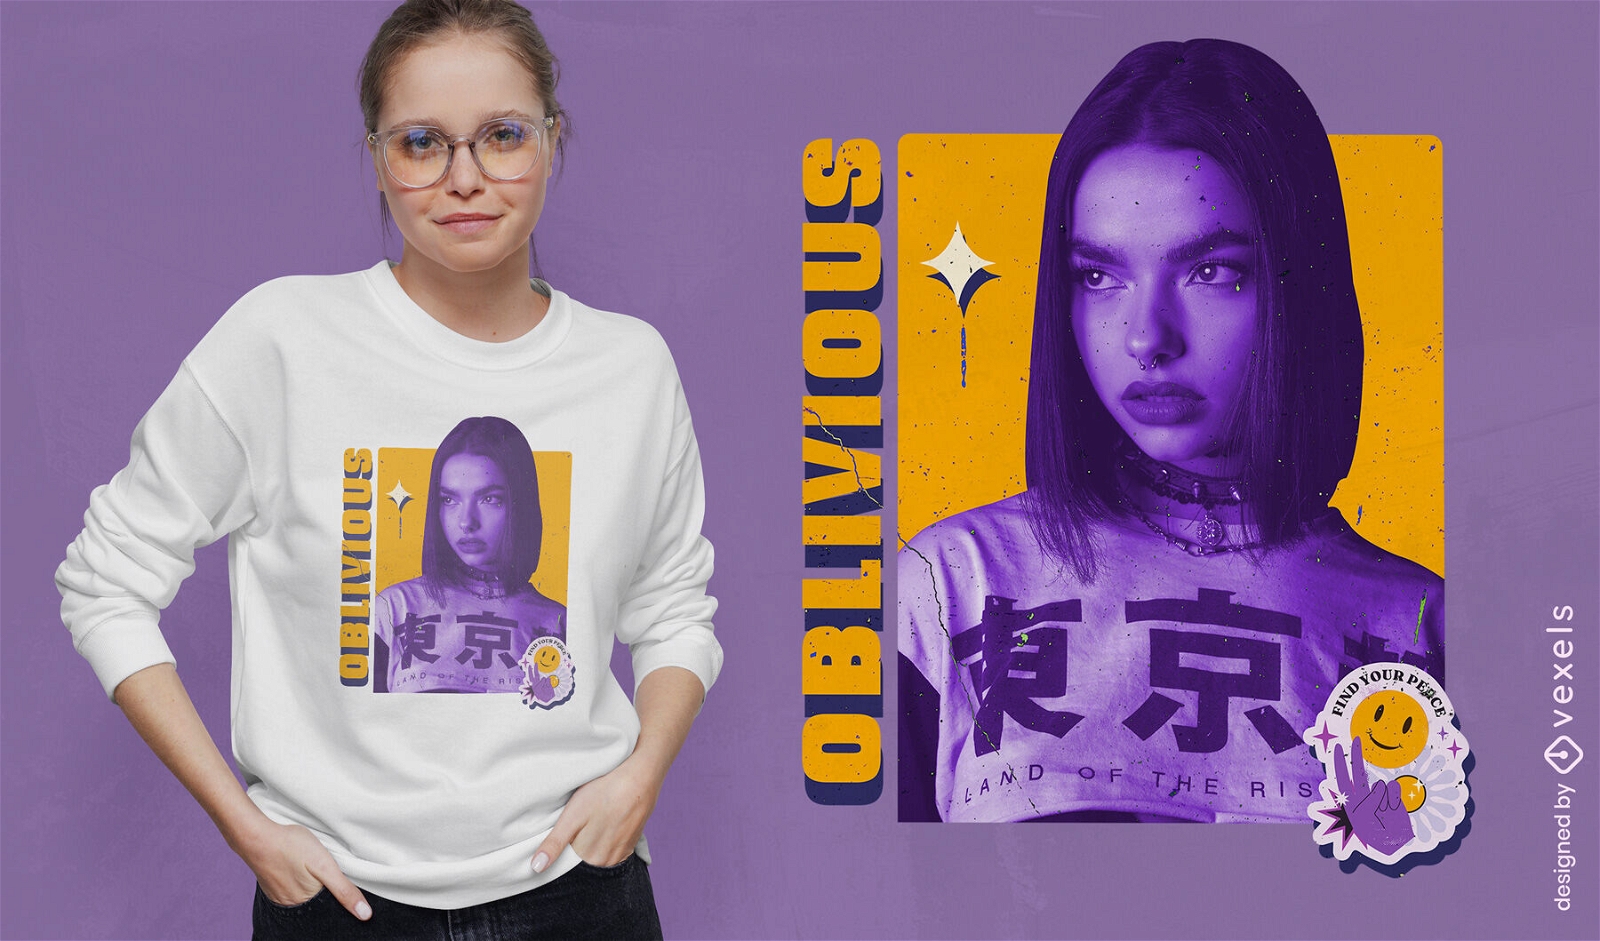
Design de camiseta de menina alheia
Escolha uma pasta
Todos os favoritos
Criar novo
Salvar
Design de camiseta de menina alheia
texto editável
Pronto para imprimir
para Merch
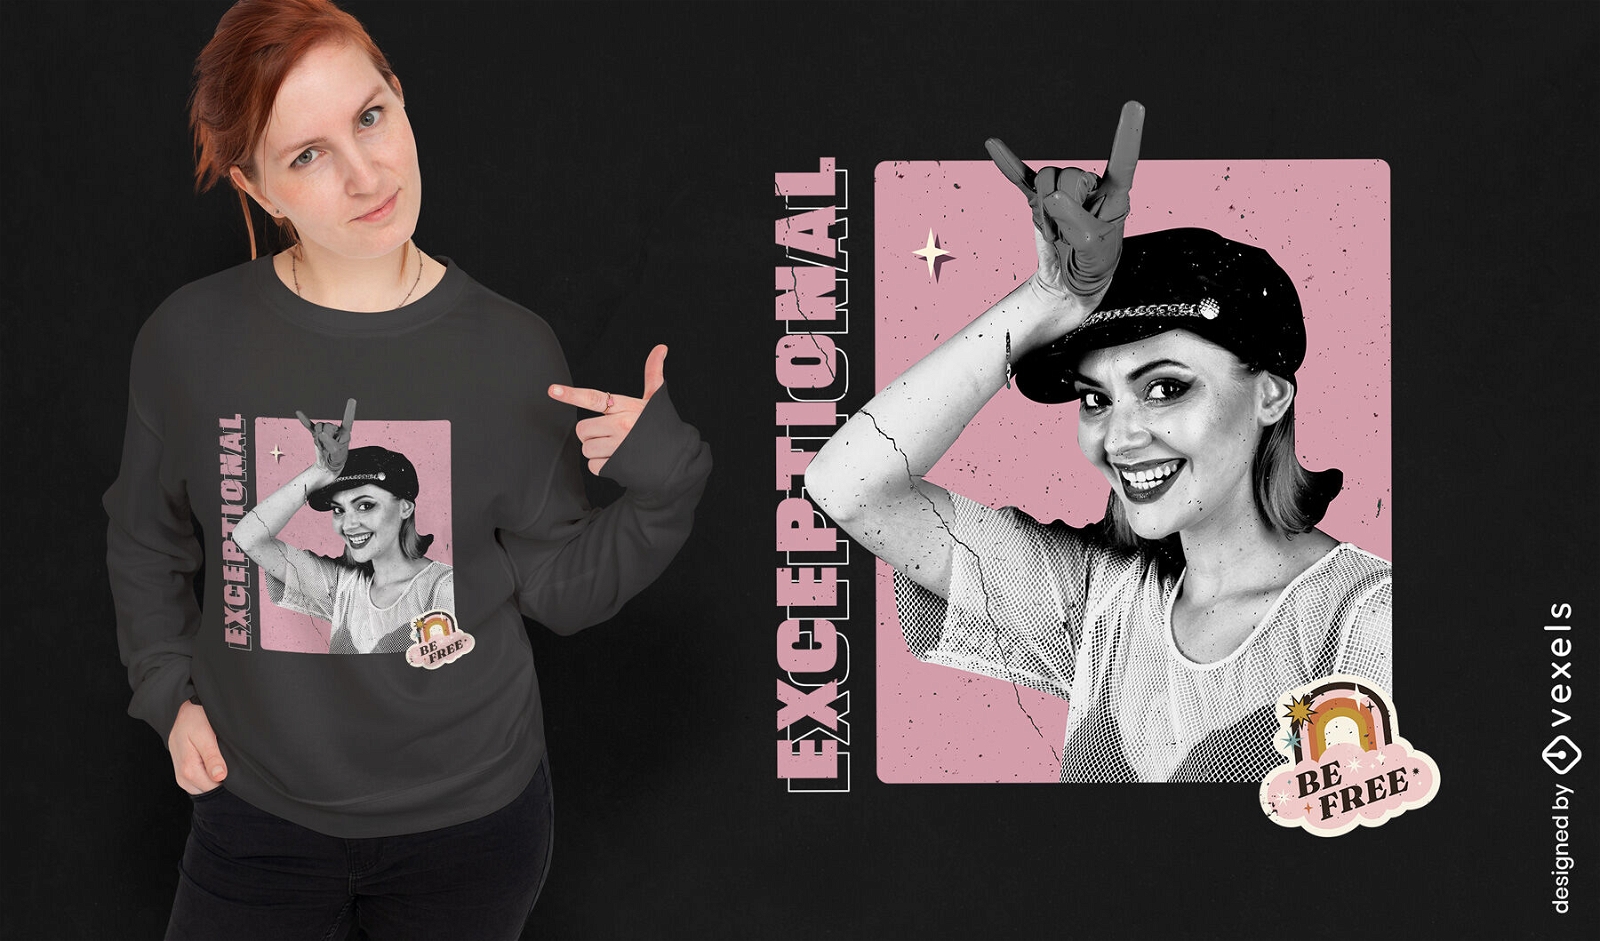
Seja design de camiseta de mulher livre
Escolha uma pasta
Todos os favoritos
Criar novo
Salvar
Seja design de camiseta de mulher livre
Pronto para imprimir
para Merch
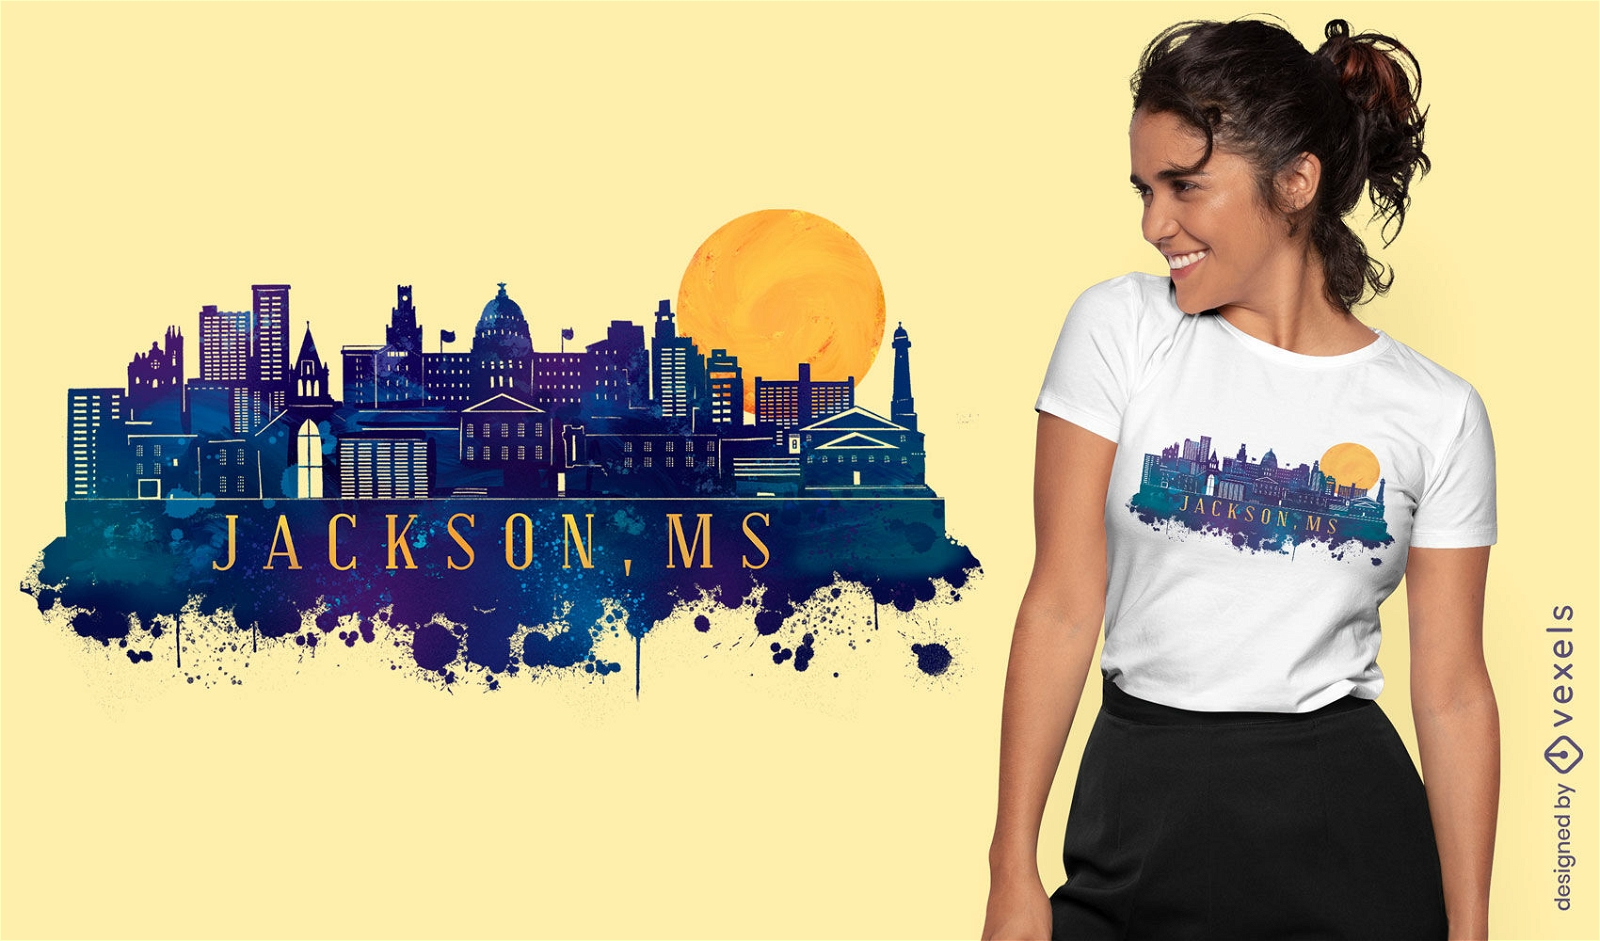
Design de camiseta com skyline da cidade de Jackson
Escolha uma pasta
Todos os favoritos
Criar novo
Salvar
Design de camiseta com skyline da cidade de Jackson
texto editável
Pronto para imprimir
para Merch
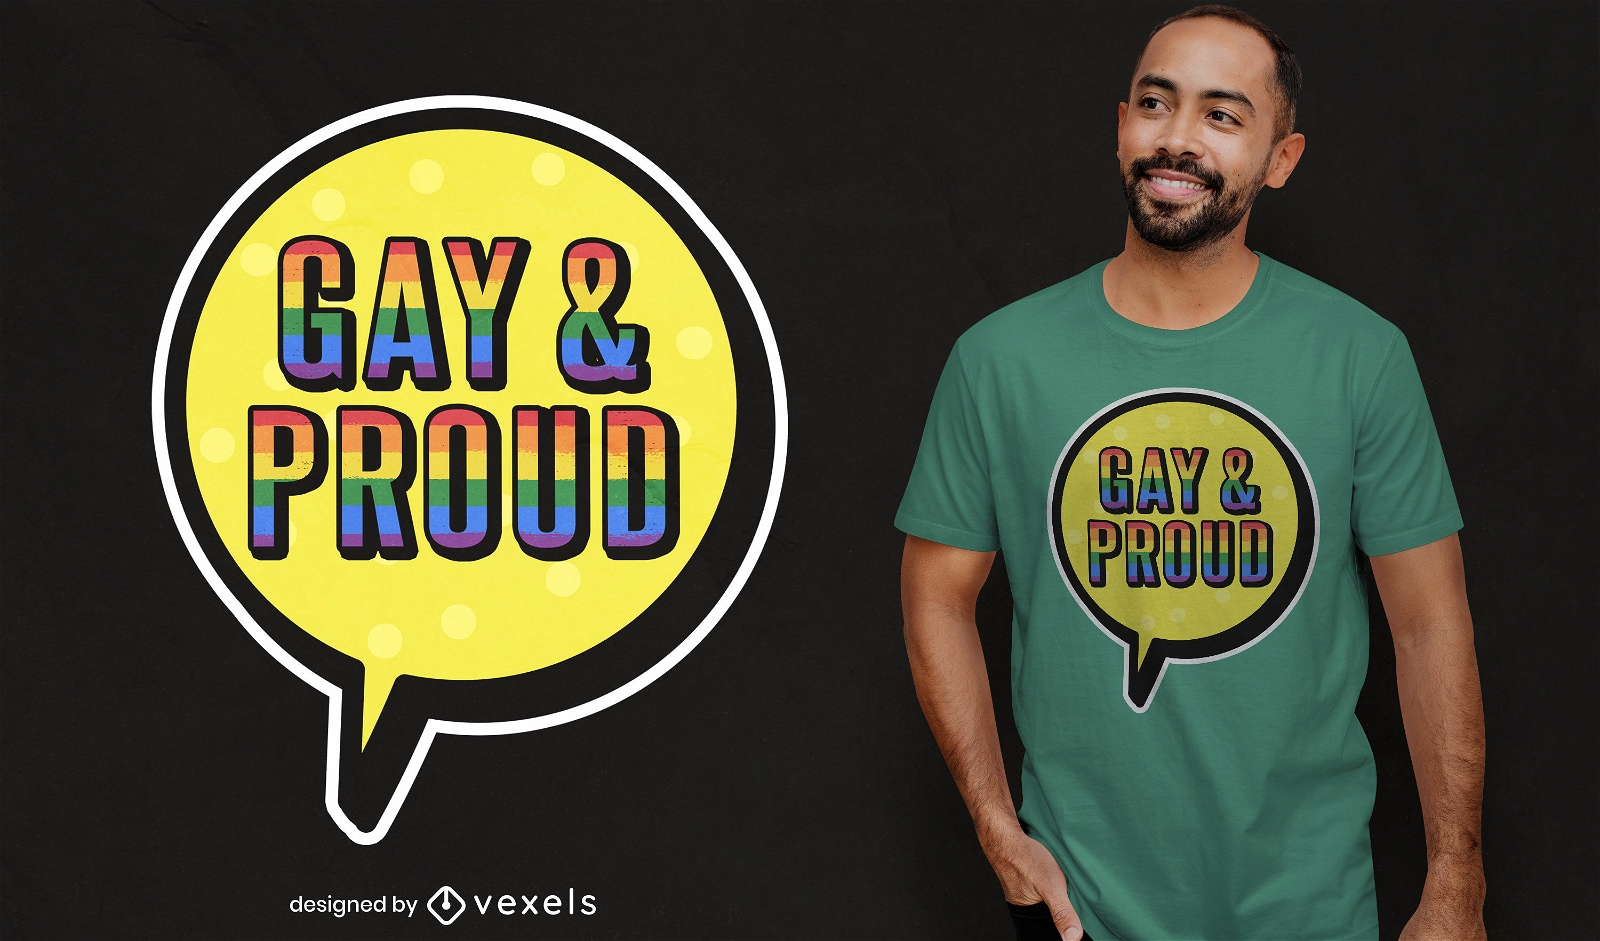
Design de camiseta gay e orgulhoso
Escolha uma pasta
Todos os favoritos
Criar novo
Salvar
Design de camiseta gay e orgulhoso
Pronto para imprimir
para Merch
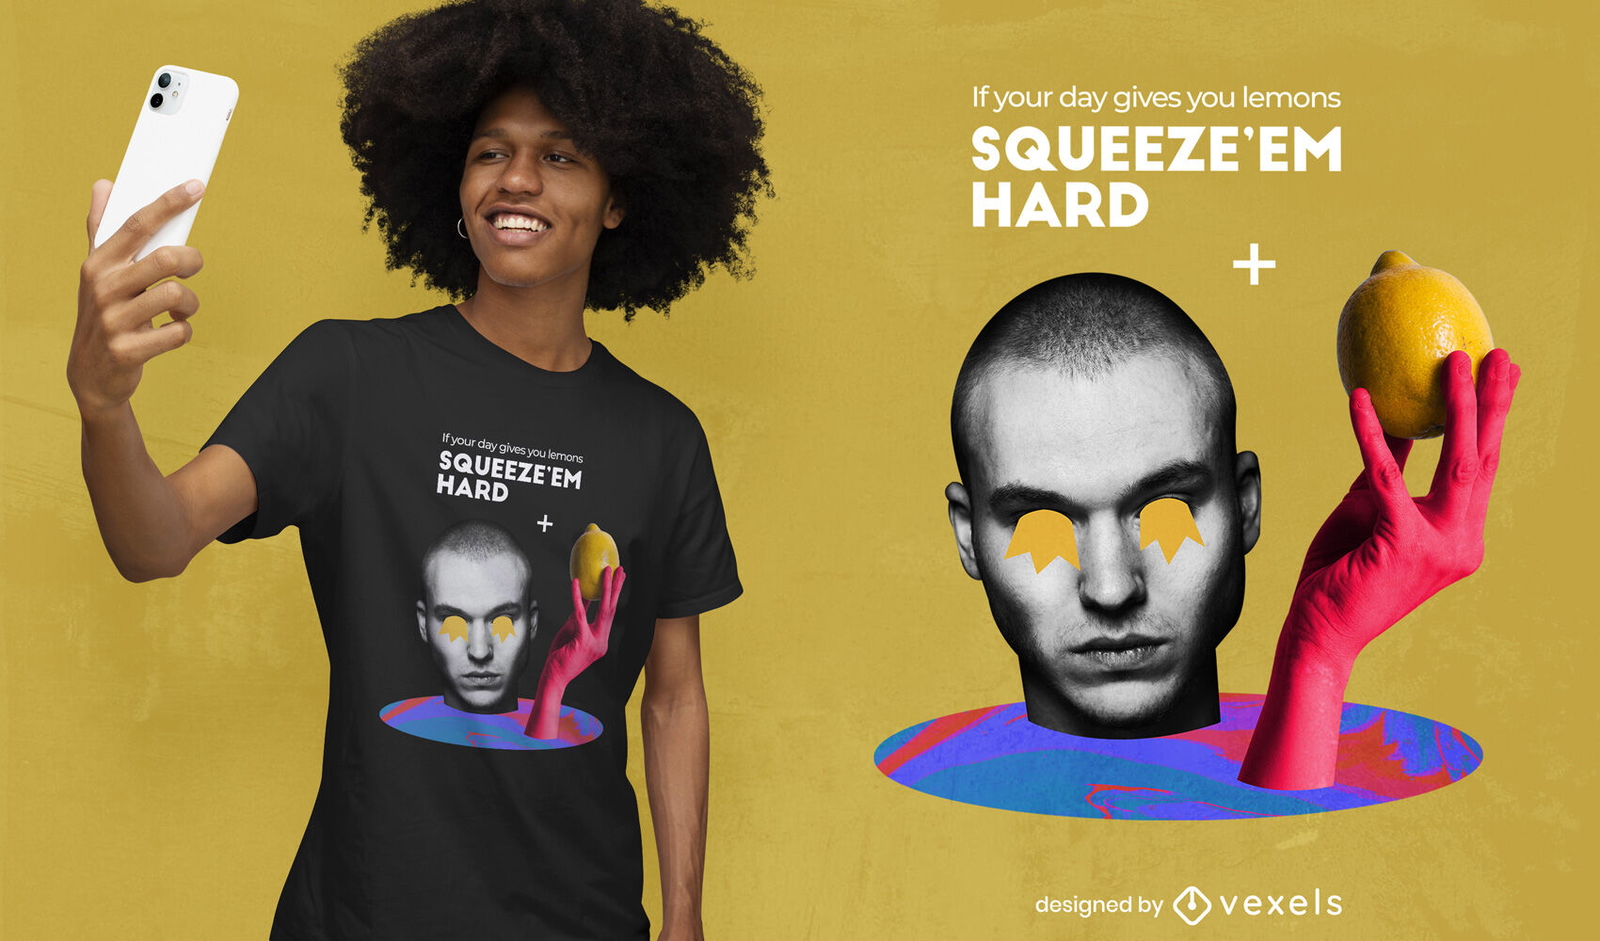
Homem com t-shirt de colagem limão fruta psd
Escolha uma pasta
Todos os favoritos
Criar novo
Salvar
Homem com t-shirt de colagem limão fruta psd
Pronto para imprimir
para Merch
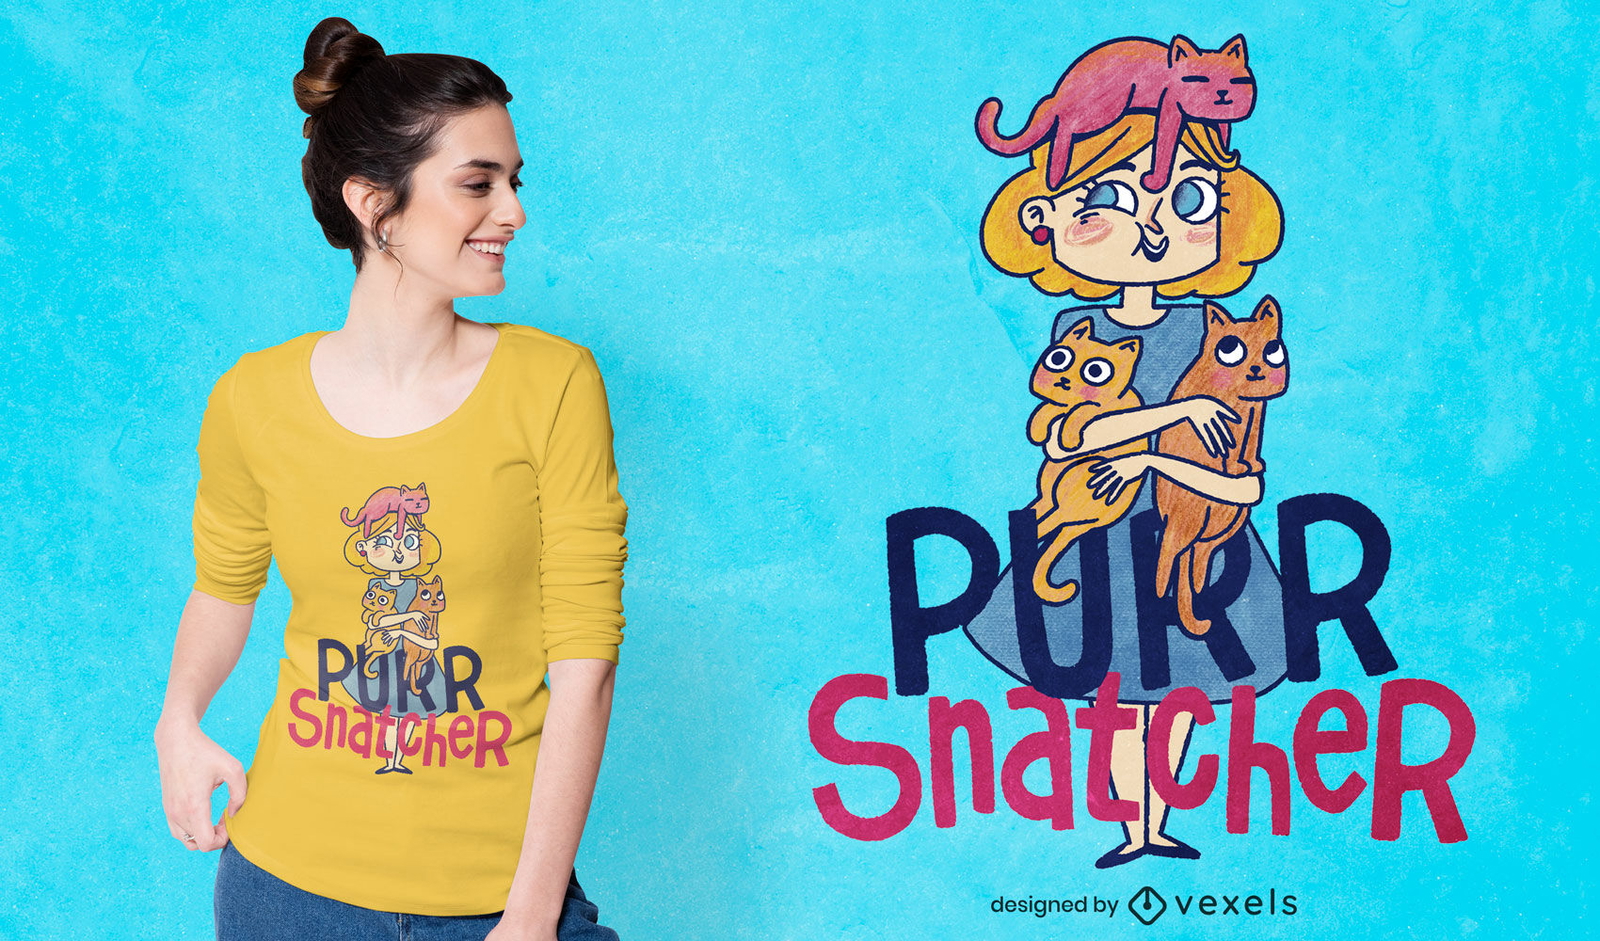
T-shirt de desenho animado de mulher abraçando gatos psd
Escolha uma pasta
Todos os favoritos
Criar novo
Salvar
T-shirt de desenho animado de mulher abraçando gatos psd
Pronto para imprimir
para Merch
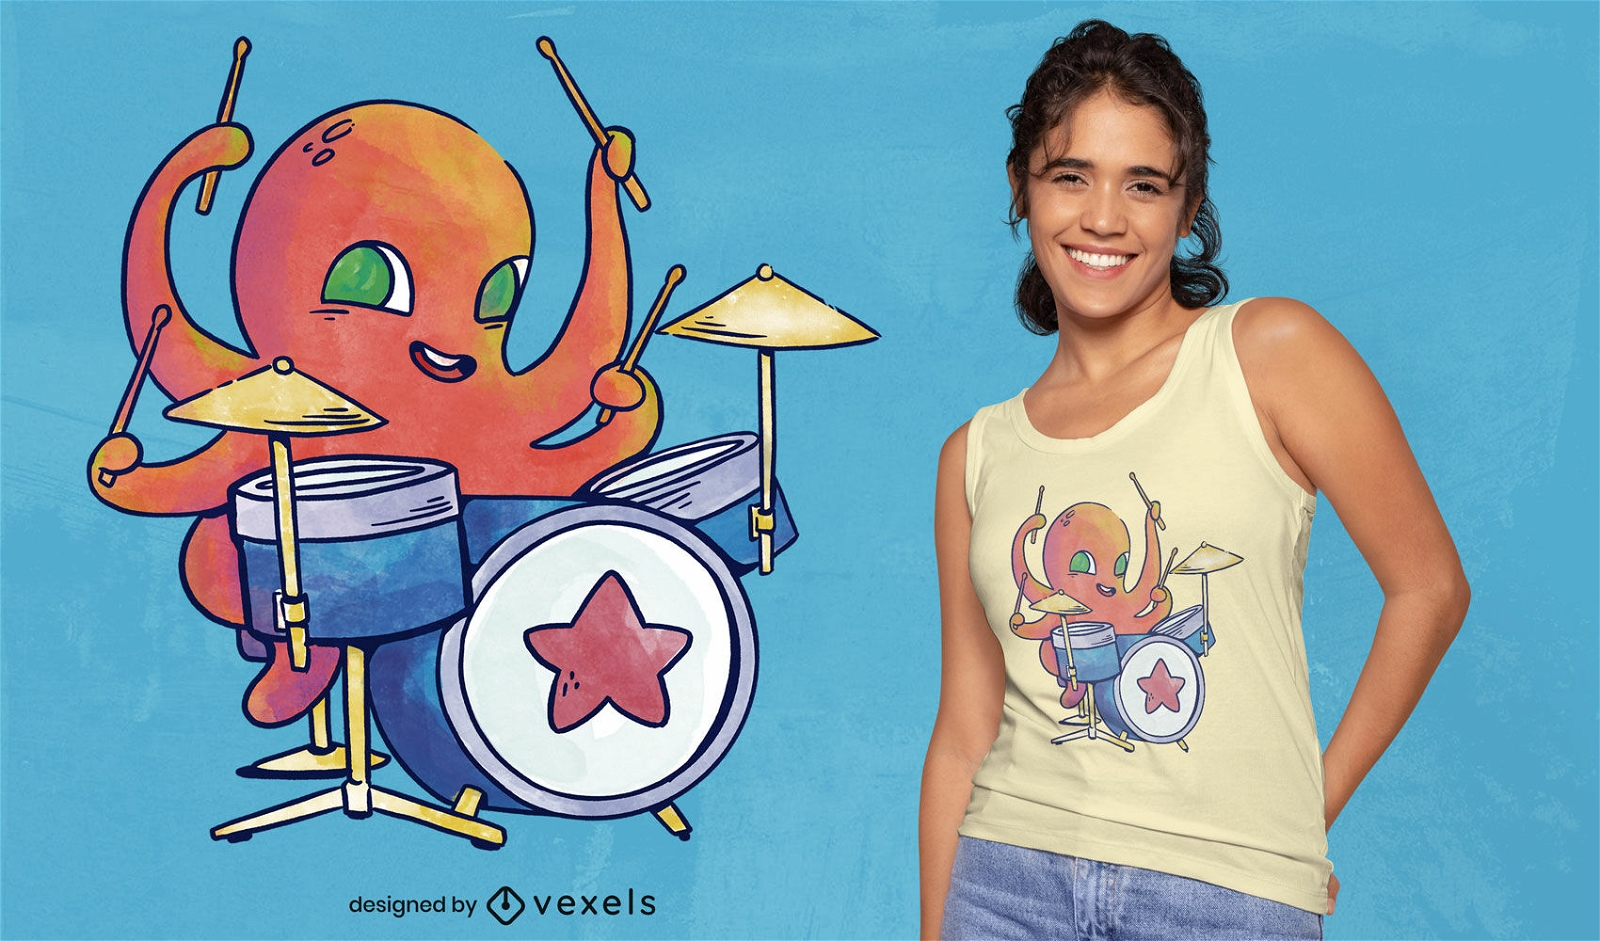
Desenho de camiseta psd de baterista de polvo em aquarela
Escolha uma pasta
Todos os favoritos
Criar novo
Salvar
Desenho de camiseta psd de baterista de polvo em aquarela
Pronto para imprimir
para Merch
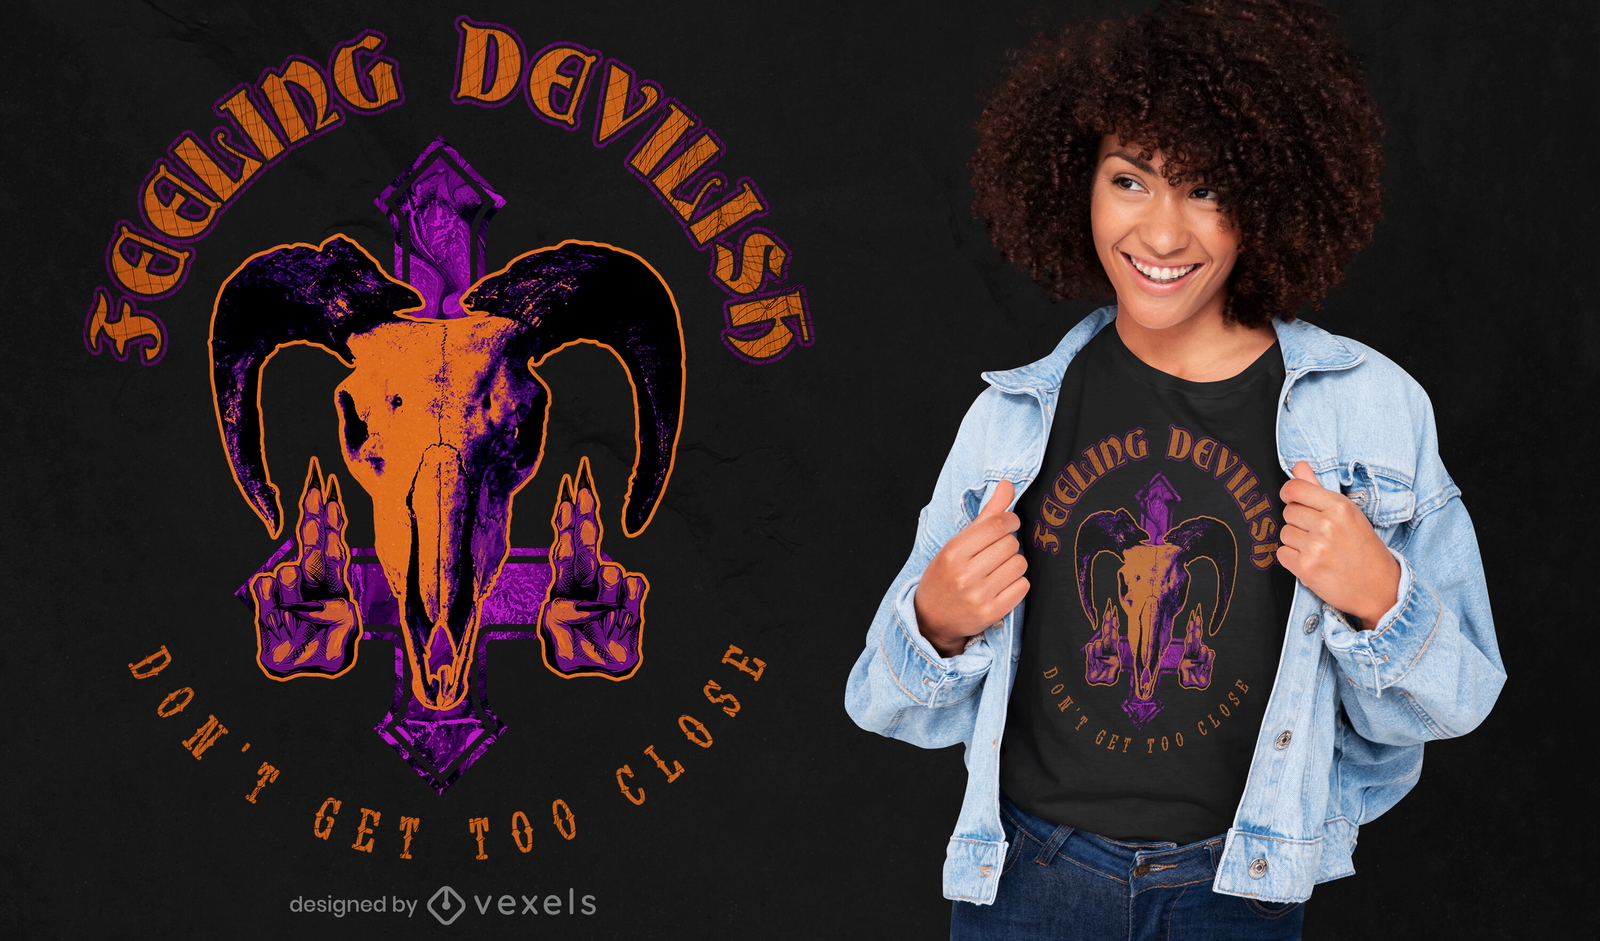
T-shirt fotográfico máscara do demônio do crânio psd
Escolha uma pasta
Todos os favoritos
Criar novo
Salvar
T-shirt fotográfico máscara do demônio do crânio psd
Pronto para imprimir
para Merch
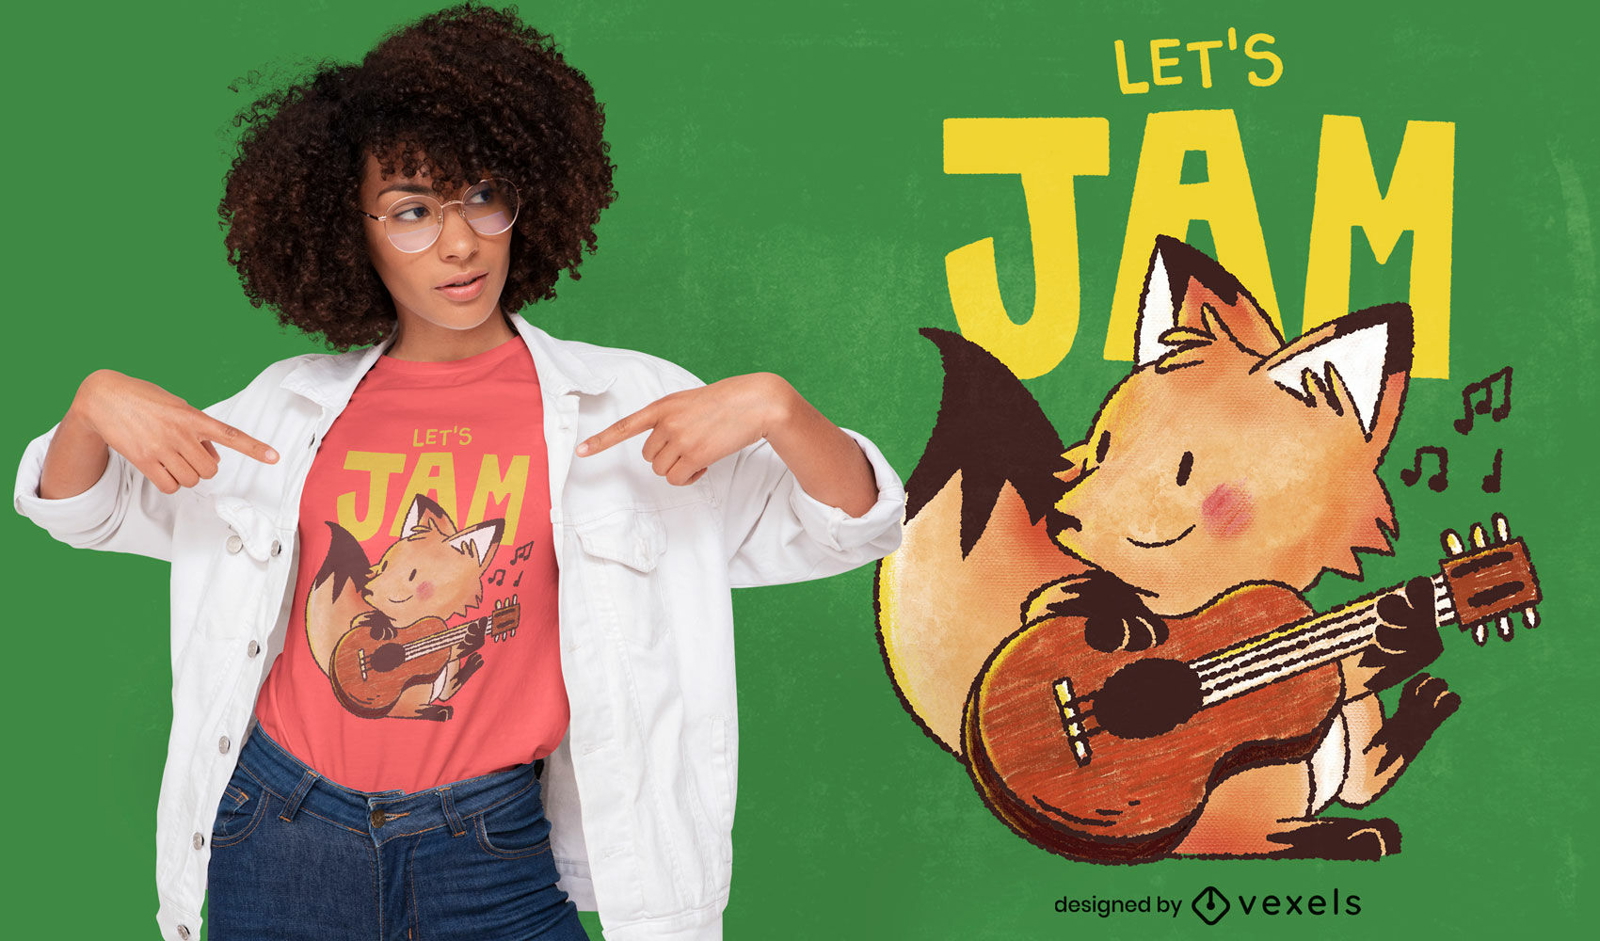
Guitarrista raposa psd desenho de t-shirt doodle
Escolha uma pasta
Todos os favoritos
Criar novo
Salvar
Guitarrista raposa psd desenho de t-shirt doodle
Pronto para imprimir
para Merch
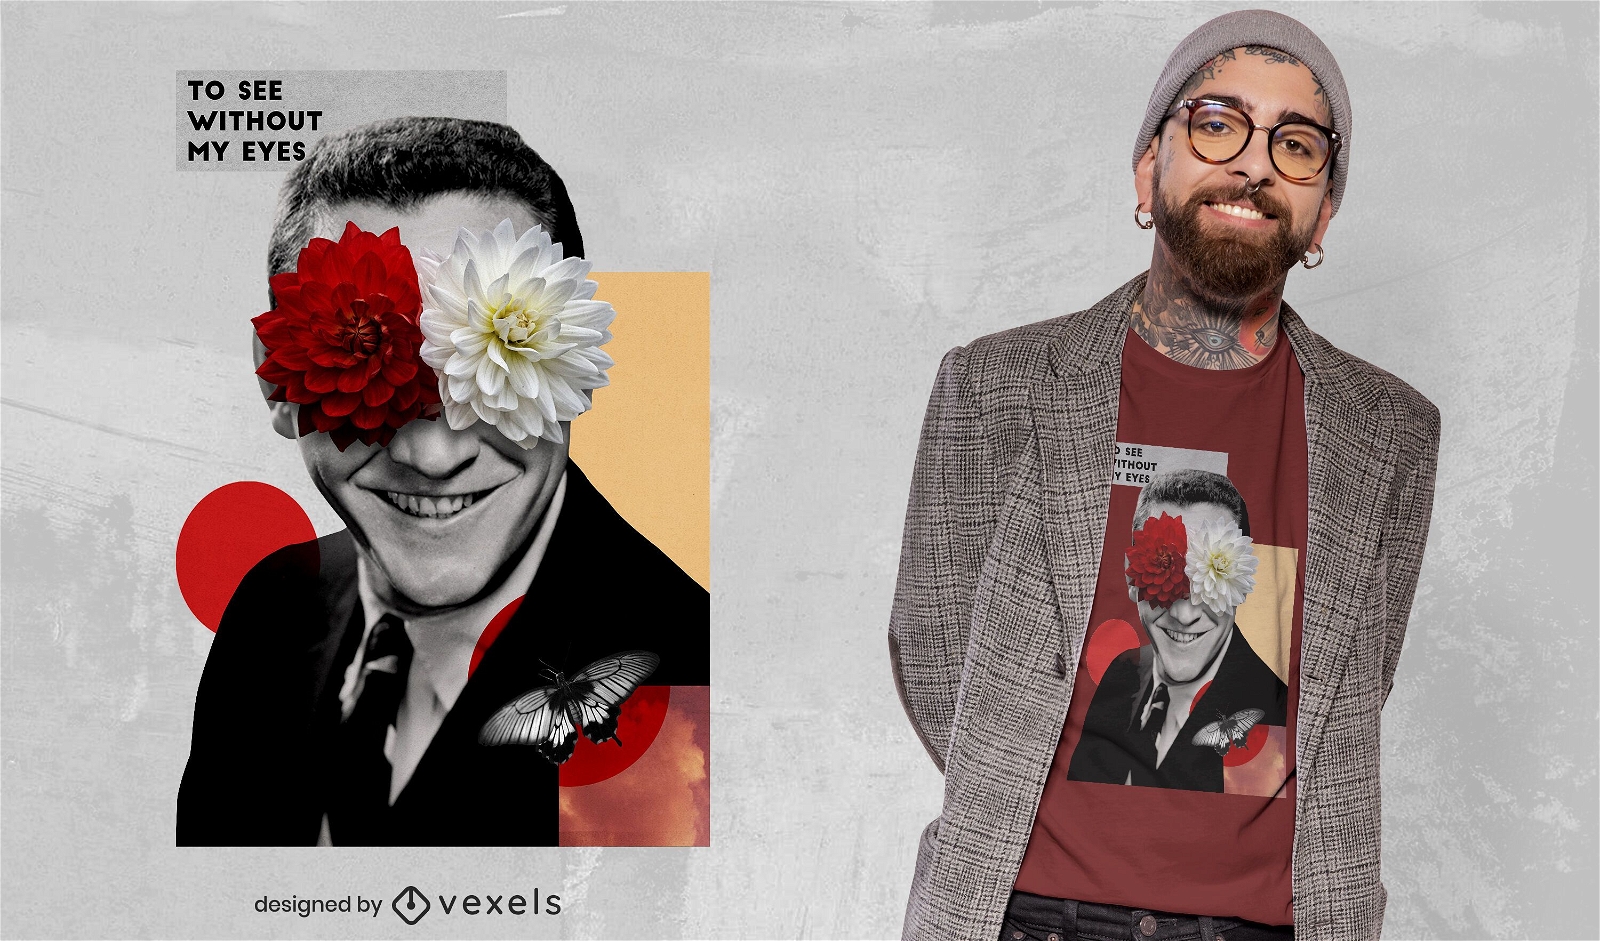
Homem com design de camiseta psd de colagem de flores
Escolha uma pasta
Todos os favoritos
Criar novo
Salvar
Homem com design de camiseta psd de colagem de flores
Pronto para imprimir
para Merch
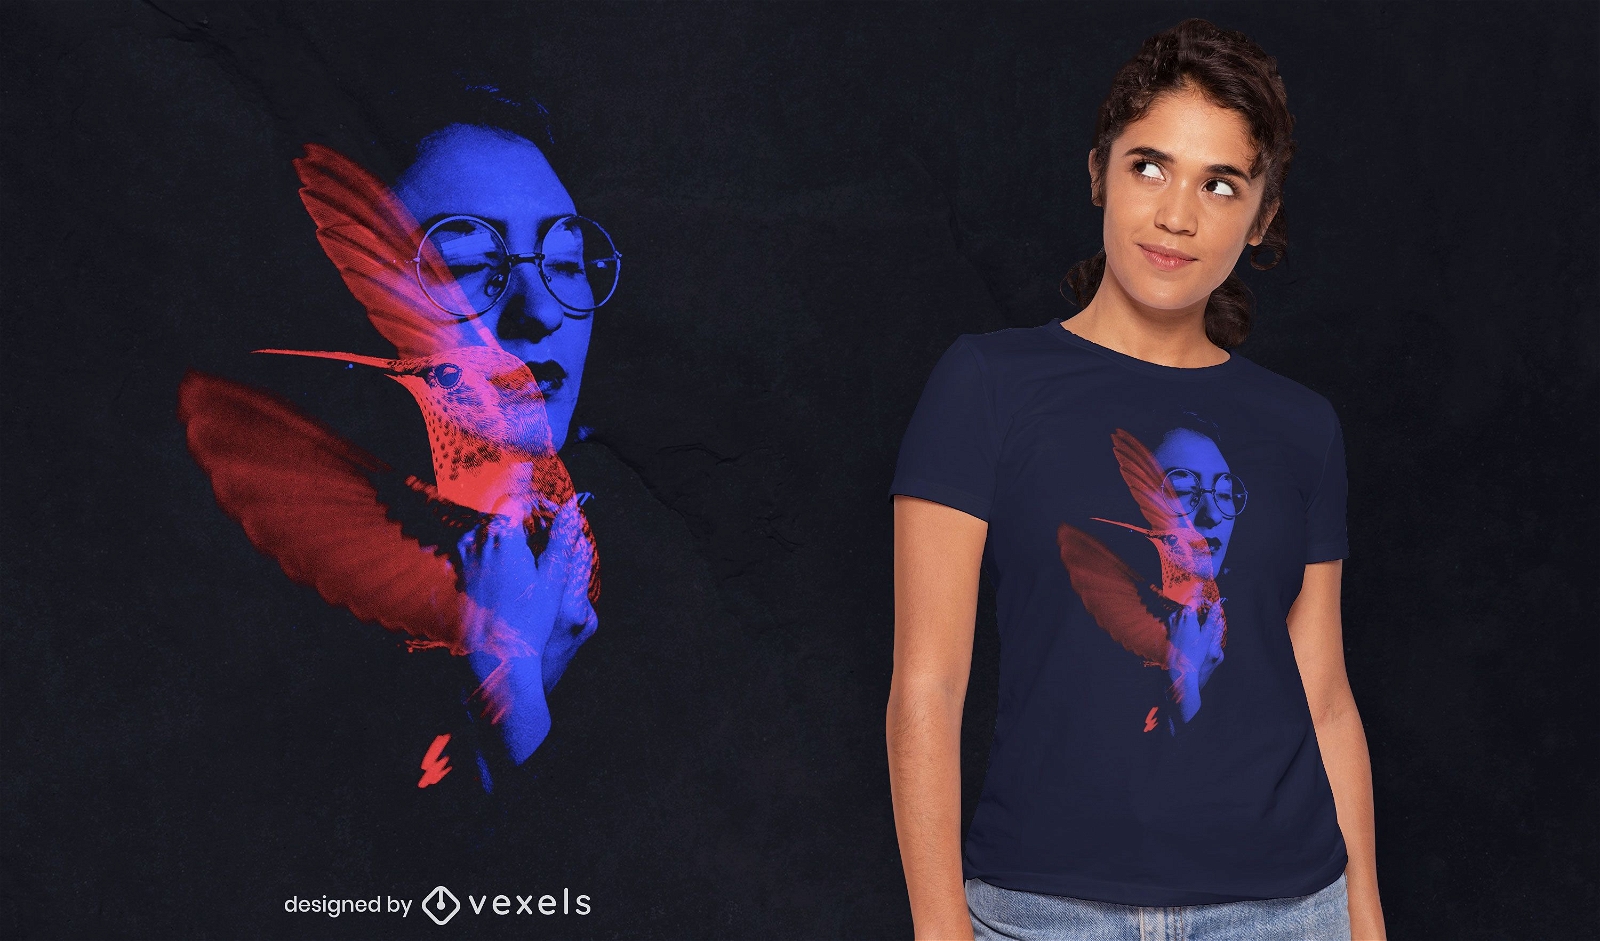
Desenho de camiseta psd de mulher e beija-flor
Escolha uma pasta
Todos os favoritos
Criar novo
Salvar
Desenho de camiseta psd de mulher e beija-flor
texto editável
Pronto para imprimir
para Merch
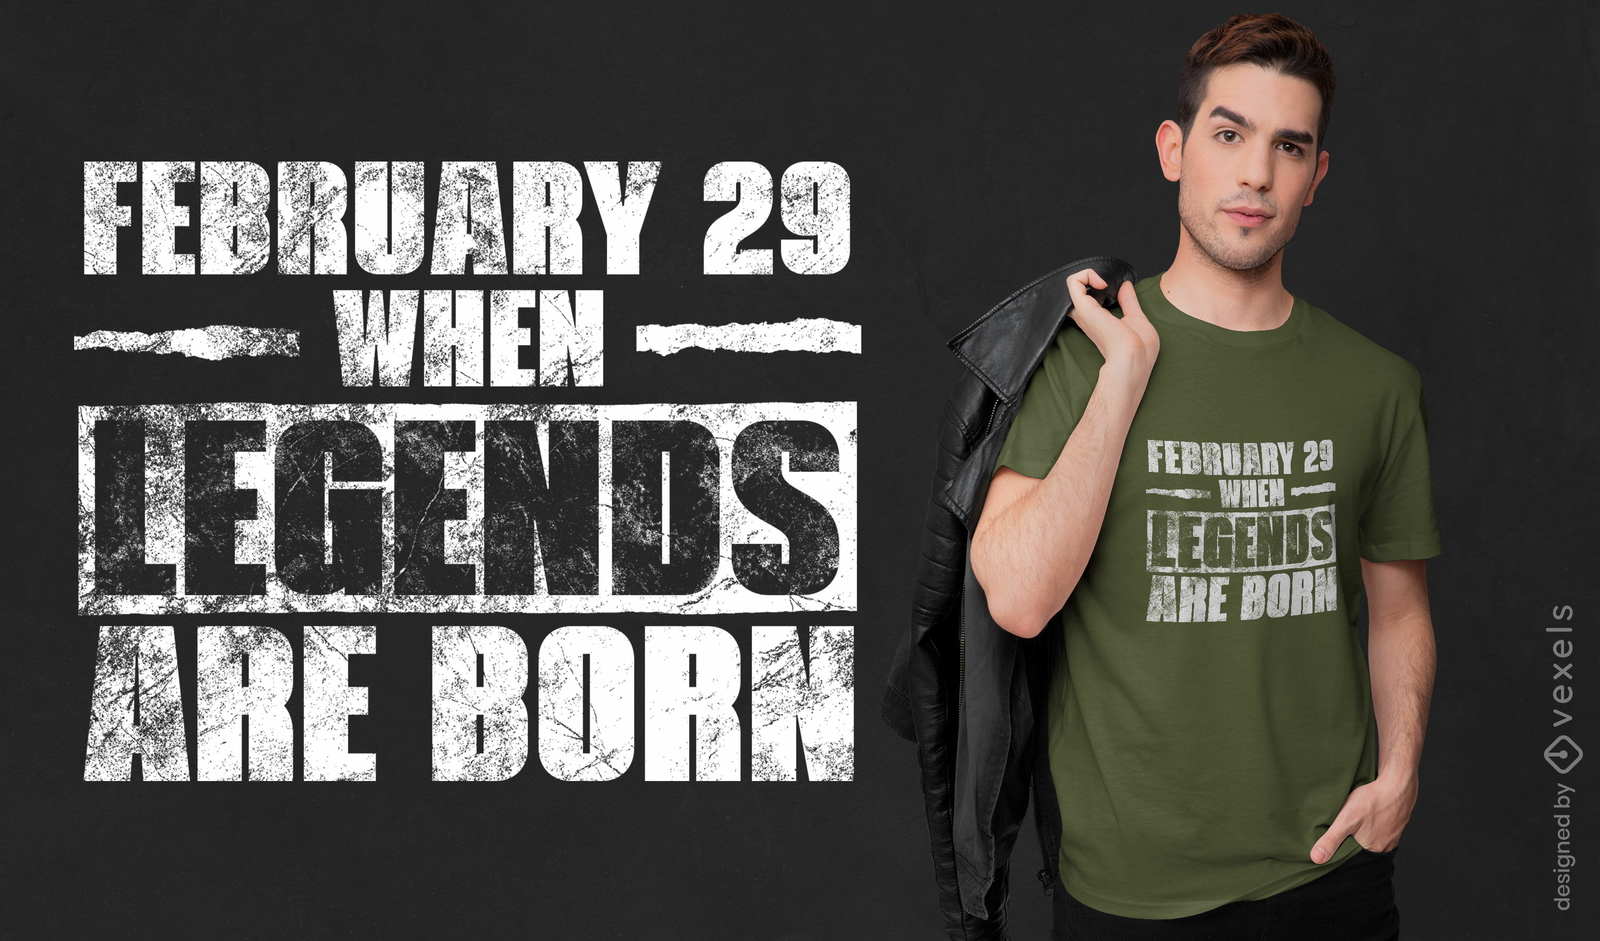
Design de camiseta com cita??o de anivers?rio para dia bissexto
Escolha uma pasta
Todos os favoritos
Criar novo
Salvar
Design de camiseta com cita??o de anivers?rio para dia bissexto
Pronto para imprimir
para Merch
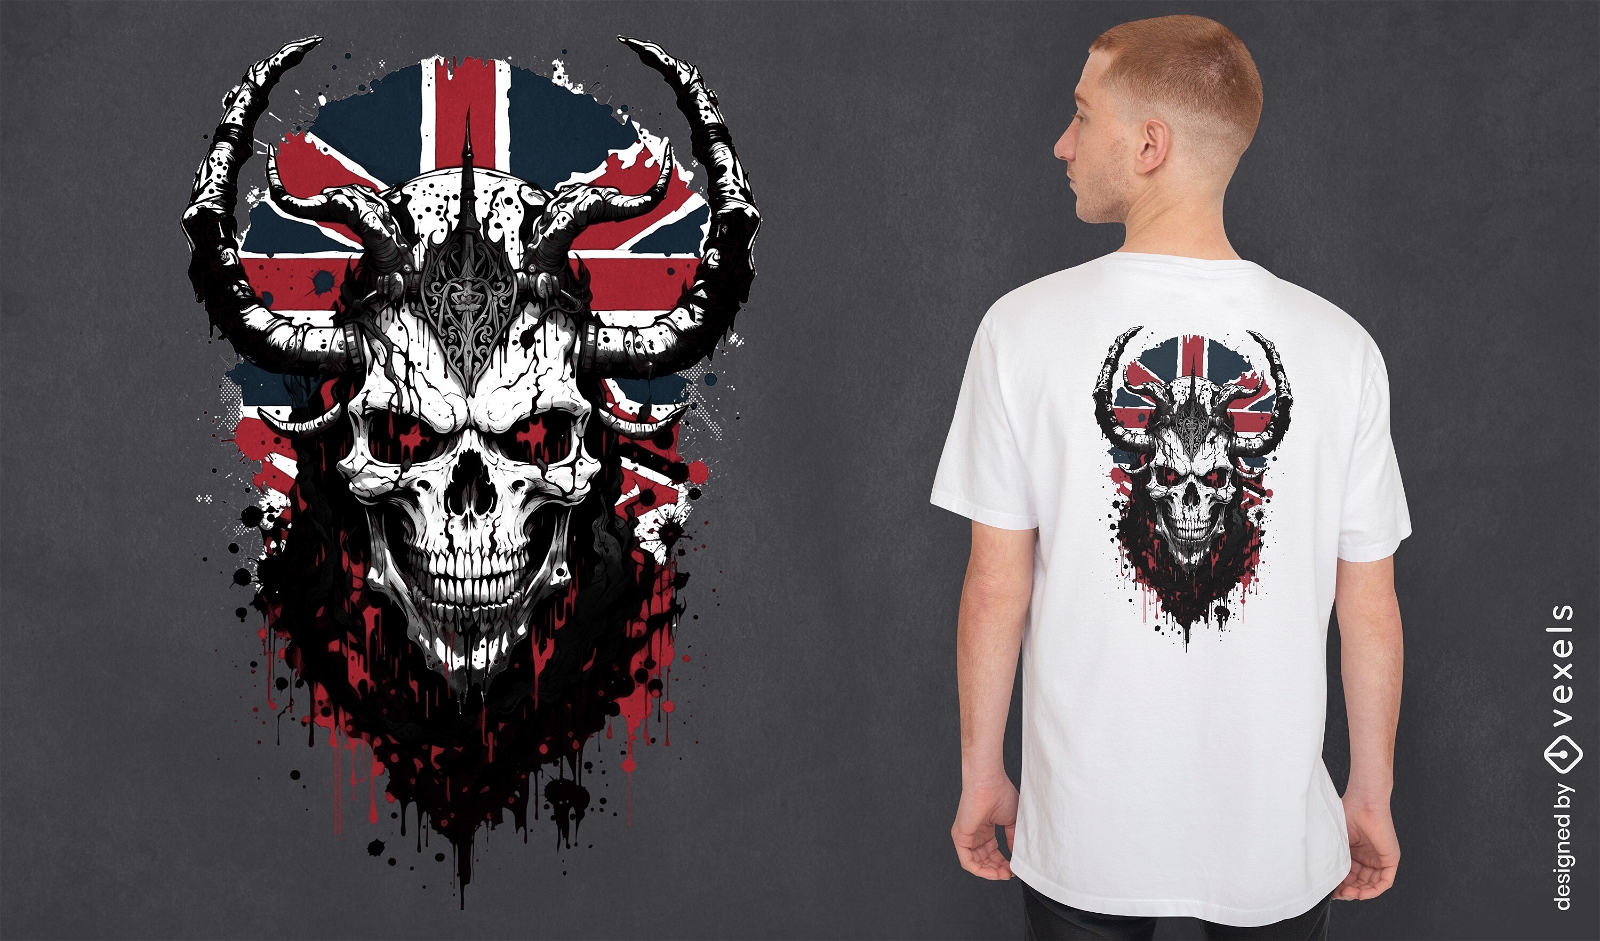
Design de camiseta com caveira Union Jack
Escolha uma pasta
Todos os favoritos
Criar novo
Salvar
Design de camiseta com caveira Union Jack
texto editável
Pronto para imprimir
para Merch
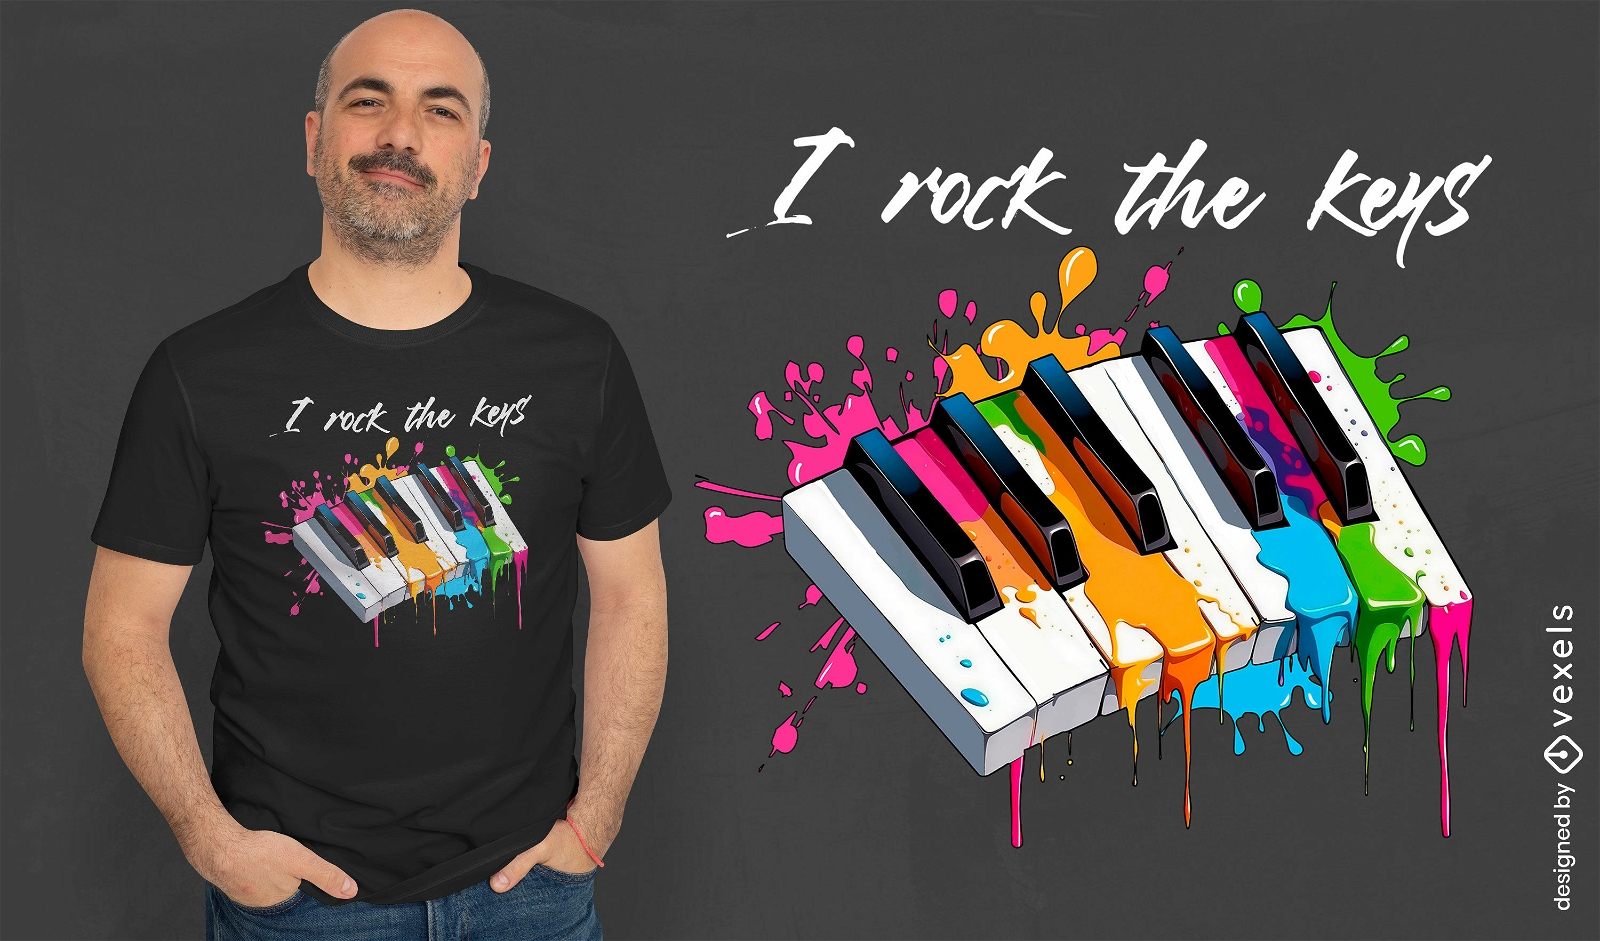
Design colorido de camisetas com teclas de piano
Escolha uma pasta
Todos os favoritos
Criar novo
Salvar
Design colorido de camisetas com teclas de piano
Gerado por IA, selecionado por nossos designers.
para Merch
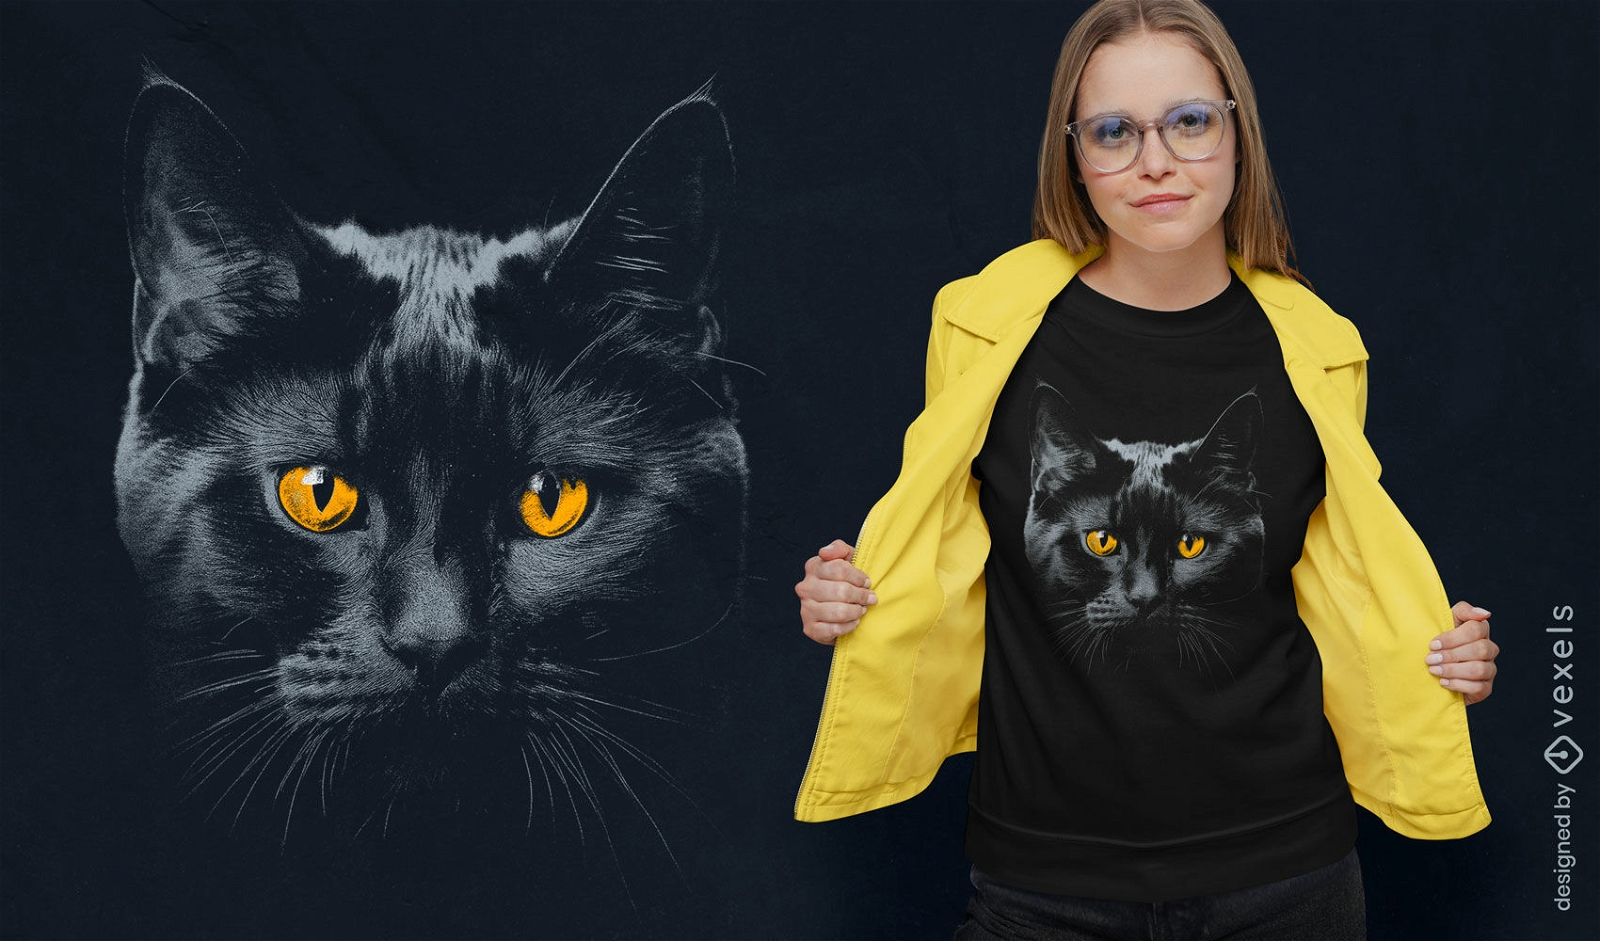
Design de camiseta de gato preto com olhos amarelos penetrantes
Escolha uma pasta
Todos os favoritos
Criar novo
Salvar
Design de camiseta de gato preto com olhos amarelos penetrantes
Gerado por IA, selecionado por nossos designers.
para Merch
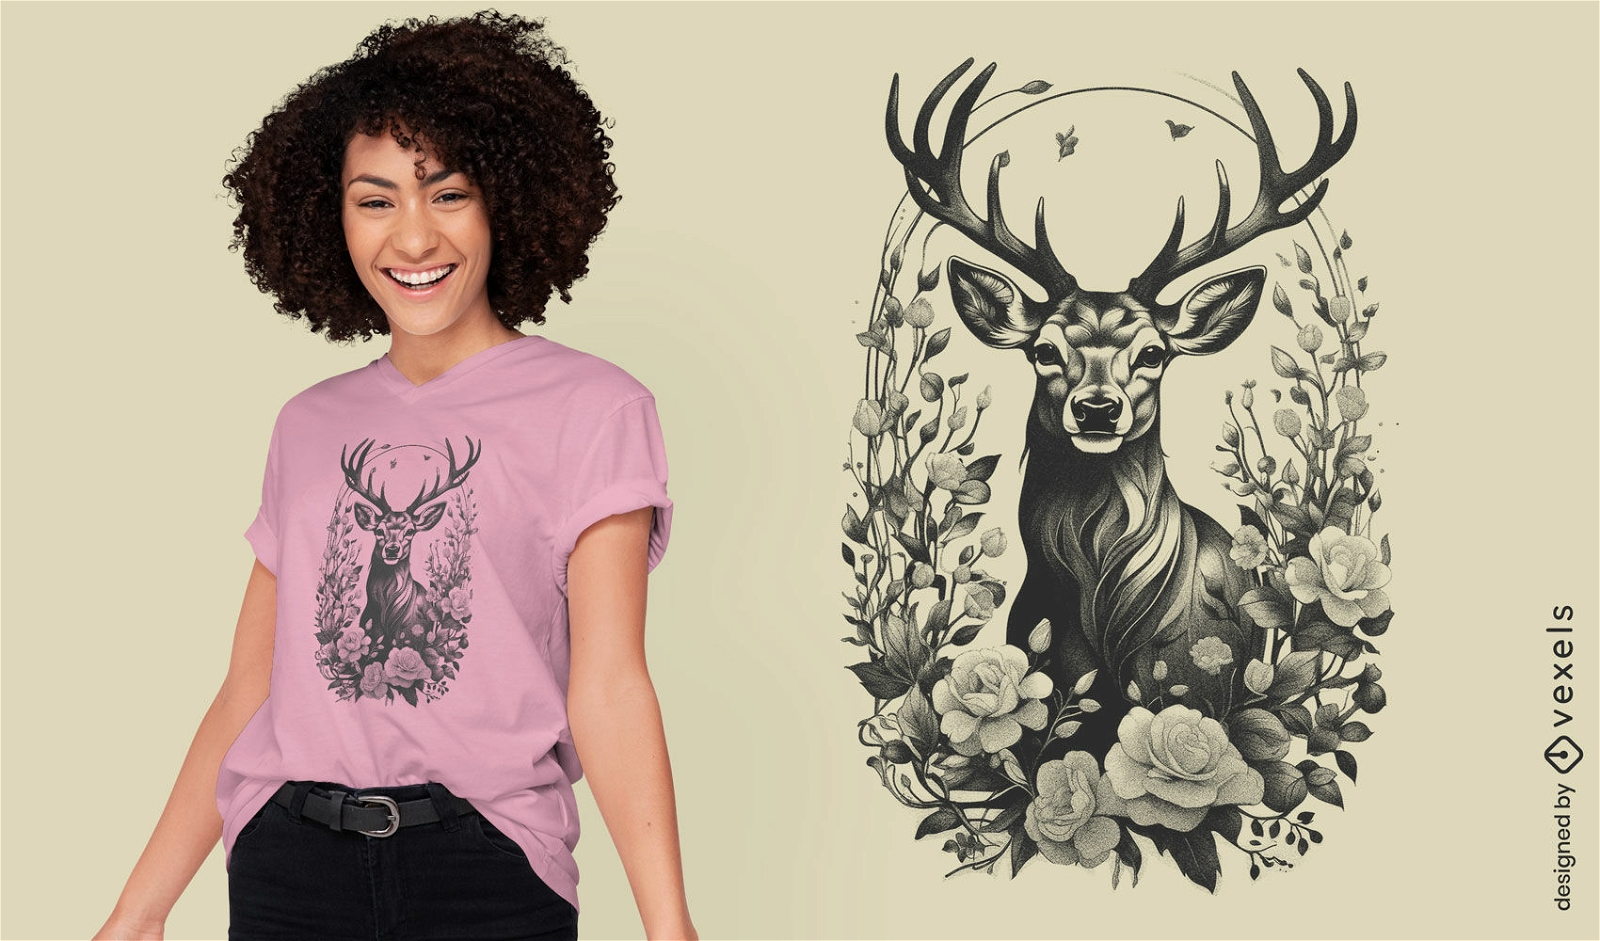
Design de camisetas com renas e flores
Escolha uma pasta
Todos os favoritos
Criar novo
Salvar
Design de camisetas com renas e flores
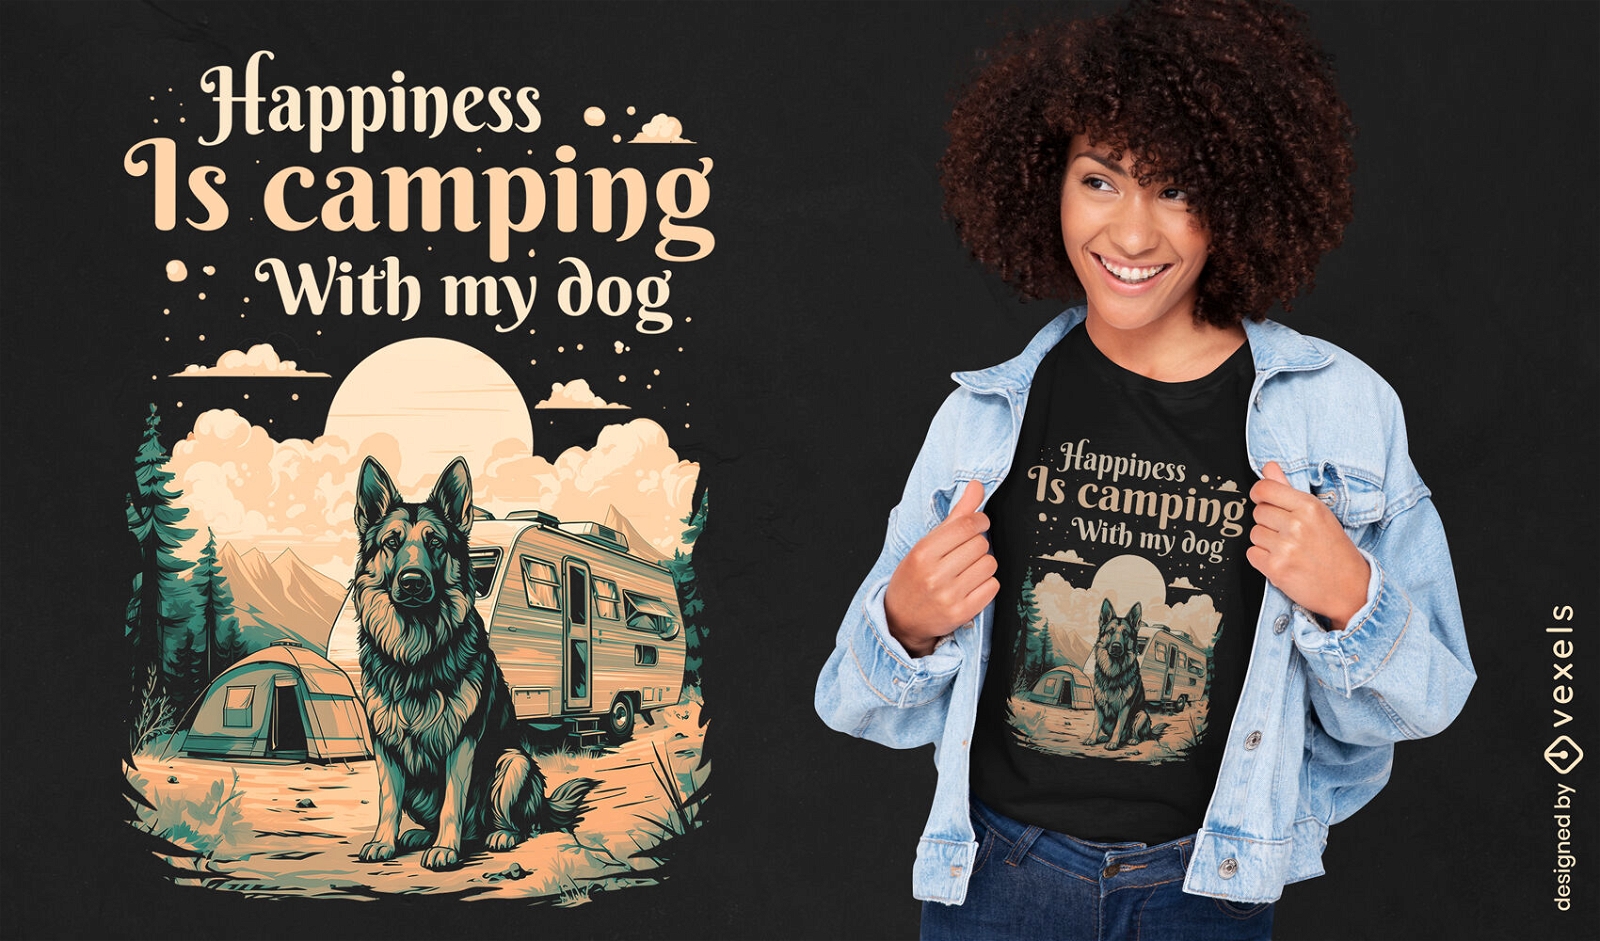
texto editável
Pronto para imprimir
para Merch
Design de camiseta para acampamento com cachorro
Escolha uma pasta
Todos os favoritos
Criar novo
Salvar
Design de camiseta para acampamento com cachorro
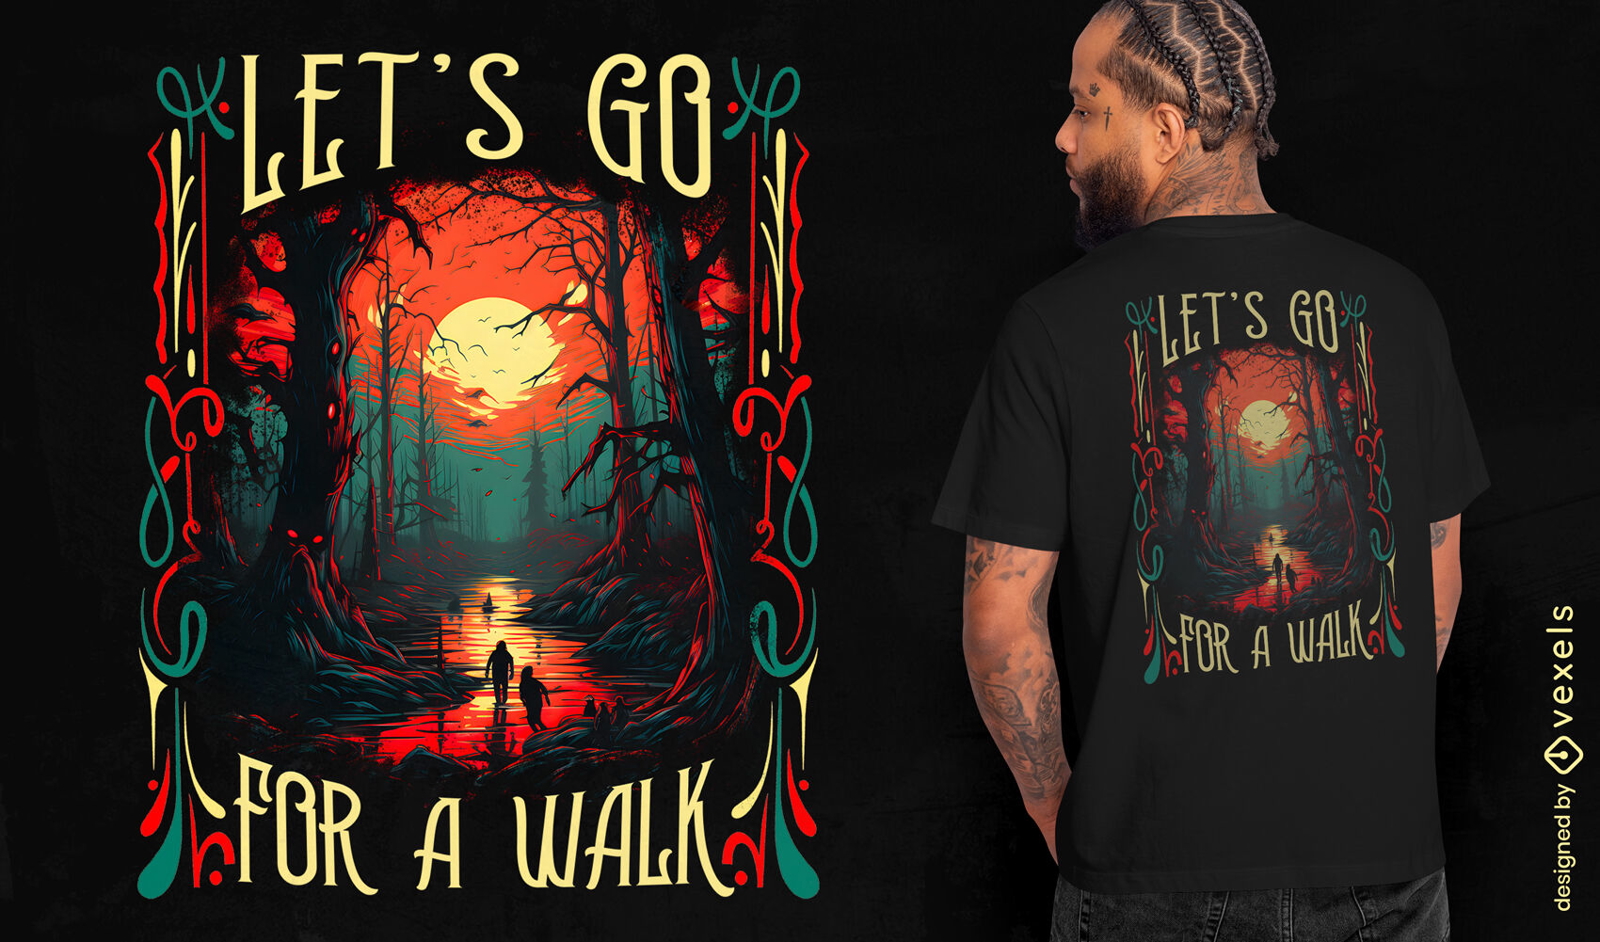
Gerado por IA, selecionado por nossos designers.
para Merch
Design de camiseta da floresta escura
Escolha uma pasta
Todos os favoritos
Criar novo
Salvar
Design de camiseta da floresta escura
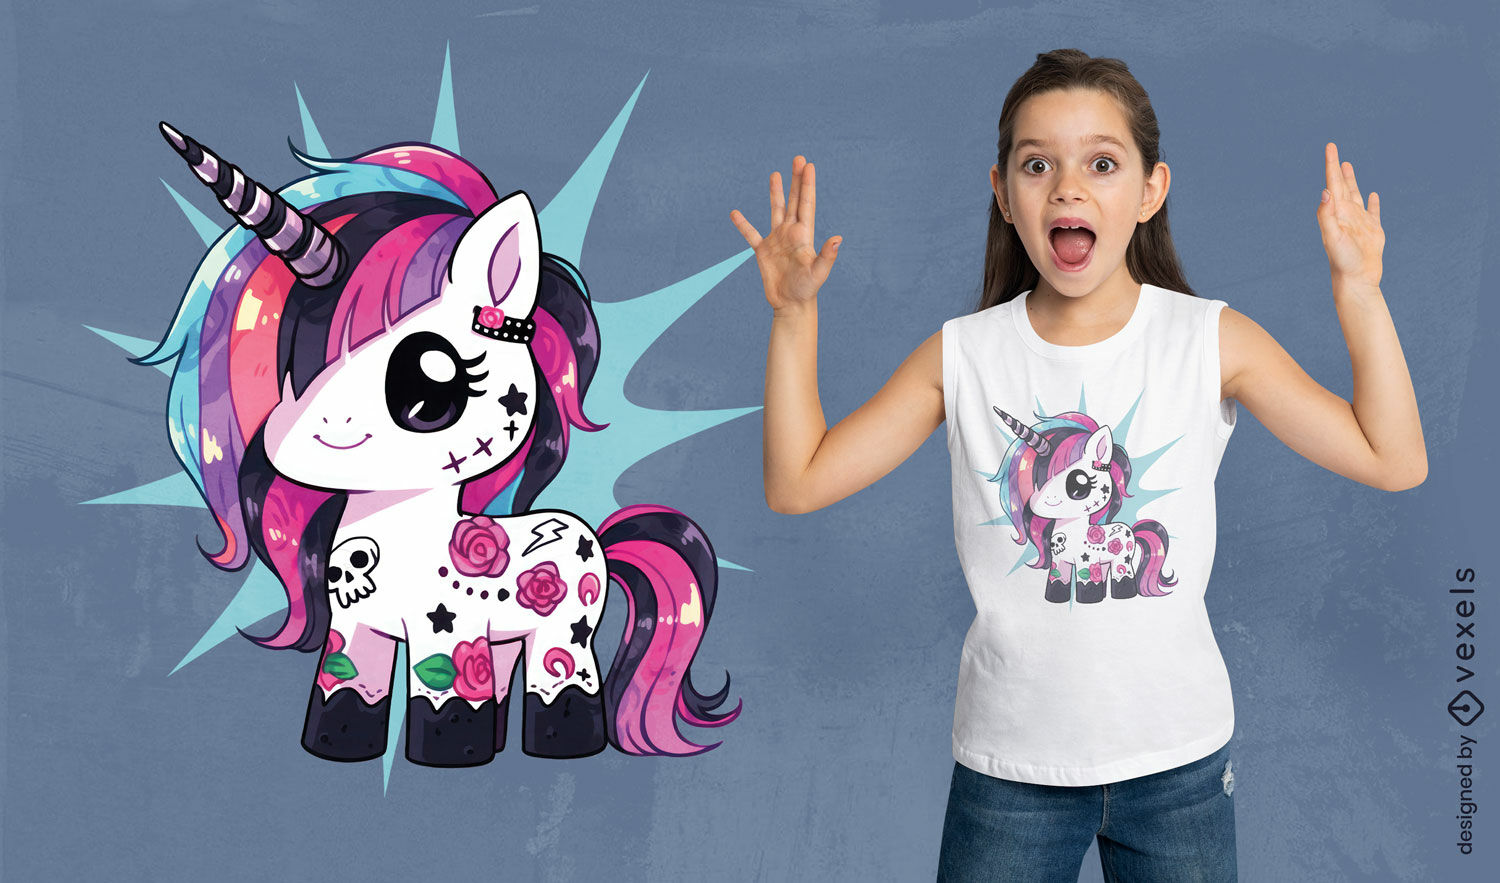
Gerado por IA, selecionado por nossos designers.
para Merch
Design adorável de camiseta punk com unicórnio
Escolha uma pasta
Todos os favoritos
Criar novo
Salvar
Design adorável de camiseta punk com unicórnio
Impulsione seu negócio
Com a plataforma gráfica líder de mercado.
Ver planos
Próxima
do 67
prev page
next page