Biblioteca de design
Novos designs Merch
Camisetas
Vectores
Designs de Merch de Tendência
PNGs & SVGs
Mockups
Modelos de T-Shirt PSD
Explorar Desenhos
Designs KDP
Pôsteres
Canecas
Capas para celular
Sacos de compras
Almofadas
Ferramentas de desenho
Merch Designer
Novo!
Mockup Generator
Gerador de Design de AI
Vetorizador
Quote Generator
T-Shirt Maker (Antigo)
Ajuda
Merch Digest
Blog
Centro de Ajuda
Saiba mais sobre o Merch
Feedback
Soluções Corporativas
Empresa
Acesso à API
Estúdio de Design
Design em Lote
Preços
Carregando...
Inscrever-se
Conecte-se
Merch Vectors
graficos
Biblioteca de design
Novos designs Merch
Camisetas
Vectores
Designs de Merch de Tendência
PNGs & SVGs
Mockups
Modelos de T-Shirt PSD
Explorar Desenhos
Designs KDP
Pôsteres
Canecas
Capas para celular
Sacos de compras
Almofadas
Ferramentas de desenho
Merch Designer
Novo!
Mockup Generator
Gerador de Design de AI
Vetorizador
Quote Generator
T-Shirt Maker (Antigo)
Ajuda
Merch Digest
Blog
Centro de Ajuda
Saiba mais sobre o Merch
Feedback
Soluções Corporativas
Empresa
Acesso à API
Estúdio de Design
Design em Lote
PLANOS
Merch Vectors
graficos
27291 Designs Vetoriais de graficos para Camisetas e Merch
Baixar e comprar Designs Vetoriais AI de graficos para Camisetas, Capas do Celular, Capas do Livros e outros produtos Merch
Relacionado:
graficos vetoriais
,
desenhos graficos de ações
,
graficos tridimensionais
Ordenar por
Mais relevante
Resultados patrocinados da
Ganhe 15% de desconto com o código: VEXELS15
veja mais detalhes
texto editável
Pronto para imprimir
para Merch
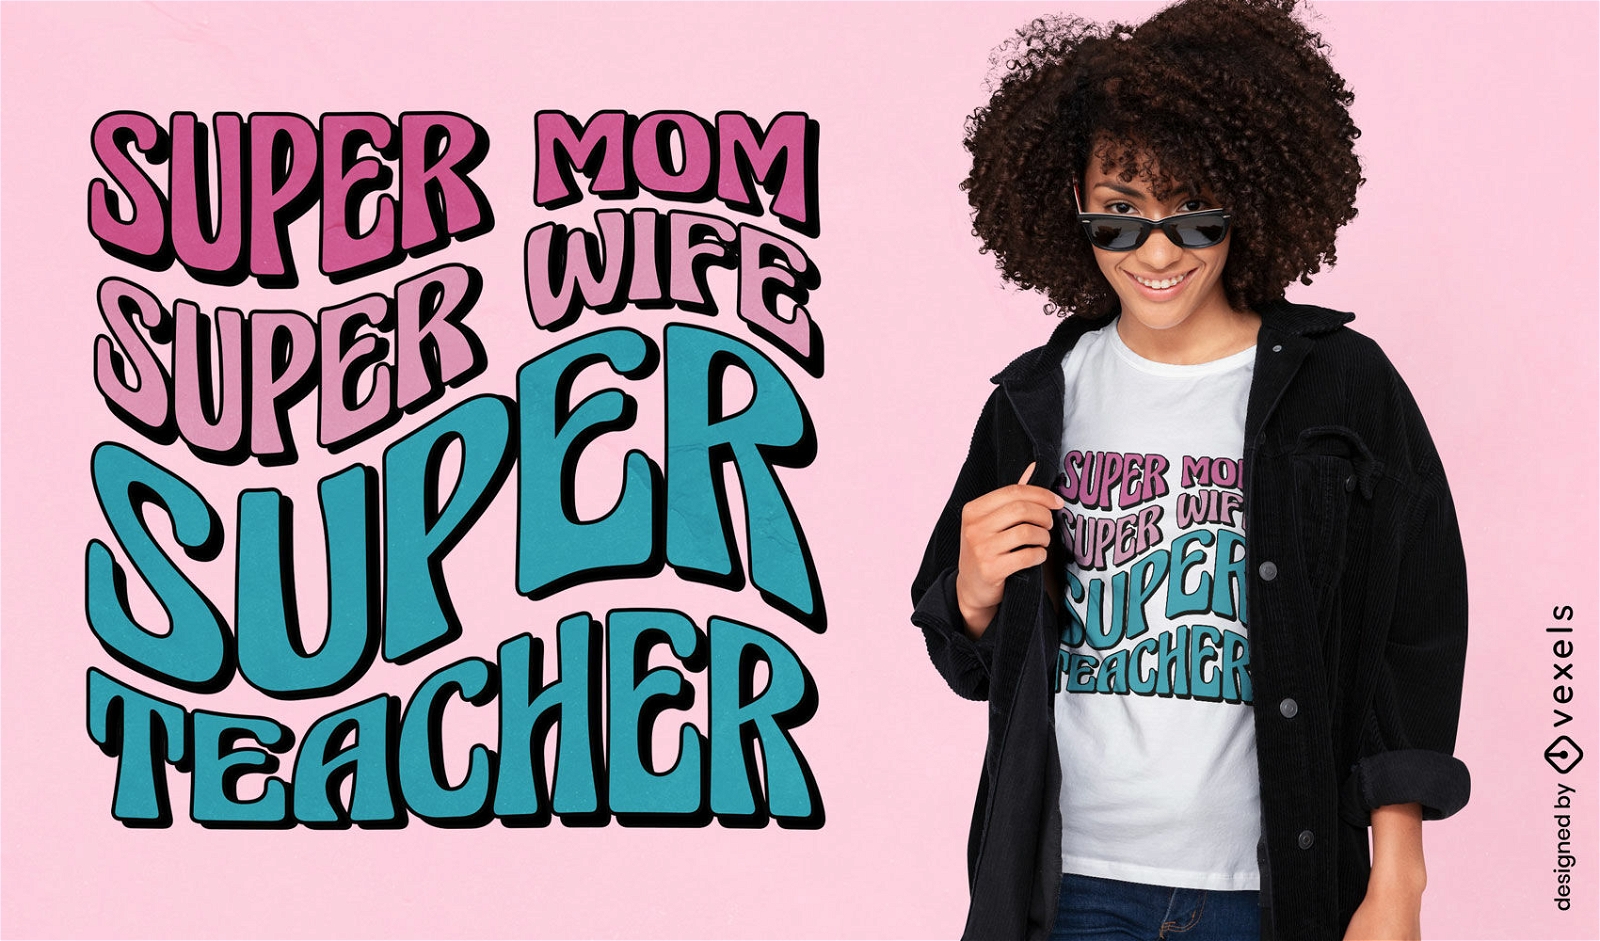
Super professor cita design de camiseta
Escolha uma pasta
Todos os favoritos
Criar novo
Salvar
Super professor cita design de camiseta
texto editável
Pronto para imprimir
para Merch
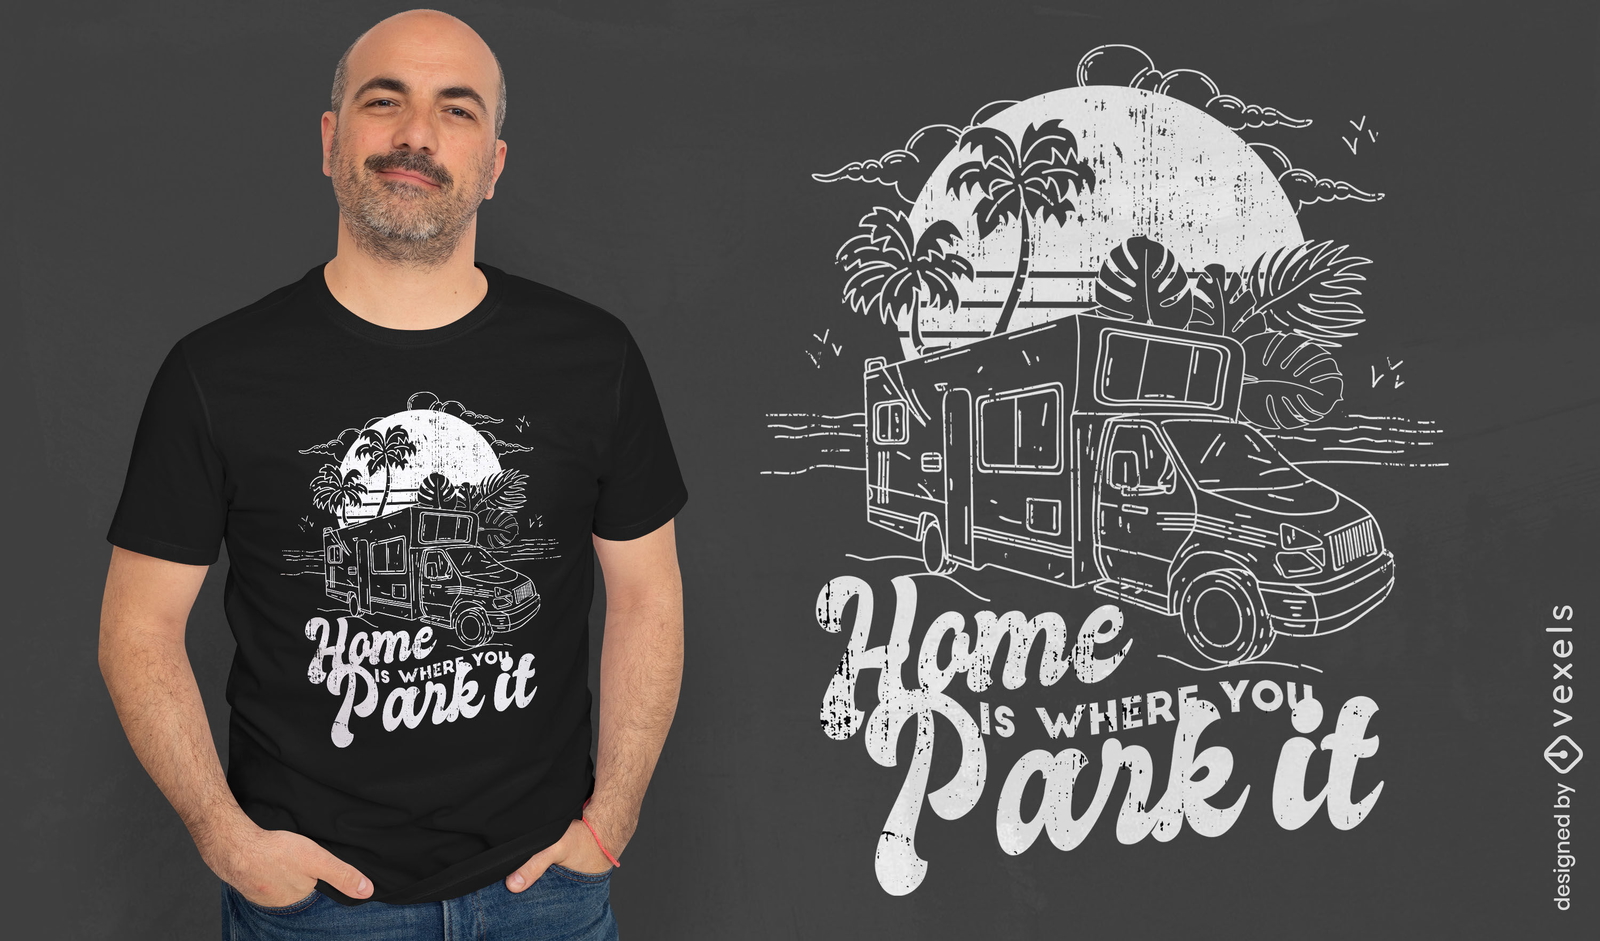
Design de camiseta desenhada à mão de van campista
Escolha uma pasta
Todos os favoritos
Criar novo
Salvar
Design de camiseta desenhada à mão de van campista
Pronto para imprimir
para Merch
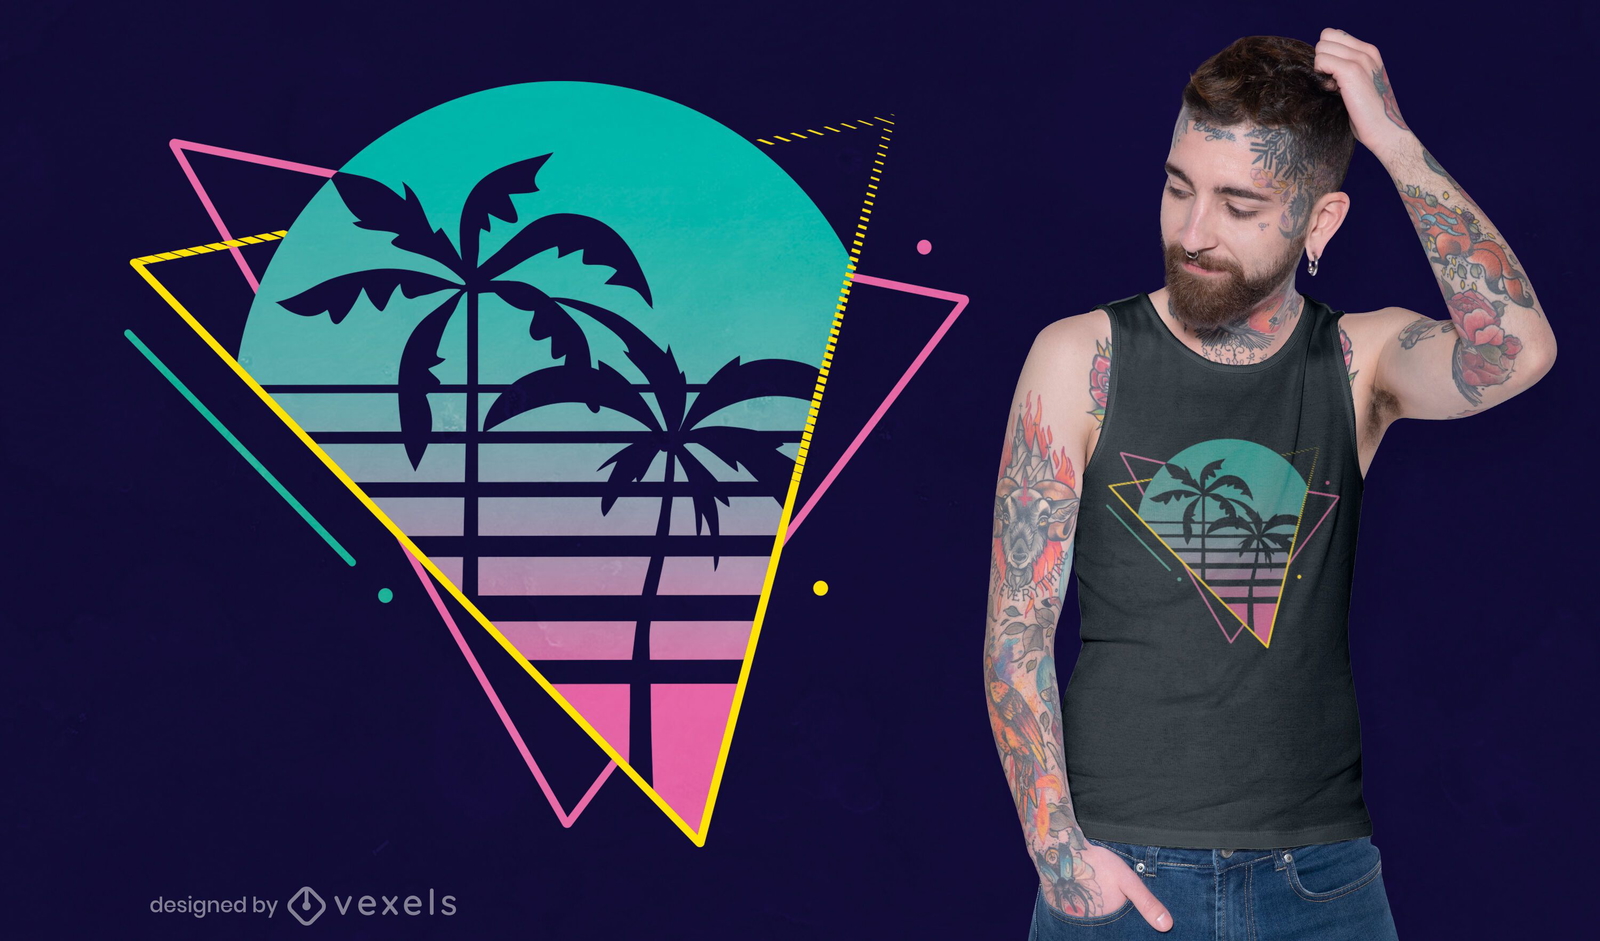
Design de t-shirt de palmeira neon
Escolha uma pasta
Todos os favoritos
Criar novo
Salvar
Design de t-shirt de palmeira neon
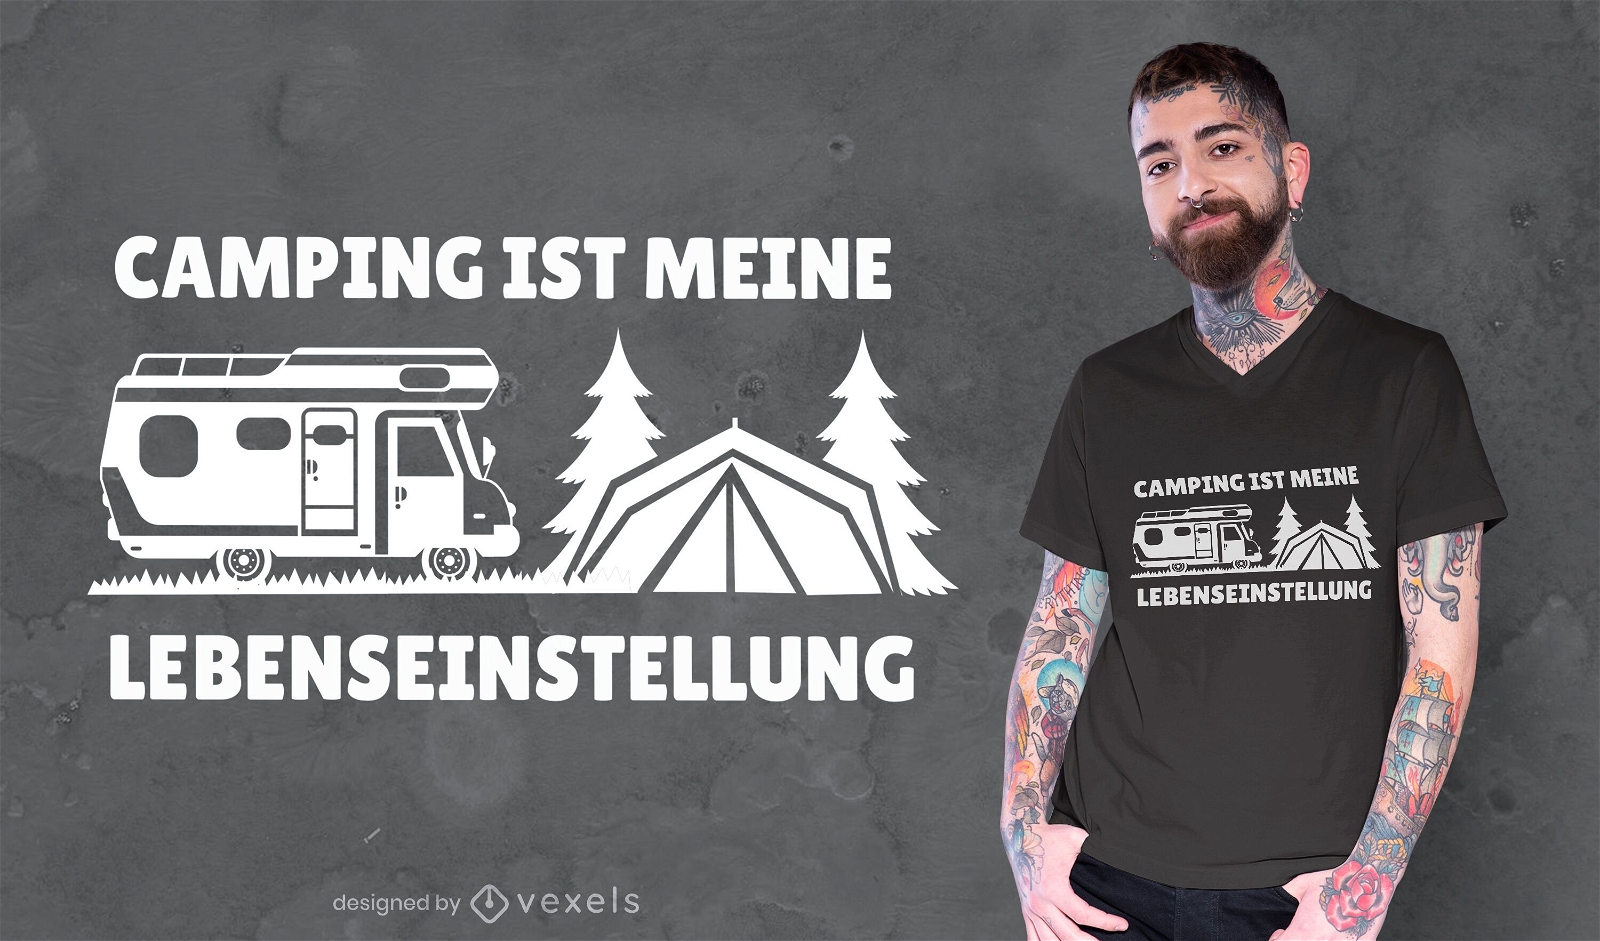
Conteúdo em alemão
Pronto para imprimir
para Merch
Citação de acampamento design de camiseta alemã
Escolha uma pasta
Todos os favoritos
Criar novo
Salvar
Citação de acampamento design de camiseta alemã
Pronto para imprimir
para Merch
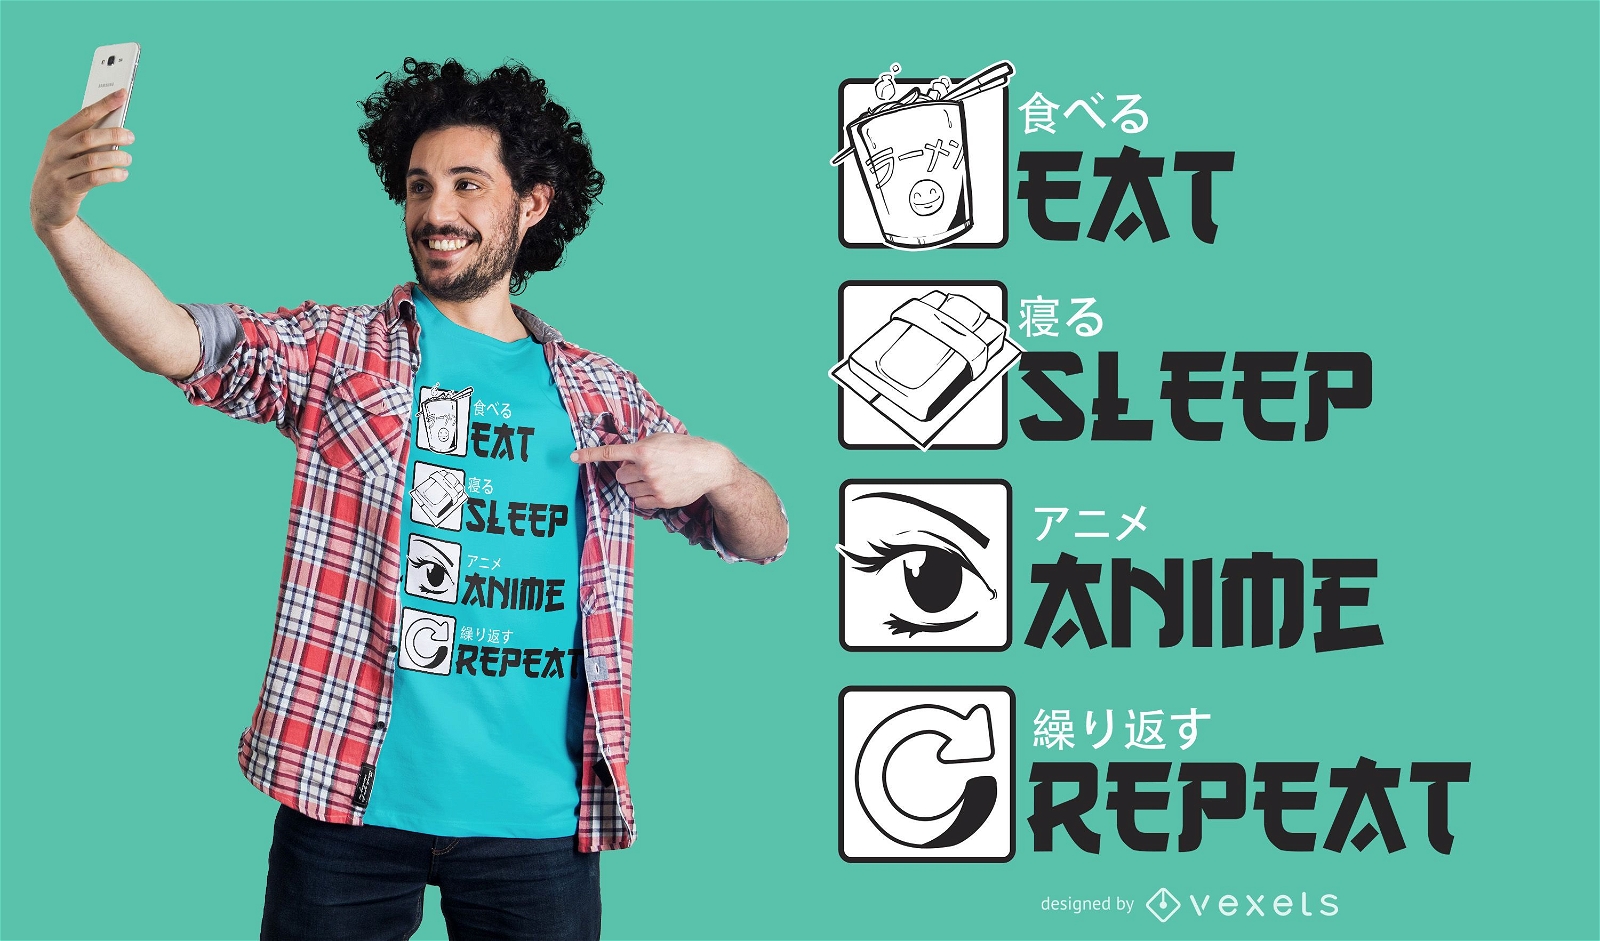
Design de camisetas de anime para dormir e dormir
Escolha uma pasta
Todos os favoritos
Criar novo
Salvar
Design de camisetas de anime para dormir e dormir
para Merch
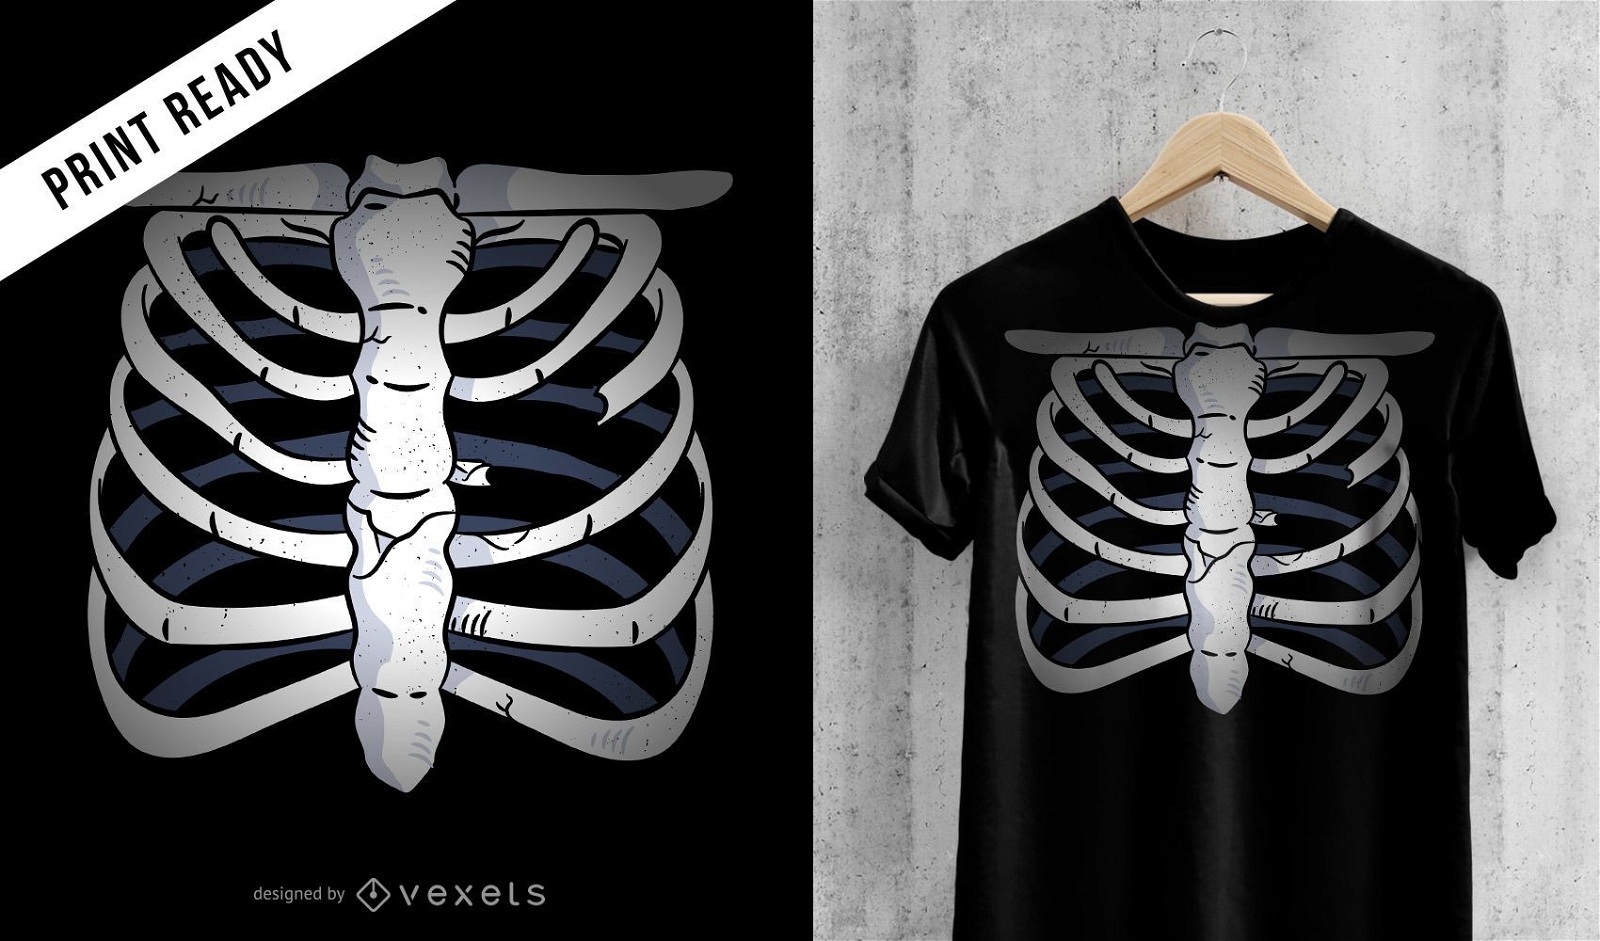
Desenho de t-shirt de esqueleto de peito
Escolha uma pasta
Todos os favoritos
Criar novo
Salvar
Desenho de t-shirt de esqueleto de peito
Pronto para imprimir
para Merch
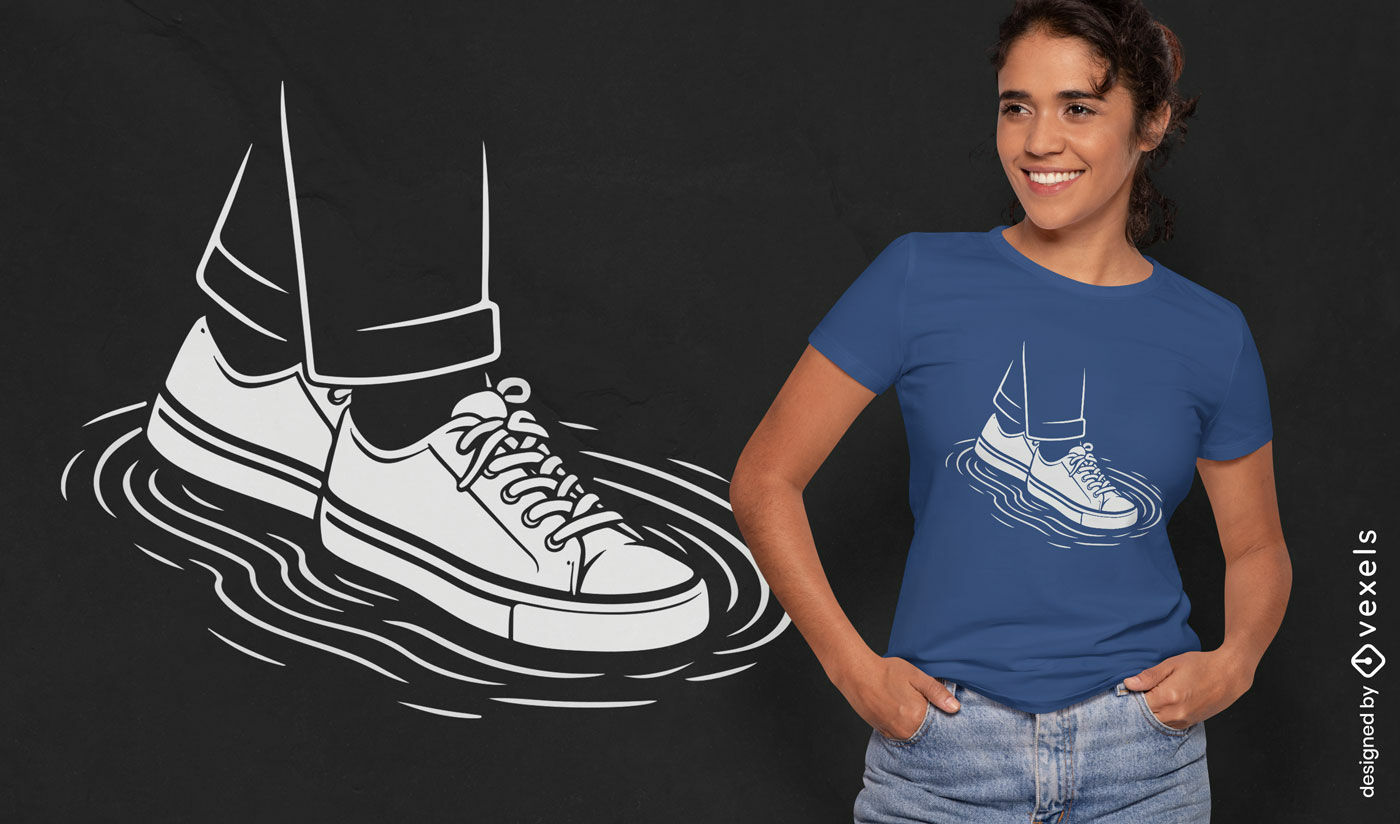
Design de camiseta com tênis em poça
Escolha uma pasta
Todos os favoritos
Criar novo
Salvar
Design de camiseta com tênis em poça
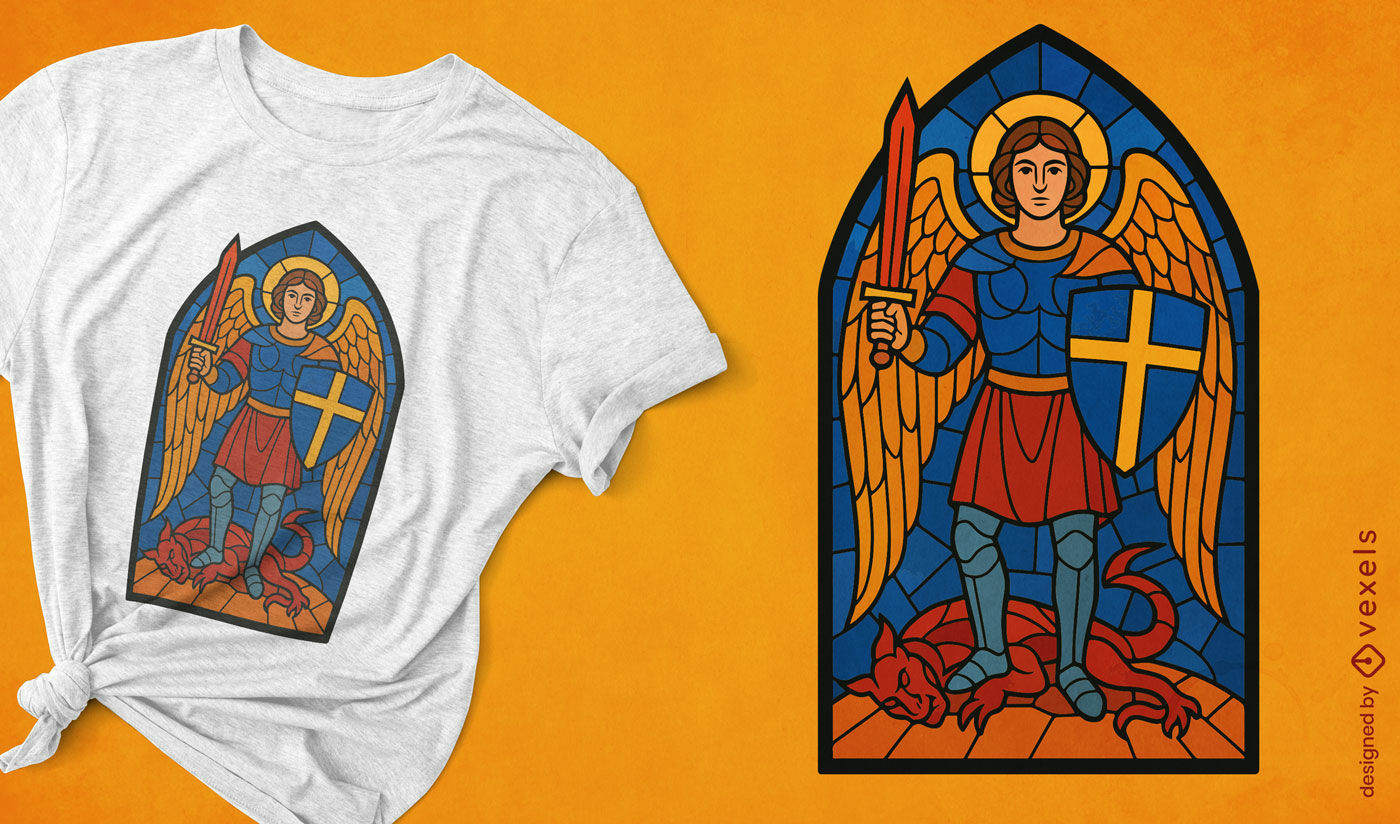
Gerado por IA, selecionado por nossos designers.
para Merch
Design de camiseta com vitral de São Miguel
Escolha uma pasta
Todos os favoritos
Criar novo
Salvar
Design de camiseta com vitral de São Miguel
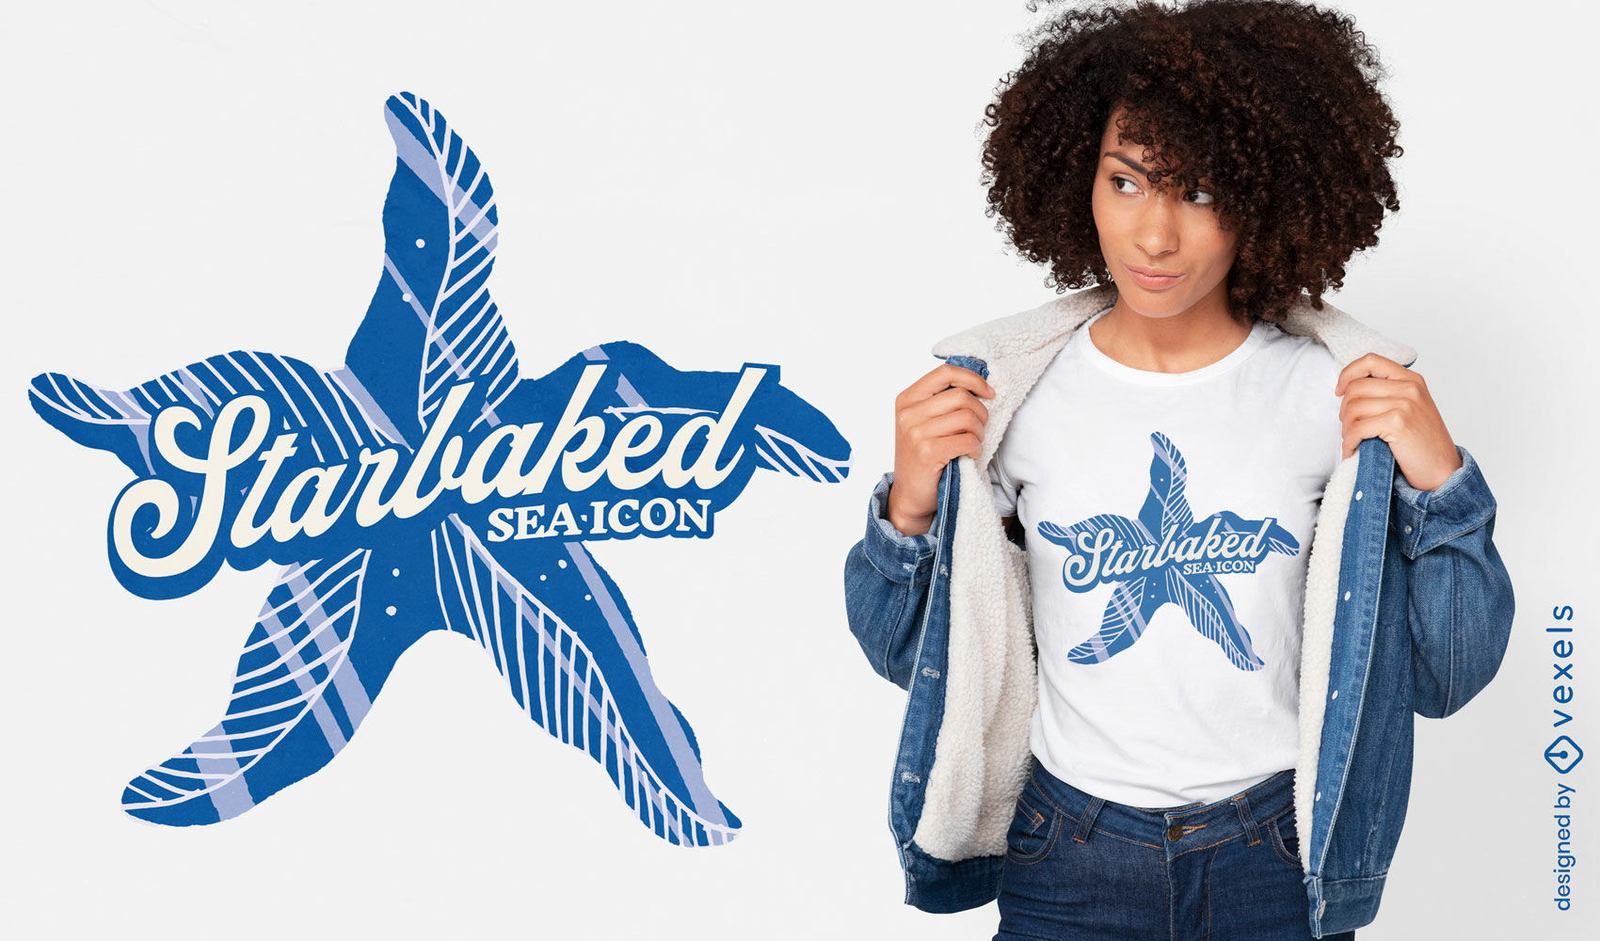
texto editável
Pronto para imprimir
para Merch
Design de camiseta com ícone de estrela do mar
Escolha uma pasta
Todos os favoritos
Criar novo
Salvar
Design de camiseta com ícone de estrela do mar
texto editável
Pronto para imprimir
para Merch
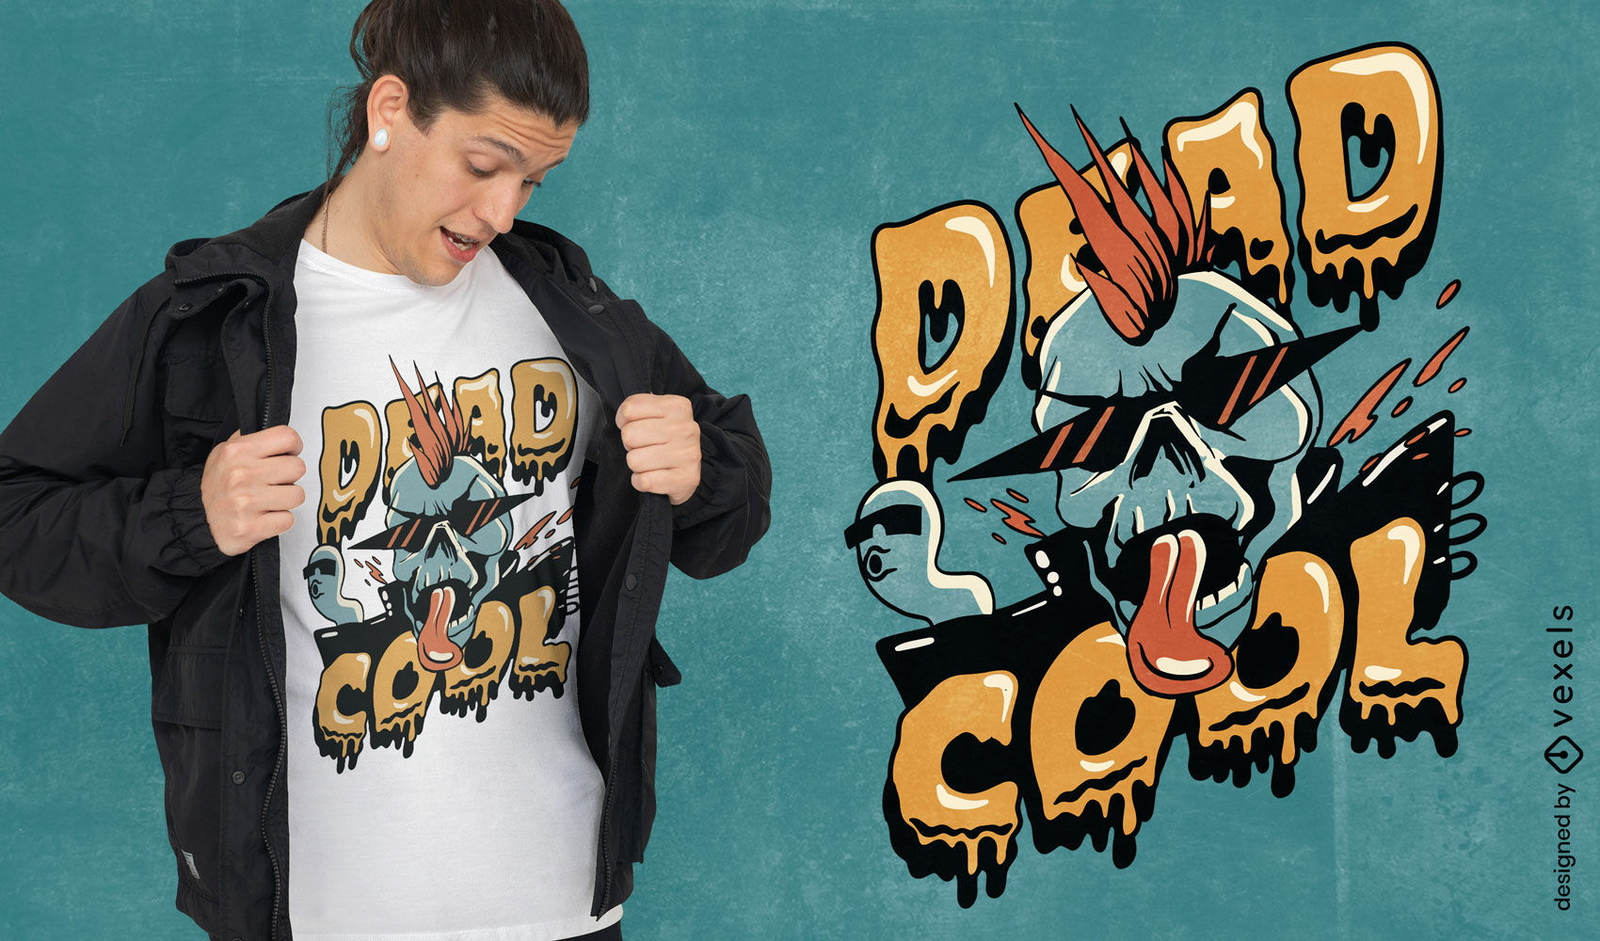
Design de camiseta de terror com esqueleto pingando
Escolha uma pasta
Todos os favoritos
Criar novo
Salvar
Design de camiseta de terror com esqueleto pingando
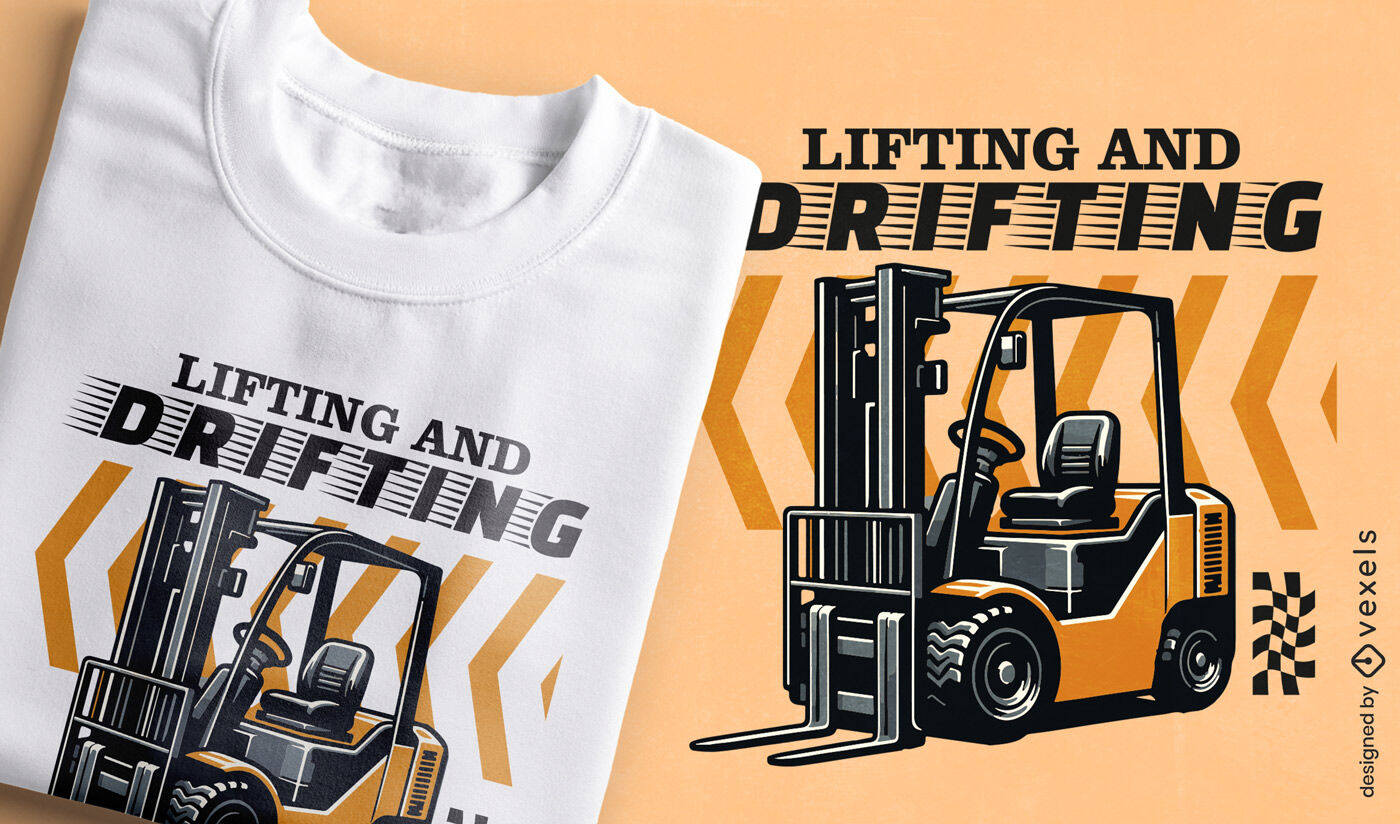
Gerado por IA, selecionado por nossos designers.
para Merch
Design de camiseta de corrida de empilhadeira
Escolha uma pasta
Todos os favoritos
Criar novo
Salvar
Design de camiseta de corrida de empilhadeira
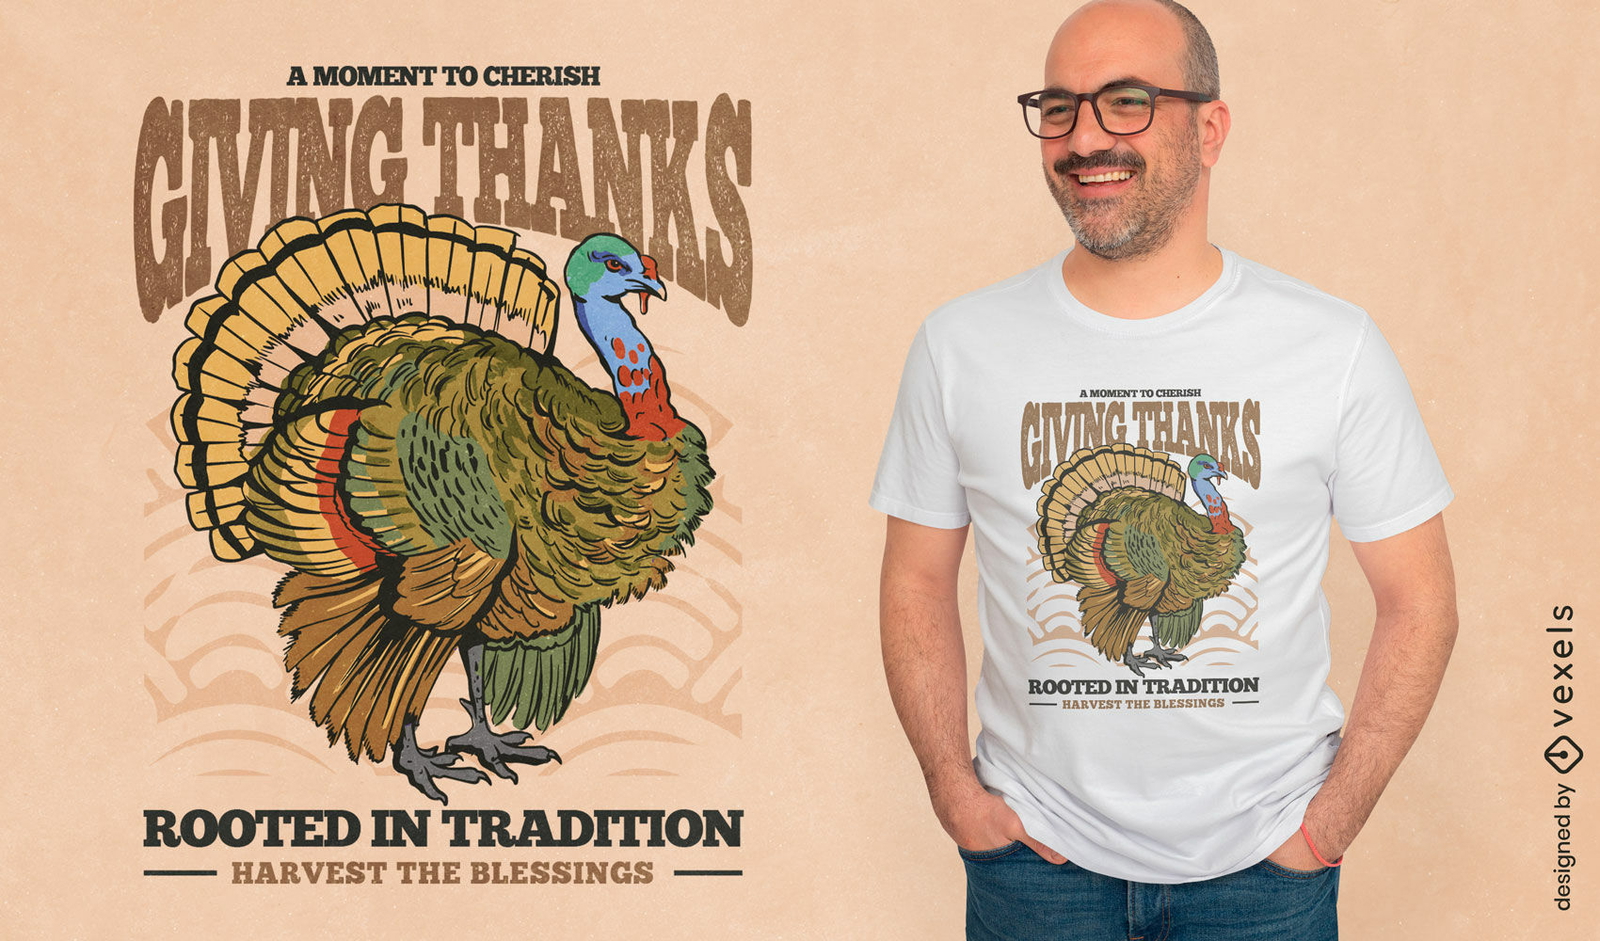
texto editável
Pronto para imprimir
para Merch
Design tradicional de camiseta com peru de Ação de Graças
Escolha uma pasta
Todos os favoritos
Criar novo
Salvar
Design tradicional de camiseta com peru de Ação de Graças
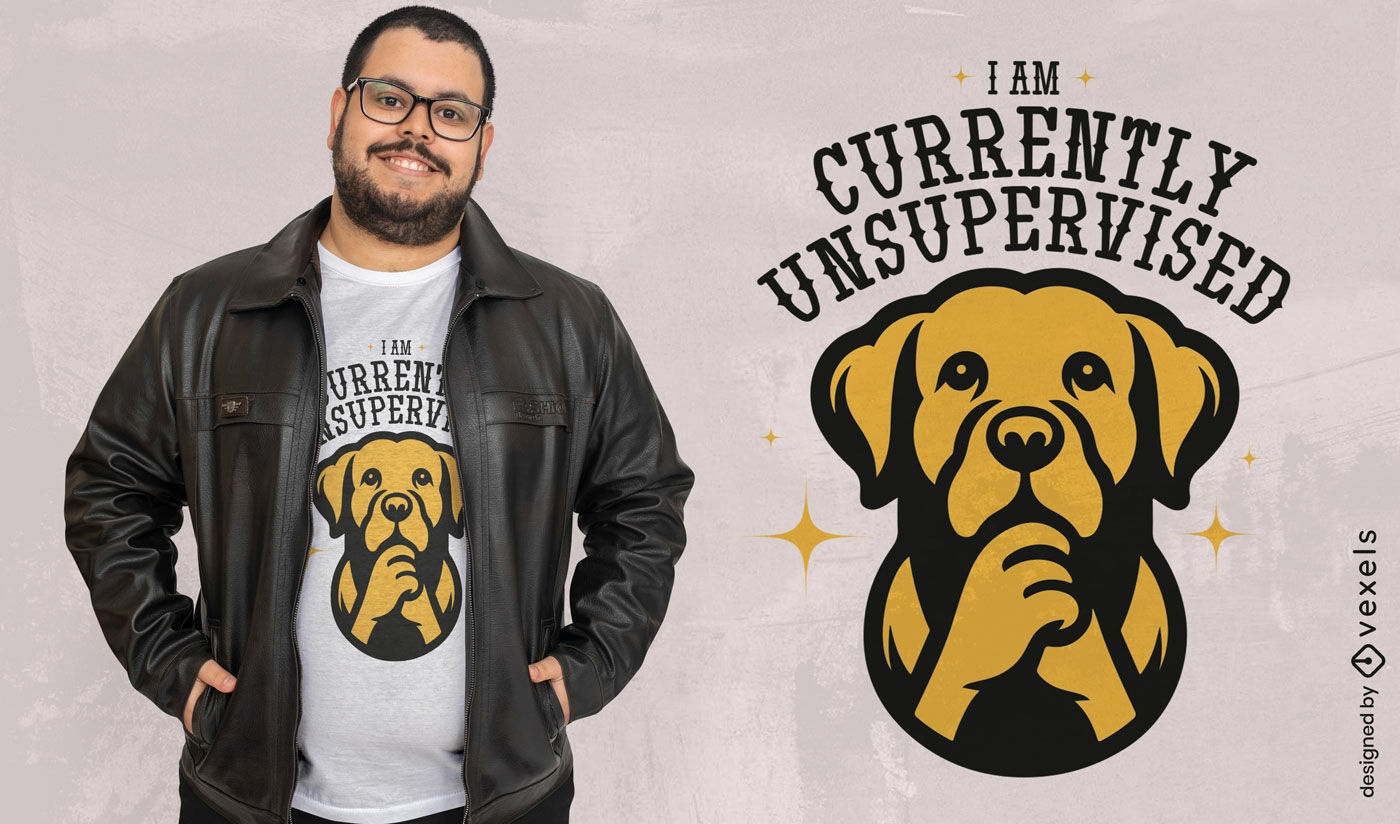
Gerado por IA, selecionado por nossos designers.
para Merch
Design de camiseta para cachorro sem supervisão
Escolha uma pasta
Todos os favoritos
Criar novo
Salvar
Design de camiseta para cachorro sem supervisão
texto editável
Pronto para imprimir
para Merch
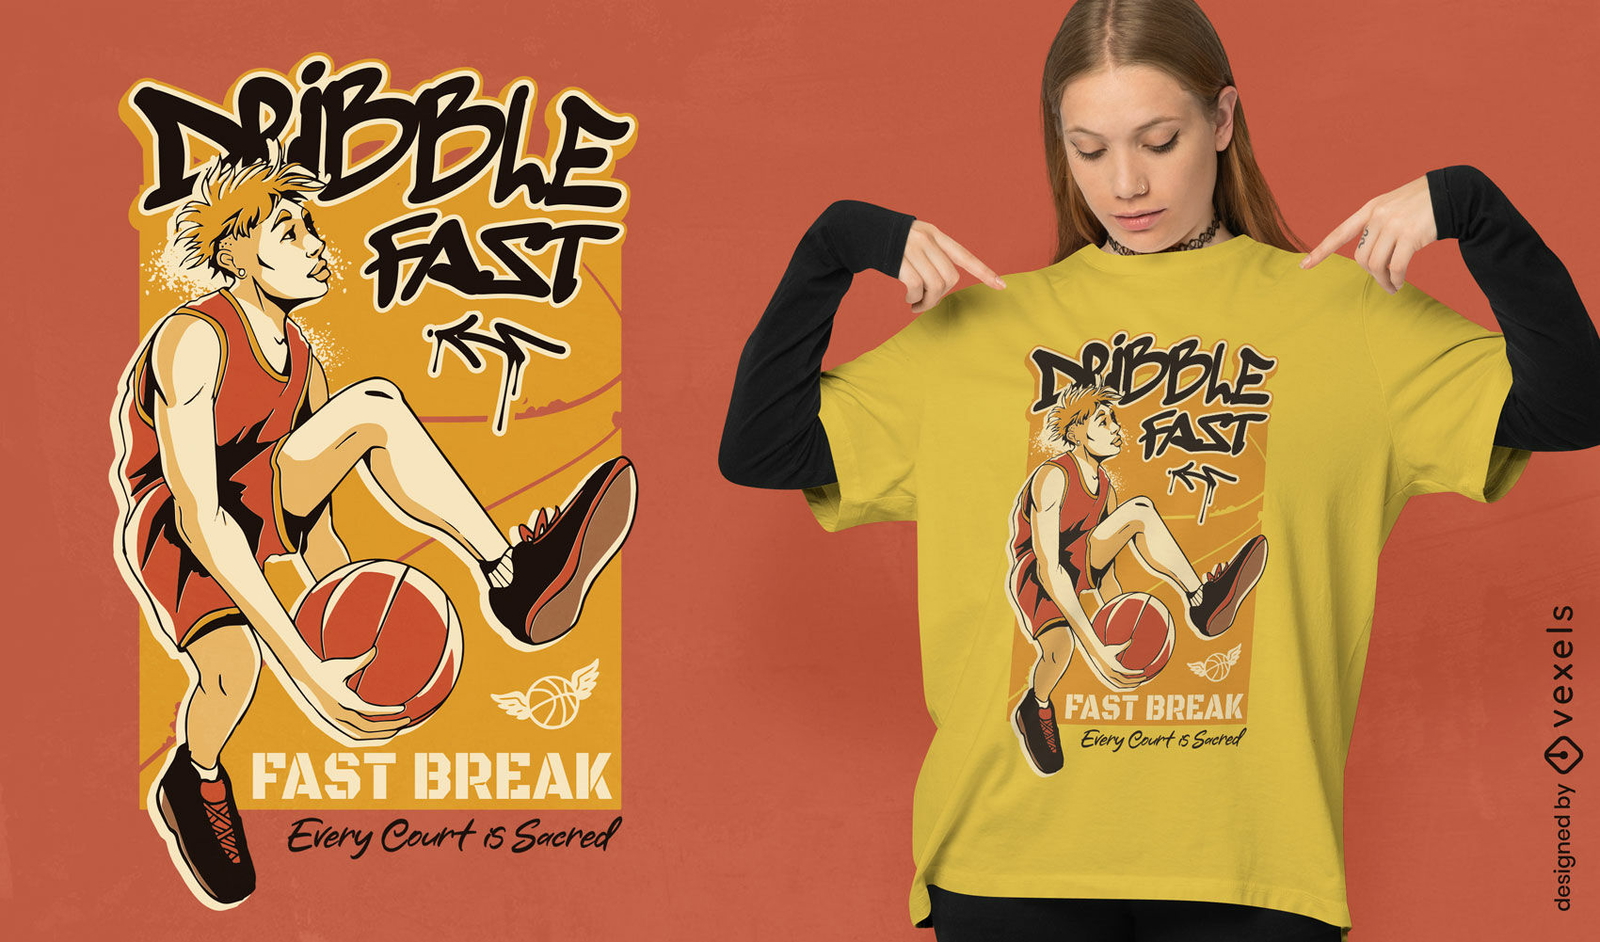
Design de camiseta de basquete com drible rápido
Escolha uma pasta
Todos os favoritos
Criar novo
Salvar
Design de camiseta de basquete com drible rápido
Gerado por IA, selecionado por nossos designers.
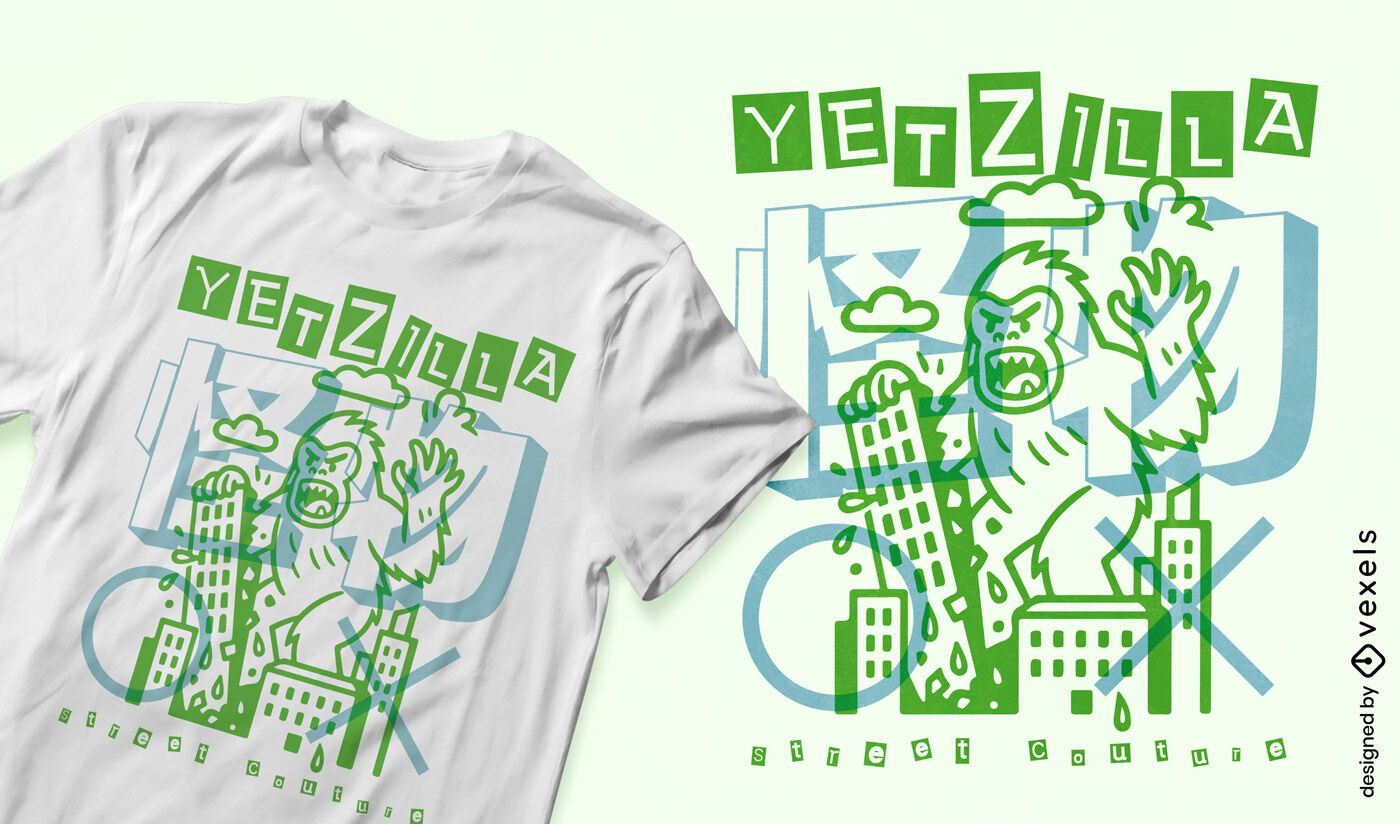
para Merch
Design de camiseta com a destruição da cidade do monstro Yeti
Escolha uma pasta
Todos os favoritos
Criar novo
Salvar
Design de camiseta com a destruição da cidade do monstro Yeti
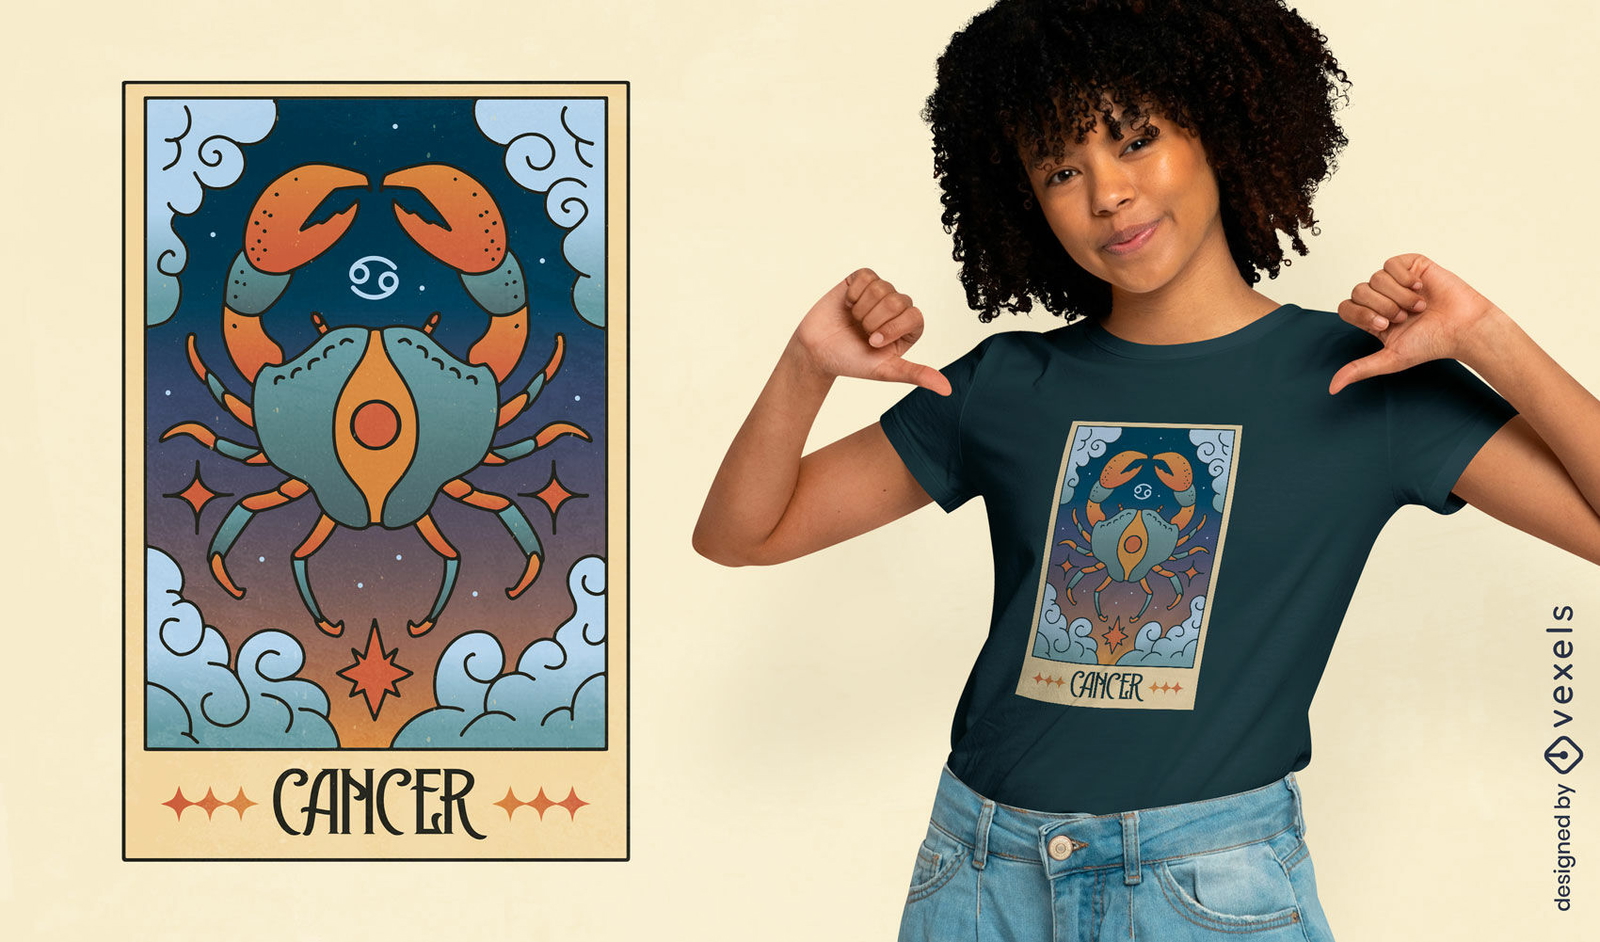
texto editável
Pronto para imprimir
para Merch
Design de camiseta com carta de tarô de câncer
Escolha uma pasta
Todos os favoritos
Criar novo
Salvar
Design de camiseta com carta de tarô de câncer
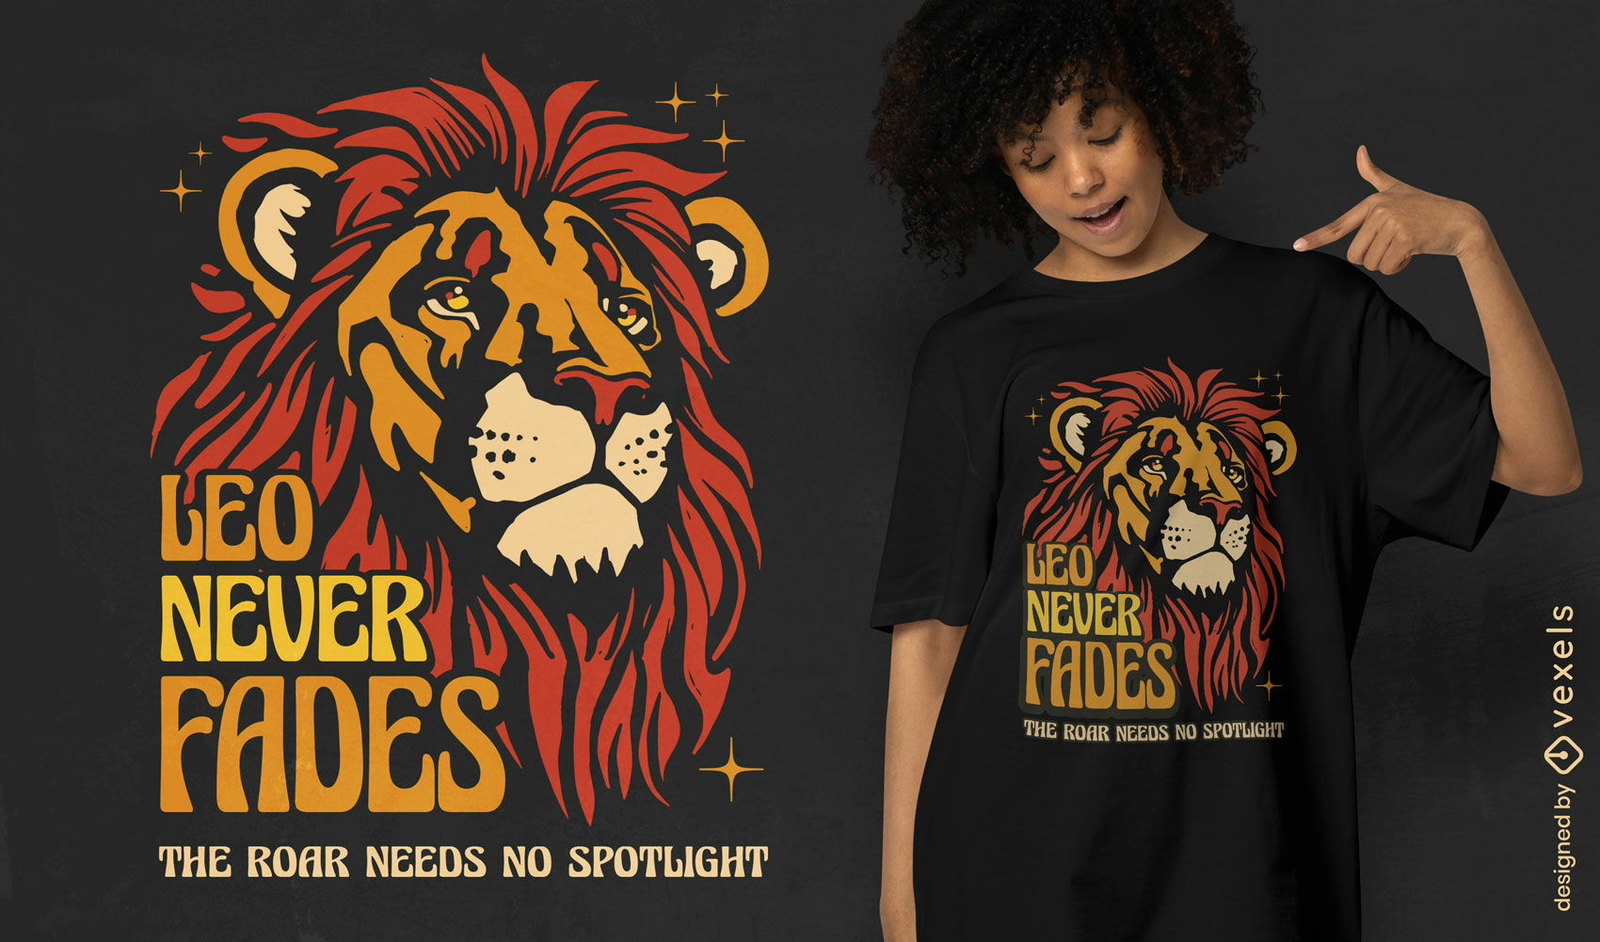
texto editável
Pronto para imprimir
para Merch
Design de camiseta com o tema Leo nunca apaga o fogo
Escolha uma pasta
Todos os favoritos
Criar novo
Salvar
Design de camiseta com o tema Leo nunca apaga o fogo
texto editável
Pronto para imprimir
para Merch
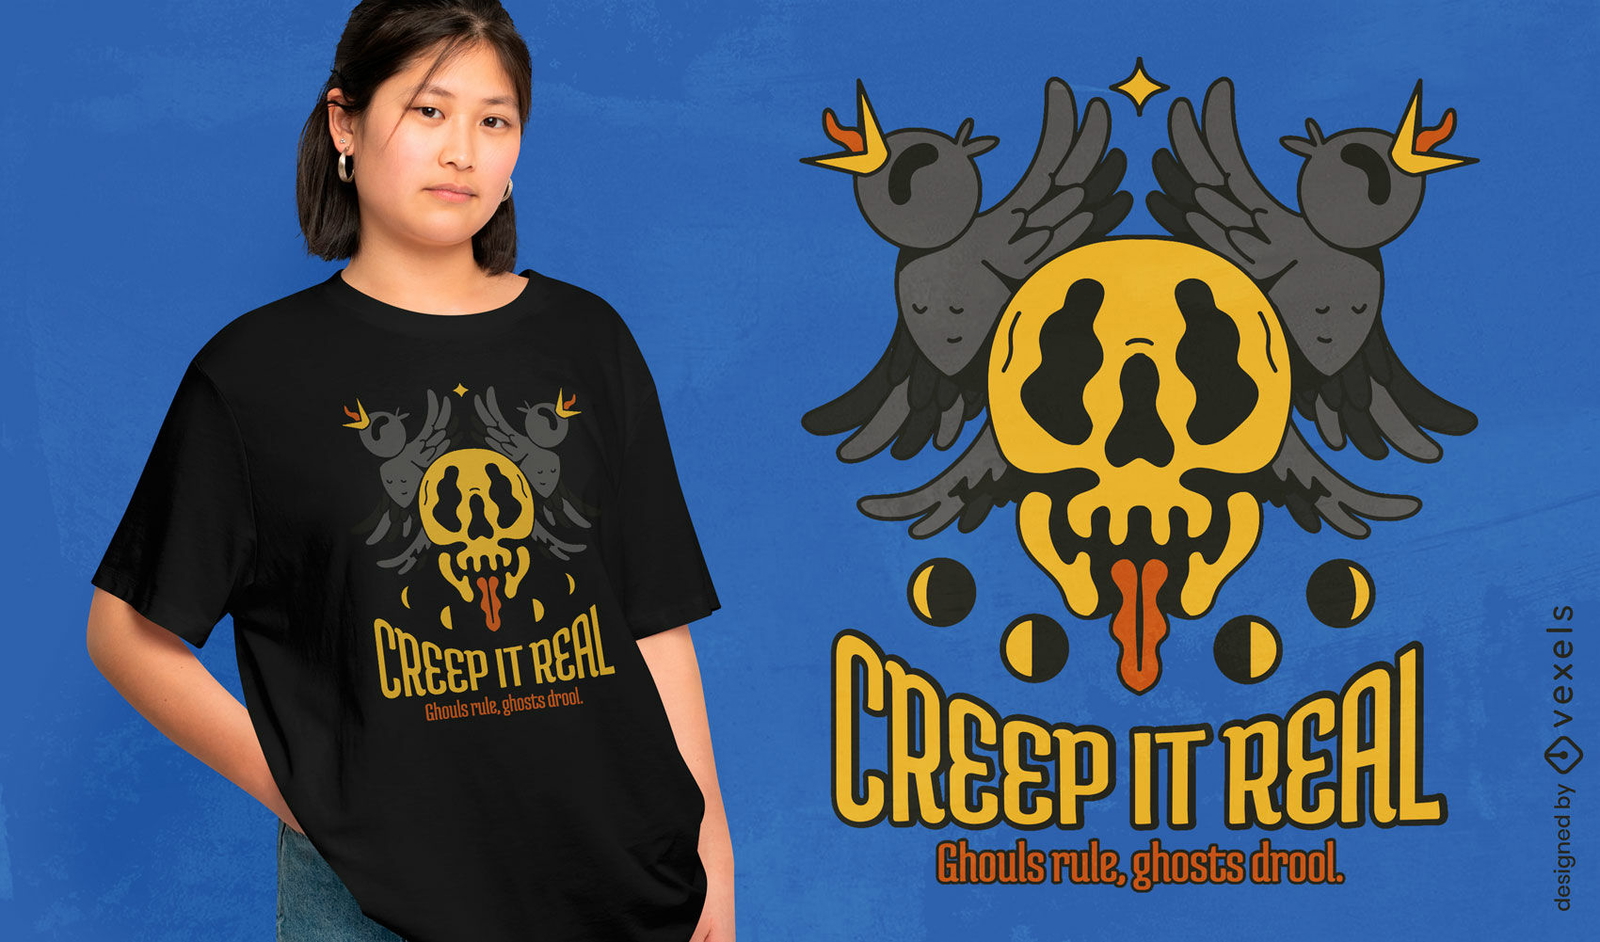
Design de camiseta de Halloween com caveira assustadora
Escolha uma pasta
Todos os favoritos
Criar novo
Salvar
Design de camiseta de Halloween com caveira assustadora
texto editável
Pronto para imprimir
para Merch
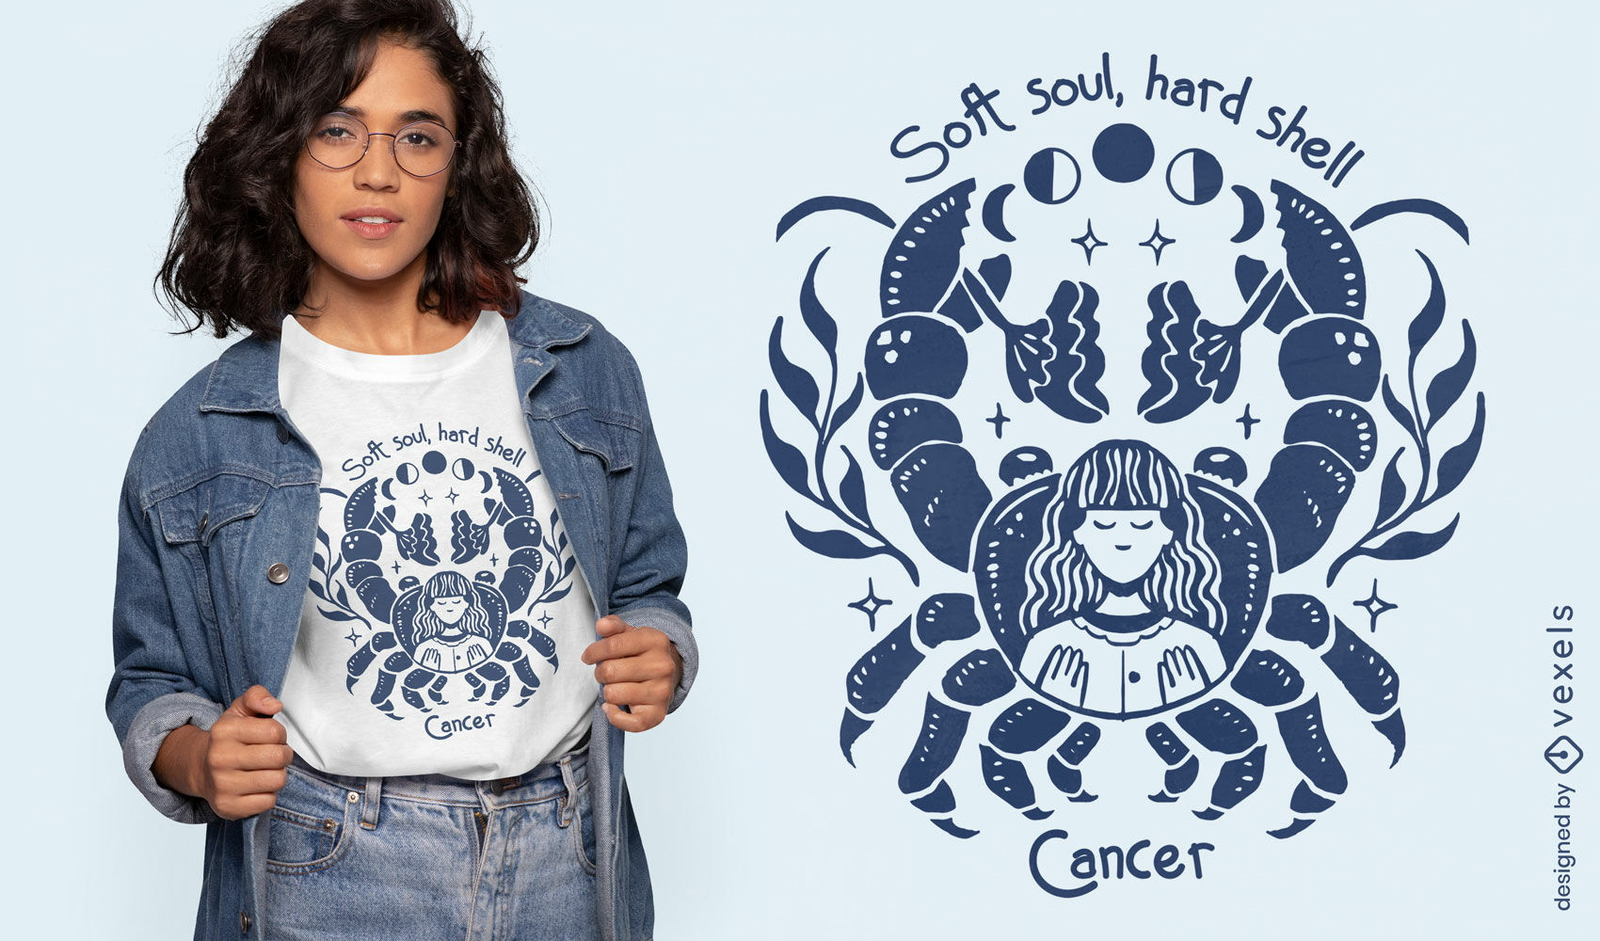
Design de camiseta do signo de Câncer com alma macia e casca dura
Escolha uma pasta
Todos os favoritos
Criar novo
Salvar
Design de camiseta do signo de Câncer com alma macia e casca dura
texto editável
Pronto para imprimir
para Merch
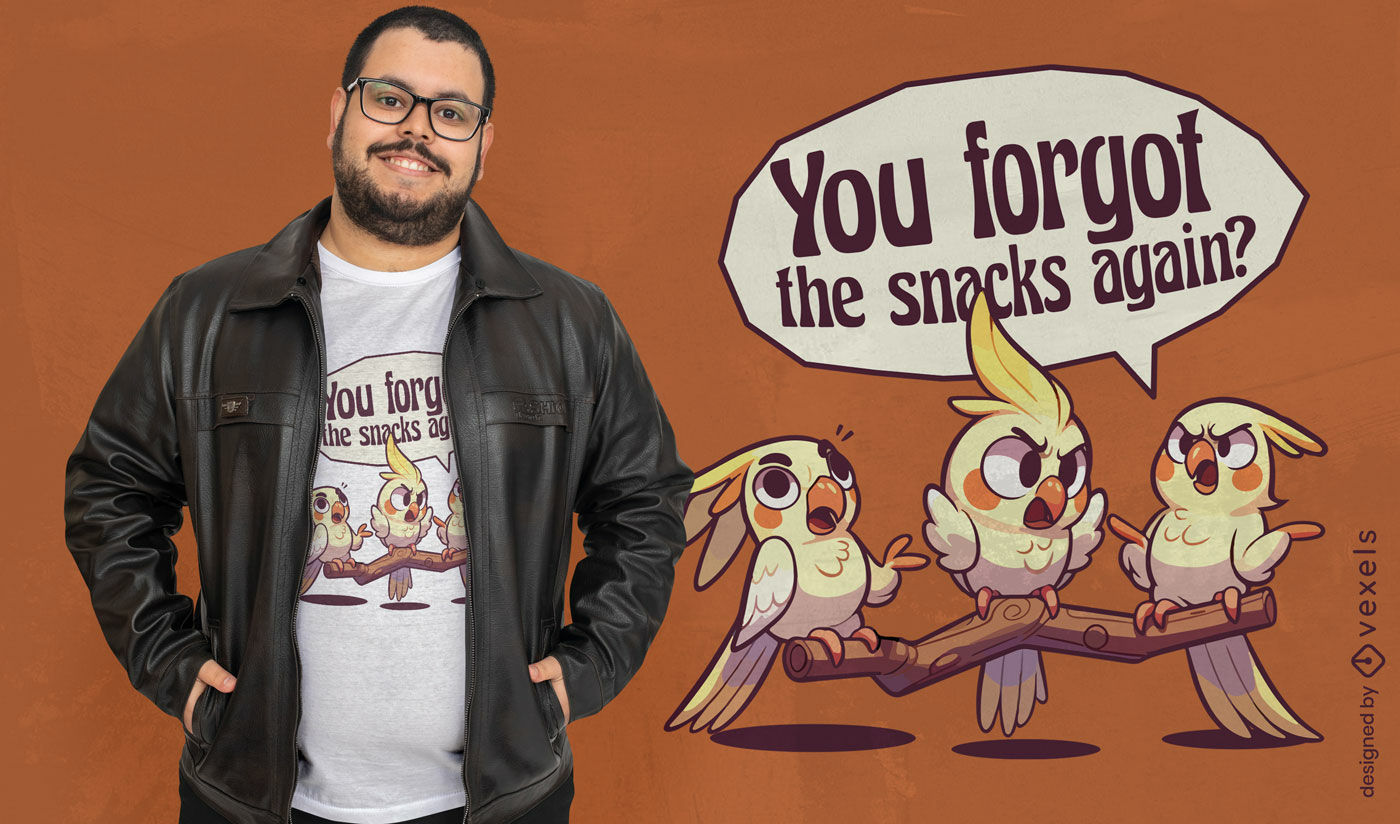
Design de camiseta com lembrete de lanche de papagaio
Escolha uma pasta
Todos os favoritos
Criar novo
Salvar
Design de camiseta com lembrete de lanche de papagaio
texto editável
Pronto para imprimir
para Merch
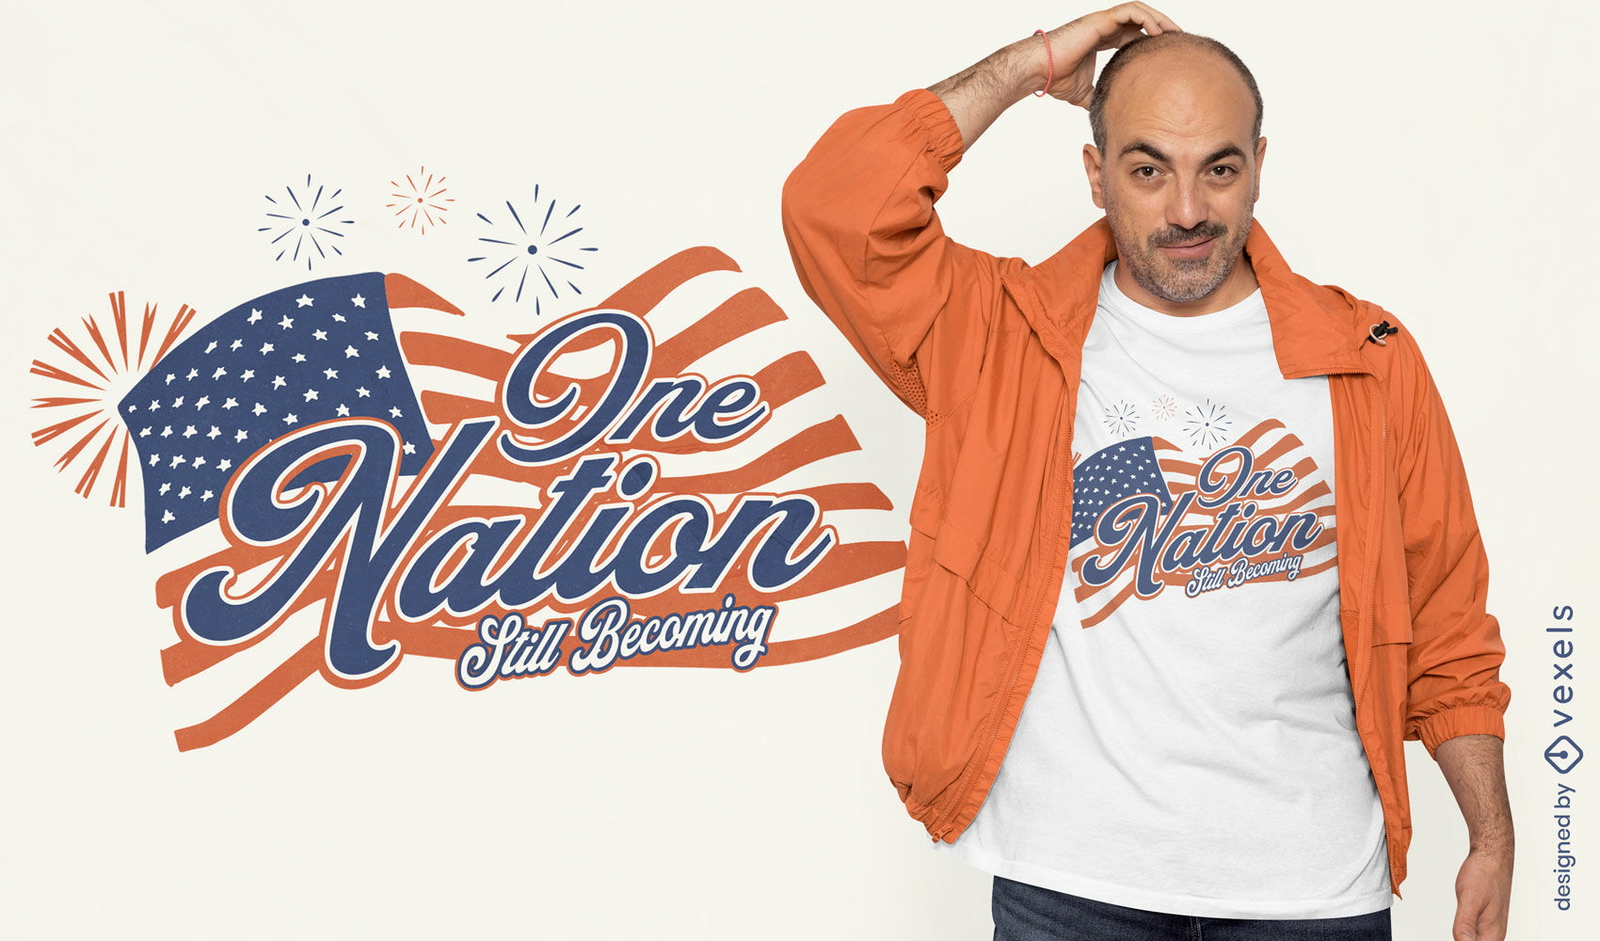
Design de camiseta patriótica de uma nação
Escolha uma pasta
Todos os favoritos
Criar novo
Salvar
Design de camiseta patriótica de uma nação
Gerado por IA, selecionado por nossos designers.
para Merch
Design de camiseta da fábrica de hambúrgueres "Dad Tax"
Escolha uma pasta
Todos os favoritos
Criar novo
Salvar
Design de camiseta da fábrica de hambúrgueres "Dad Tax"
Pronto para imprimir
para Merch
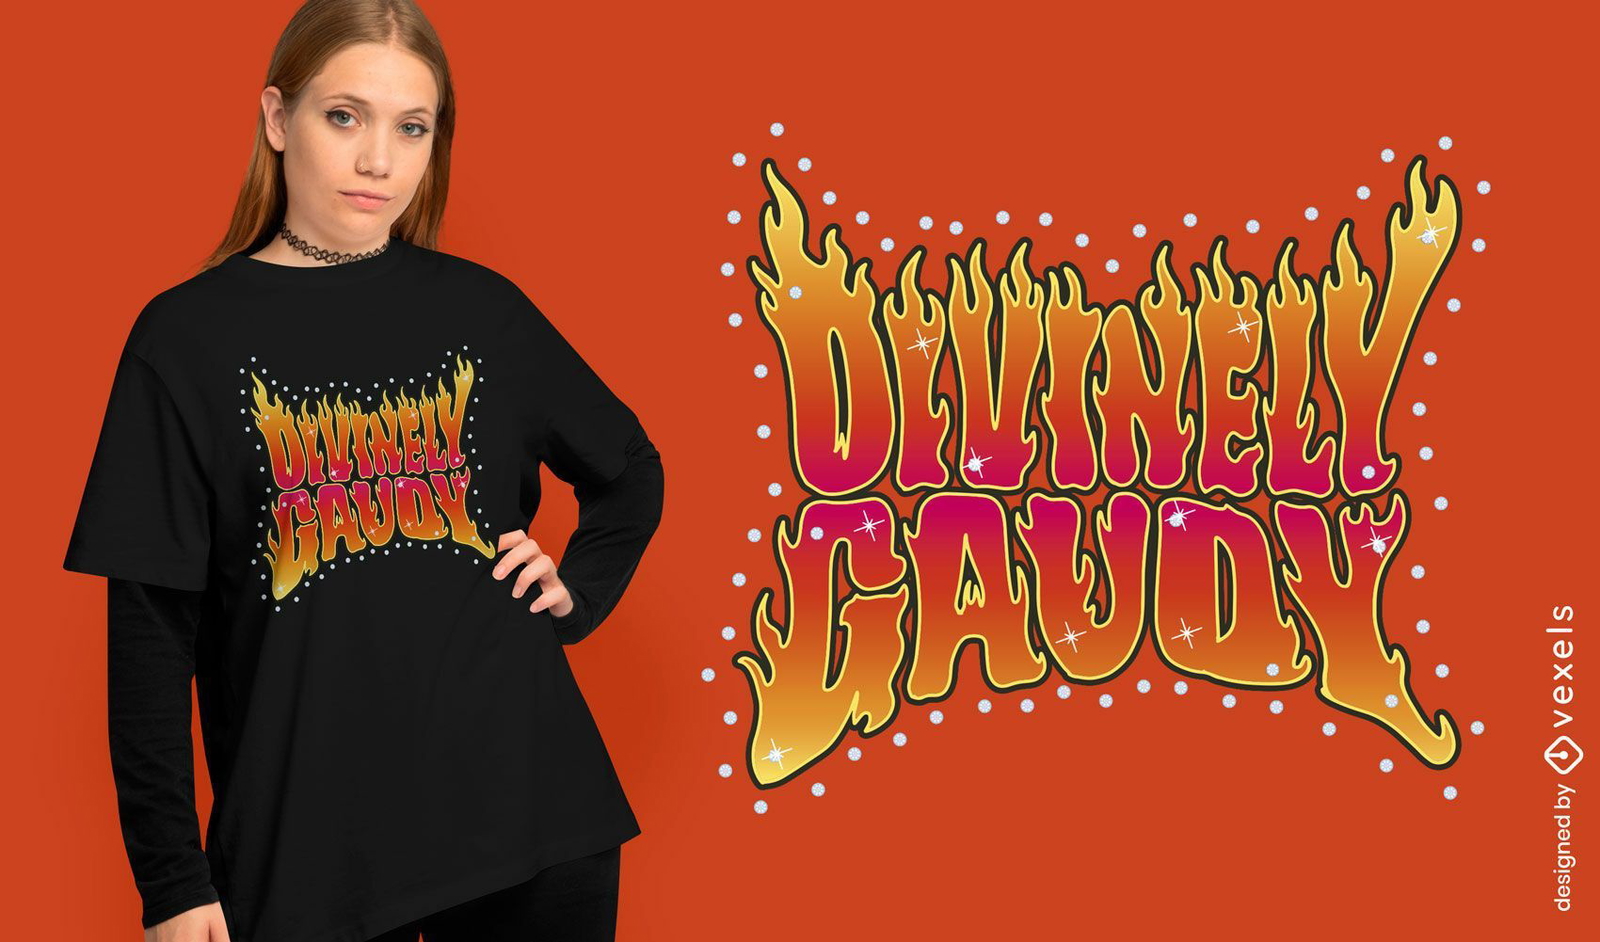
Design de camiseta kitsch divinamente extravagante
Escolha uma pasta
Todos os favoritos
Criar novo
Salvar
Design de camiseta kitsch divinamente extravagante
texto editável
Pronto para imprimir
para Merch
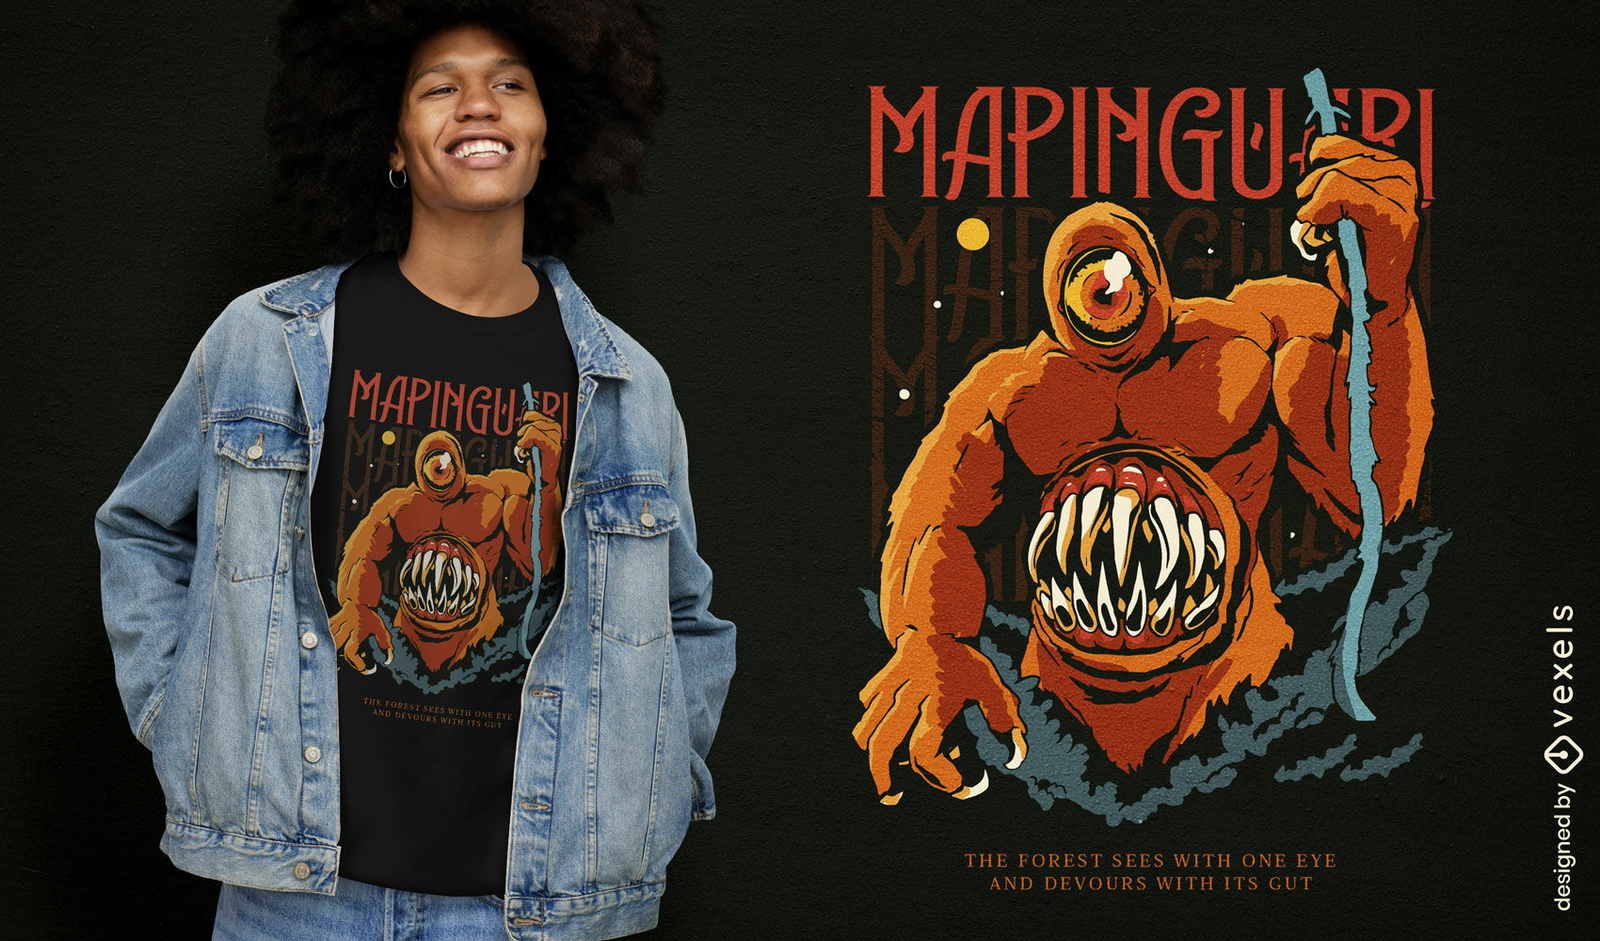
Design de camiseta com a fera mitológica Mapinguari
Escolha uma pasta
Todos os favoritos
Criar novo
Salvar
Design de camiseta com a fera mitológica Mapinguari
texto editável
Pronto para imprimir
para Merch
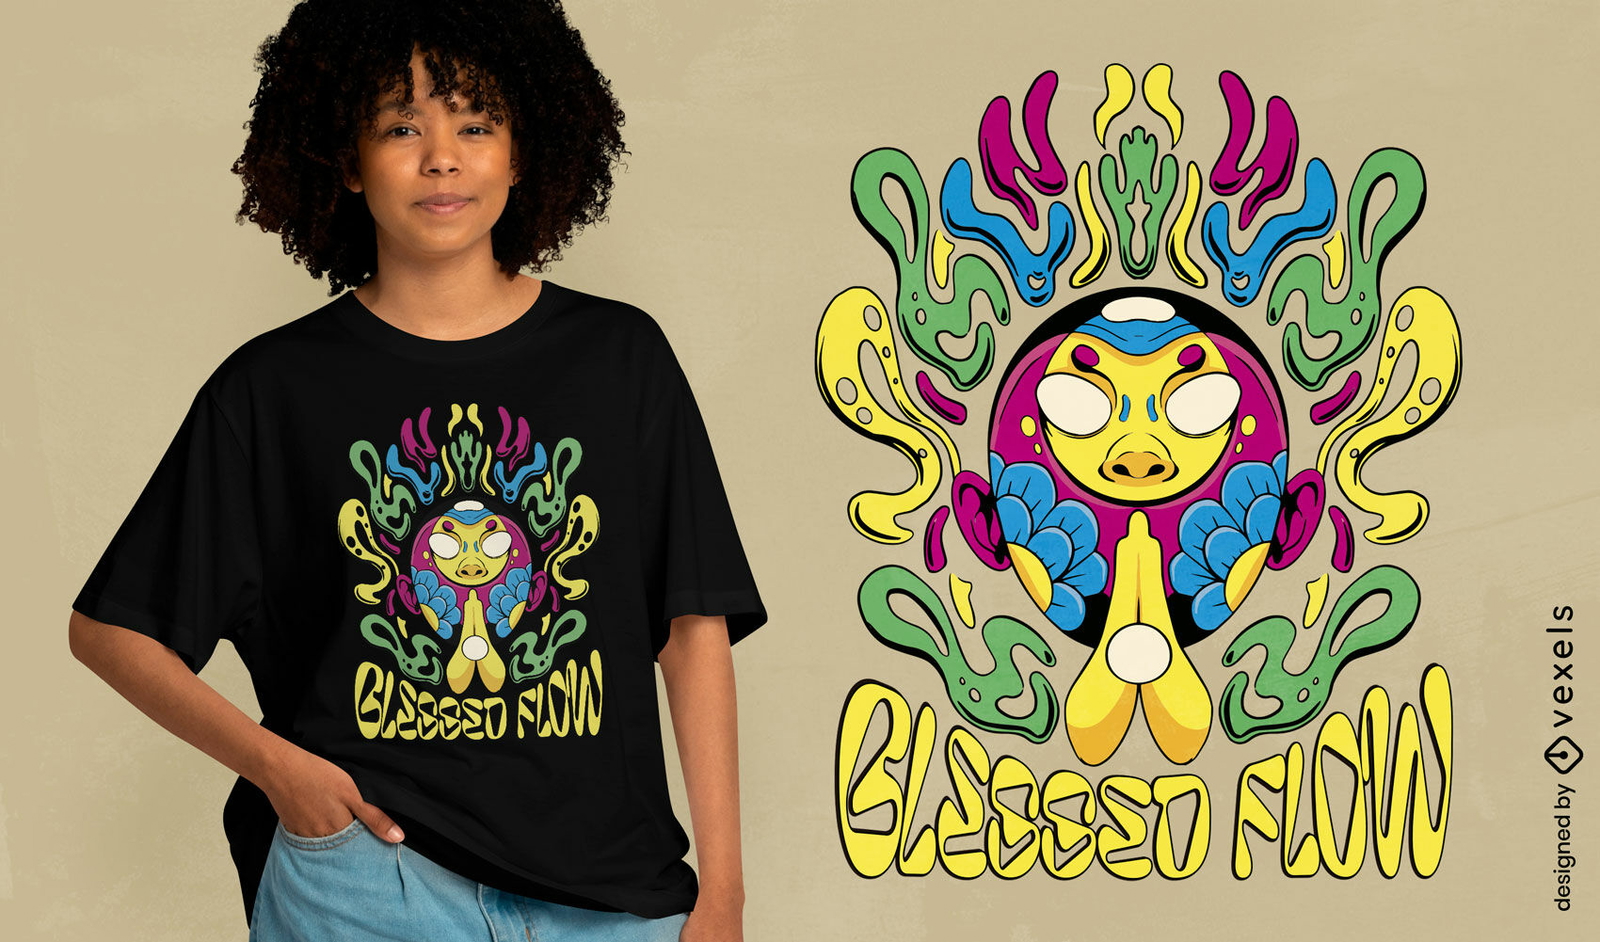
Design de camiseta psicodélica Blessed Flow
Escolha uma pasta
Todos os favoritos
Criar novo
Salvar
Design de camiseta psicodélica Blessed Flow
texto editável
Pronto para imprimir
para Merch
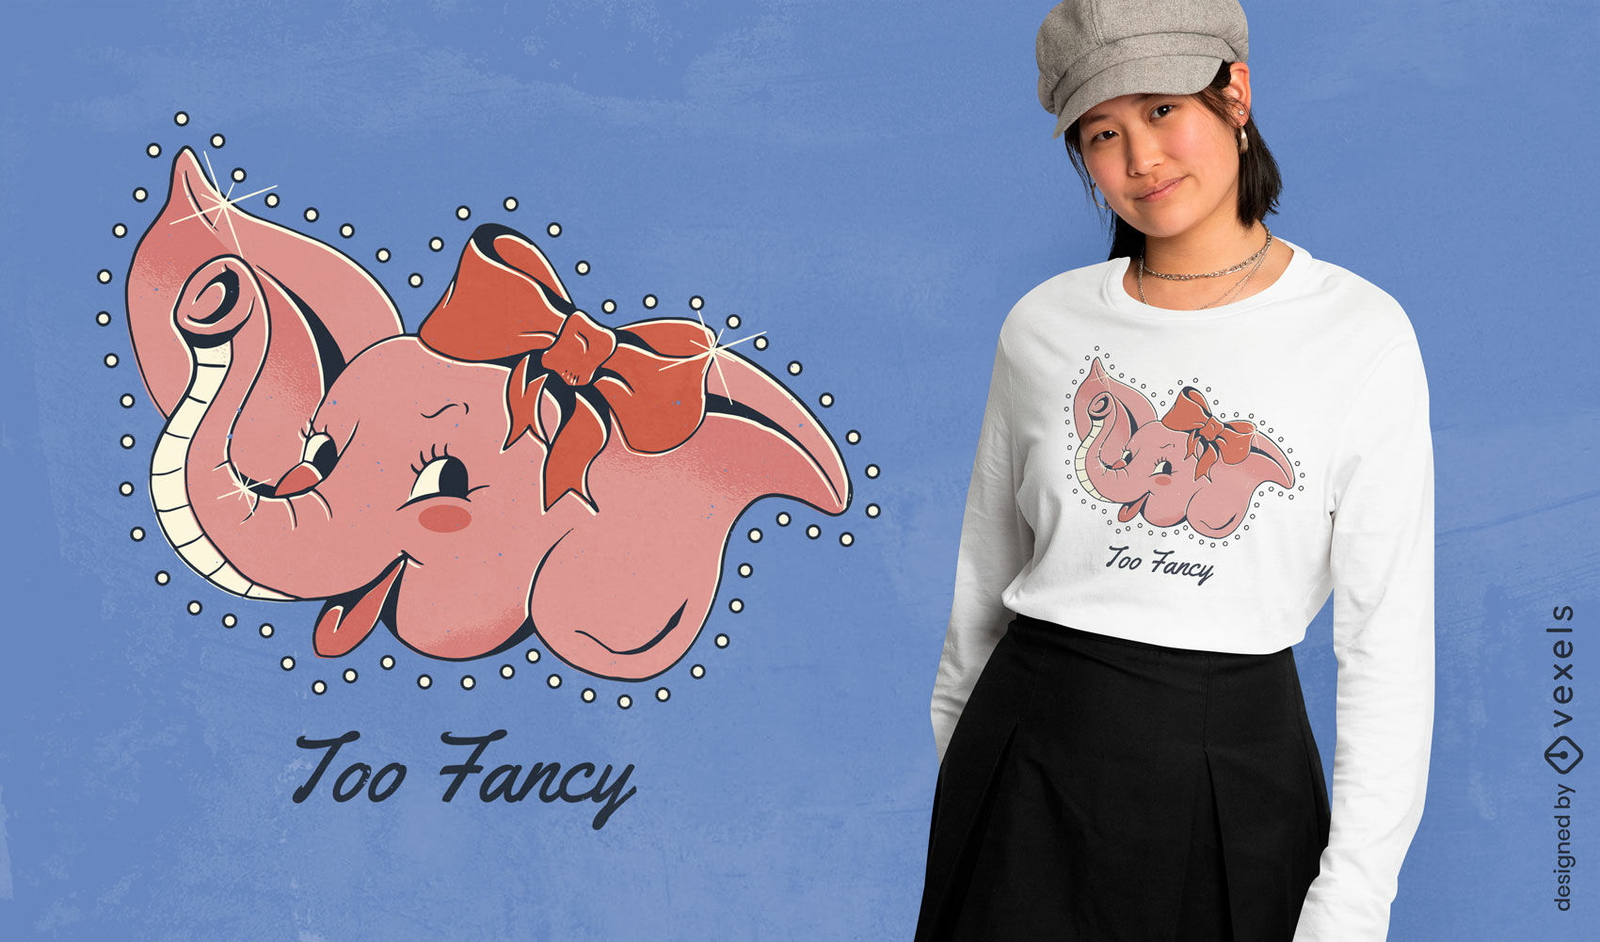
Design de camiseta com elefante muito chique
Escolha uma pasta
Todos os favoritos
Criar novo
Salvar
Design de camiseta com elefante muito chique
texto editável
Pronto para imprimir
para Merch
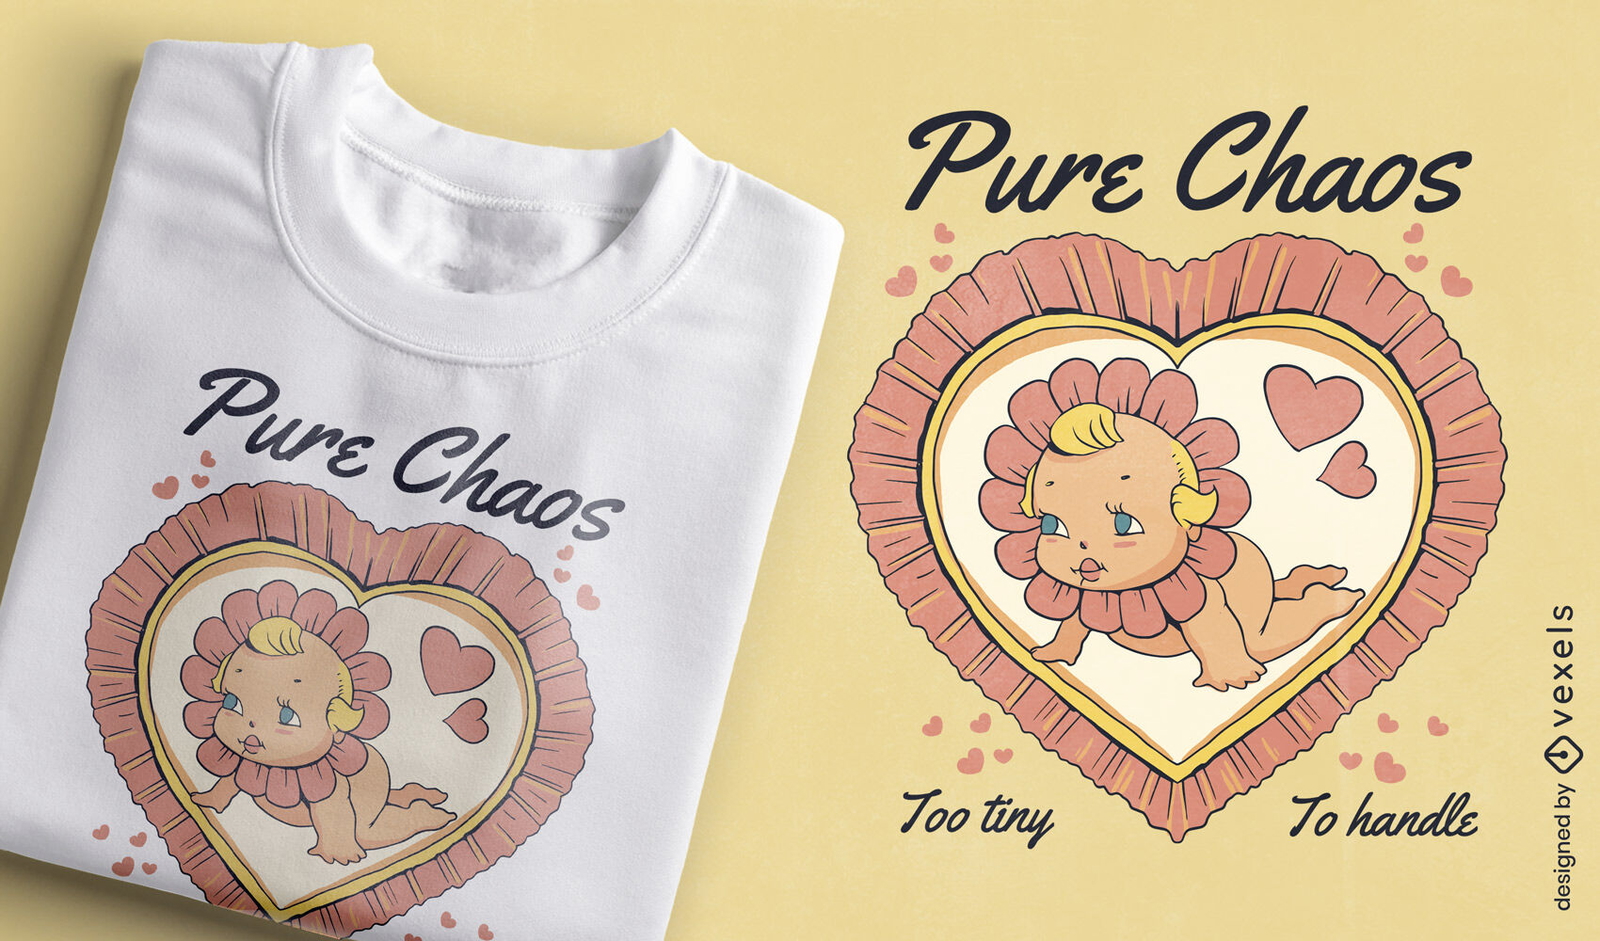
Design de camiseta para bebê com caos puro
Escolha uma pasta
Todos os favoritos
Criar novo
Salvar
Design de camiseta para bebê com caos puro
Gerado por IA, selecionado por nossos designers.
para Merch
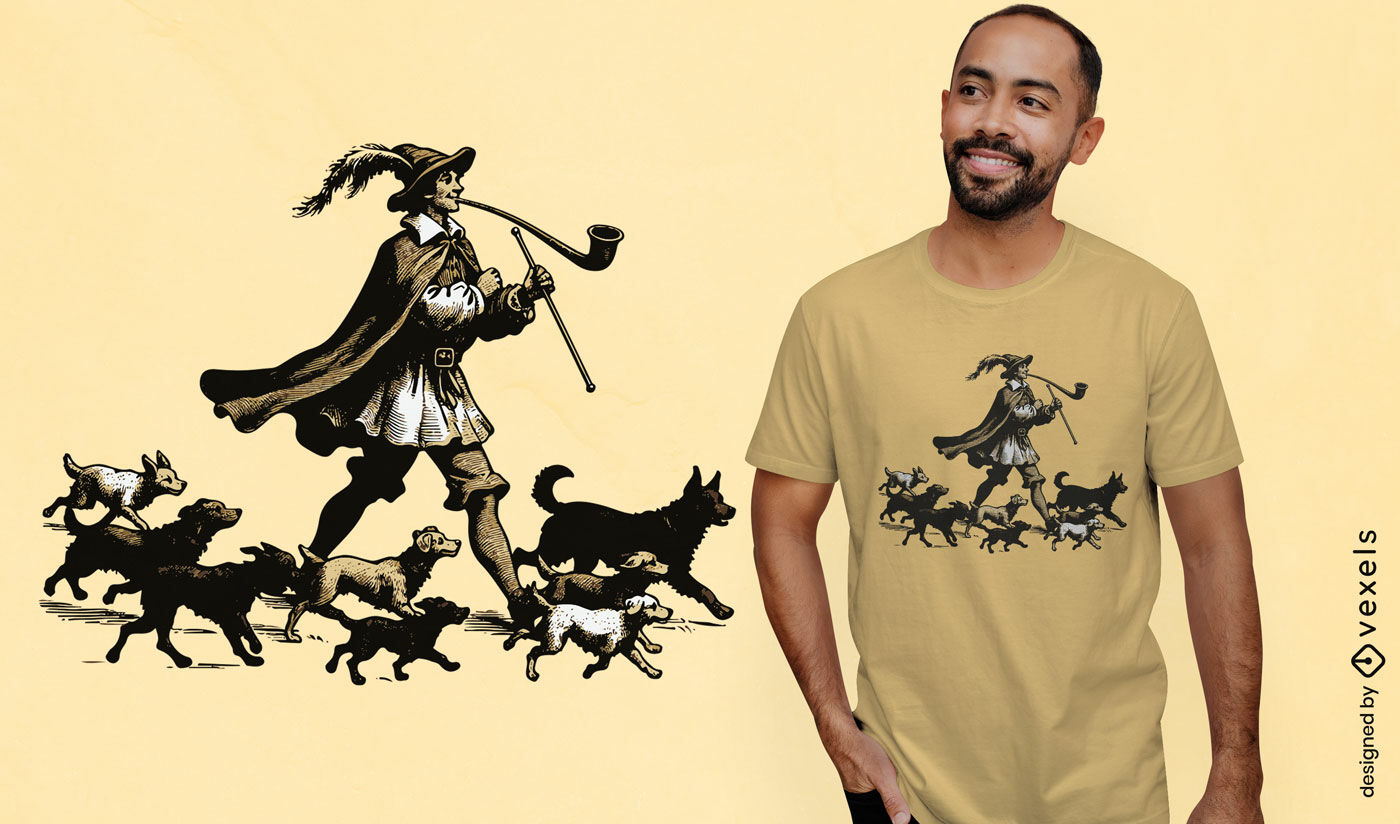
Design de camiseta do flautista de Hamelin
Escolha uma pasta
Todos os favoritos
Criar novo
Salvar
Design de camiseta do flautista de Hamelin
texto editável
Pronto para imprimir
para Merch
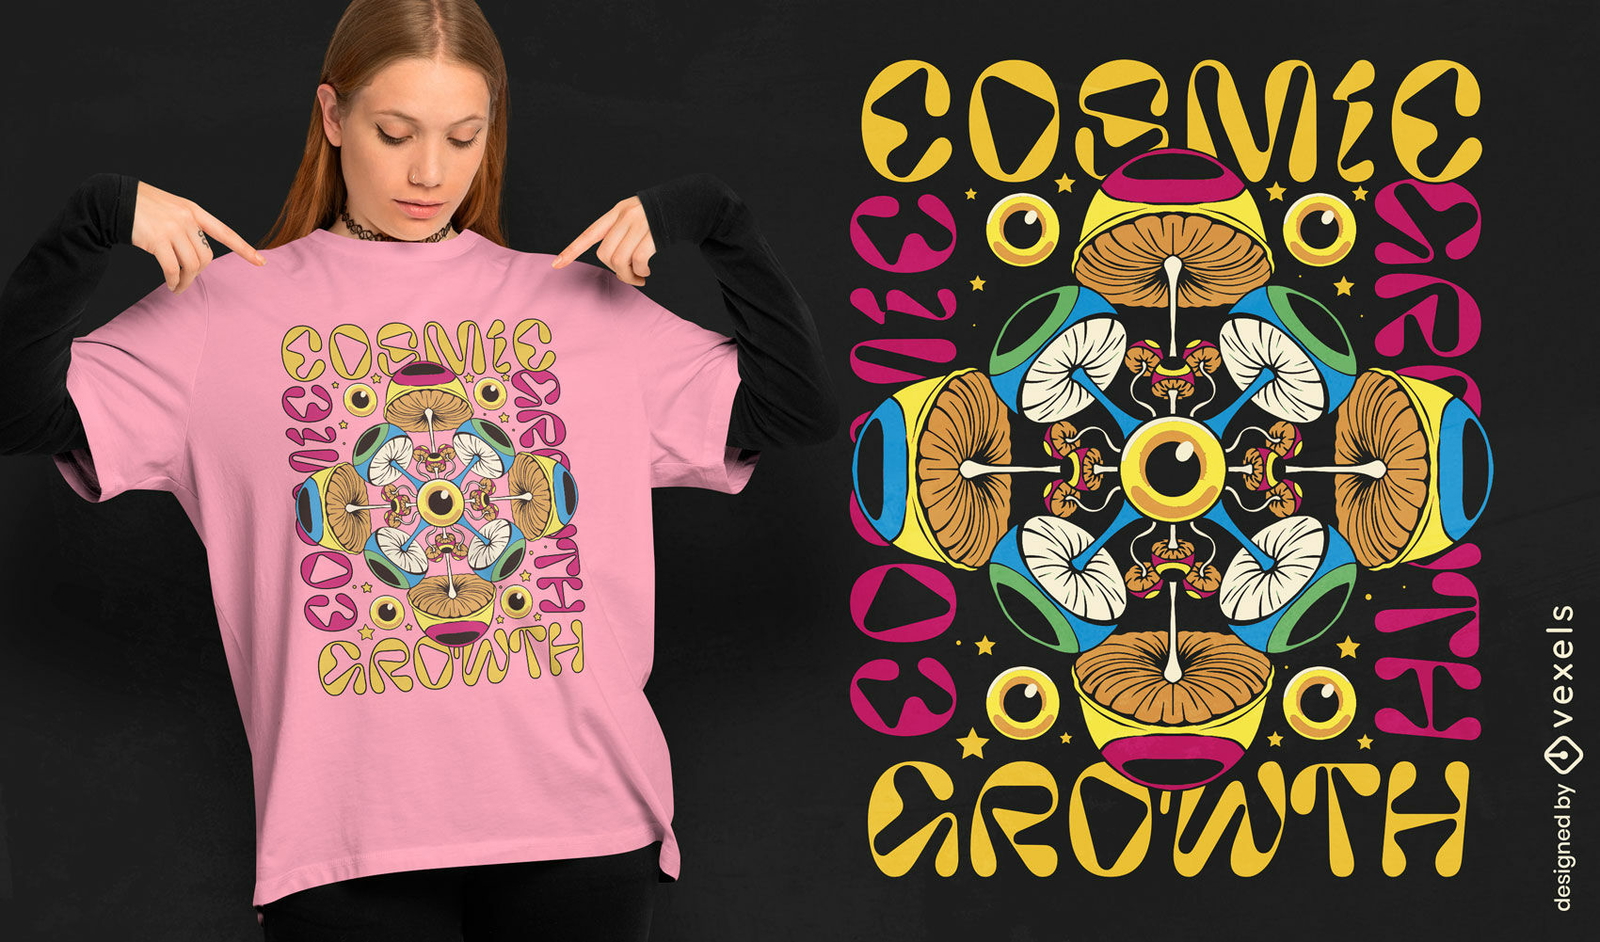
Design vibrante de camiseta com crescimento cósmico
Escolha uma pasta
Todos os favoritos
Criar novo
Salvar
Design vibrante de camiseta com crescimento cósmico
texto editável
Pronto para imprimir
para Merch
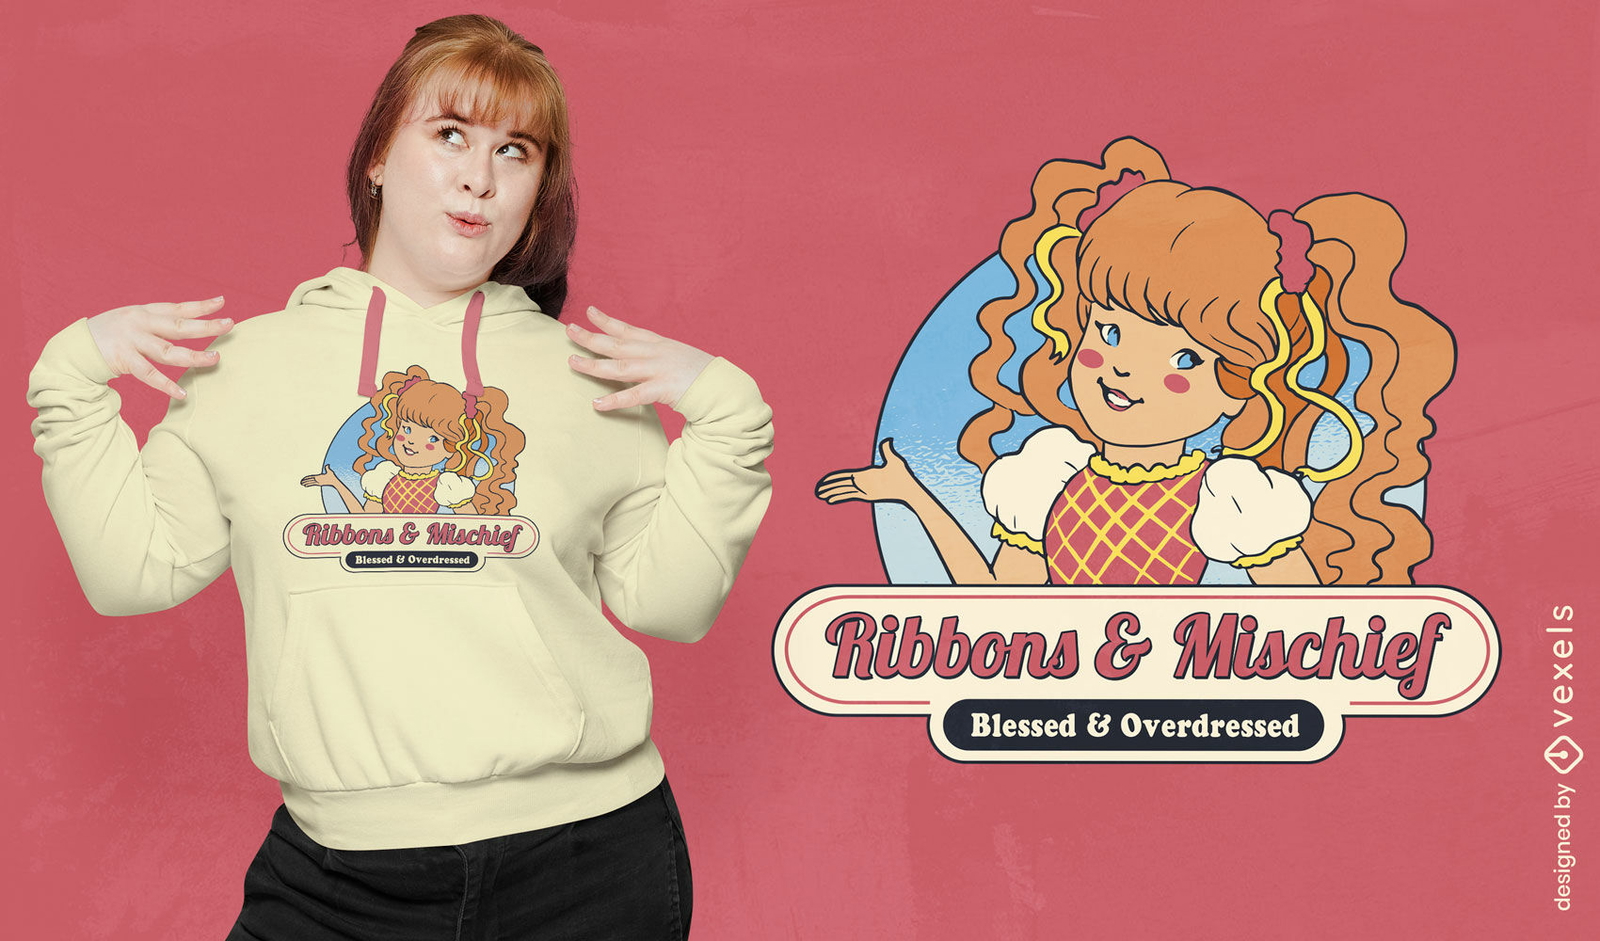
Design de camiseta com fitas e travessuras
Escolha uma pasta
Todos os favoritos
Criar novo
Salvar
Design de camiseta com fitas e travessuras
texto editável
Pronto para imprimir
para Merch
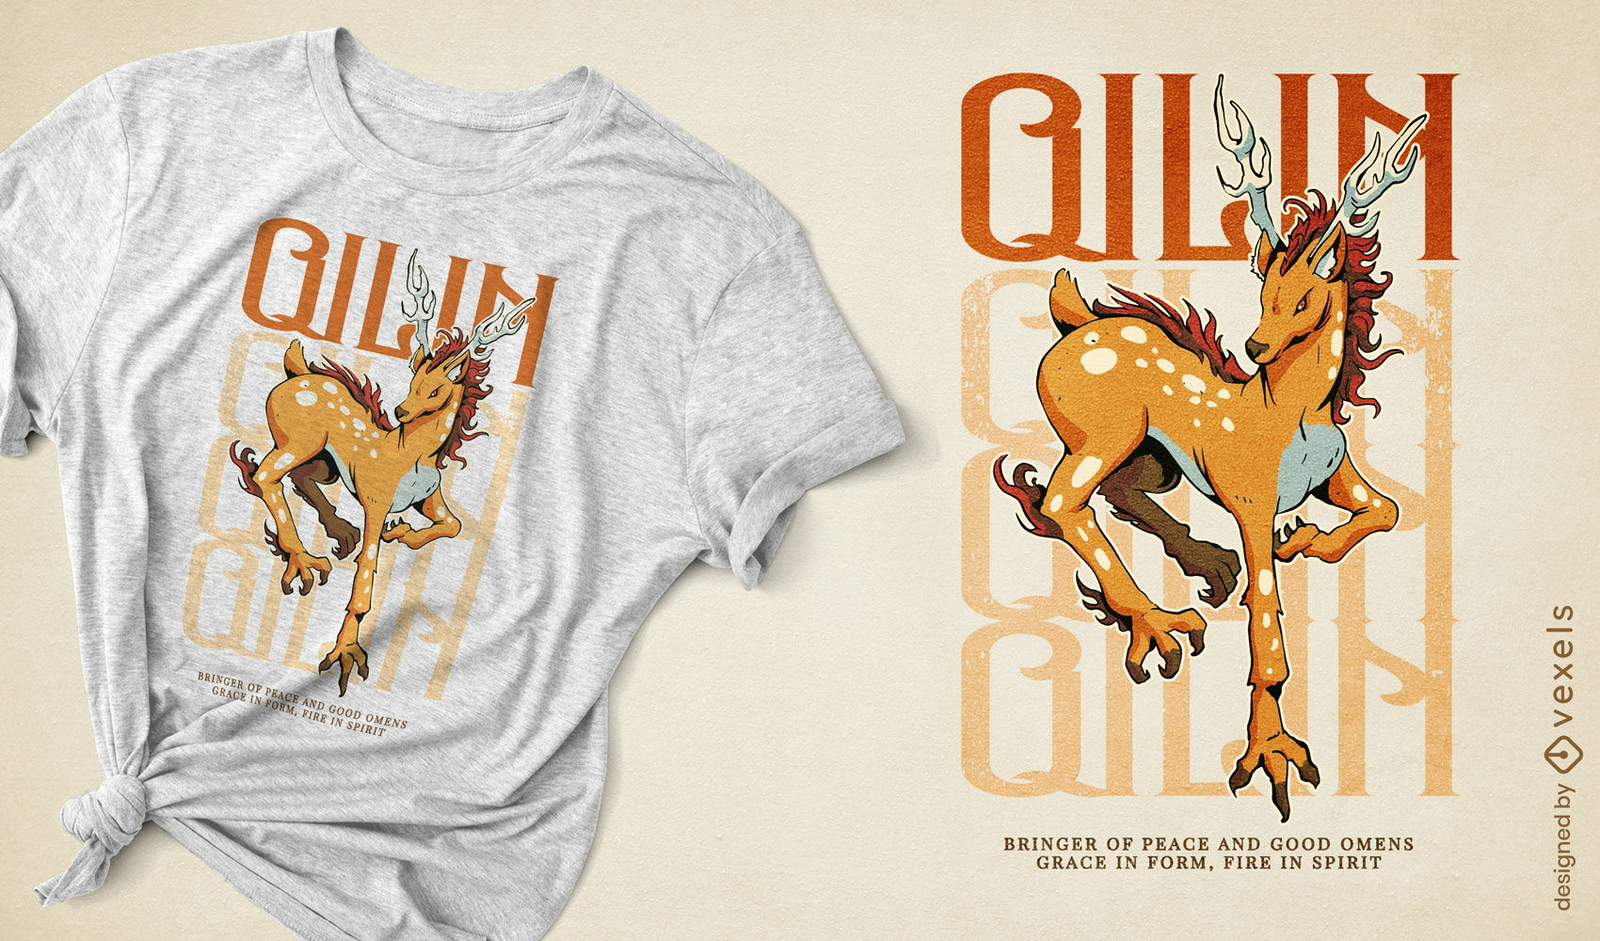
Design de camiseta qilin caprichoso
Escolha uma pasta
Todos os favoritos
Criar novo
Salvar
Design de camiseta qilin caprichoso
texto editável
Pronto para imprimir
para Merch
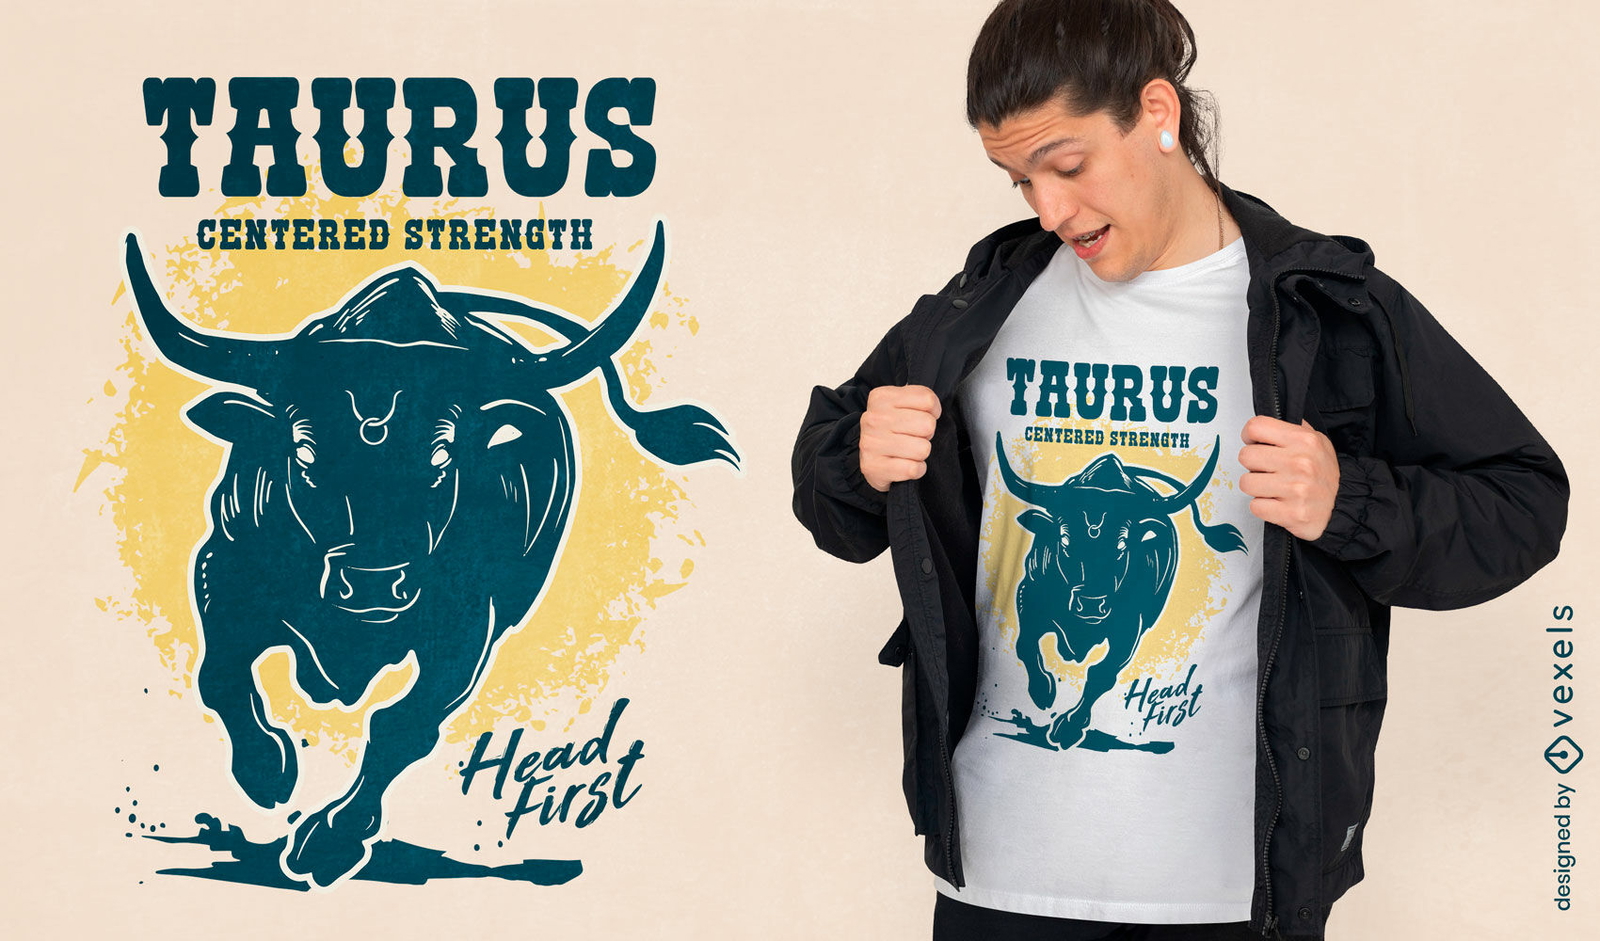
Design de camiseta com a força do touro Touro
Escolha uma pasta
Todos os favoritos
Criar novo
Salvar
Design de camiseta com a força do touro Touro
texto editável
Pronto para imprimir
para Merch
Design de camiseta com a lista de travessuras do Papai Noel
Escolha uma pasta
Todos os favoritos
Criar novo
Salvar
Design de camiseta com a lista de travessuras do Papai Noel
texto editável
Pronto para imprimir
para Merch
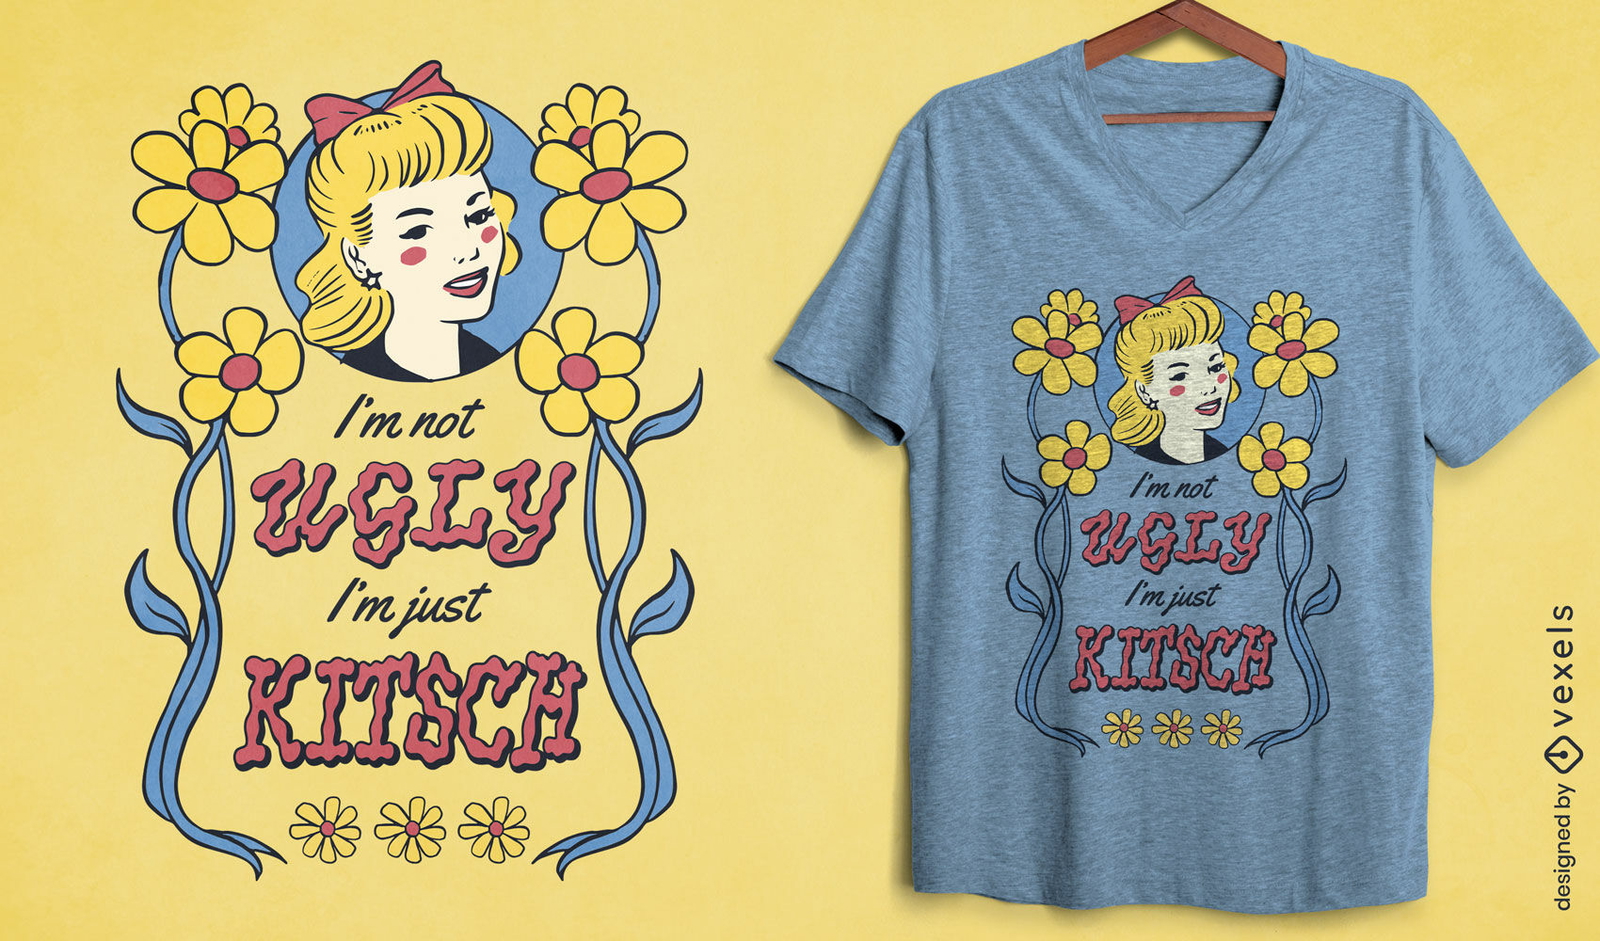
Design de camiseta com citação engraçada e kitsch
Escolha uma pasta
Todos os favoritos
Criar novo
Salvar
Design de camiseta com citação engraçada e kitsch
texto editável
Pronto para imprimir
para Merch
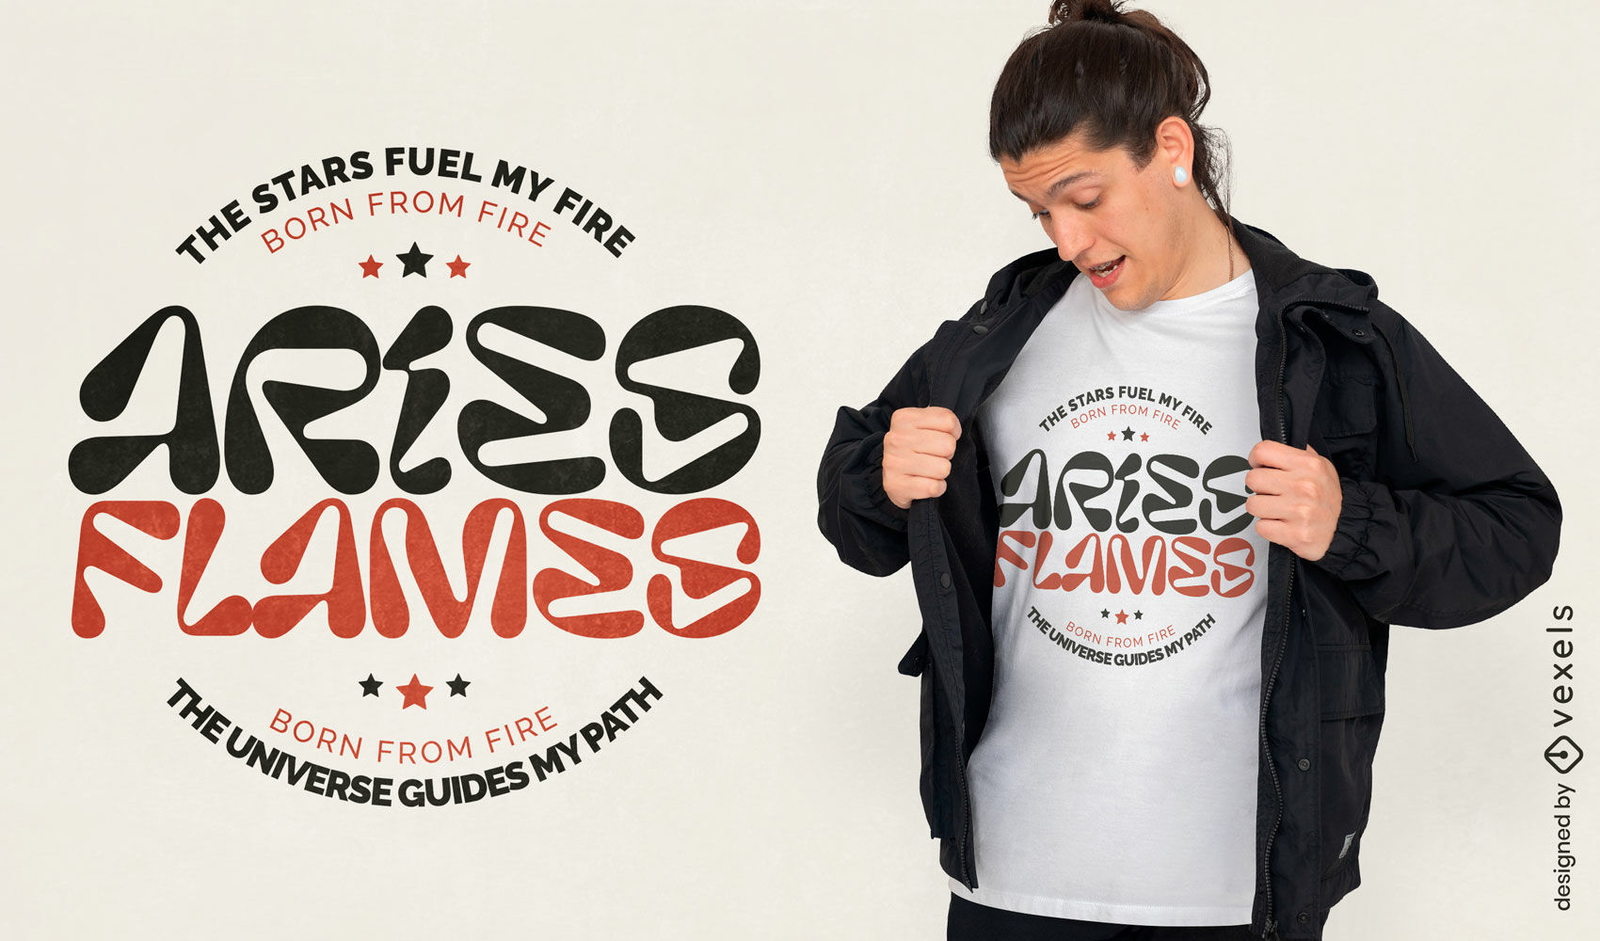
Design de camiseta do zodíaco com chamas de Áries
Escolha uma pasta
Todos os favoritos
Criar novo
Salvar
Design de camiseta do zodíaco com chamas de Áries
texto editável
Pronto para imprimir
para Merch
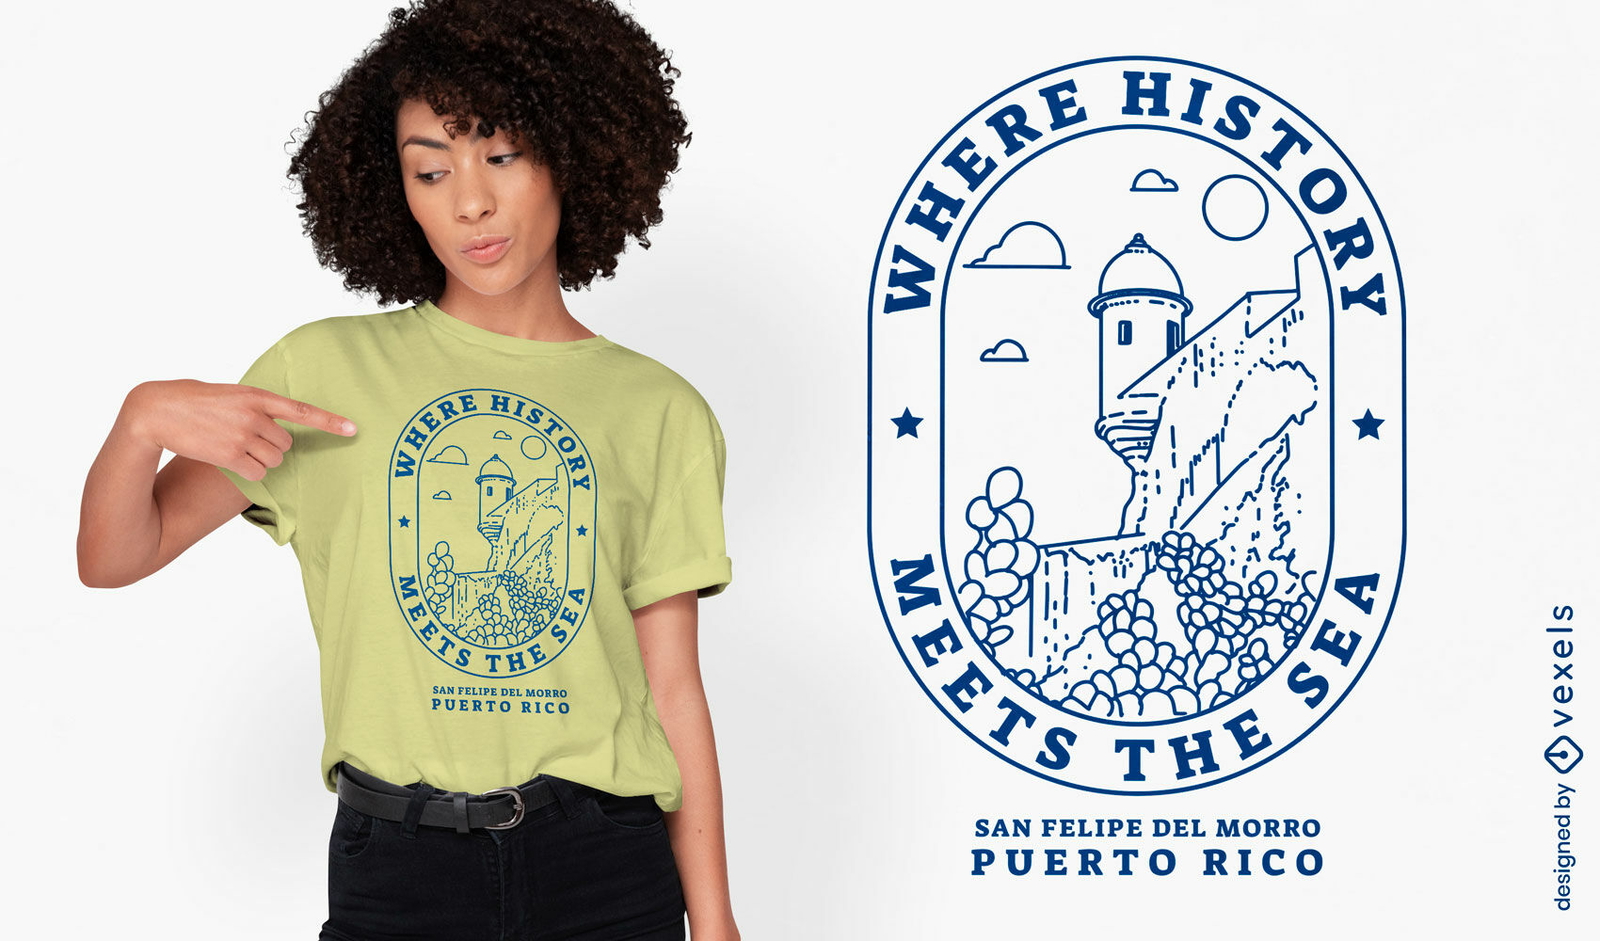
Design de camiseta com história de Porto Rico
Escolha uma pasta
Todos os favoritos
Criar novo
Salvar
Design de camiseta com história de Porto Rico
Gerado por IA, selecionado por nossos designers.
para Merch
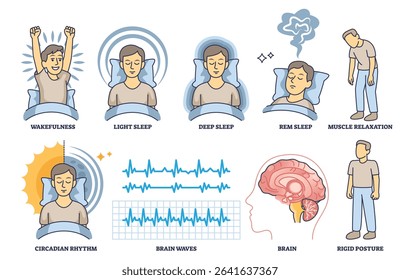
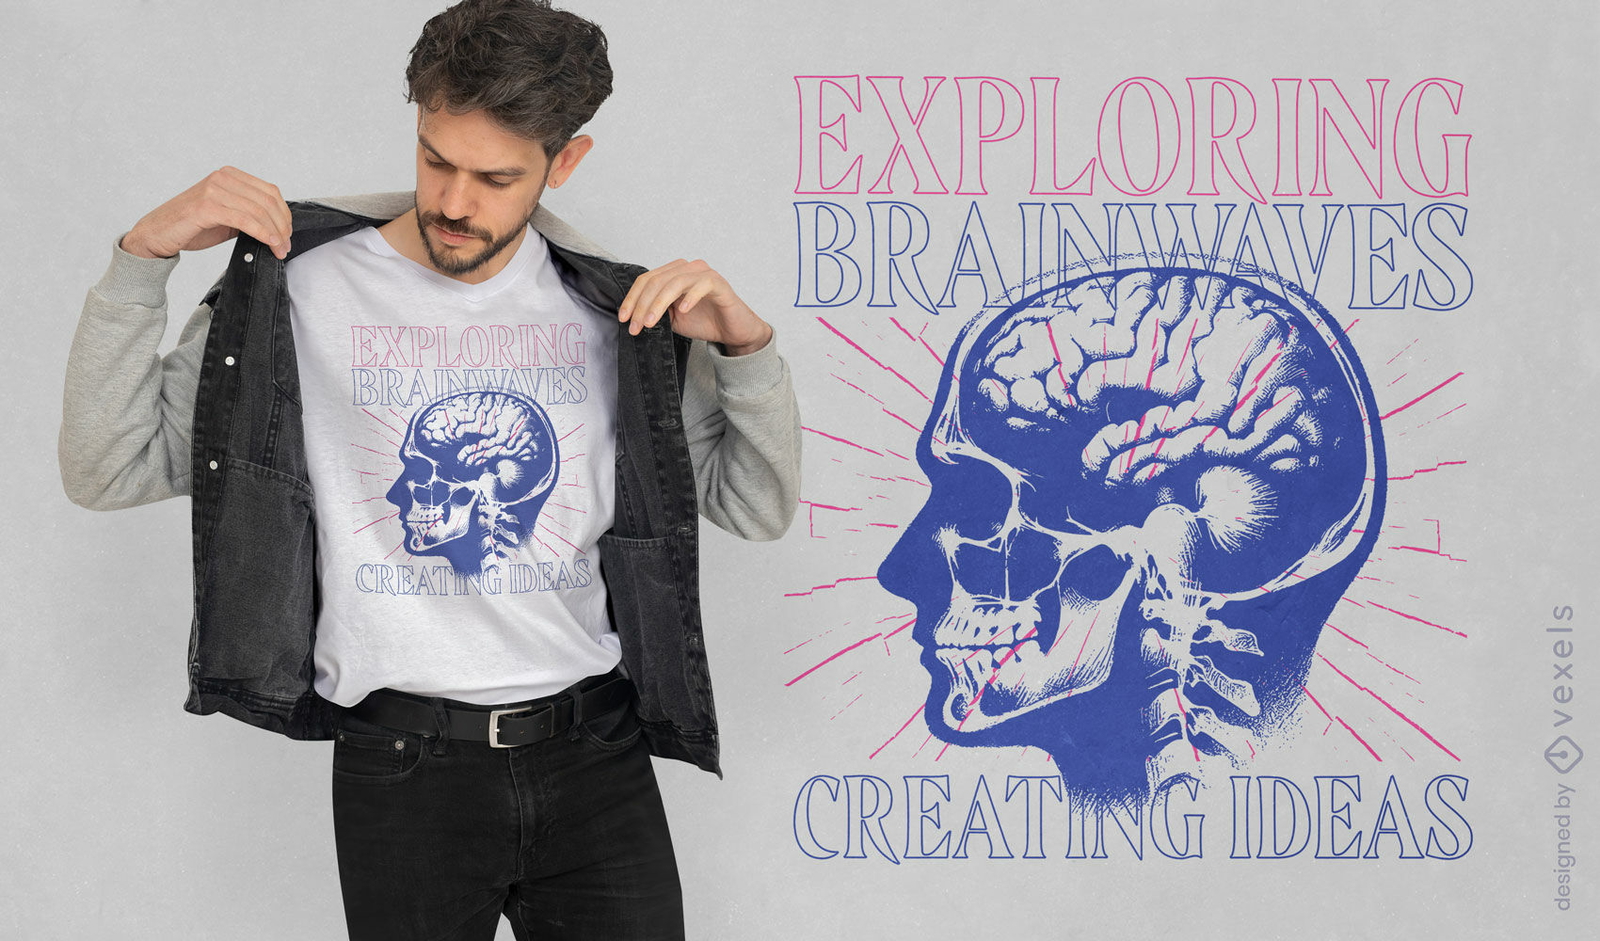
Design de camiseta com ondas cerebrais anatômicas
Escolha uma pasta
Todos os favoritos
Criar novo
Salvar
Design de camiseta com ondas cerebrais anatômicas
texto editável
Pronto para imprimir
para Merch
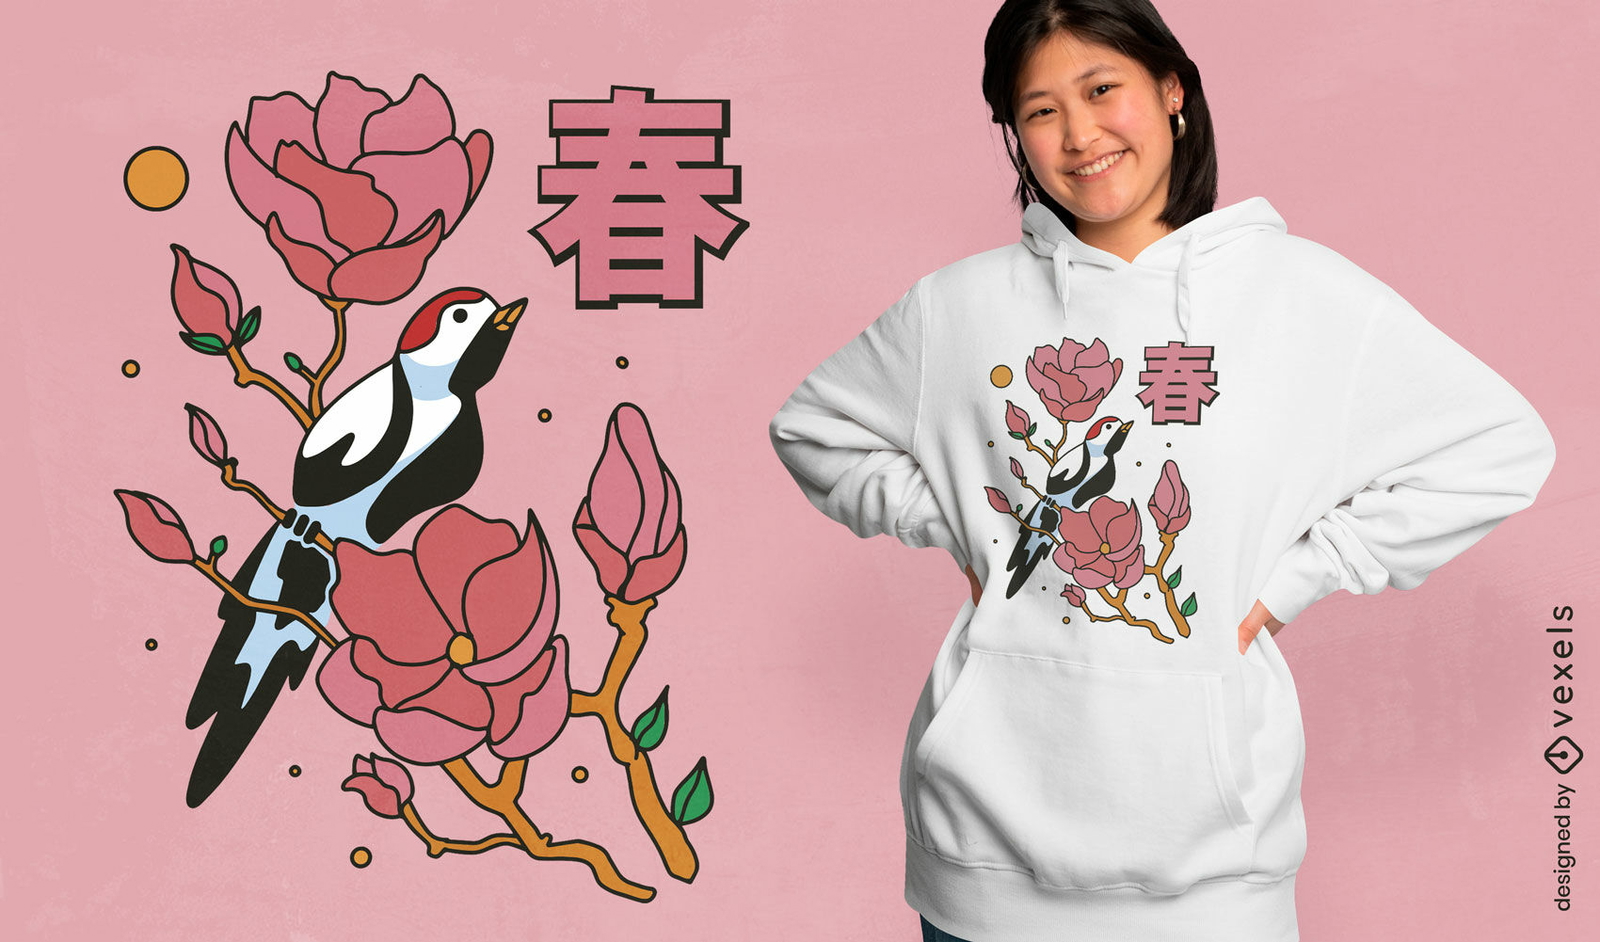
Design de camiseta com pássaro e flor japonesa
Escolha uma pasta
Todos os favoritos
Criar novo
Salvar
Design de camiseta com pássaro e flor japonesa
texto editável
Pronto para imprimir
para Merch
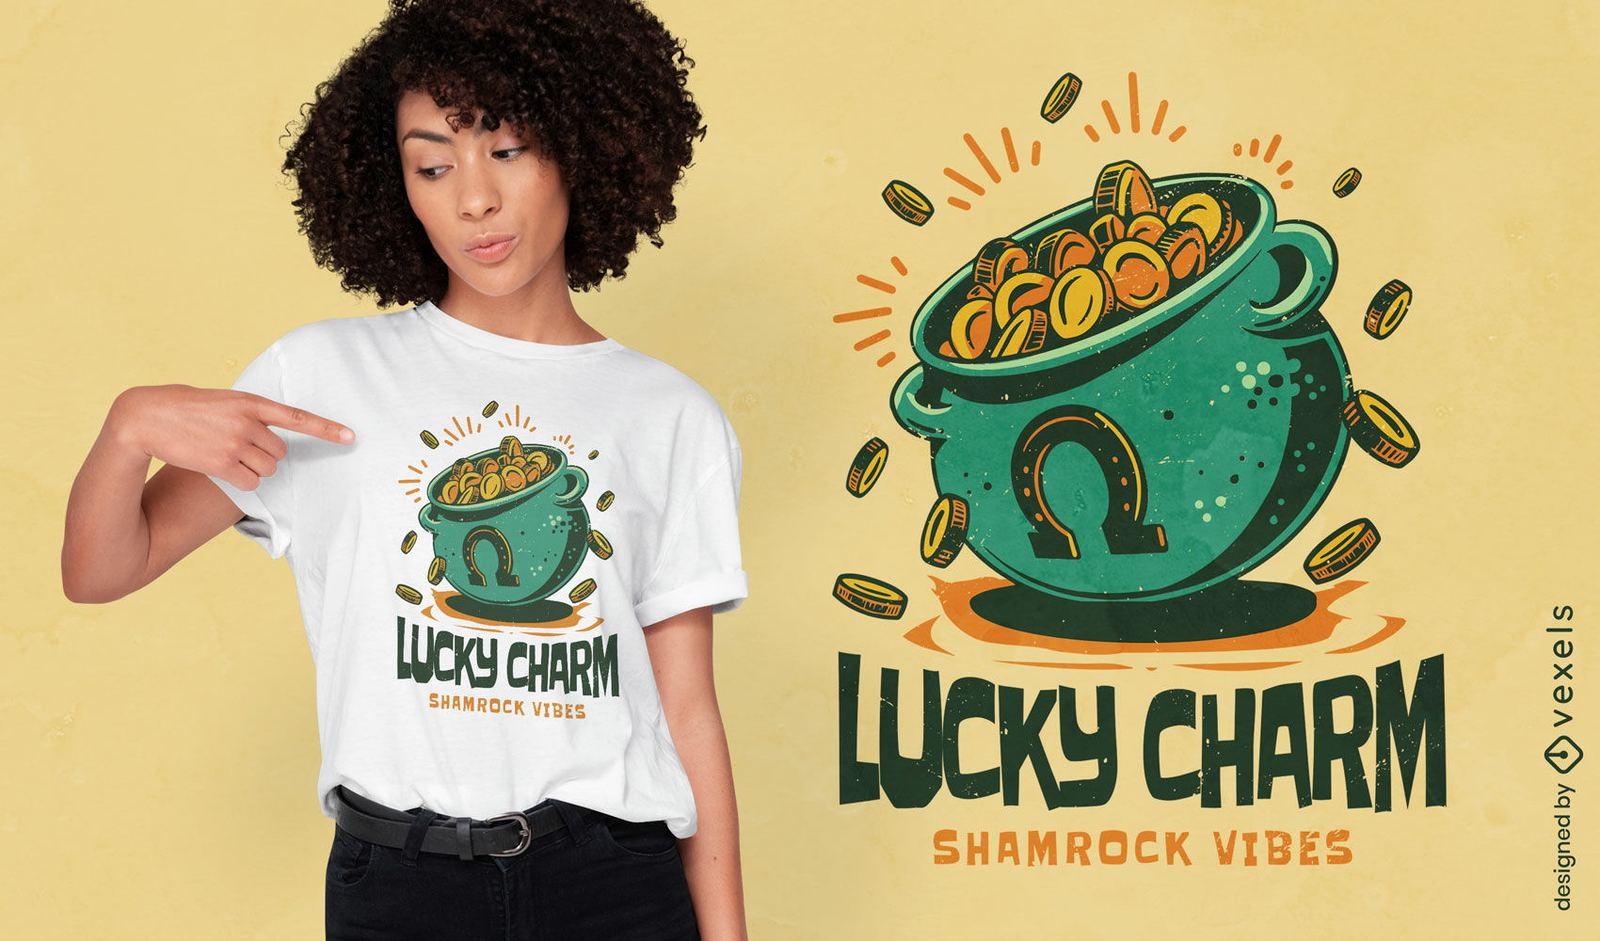
Design de camiseta com amuleto da sorte e pote de ouro
Escolha uma pasta
Todos os favoritos
Criar novo
Salvar
Design de camiseta com amuleto da sorte e pote de ouro
Pronto para imprimir
para Merch
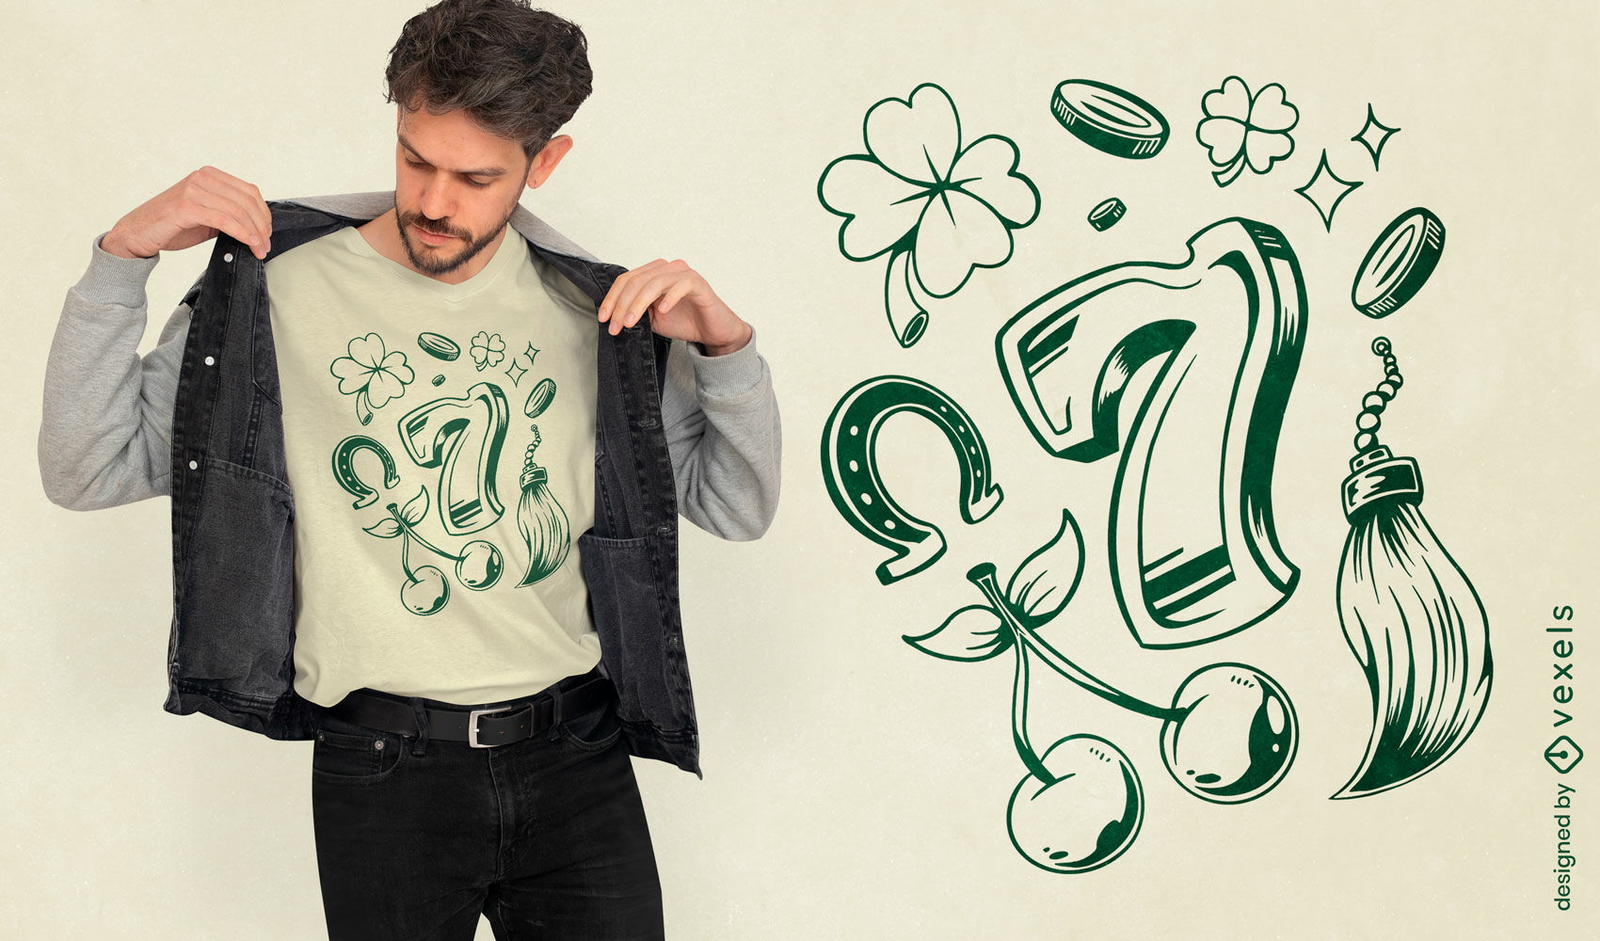
Design de camiseta com sete elementos do número da sorte
Escolha uma pasta
Todos os favoritos
Criar novo
Salvar
Design de camiseta com sete elementos do número da sorte
texto editável
Pronto para imprimir
para Merch
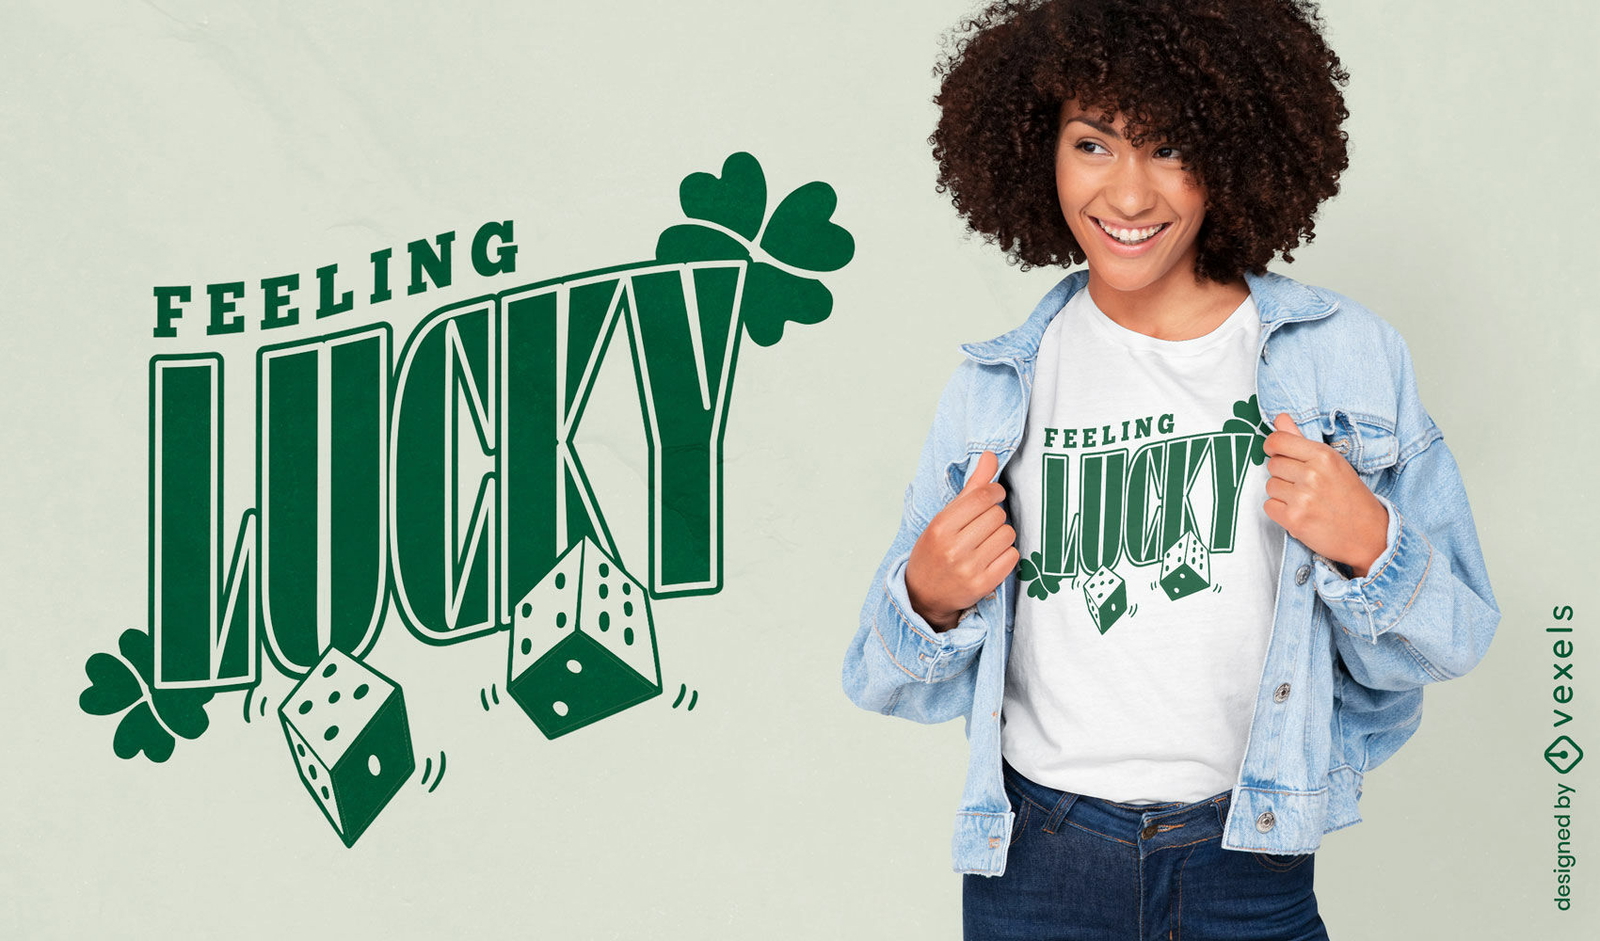
Design de camiseta com a frase "me sentindo sortudo"
Escolha uma pasta
Todos os favoritos
Criar novo
Salvar
Design de camiseta com a frase "me sentindo sortudo"
texto editável
Pronto para imprimir
para Merch
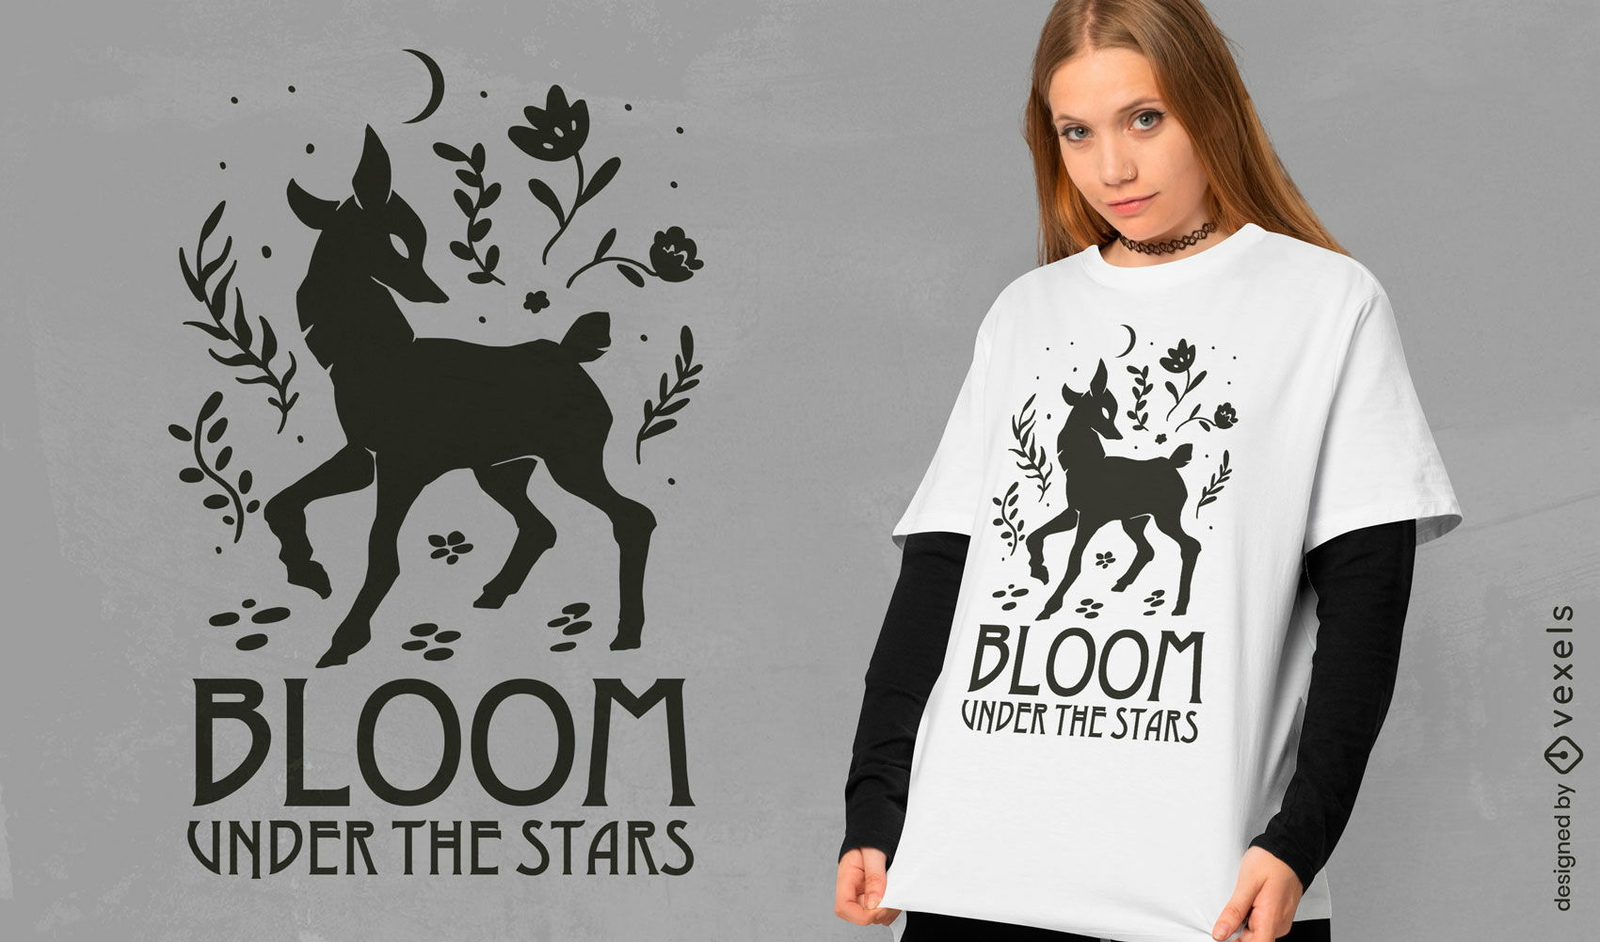
Design de camiseta "Floresça sob as estrelas"
Escolha uma pasta
Todos os favoritos
Criar novo
Salvar
Design de camiseta "Floresça sob as estrelas"
Gerado por IA, selecionado por nossos designers.
para Merch
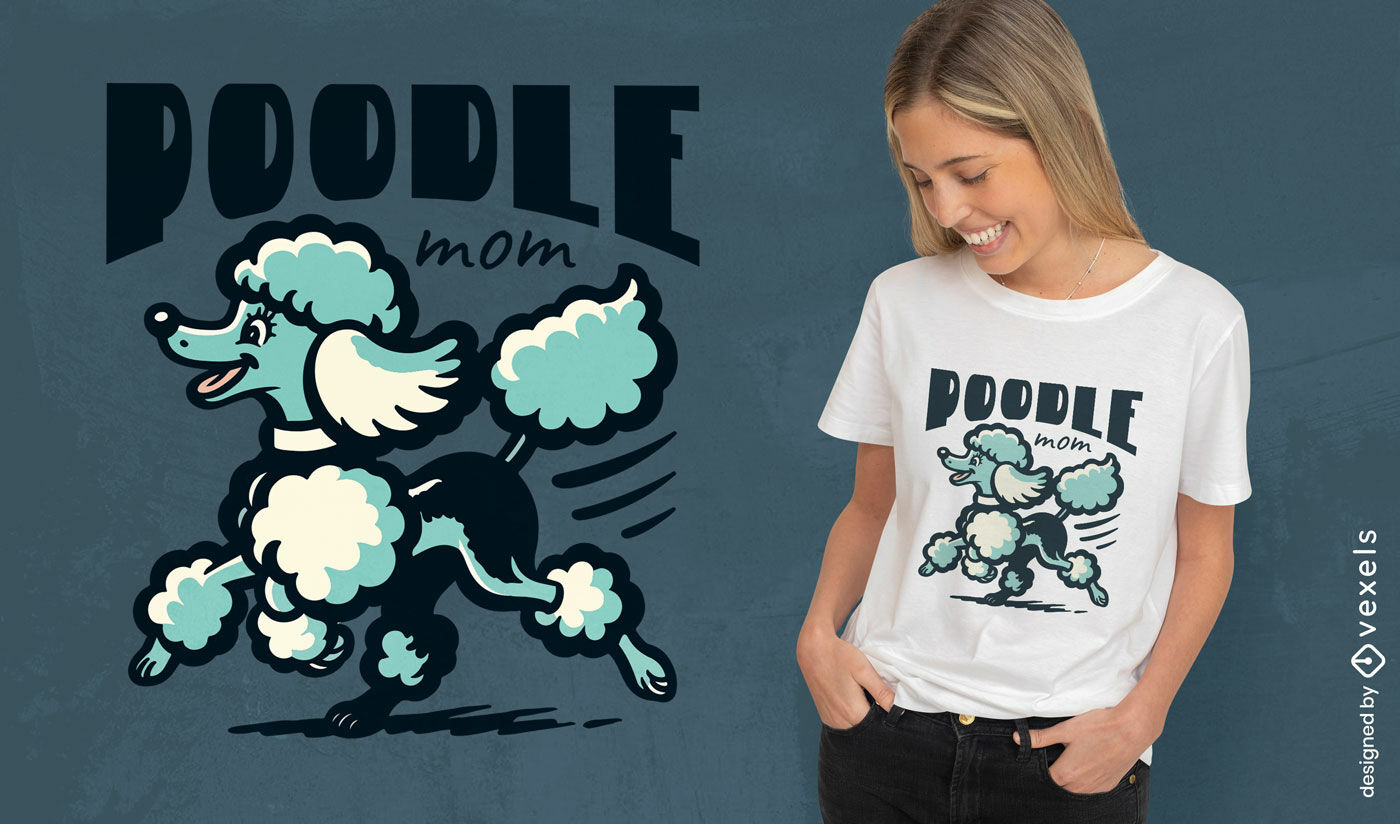
Design de camiseta para mãe de poodle
Escolha uma pasta
Todos os favoritos
Criar novo
Salvar
Design de camiseta para mãe de poodle
texto editável
Pronto para imprimir
para Merch
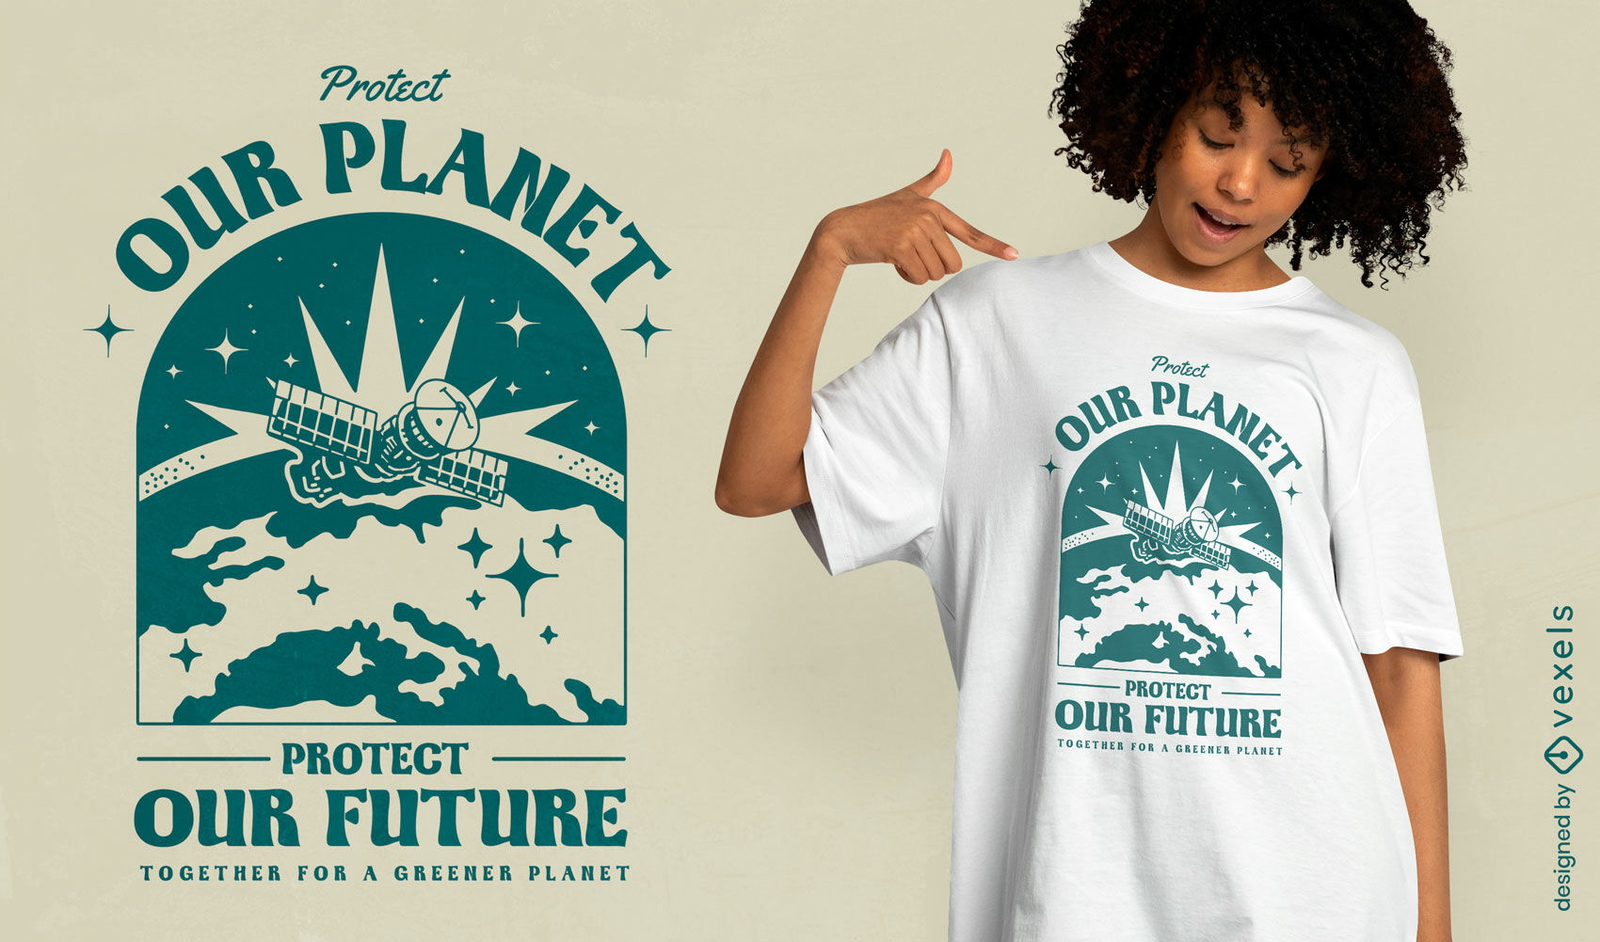
Design de camiseta proteja nosso planeta
Escolha uma pasta
Todos os favoritos
Criar novo
Salvar
Design de camiseta proteja nosso planeta
texto editável
Pronto para imprimir
para Merch
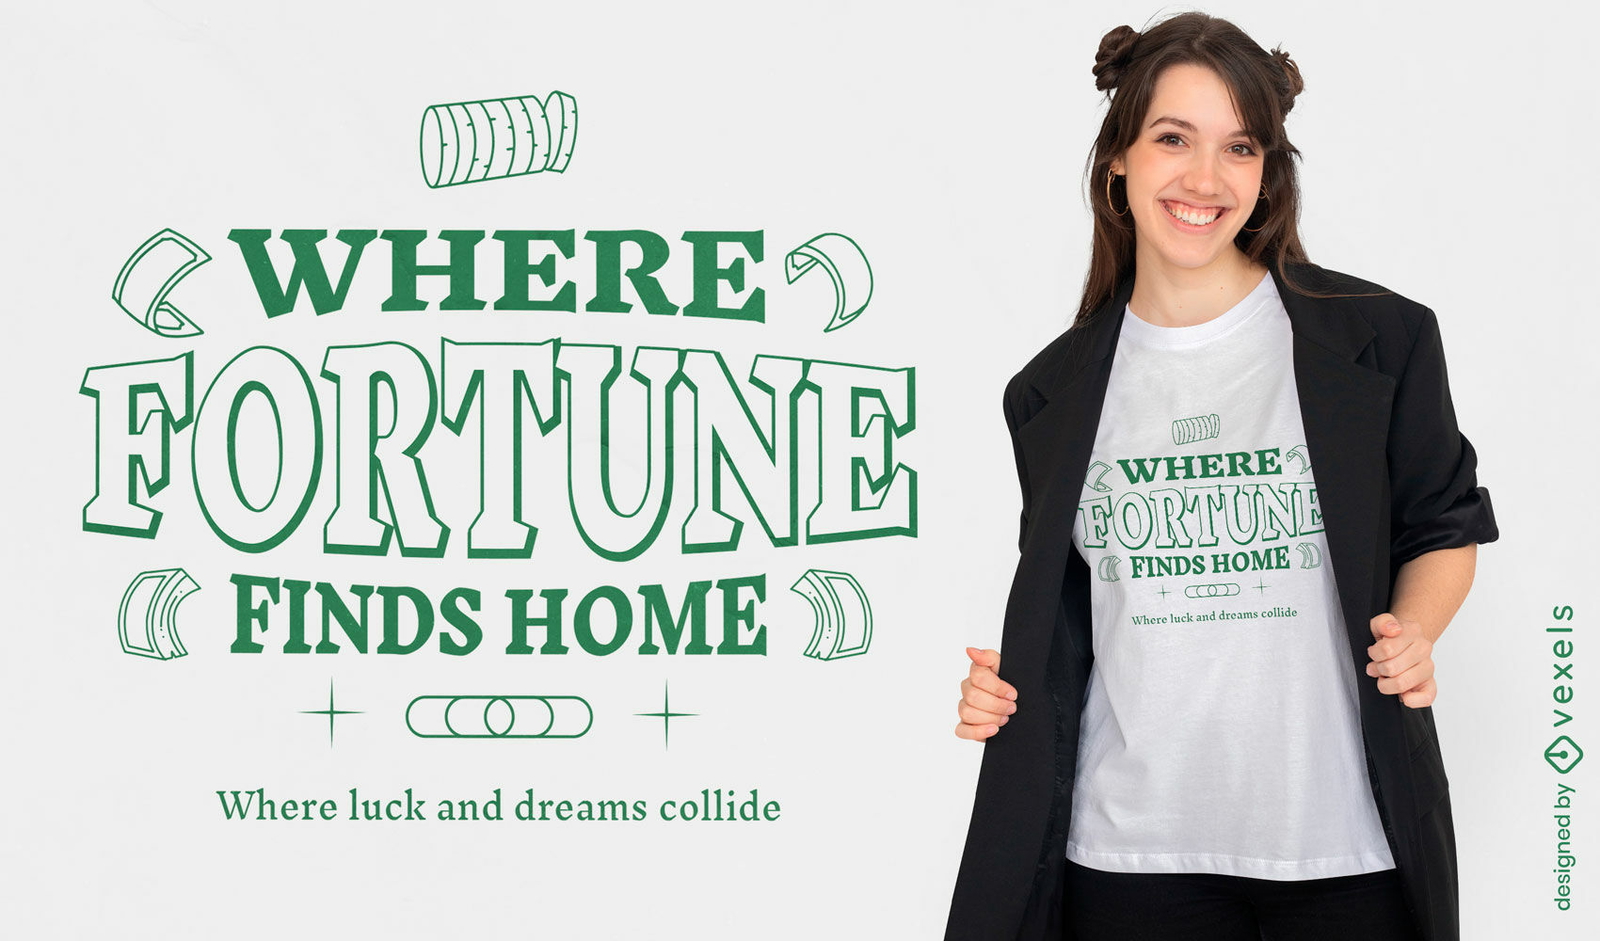
Design de camiseta com citação da sorte
Escolha uma pasta
Todos os favoritos
Criar novo
Salvar
Design de camiseta com citação da sorte
texto editável
Pronto para imprimir
para Merch
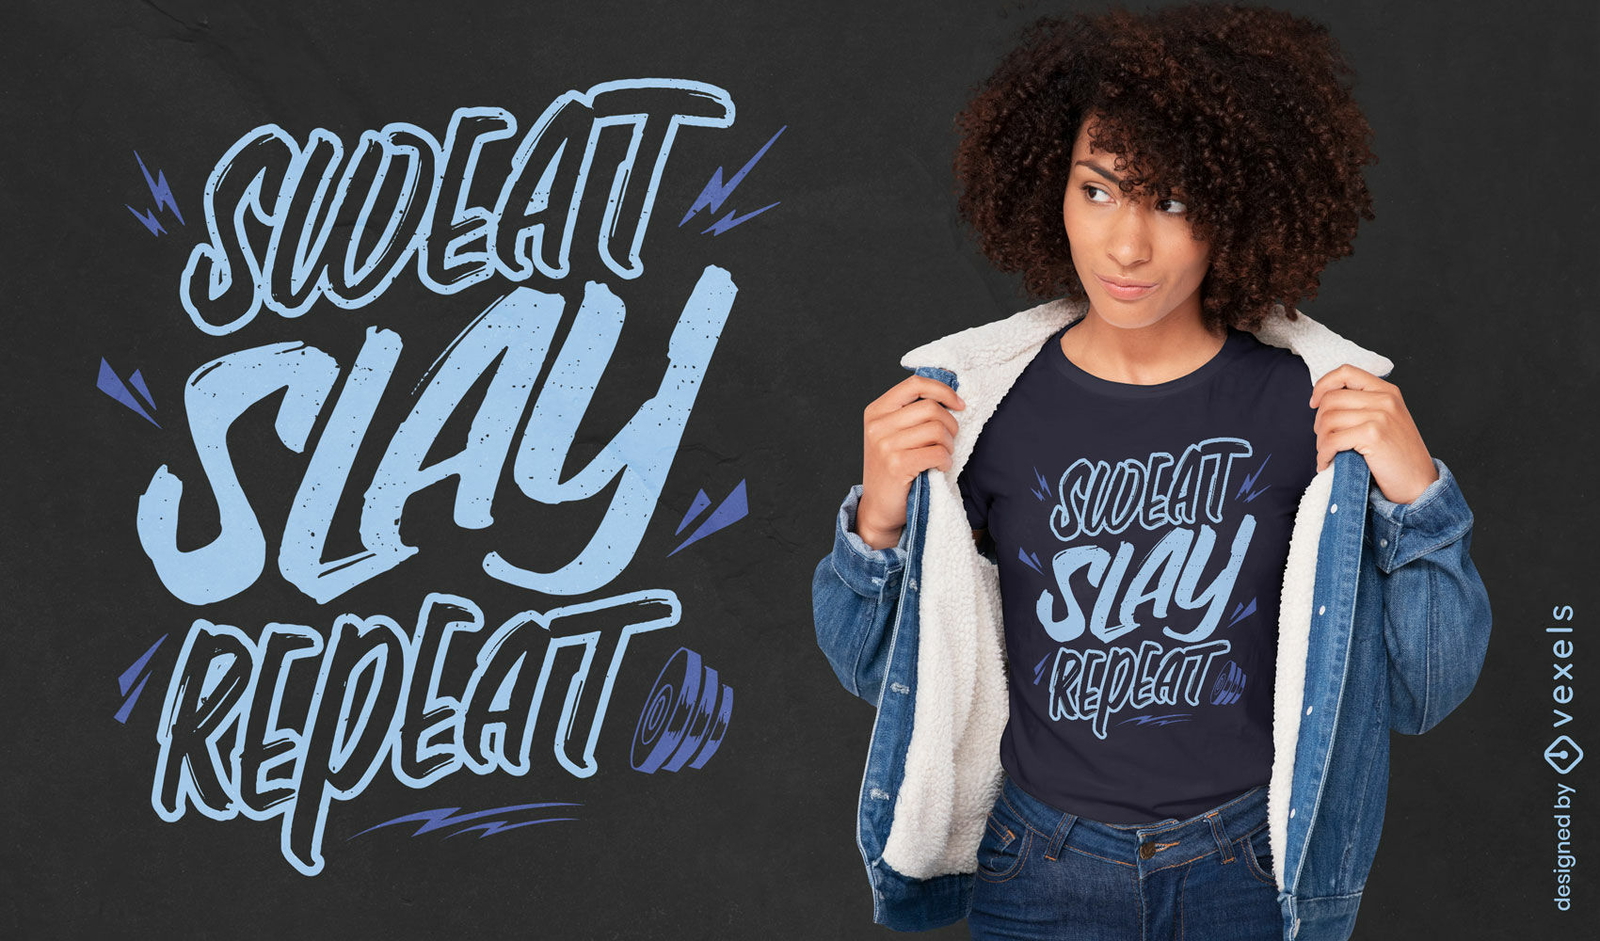
Design de camiseta motivacional de rotina de ginástica
Escolha uma pasta
Todos os favoritos
Criar novo
Salvar
Design de camiseta motivacional de rotina de ginástica
Gerado por IA, selecionado por nossos designers.
para Merch
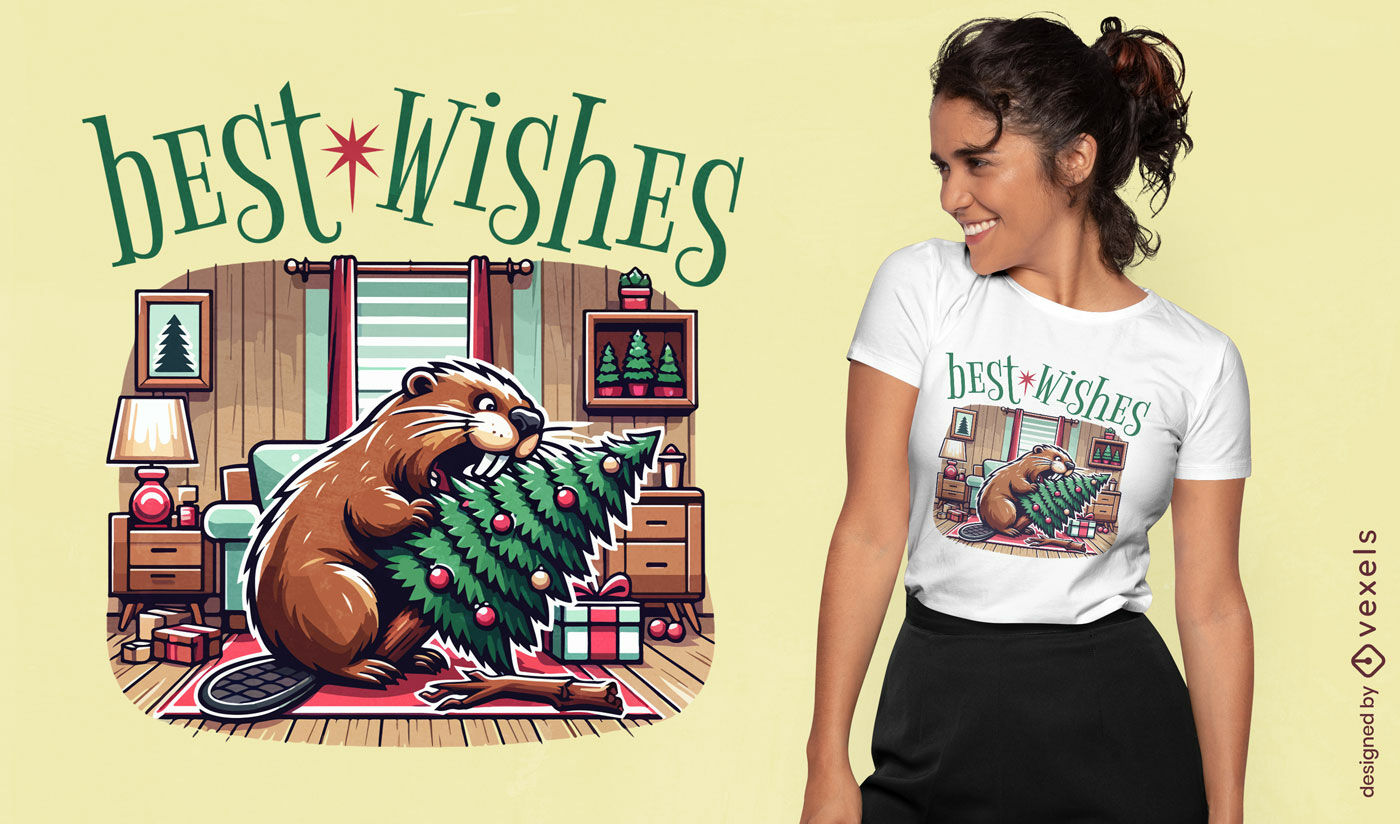
Design de camiseta com desejos de castor de Natal
Escolha uma pasta
Todos os favoritos
Criar novo
Salvar
Design de camiseta com desejos de castor de Natal
Gerado por IA, selecionado por nossos designers.
para Merch
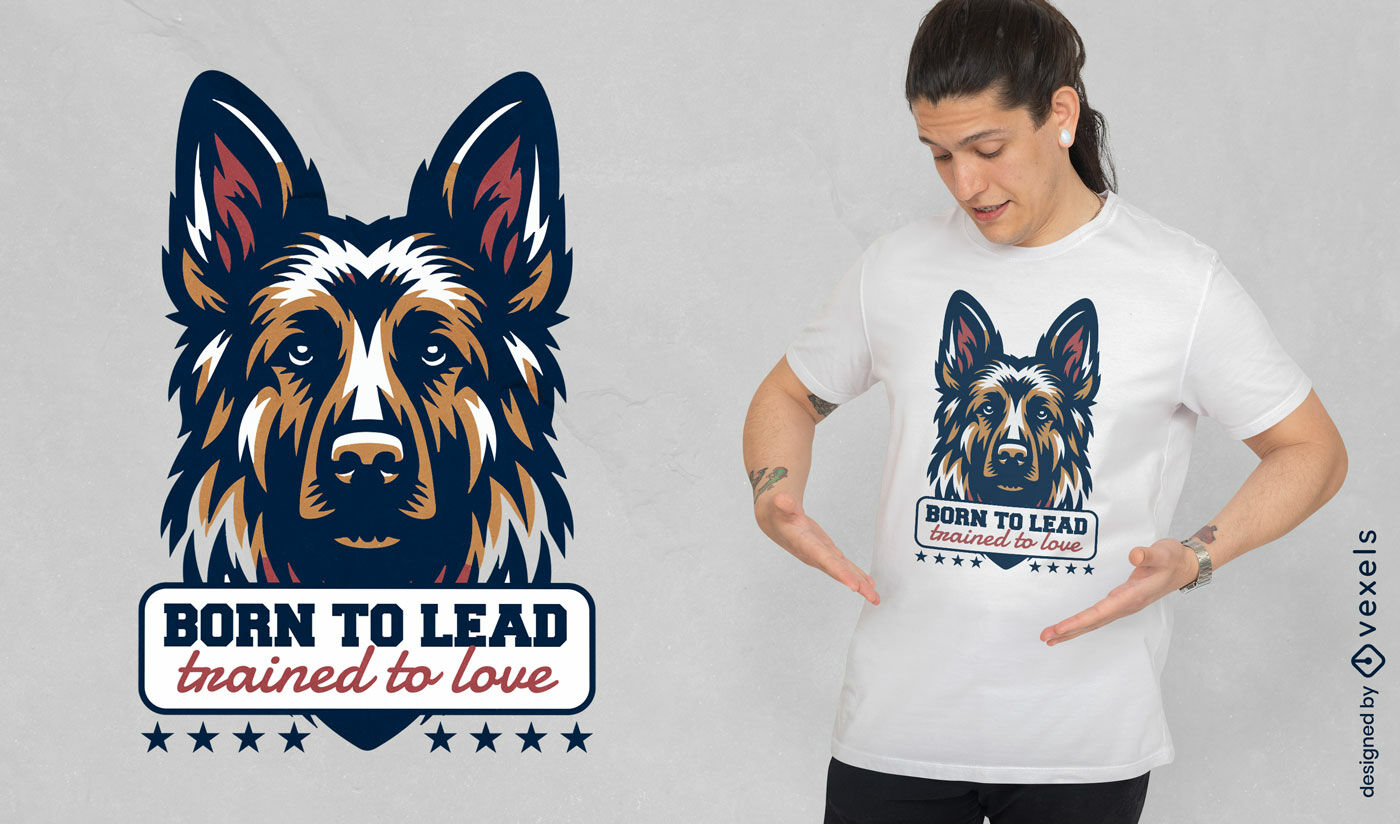
Design de camiseta líder pastor alemão
Escolha uma pasta
Todos os favoritos
Criar novo
Salvar
Design de camiseta líder pastor alemão
texto editável
Pronto para imprimir
para Merch
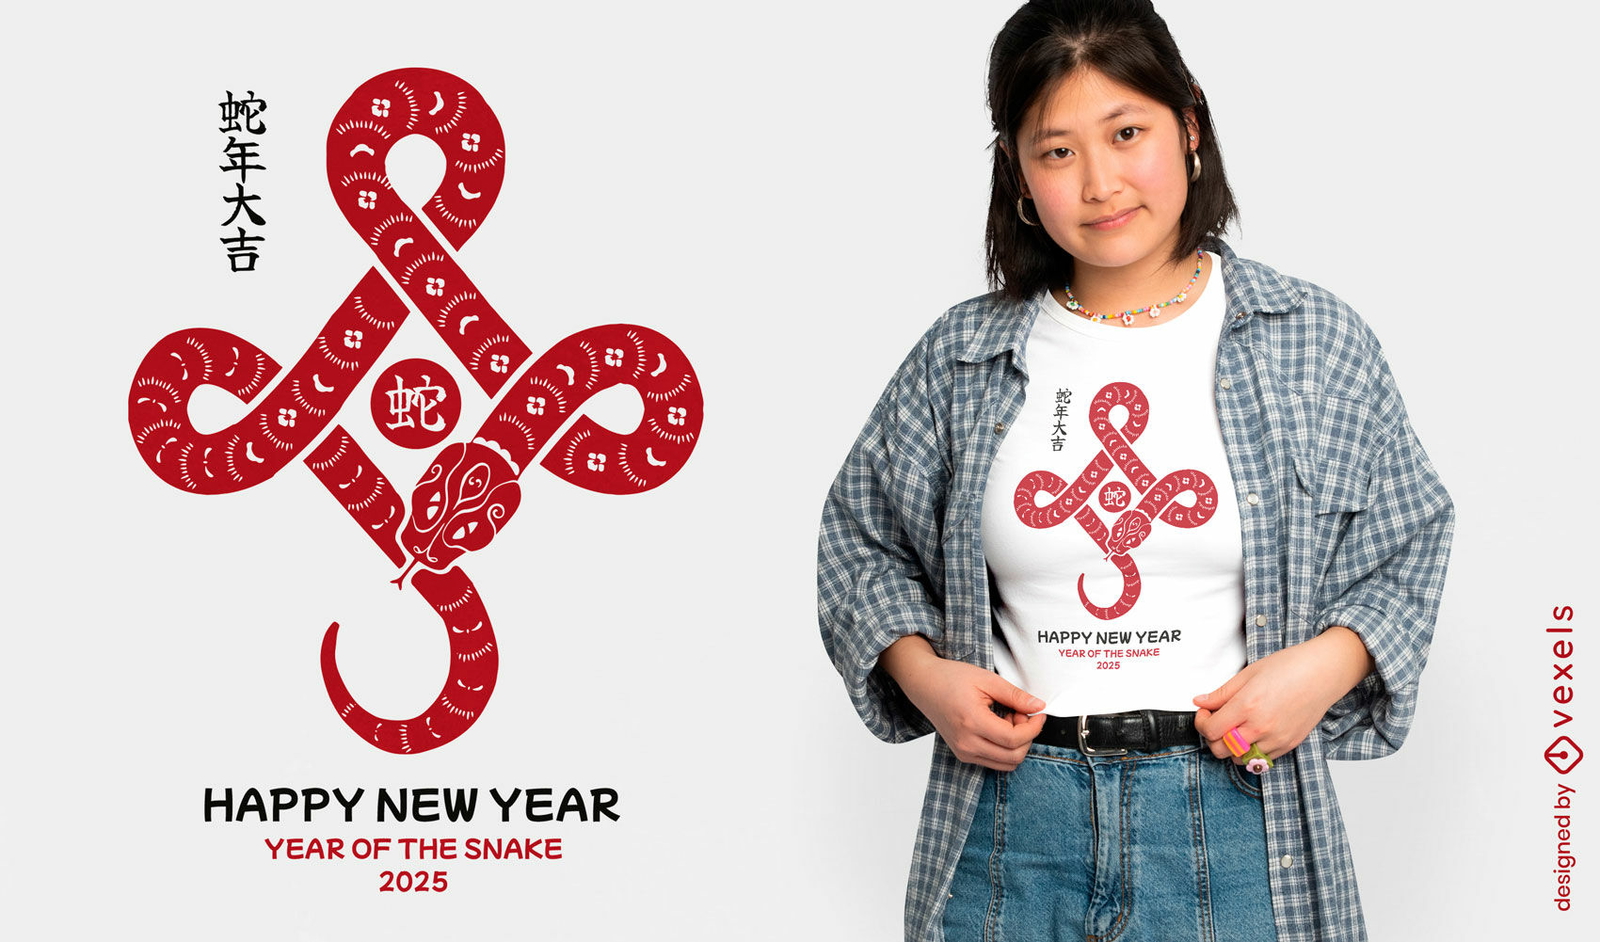
Design de camiseta oriental de cobra recortada em papel
Escolha uma pasta
Todos os favoritos
Criar novo
Salvar
Design de camiseta oriental de cobra recortada em papel
Gerado por IA, selecionado por nossos designers.
para Merch
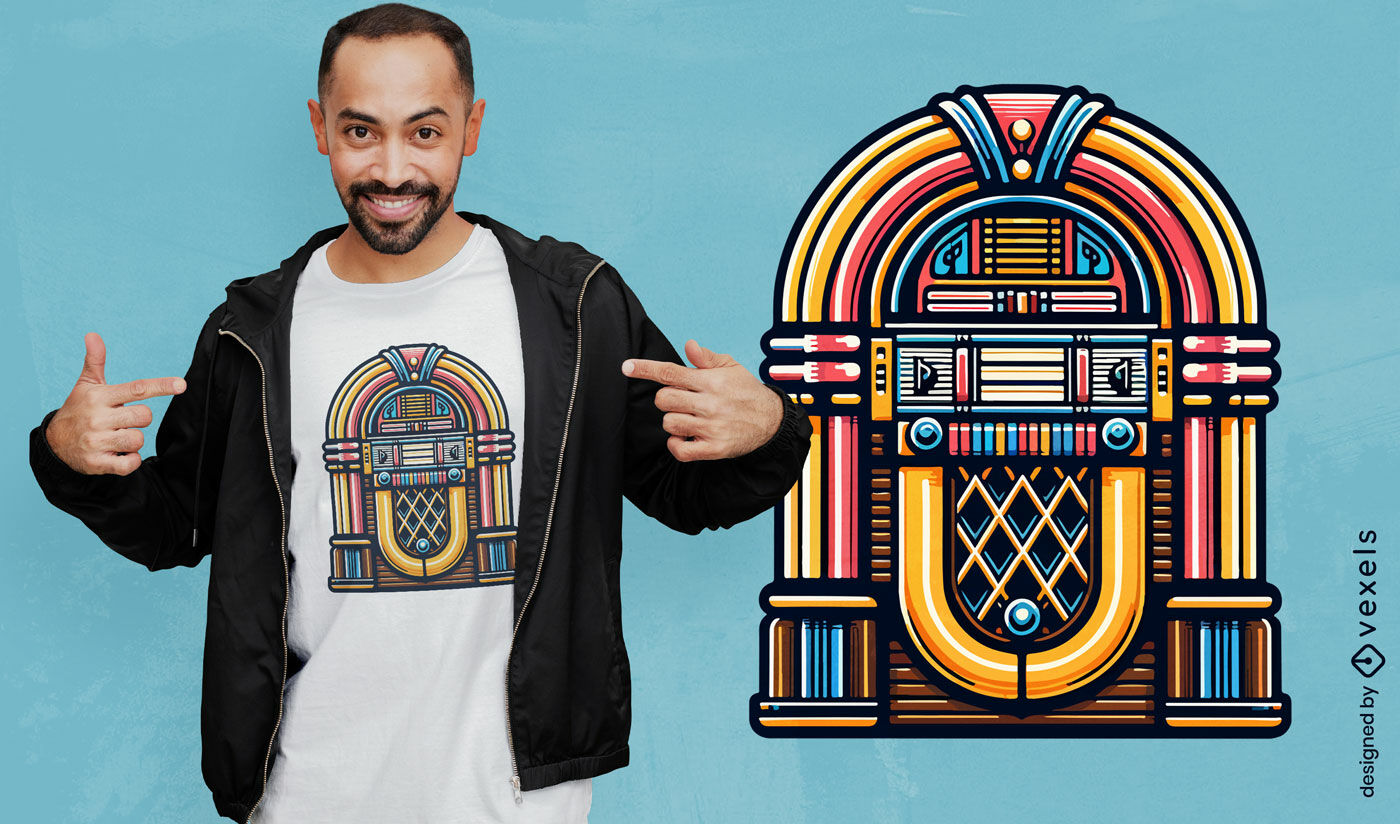
Design clássico de camiseta jukebox
Escolha uma pasta
Todos os favoritos
Criar novo
Salvar
Design clássico de camiseta jukebox
Impulsione seu negócio
Com a plataforma gráfica líder de mercado.
Ver planos
Próxima
do 546
prev page
next page