Biblioteca de design
Novos designs Merch
Camisetas
Vectores
Designs de Merch de Tendência
PNGs & SVGs
Mockups
Modelos de T-Shirt PSD
Explorar Desenhos
Designs KDP
Pôsteres
Canecas
Capas para celular
Sacos de compras
Almofadas
Ferramentas de desenho
Merch Designer
Novo!
Mockup Generator
Gerador de Design de AI
Vetorizador
Quote Generator
T-Shirt Maker (Antigo)
Ajuda
Merch Digest
Blog
Centro de Ajuda
Saiba mais sobre o Merch
Feedback
Soluções Corporativas
Empresa
Acesso à API
Estúdio de Design
Design em Lote
Preços
Carregando...
Inscrever-se
Conecte-se
Merch Vectors
graficos
Biblioteca de design
Novos designs Merch
Camisetas
Vectores
Designs de Merch de Tendência
PNGs & SVGs
Mockups
Modelos de T-Shirt PSD
Explorar Desenhos
Designs KDP
Pôsteres
Canecas
Capas para celular
Sacos de compras
Almofadas
Ferramentas de desenho
Merch Designer
Novo!
Mockup Generator
Gerador de Design de AI
Vetorizador
Quote Generator
T-Shirt Maker (Antigo)
Ajuda
Merch Digest
Blog
Centro de Ajuda
Saiba mais sobre o Merch
Feedback
Soluções Corporativas
Empresa
Acesso à API
Estúdio de Design
Design em Lote
PLANOS
Merch Vectors
graficos
27291 Designs Vetoriais de graficos para Camisetas e Merch
Baixar e comprar Designs Vetoriais AI de graficos para Camisetas, Capas do Celular, Capas do Livros e outros produtos Merch
Relacionado:
graficos vetoriais
,
desenhos graficos de ações
,
graficos tridimensionais
Ordenar por
Mais relevante
Resultados patrocinados da
Ganhe 15% de desconto com o código: VEXELS15
veja mais detalhes
texto editável
Pronto para imprimir
para Merch
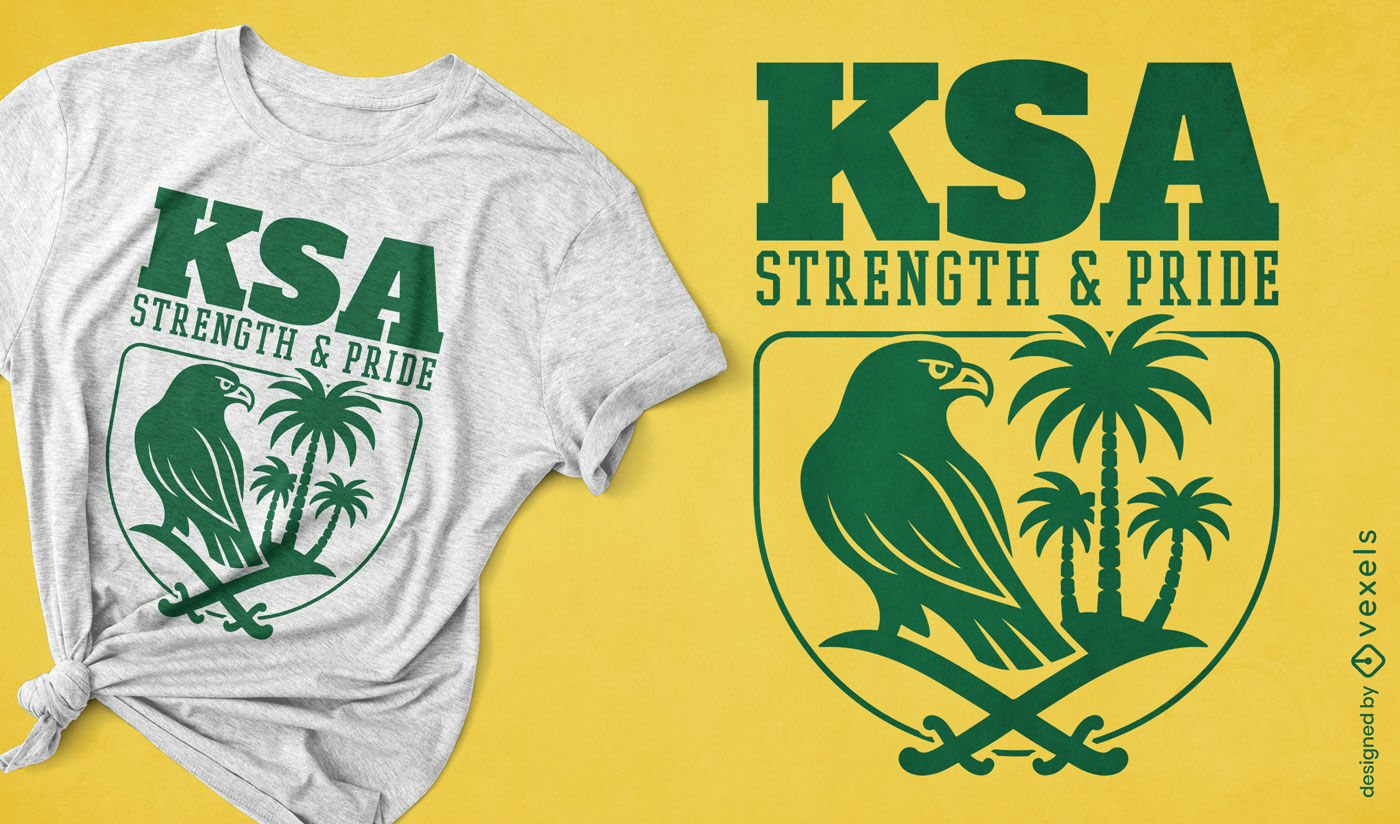
Design de camiseta com a força e o orgulho da Arábia Saudita
Escolha uma pasta
Todos os favoritos
Criar novo
Salvar
Design de camiseta com a força e o orgulho da Arábia Saudita
texto editável
Pronto para imprimir
para Merch
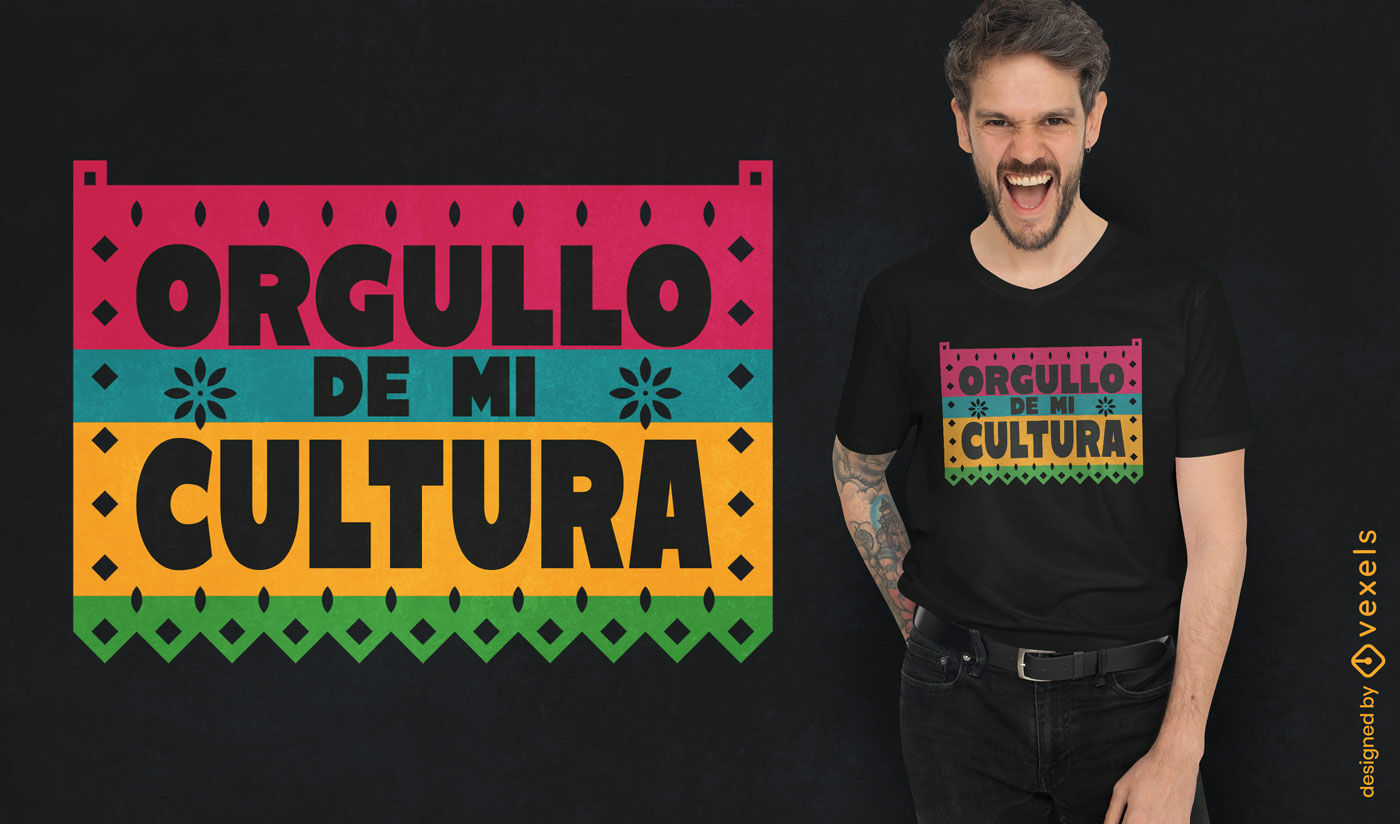
Design de camiseta com mensagem de orgulho cultural
Escolha uma pasta
Todos os favoritos
Criar novo
Salvar
Design de camiseta com mensagem de orgulho cultural
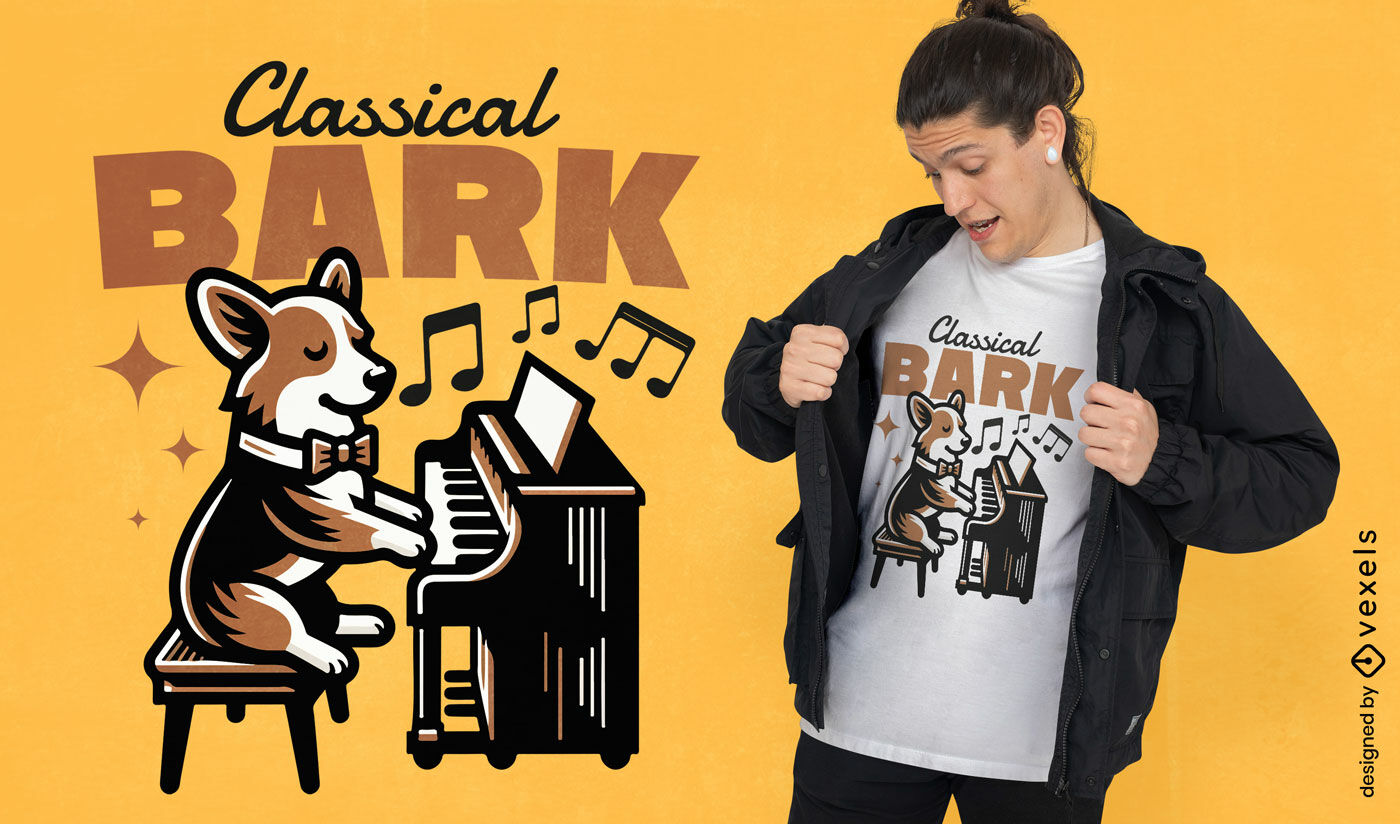
Gerado por IA, selecionado por nossos designers.
para Merch
Design de camiseta com piano corgi
Escolha uma pasta
Todos os favoritos
Criar novo
Salvar
Design de camiseta com piano corgi
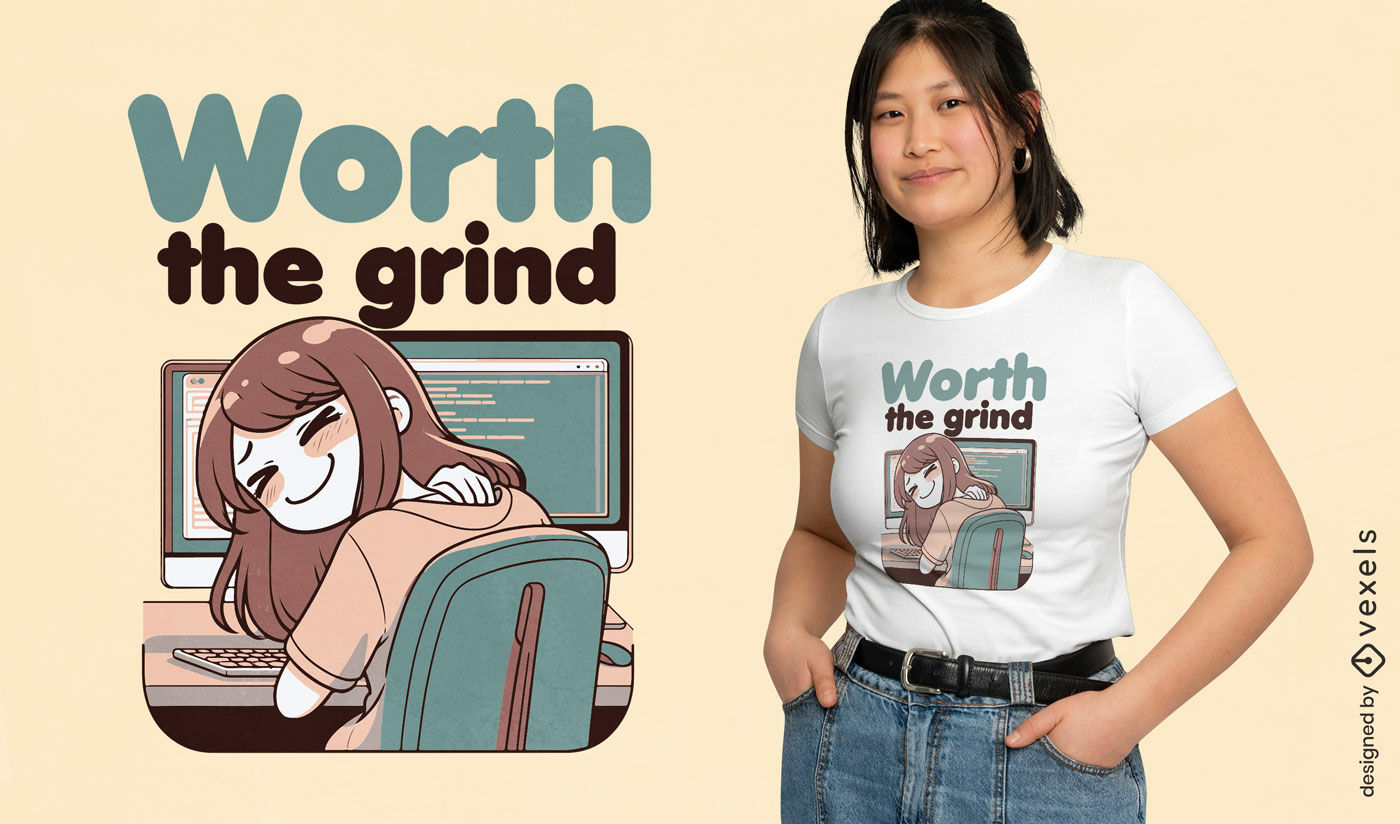
Gerado por IA, selecionado por nossos designers.
para Merch
Design de camiseta para garotas que vale a pena trabalhar
Escolha uma pasta
Todos os favoritos
Criar novo
Salvar
Design de camiseta para garotas que vale a pena trabalhar
texto editável
Pronto para imprimir
para Merch
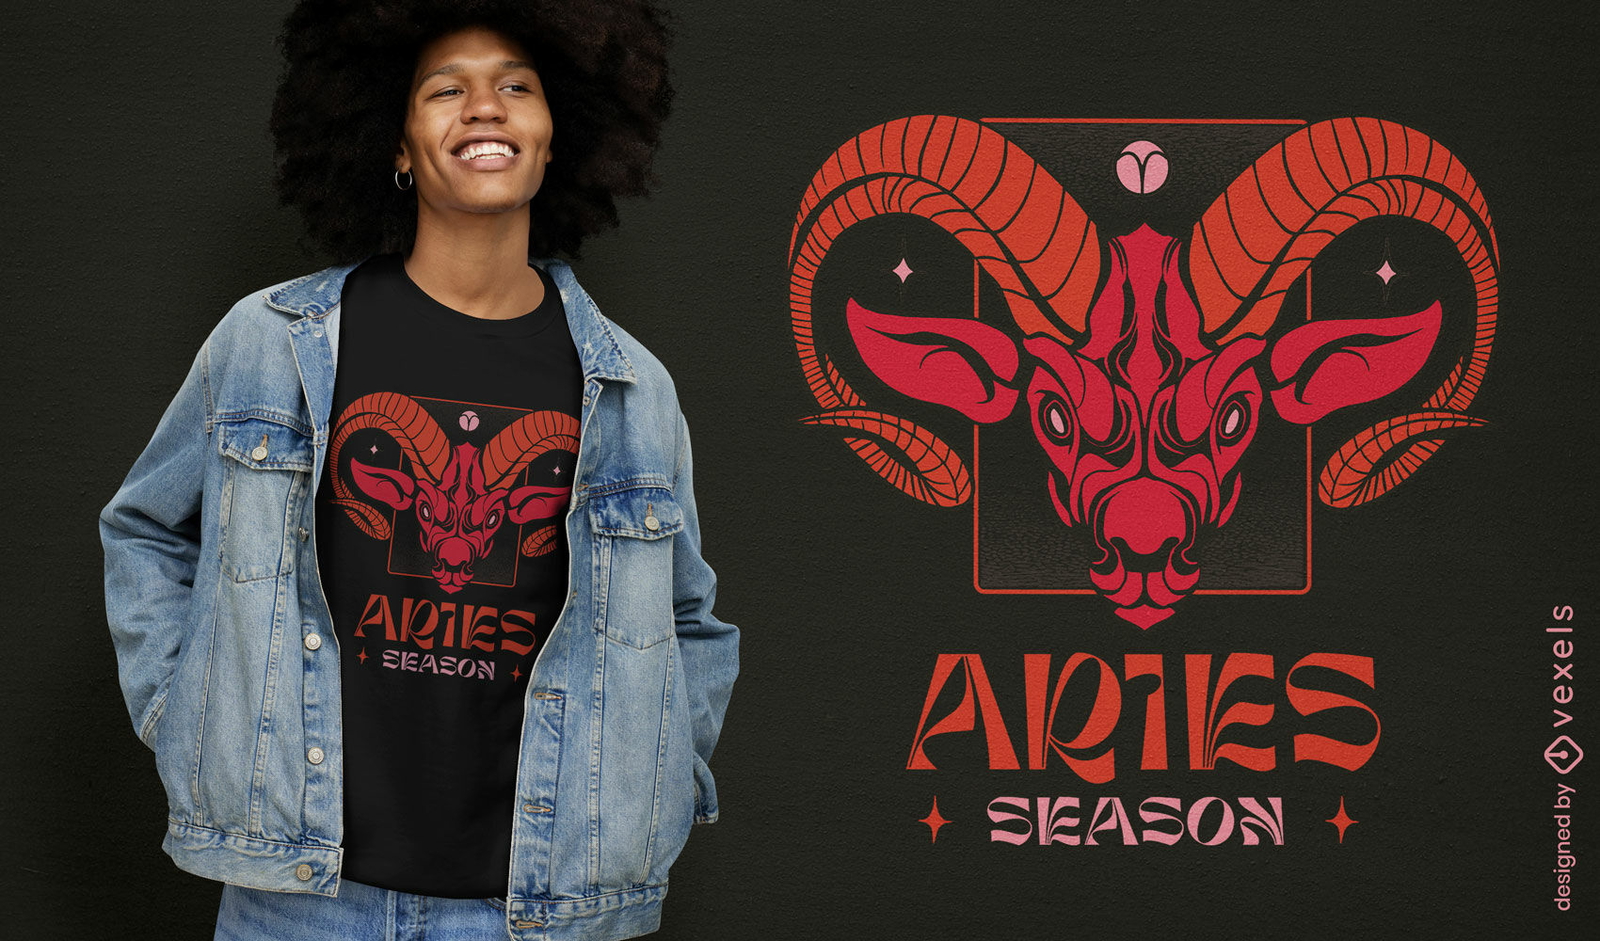
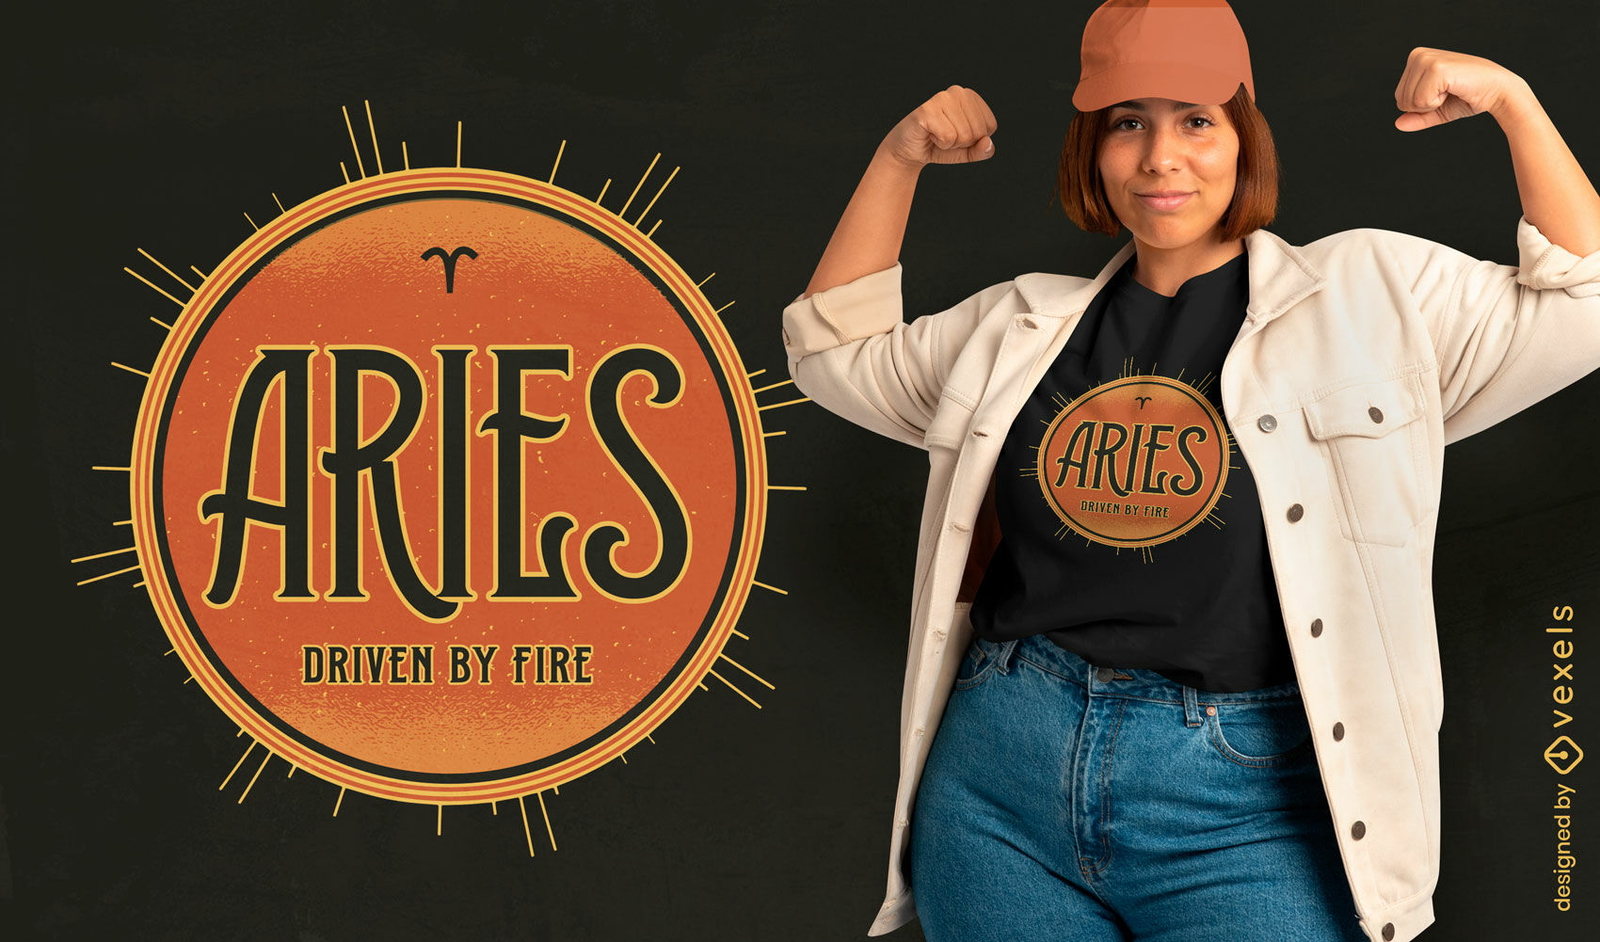
Design de camiseta com o signo de Áries
Escolha uma pasta
Todos os favoritos
Criar novo
Salvar
Design de camiseta com o signo de Áries
Gerado por IA, selecionado por nossos designers.
para Merch
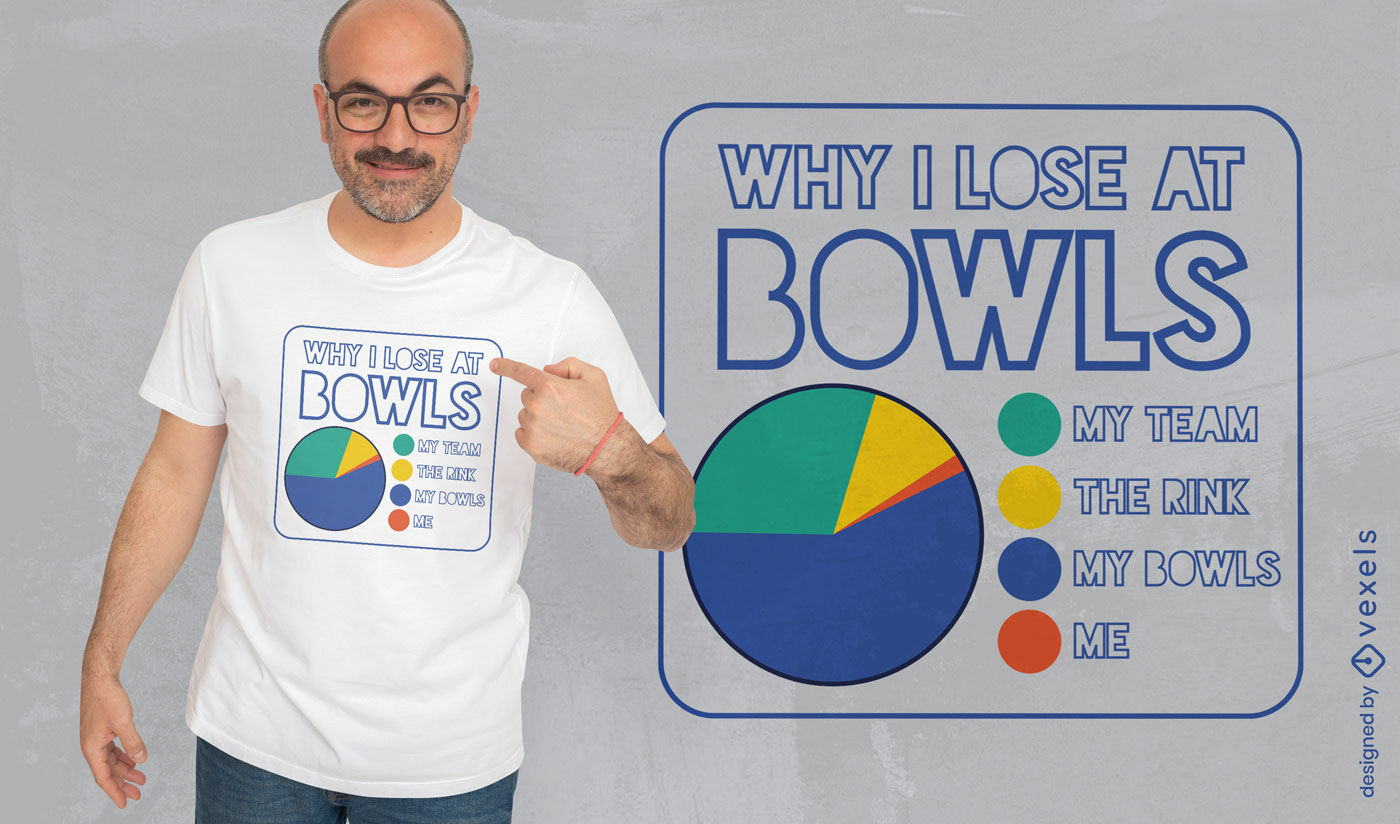
Design de camiseta explicativa sobre derrota no boliche
Escolha uma pasta
Todos os favoritos
Criar novo
Salvar
Design de camiseta explicativa sobre derrota no boliche
texto editável
Pronto para imprimir
para Merch
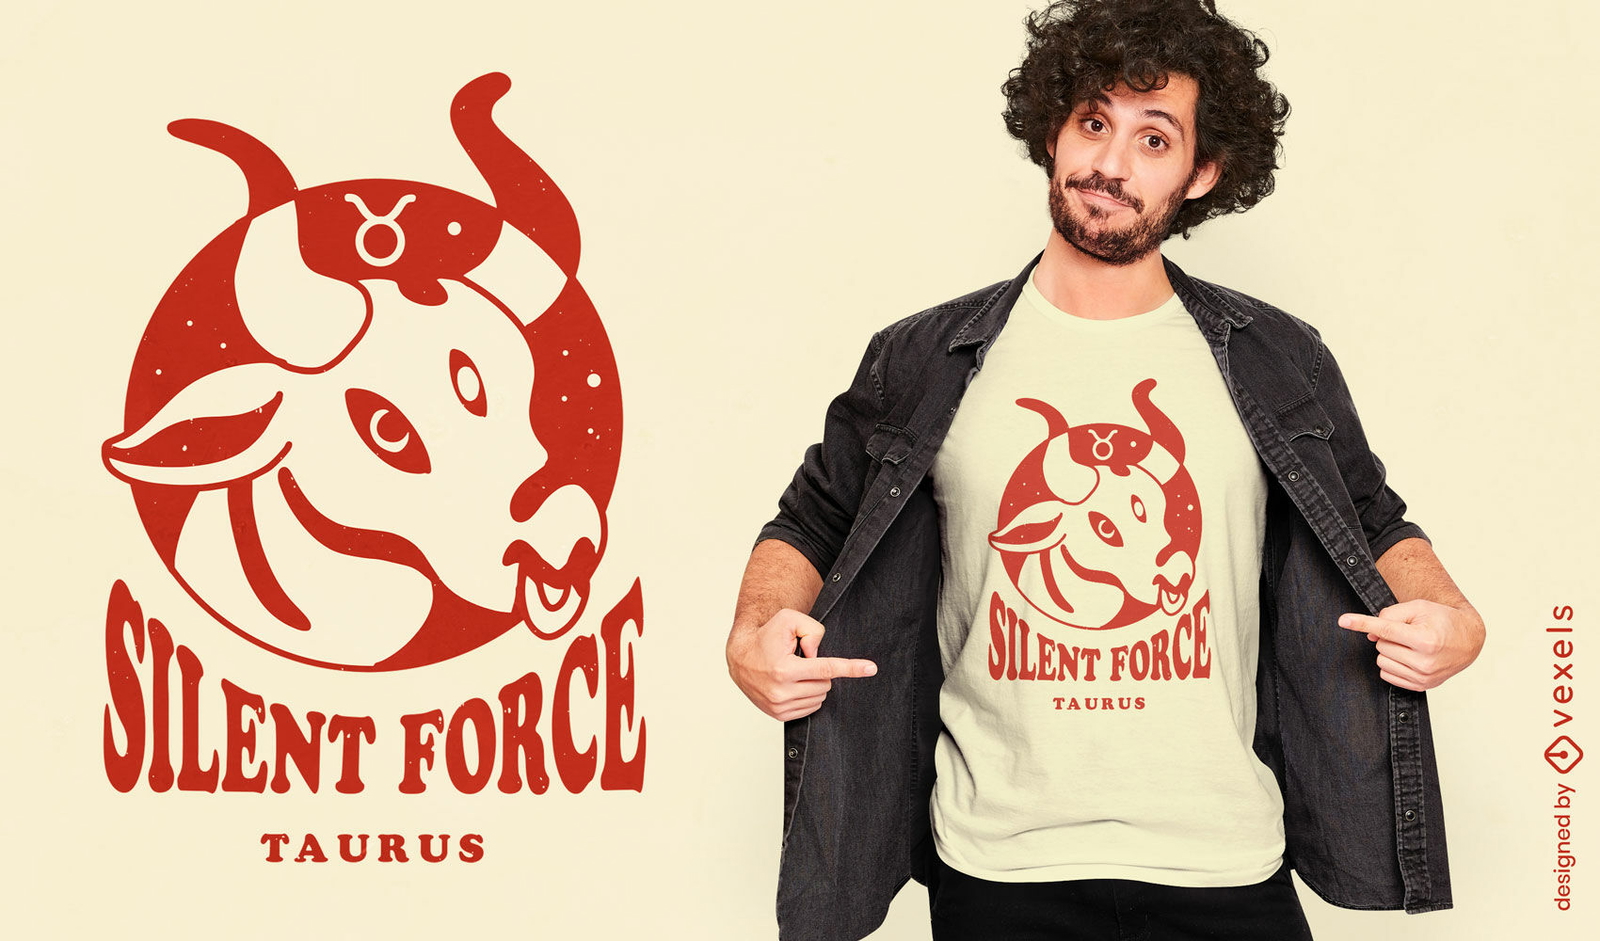
Design de camiseta da força silenciosa de Touro
Escolha uma pasta
Todos os favoritos
Criar novo
Salvar
Design de camiseta da força silenciosa de Touro
texto editável
Pronto para imprimir
para Merch
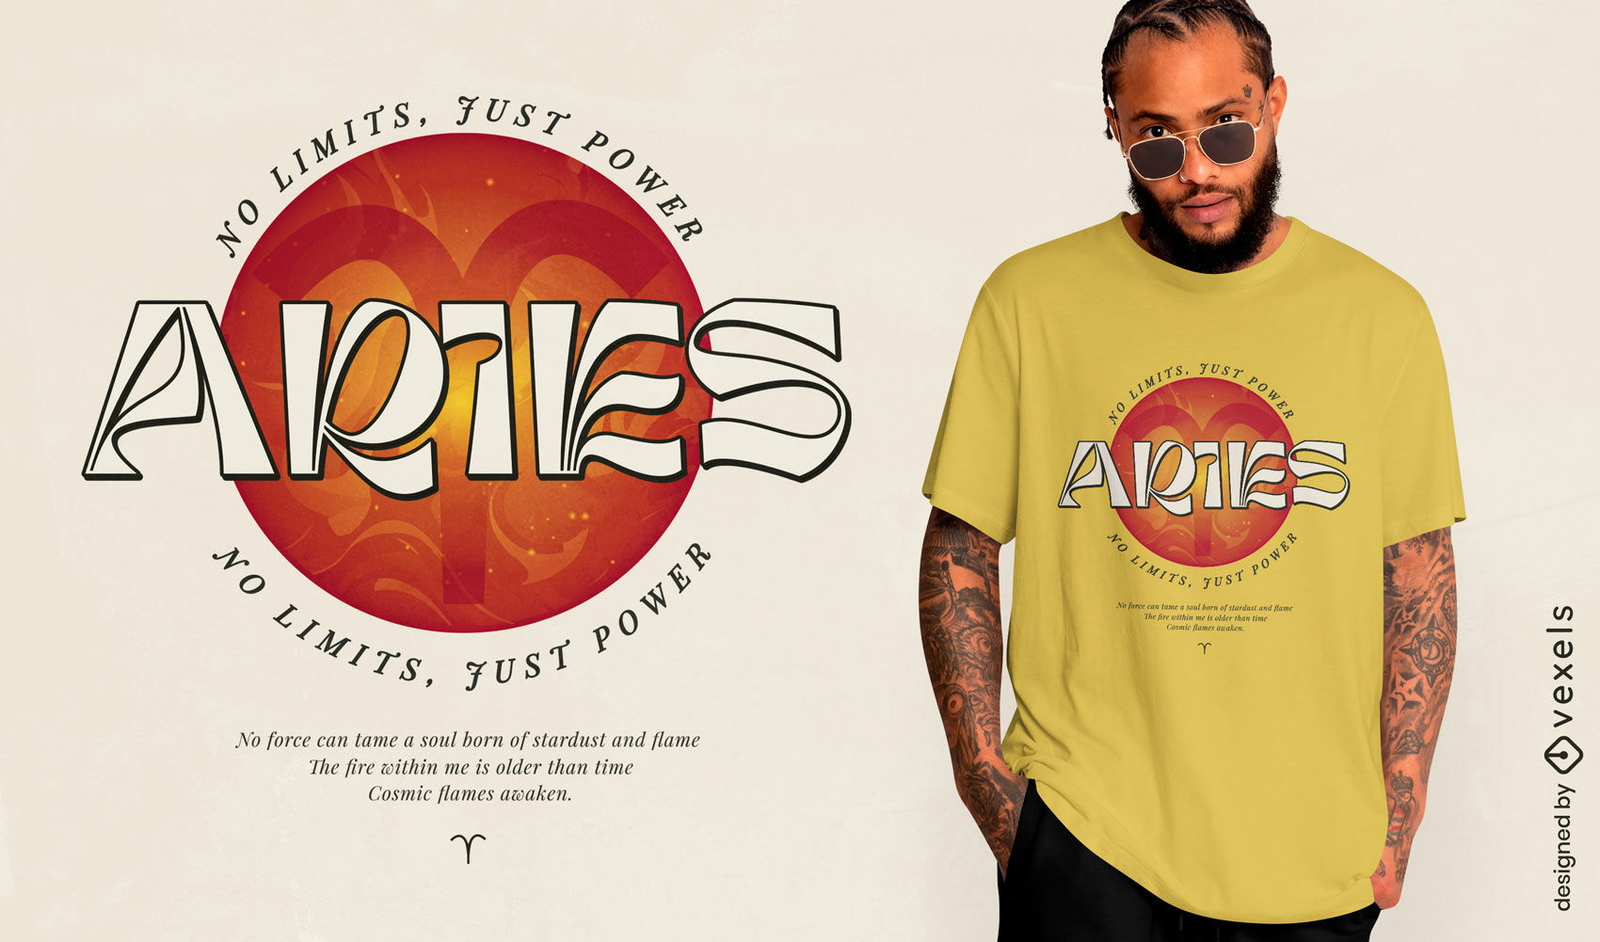
Camiseta Áries sem limites, apenas poder
Escolha uma pasta
Todos os favoritos
Criar novo
Salvar
Camiseta Áries sem limites, apenas poder
texto editável
Pronto para imprimir
para Merch
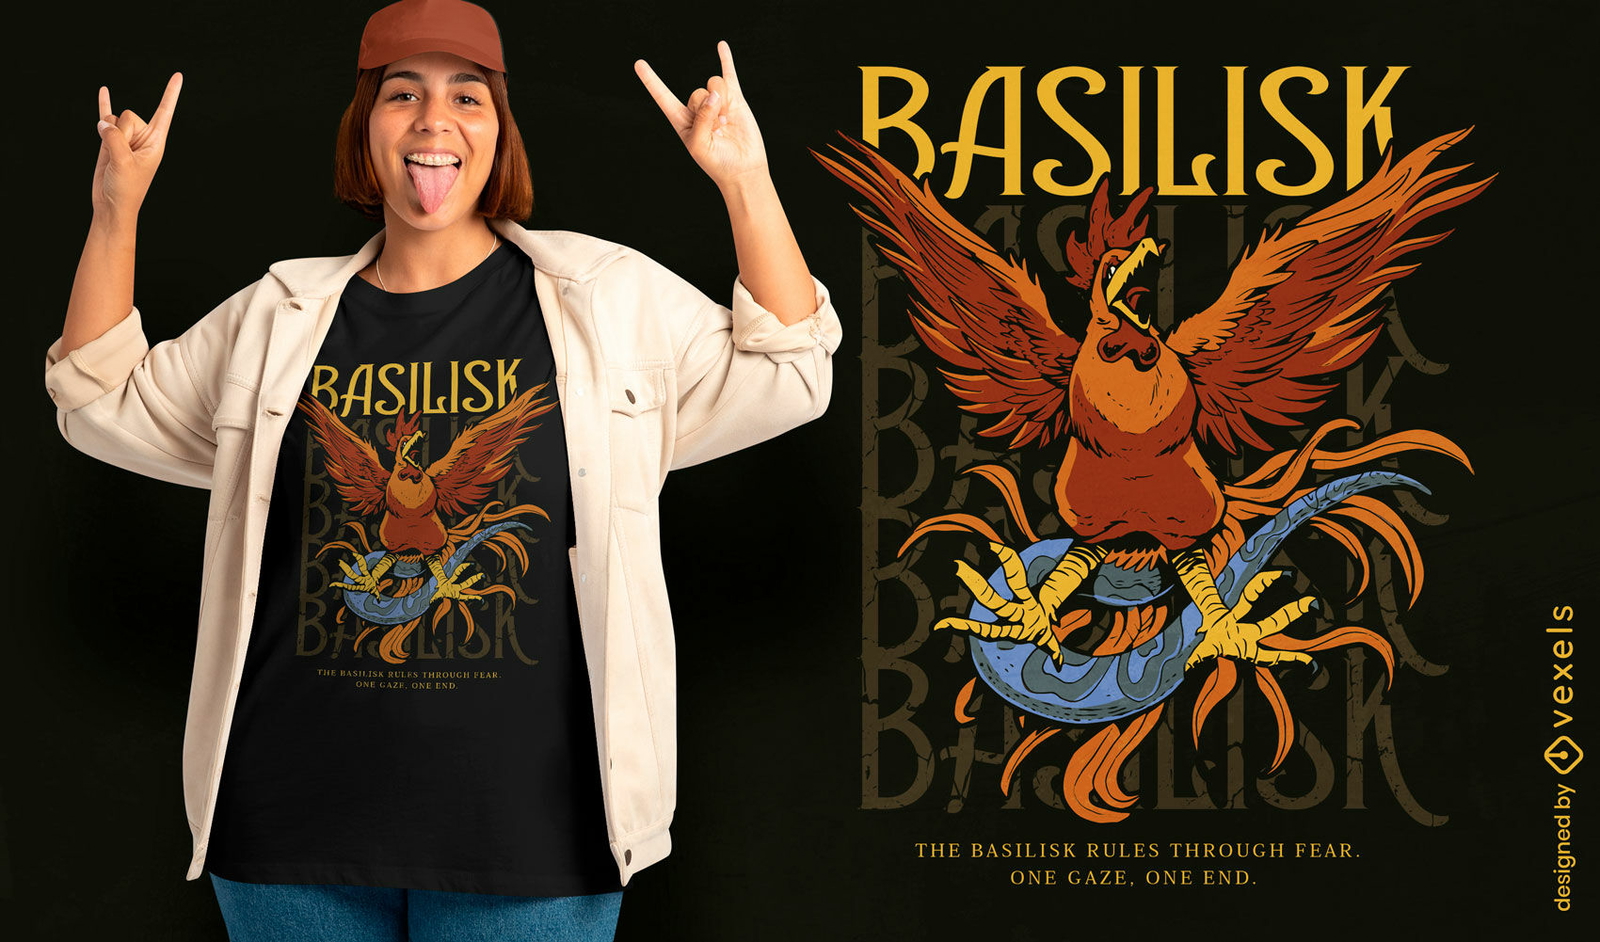
Design de camiseta com um basilisco mítico
Escolha uma pasta
Todos os favoritos
Criar novo
Salvar
Design de camiseta com um basilisco mítico
texto editável
Pronto para imprimir
para Merch
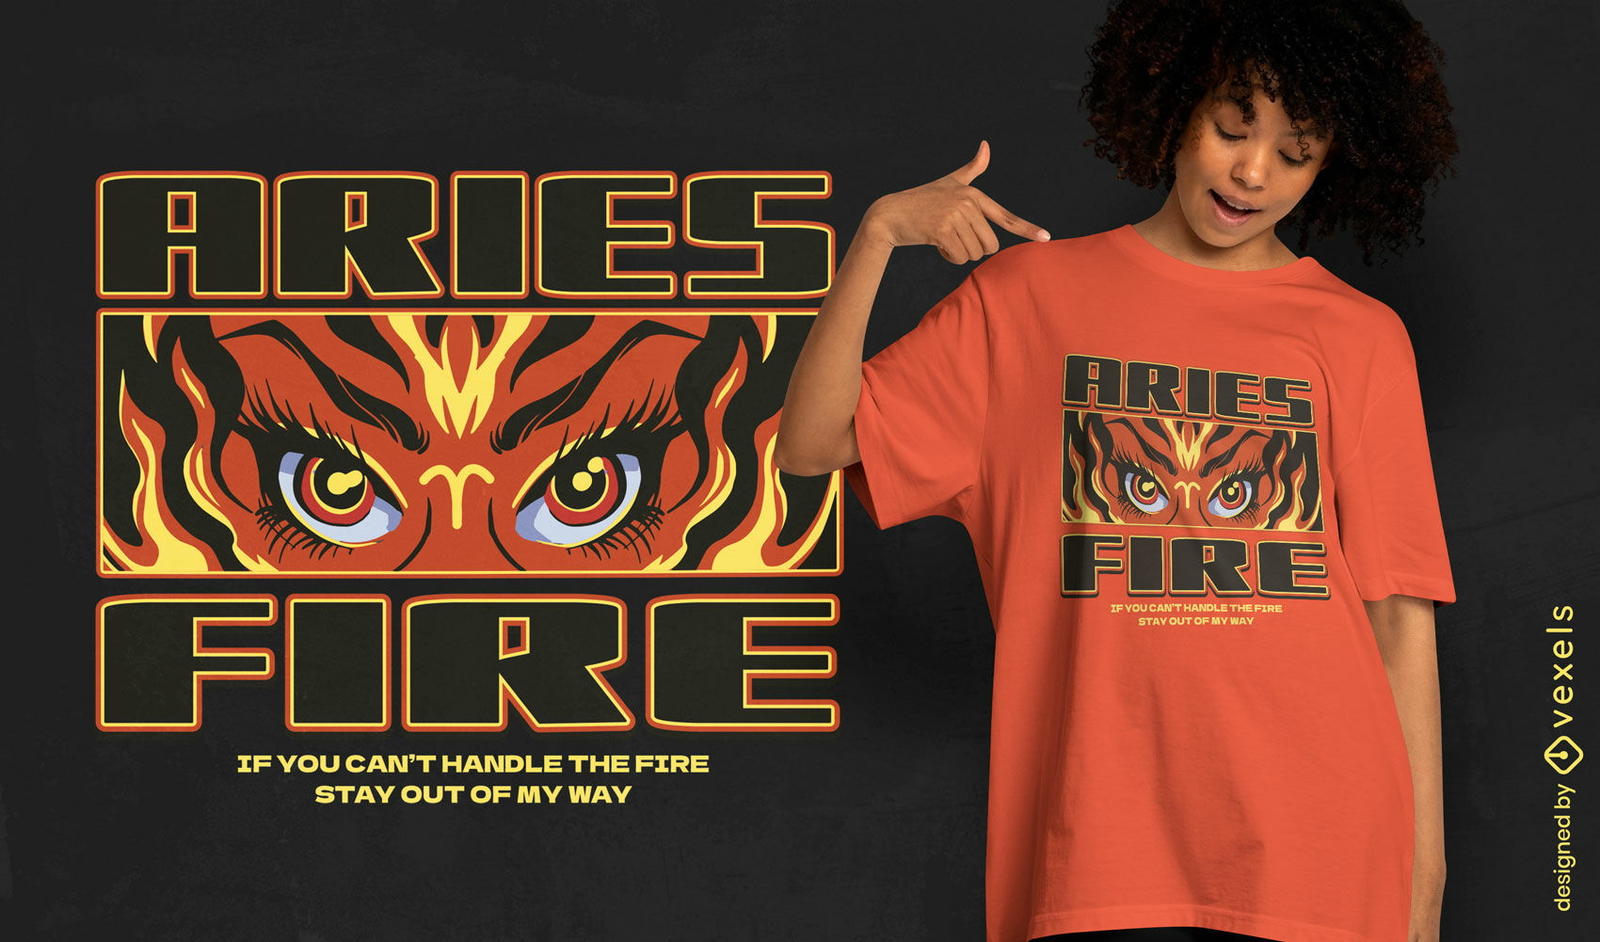
Design de camiseta com o signo de Áries movido pelo fogo
Escolha uma pasta
Todos os favoritos
Criar novo
Salvar
Design de camiseta com o signo de Áries movido pelo fogo
texto editável
Pronto para imprimir
para Merch
Design ousado de camiseta com tema de fogo em Áries
Escolha uma pasta
Todos os favoritos
Criar novo
Salvar
Design ousado de camiseta com tema de fogo em Áries
texto editável
Pronto para imprimir
para Merch
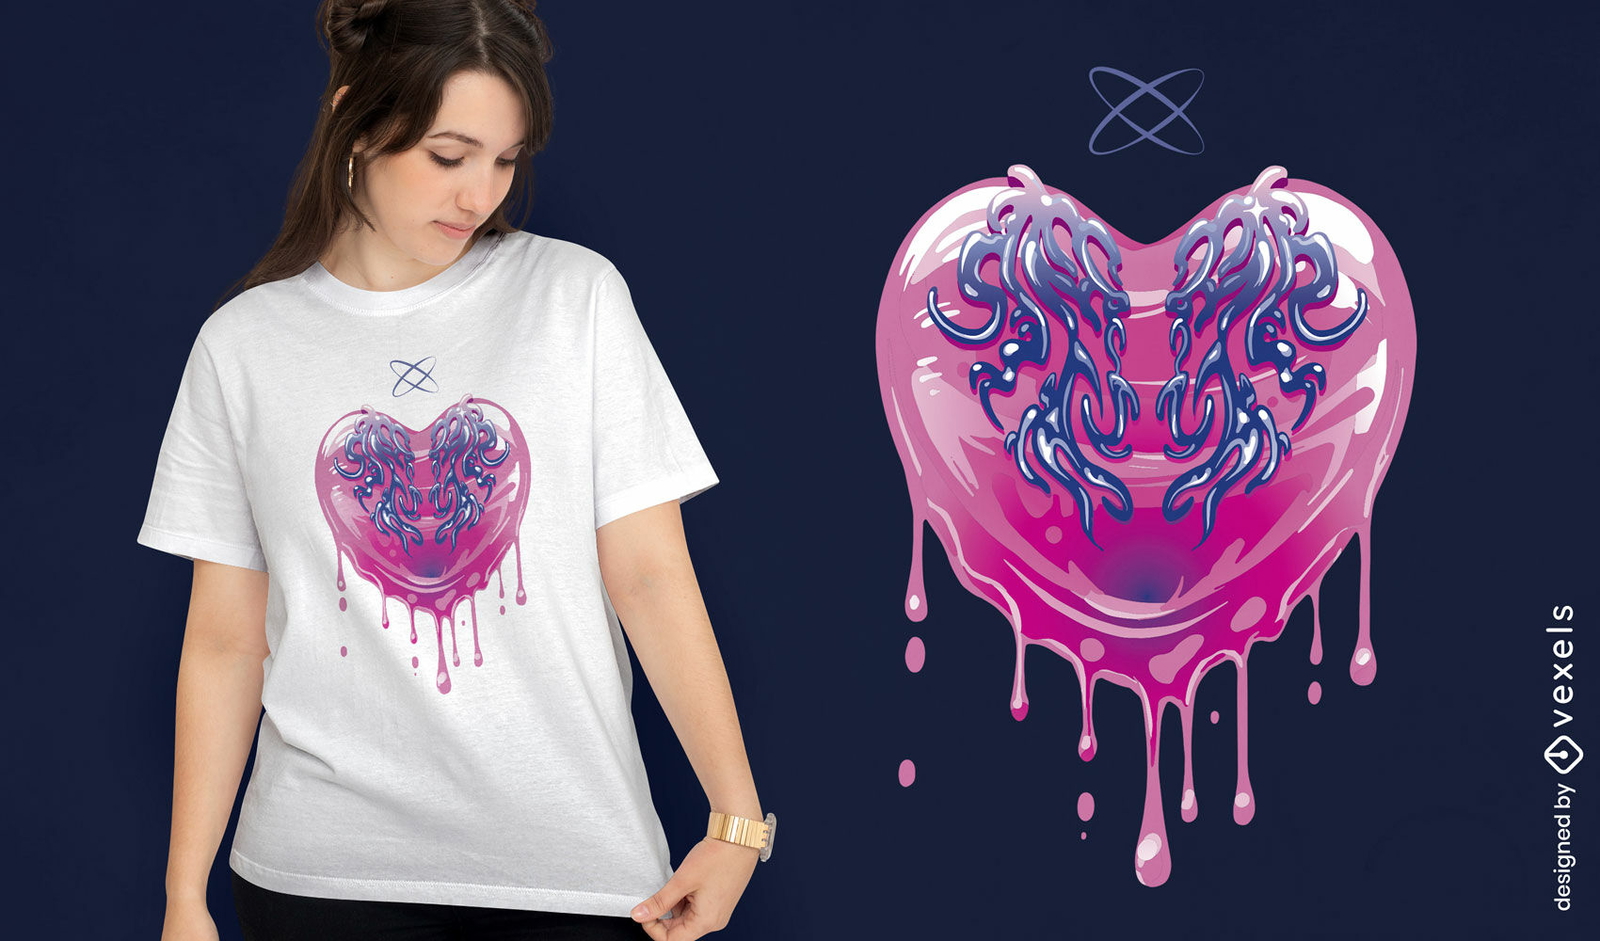
Design de camiseta com coração pingando Y3K
Escolha uma pasta
Todos os favoritos
Criar novo
Salvar
Design de camiseta com coração pingando Y3K
texto editável
Pronto para imprimir
para Merch
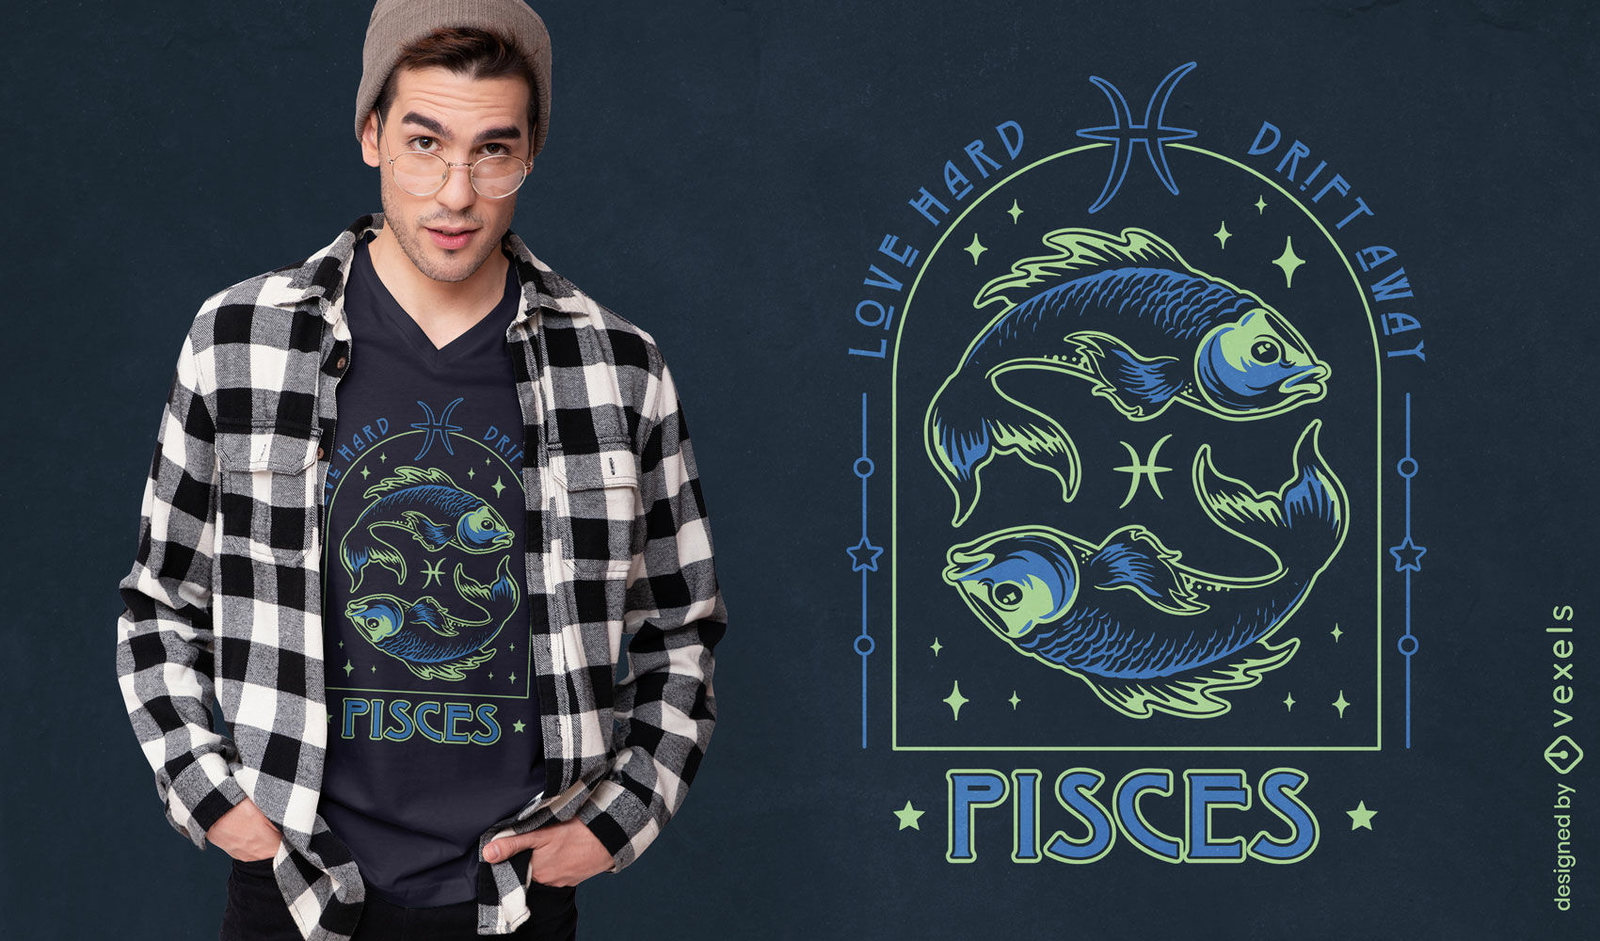
Design de camiseta profundidades indomáveis de peixes
Escolha uma pasta
Todos os favoritos
Criar novo
Salvar
Design de camiseta profundidades indomáveis de peixes
texto editável
Pronto para imprimir
para Merch
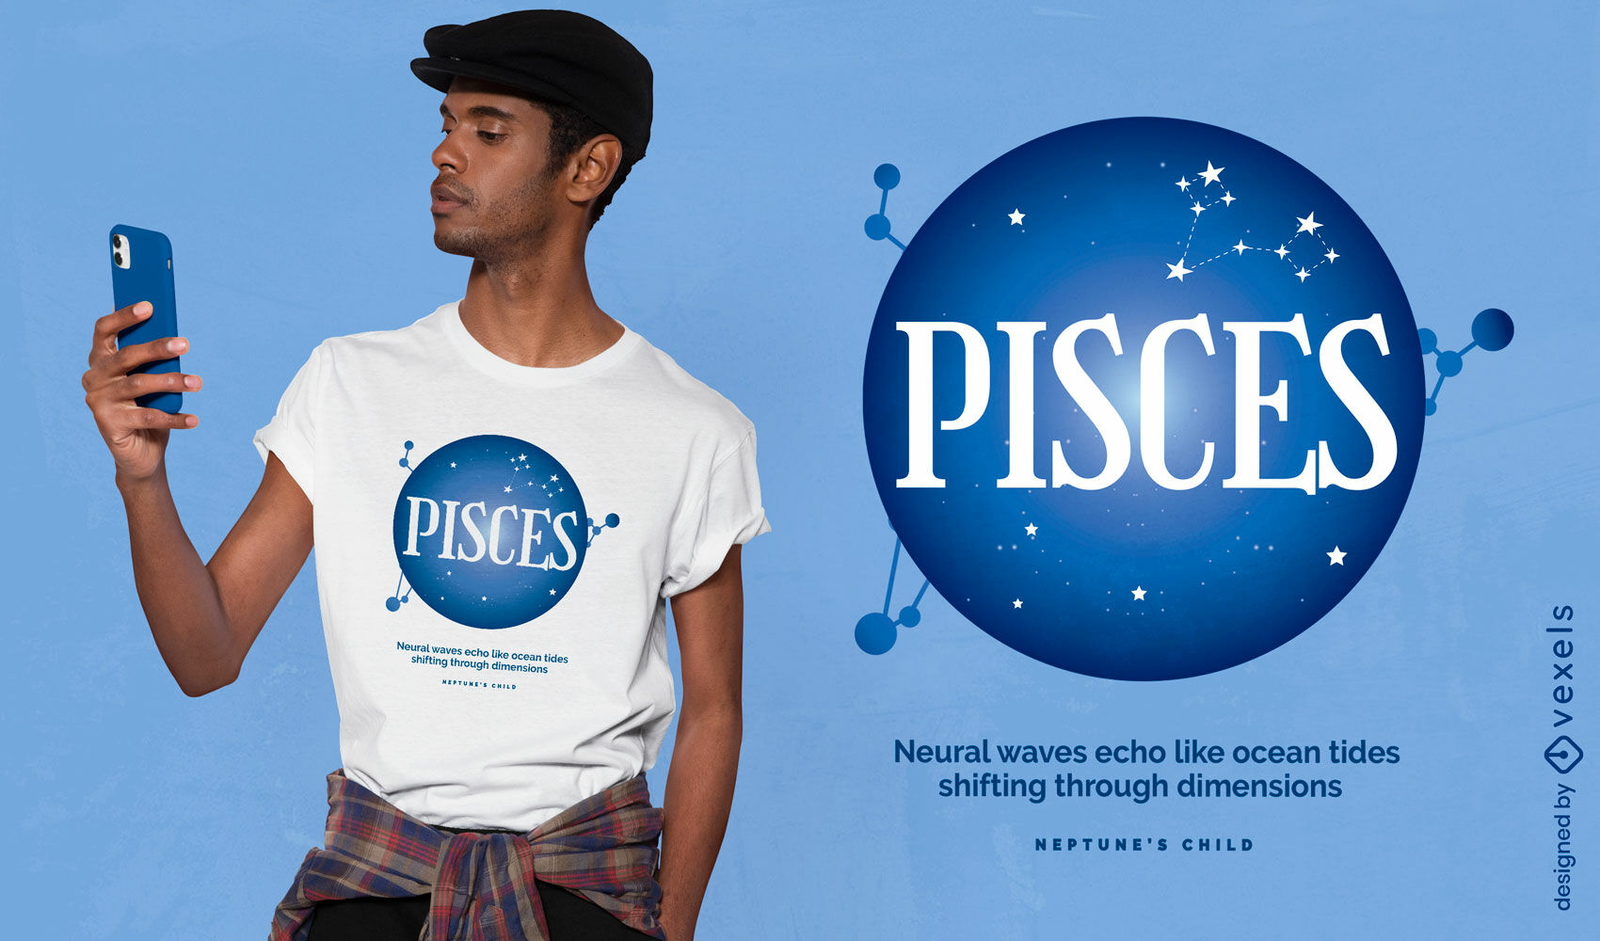
Design de camiseta do oceano cósmico de Peixes
Escolha uma pasta
Todos os favoritos
Criar novo
Salvar
Design de camiseta do oceano cósmico de Peixes
texto editável
Pronto para imprimir
para Merch
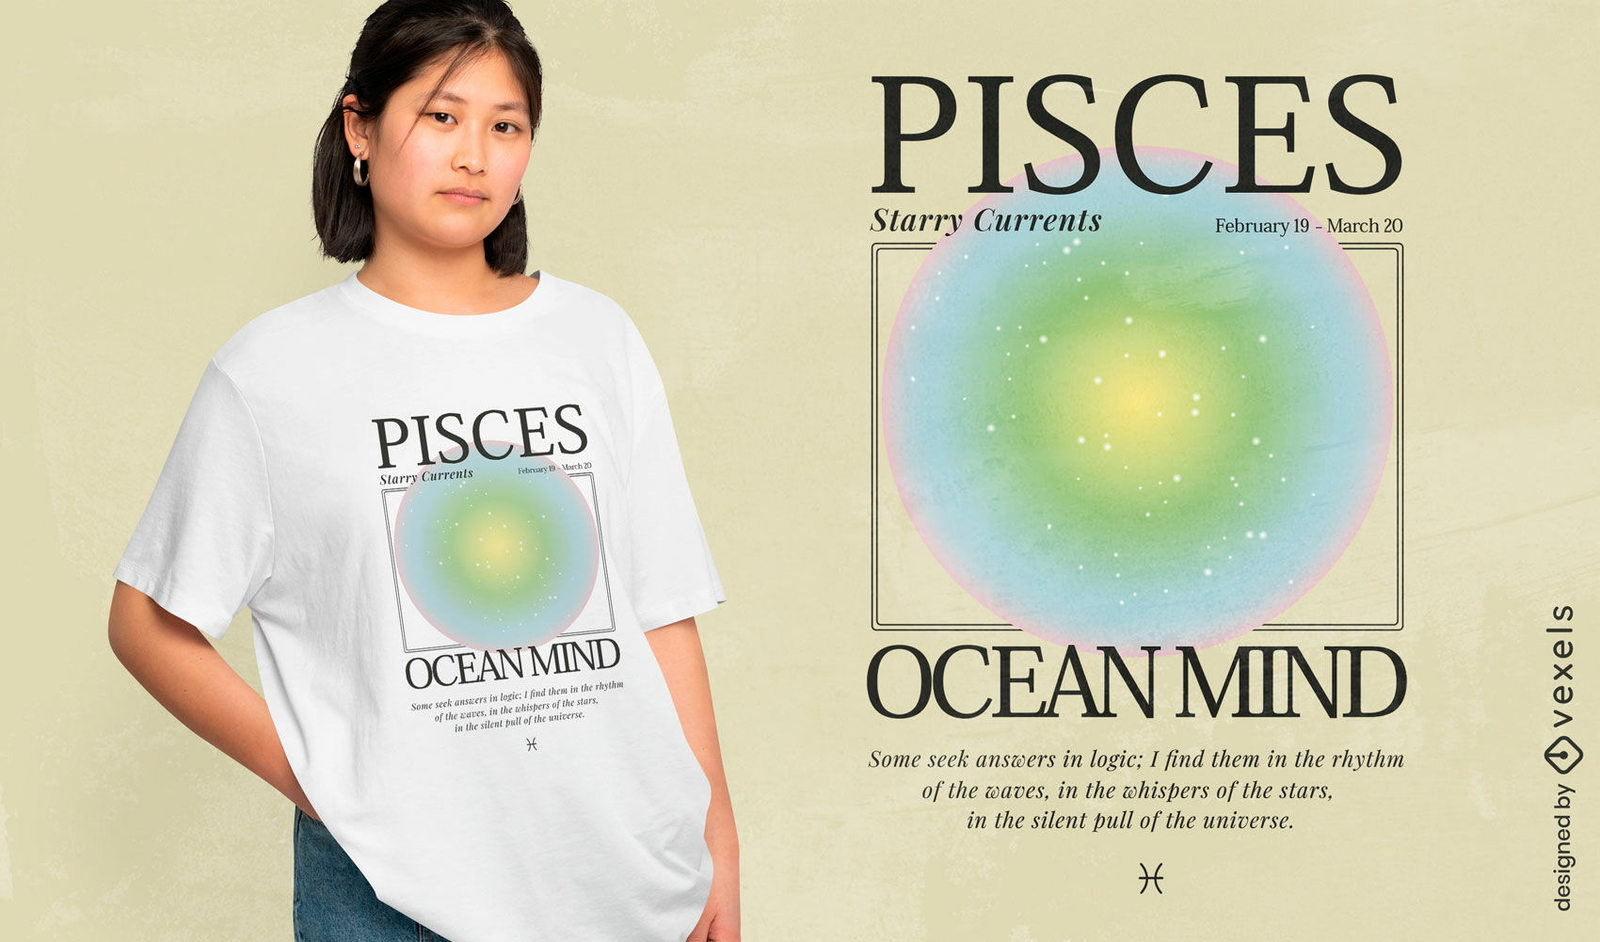
Design de camiseta com a mente do oceano de Peixes
Escolha uma pasta
Todos os favoritos
Criar novo
Salvar
Design de camiseta com a mente do oceano de Peixes
texto editável
Pronto para imprimir
para Merch
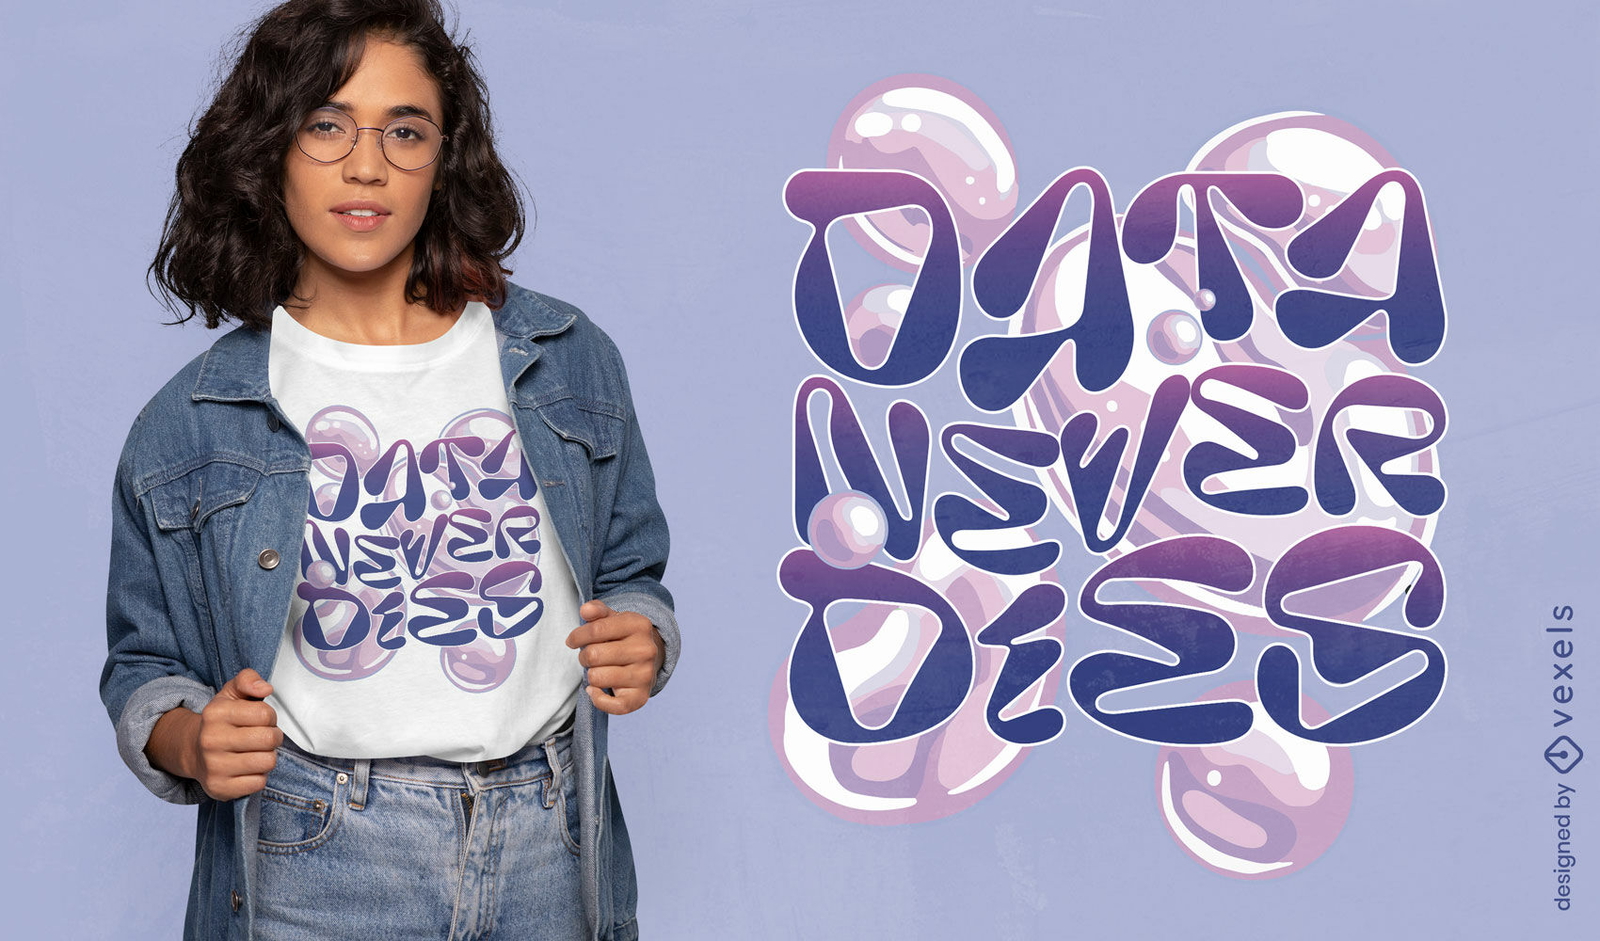
Design de camiseta Y3K Data nunca morre
Escolha uma pasta
Todos os favoritos
Criar novo
Salvar
Design de camiseta Y3K Data nunca morre
Gerado por IA, selecionado por nossos designers.
para Merch
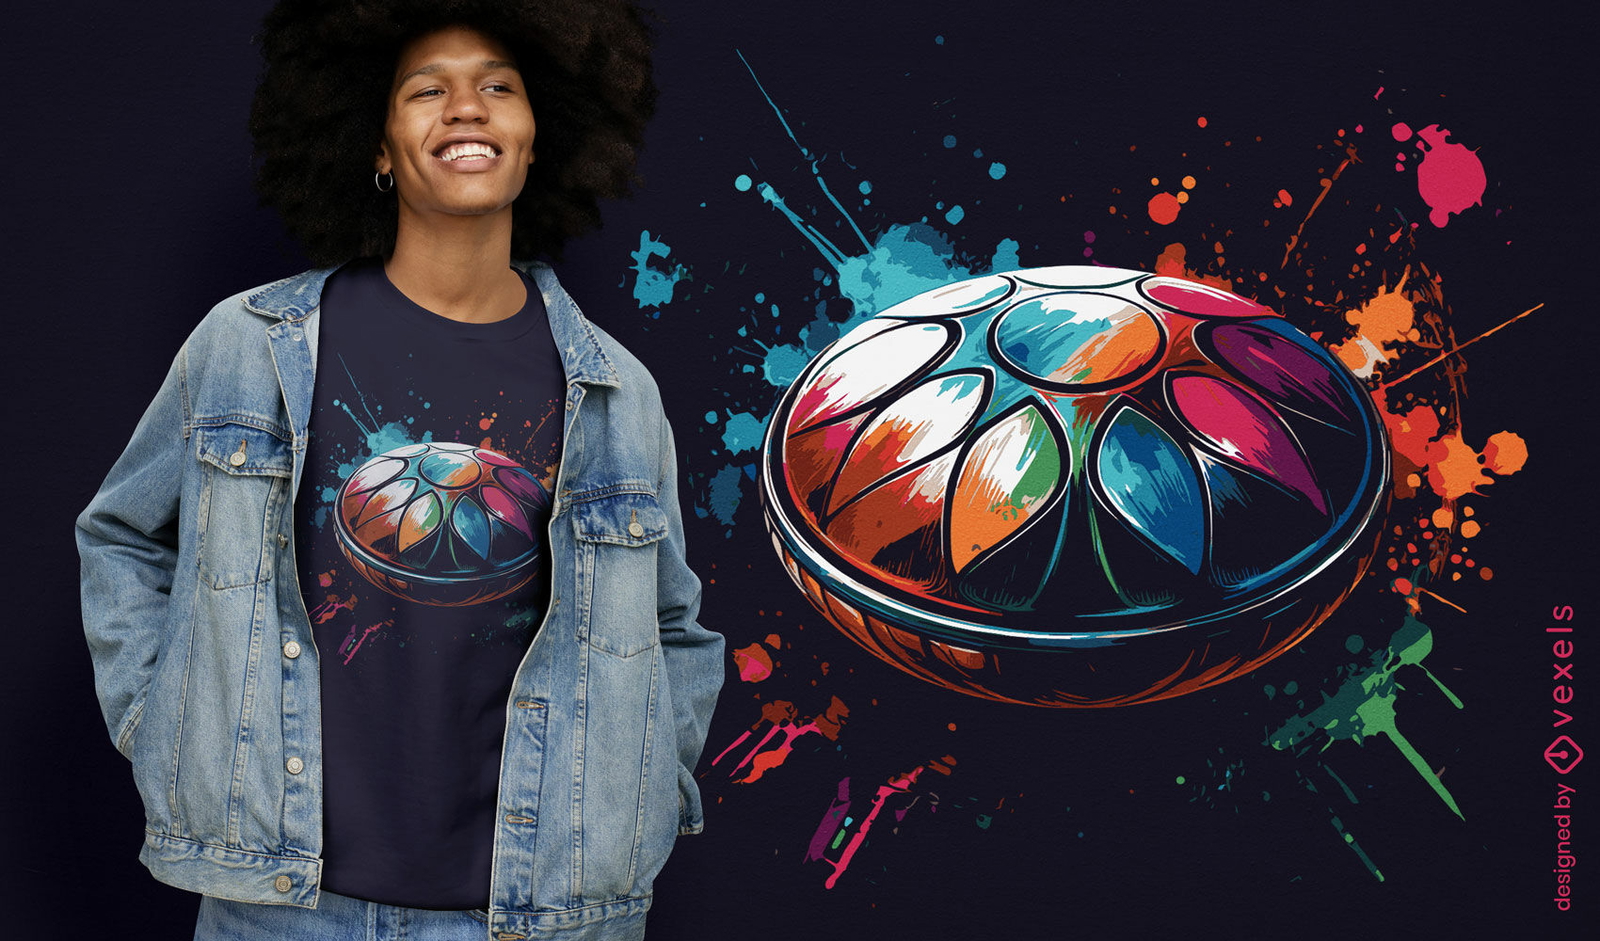
Design de camiseta com respingos de handpan colorido
Escolha uma pasta
Todos os favoritos
Criar novo
Salvar
Design de camiseta com respingos de handpan colorido
texto editável
Pronto para imprimir
para Merch
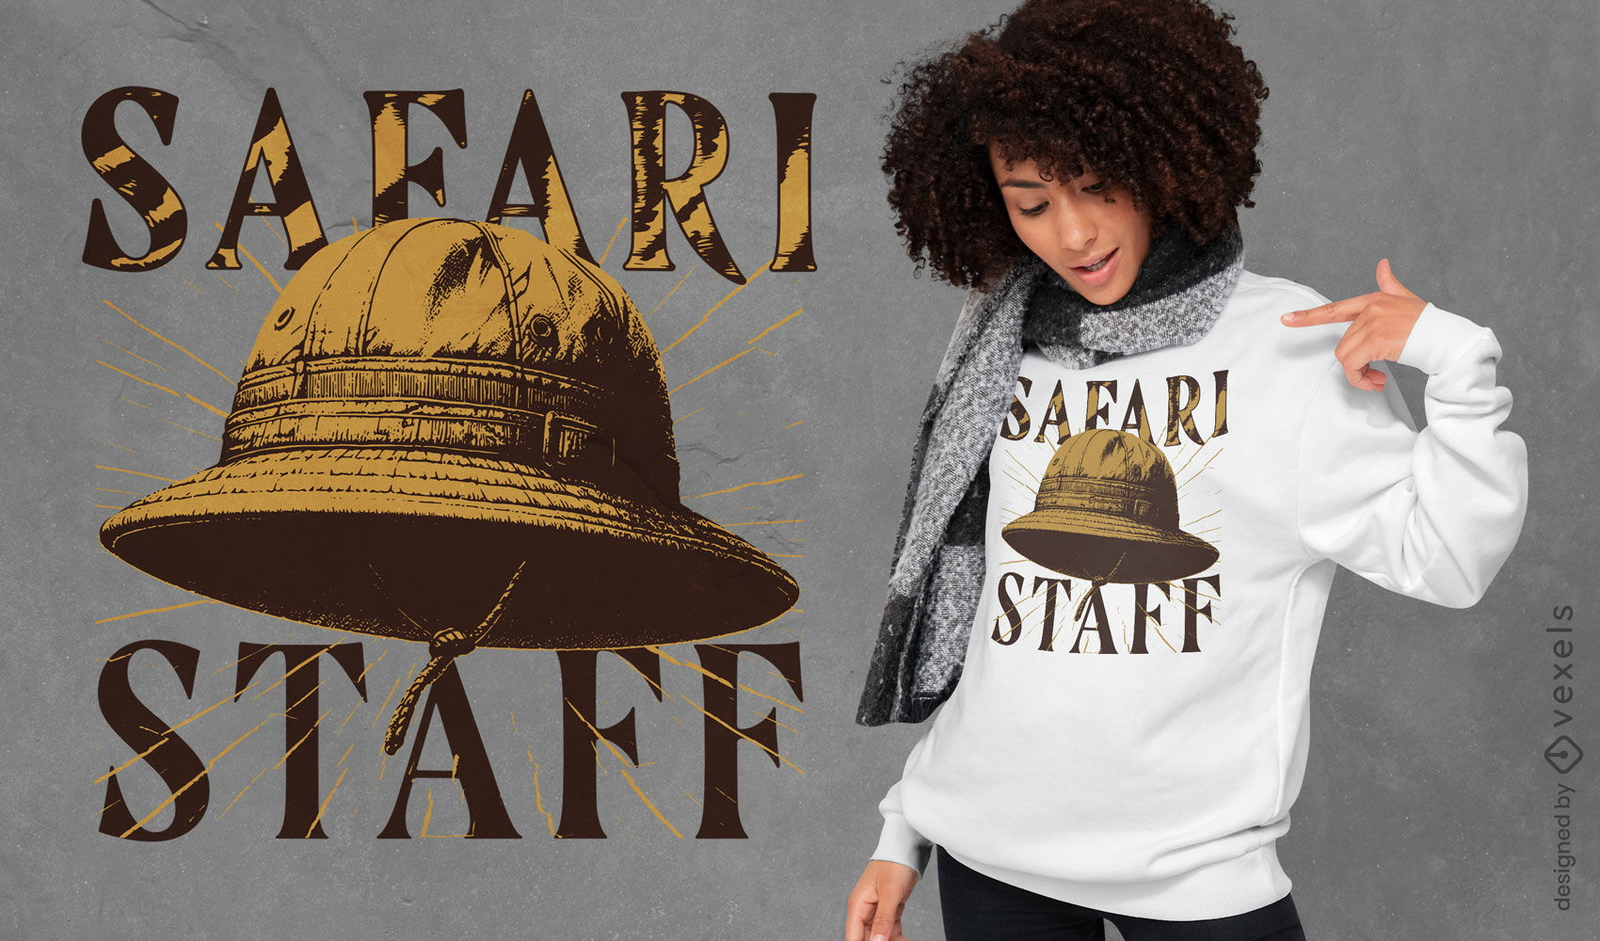
Design de camiseta vintage com equipe de safári
Escolha uma pasta
Todos os favoritos
Criar novo
Salvar
Design de camiseta vintage com equipe de safári
texto editável
Pronto para imprimir
para Merch
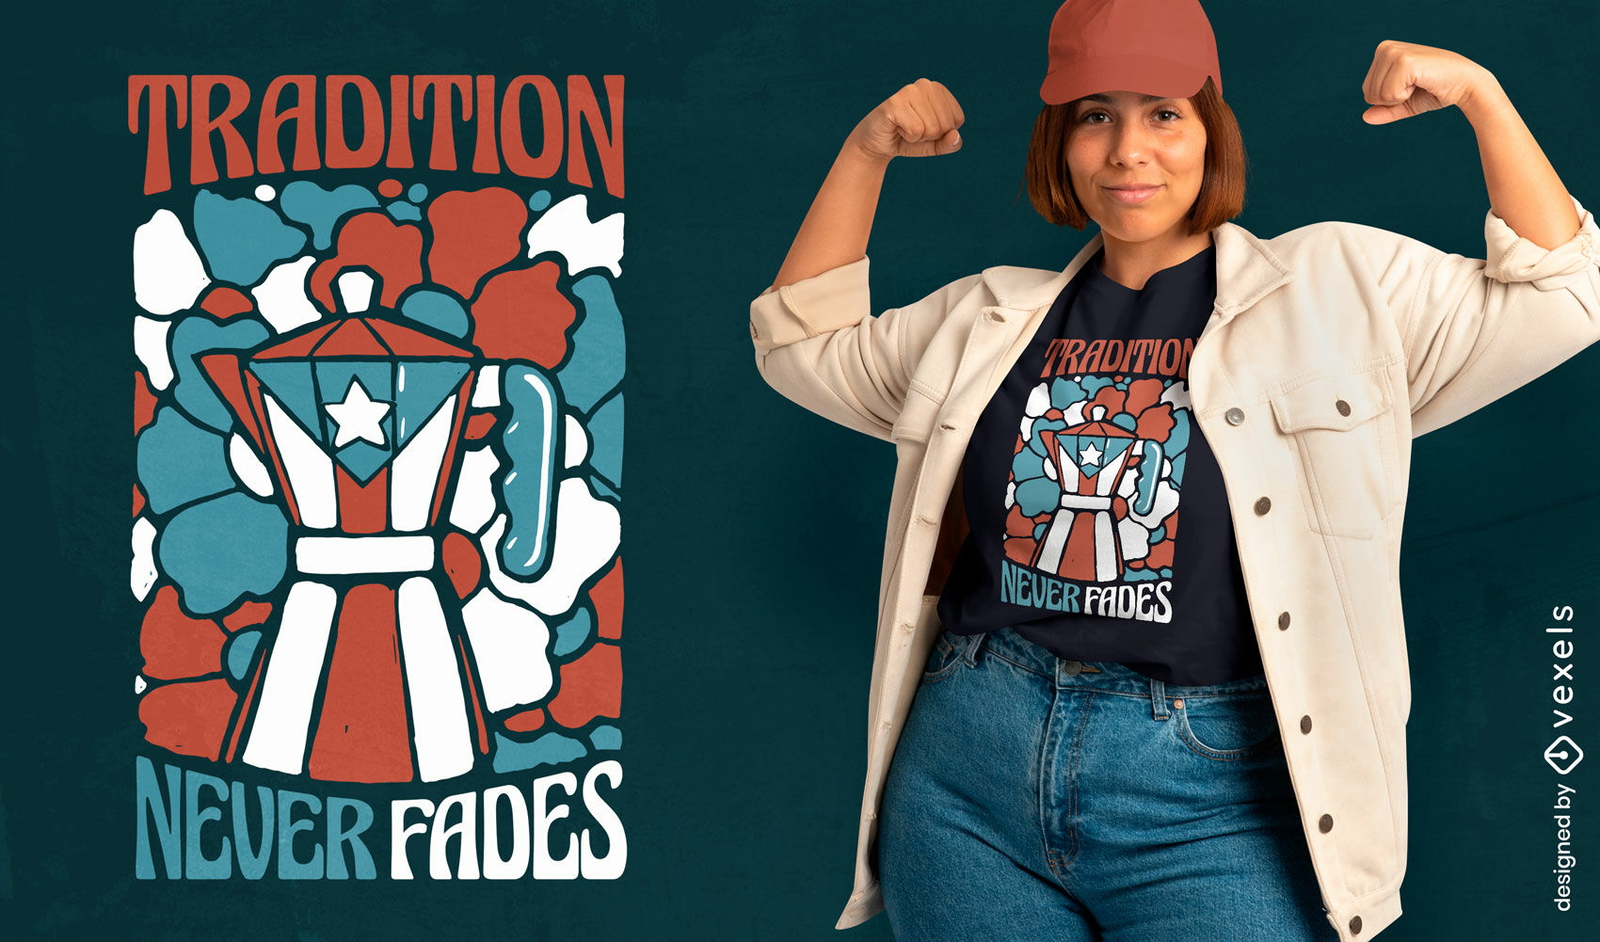
Design de camiseta com orgulho porto-riquenho
Escolha uma pasta
Todos os favoritos
Criar novo
Salvar
Design de camiseta com orgulho porto-riquenho
texto editável
Pronto para imprimir
para Merch
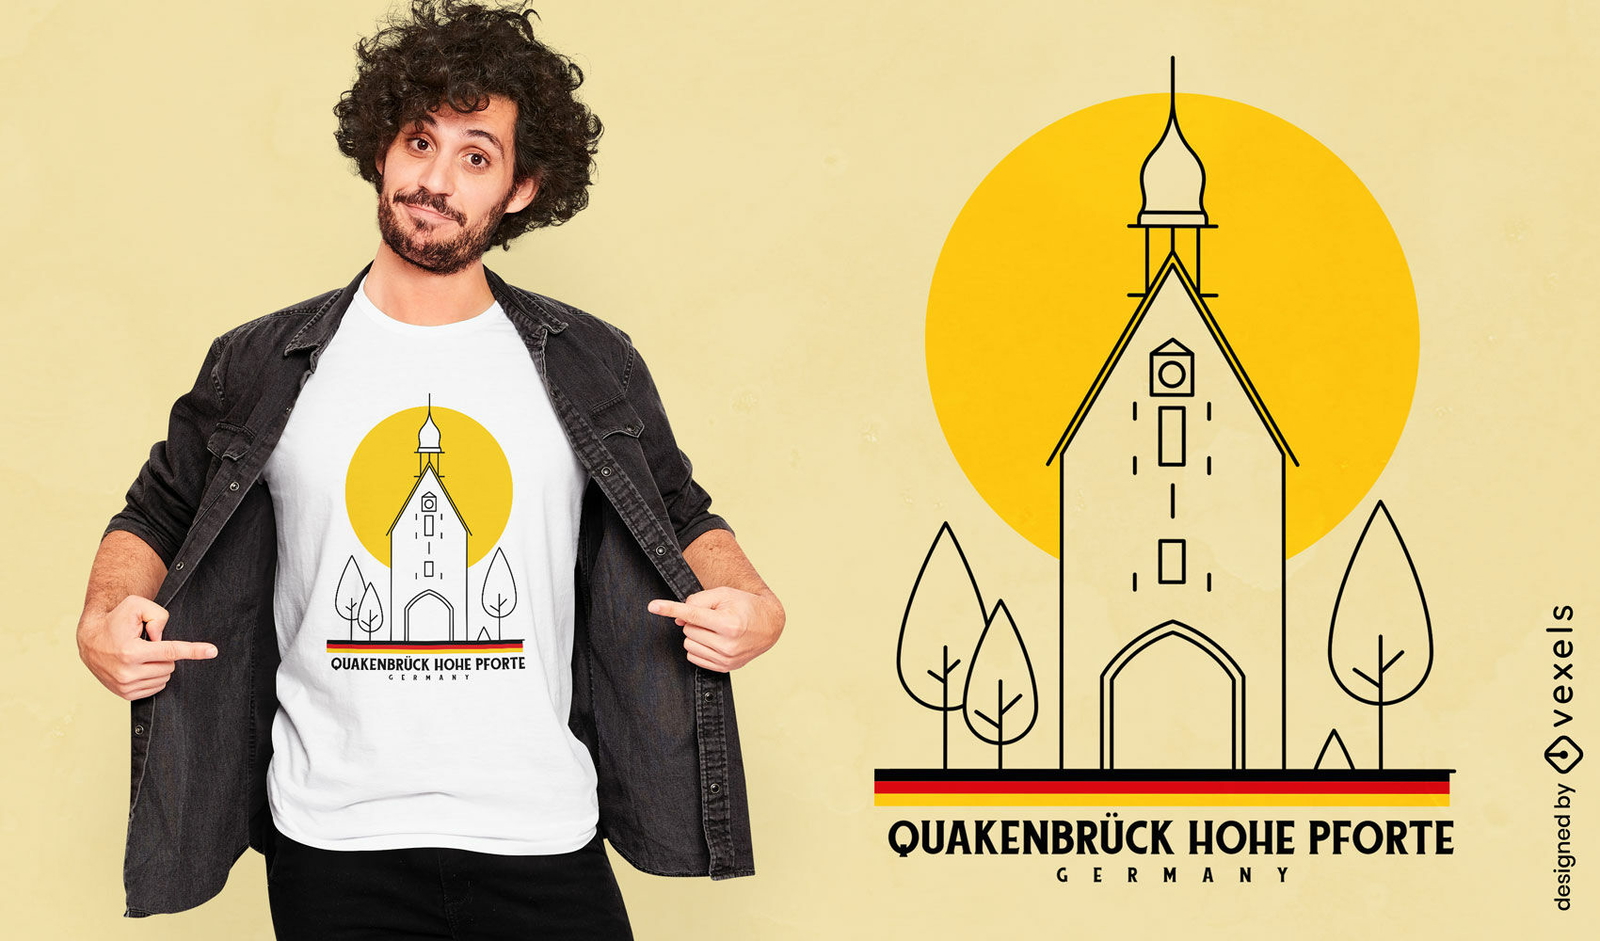
Design de camiseta do edifício histórico Quakenbrück Alemanha
Escolha uma pasta
Todos os favoritos
Criar novo
Salvar
Design de camiseta do edifício histórico Quakenbrück Alemanha
Gerado por IA, selecionado por nossos designers.
para Merch
Design de camiseta de sedução cerebral
Escolha uma pasta
Todos os favoritos
Criar novo
Salvar
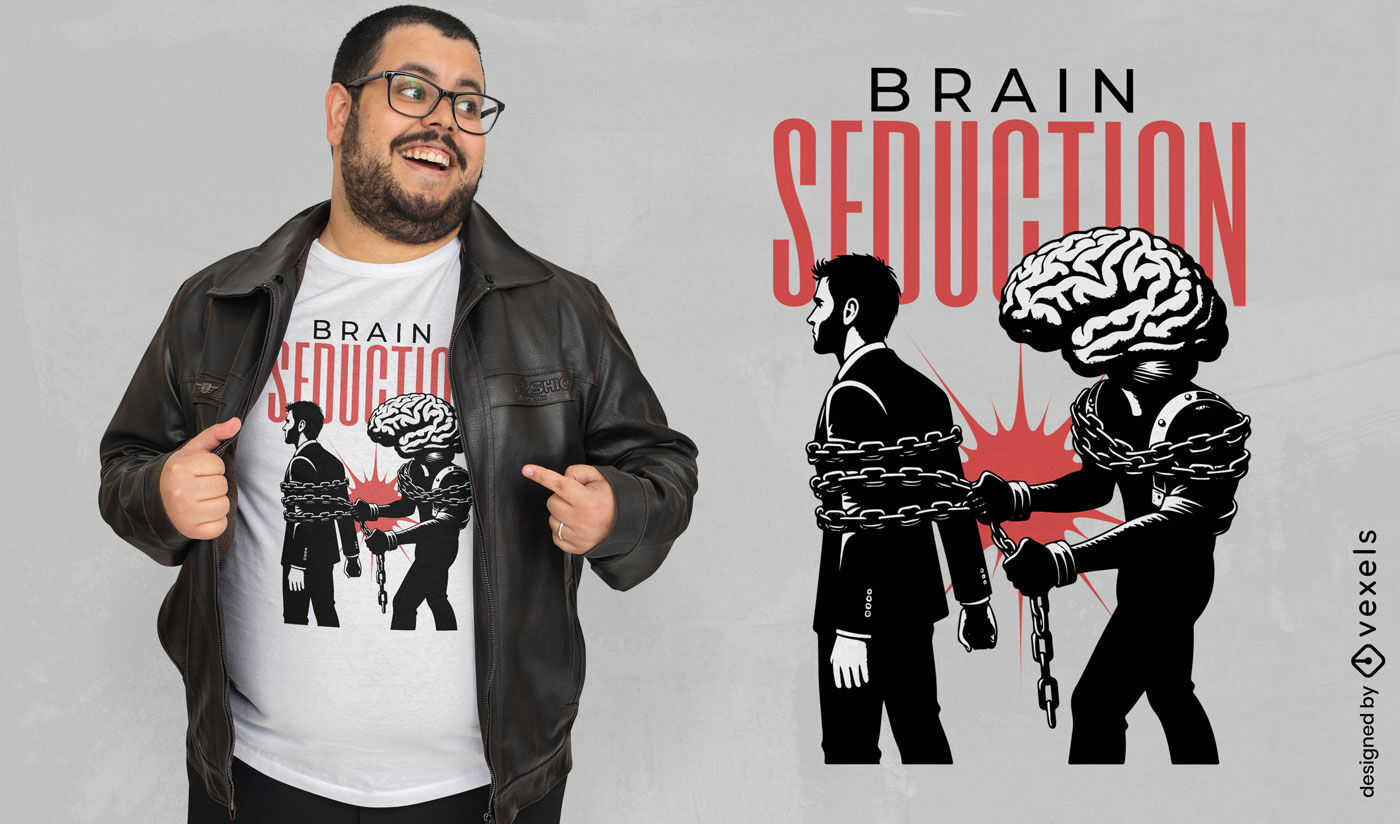
Design de camiseta de sedução cerebral
texto editável
Pronto para imprimir
para Merch
Design de camiseta com amuleto da sorte dedos cruzados
Escolha uma pasta
Todos os favoritos
Criar novo
Salvar
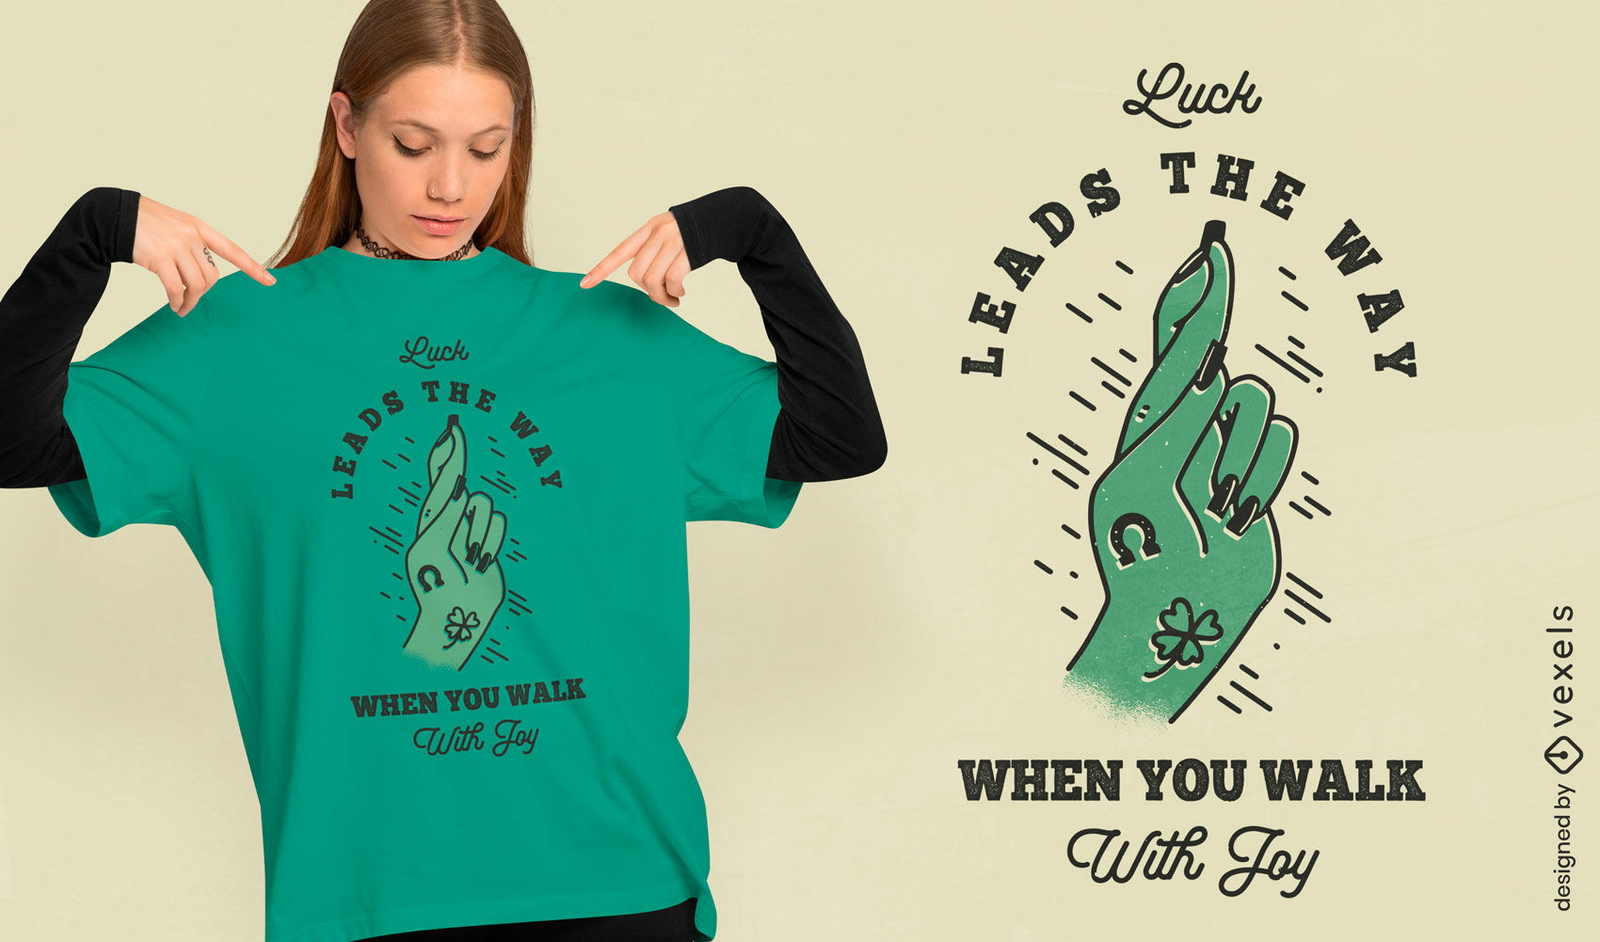
Design de camiseta com amuleto da sorte dedos cruzados
texto editável
Pronto para imprimir
para Merch
Design de camiseta do Dia de São Patrício com bota da sorte
Escolha uma pasta
Todos os favoritos
Criar novo
Salvar
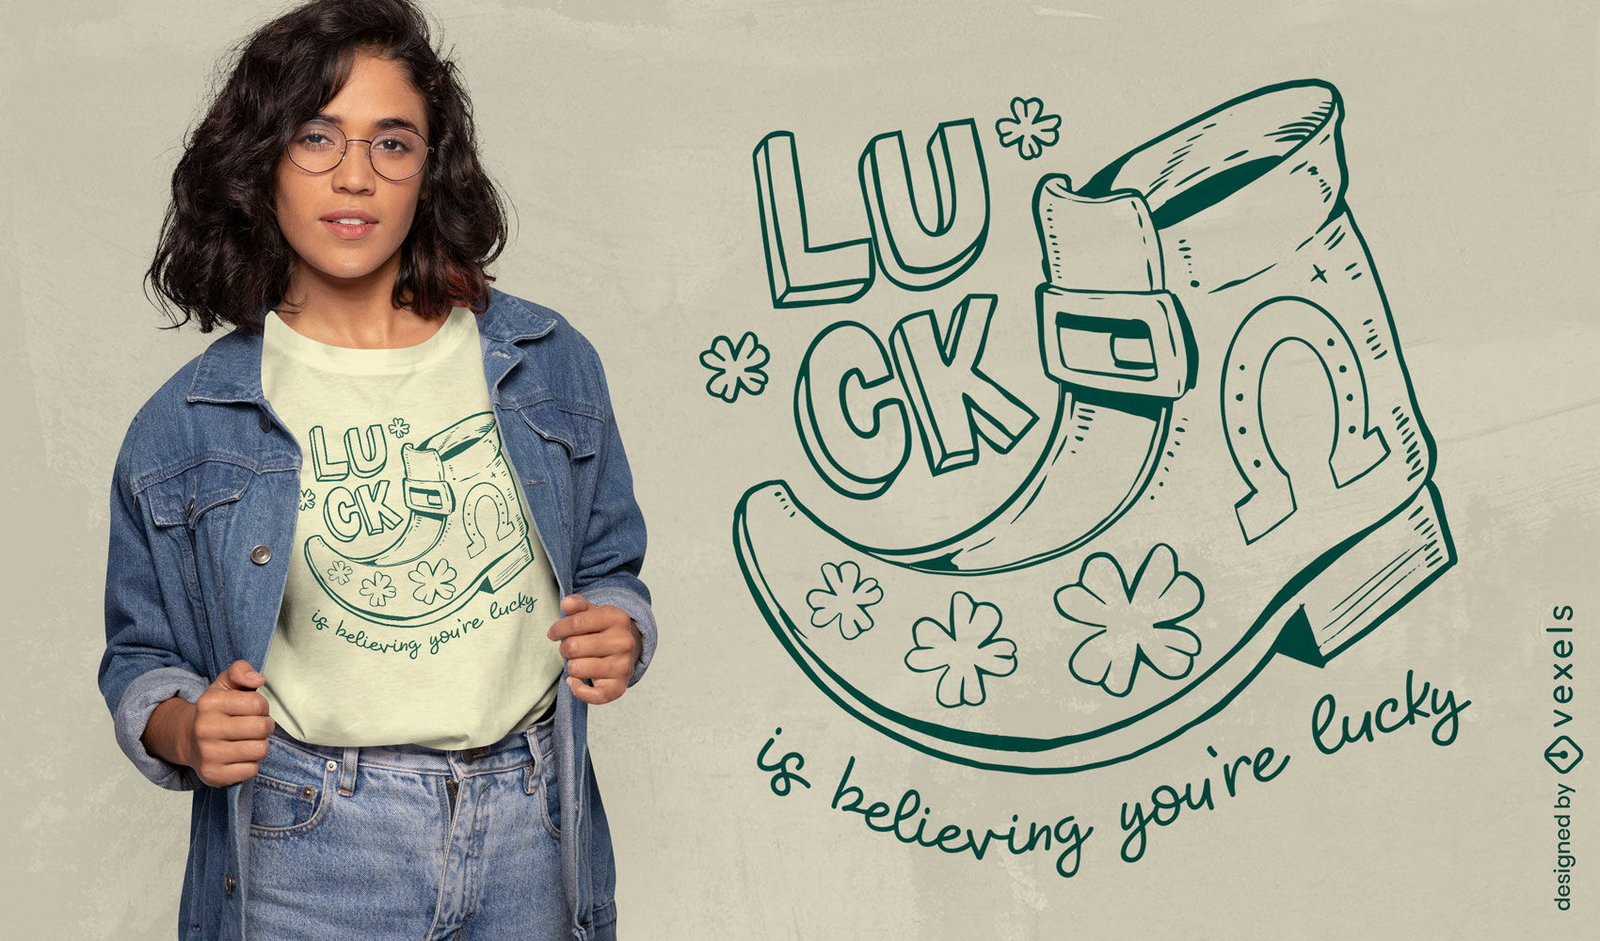
Design de camiseta do Dia de São Patrício com bota da sorte
texto editável
Pronto para imprimir
para Merch
Design de camiseta de esqui na neve e estilo
Escolha uma pasta
Todos os favoritos
Criar novo
Salvar
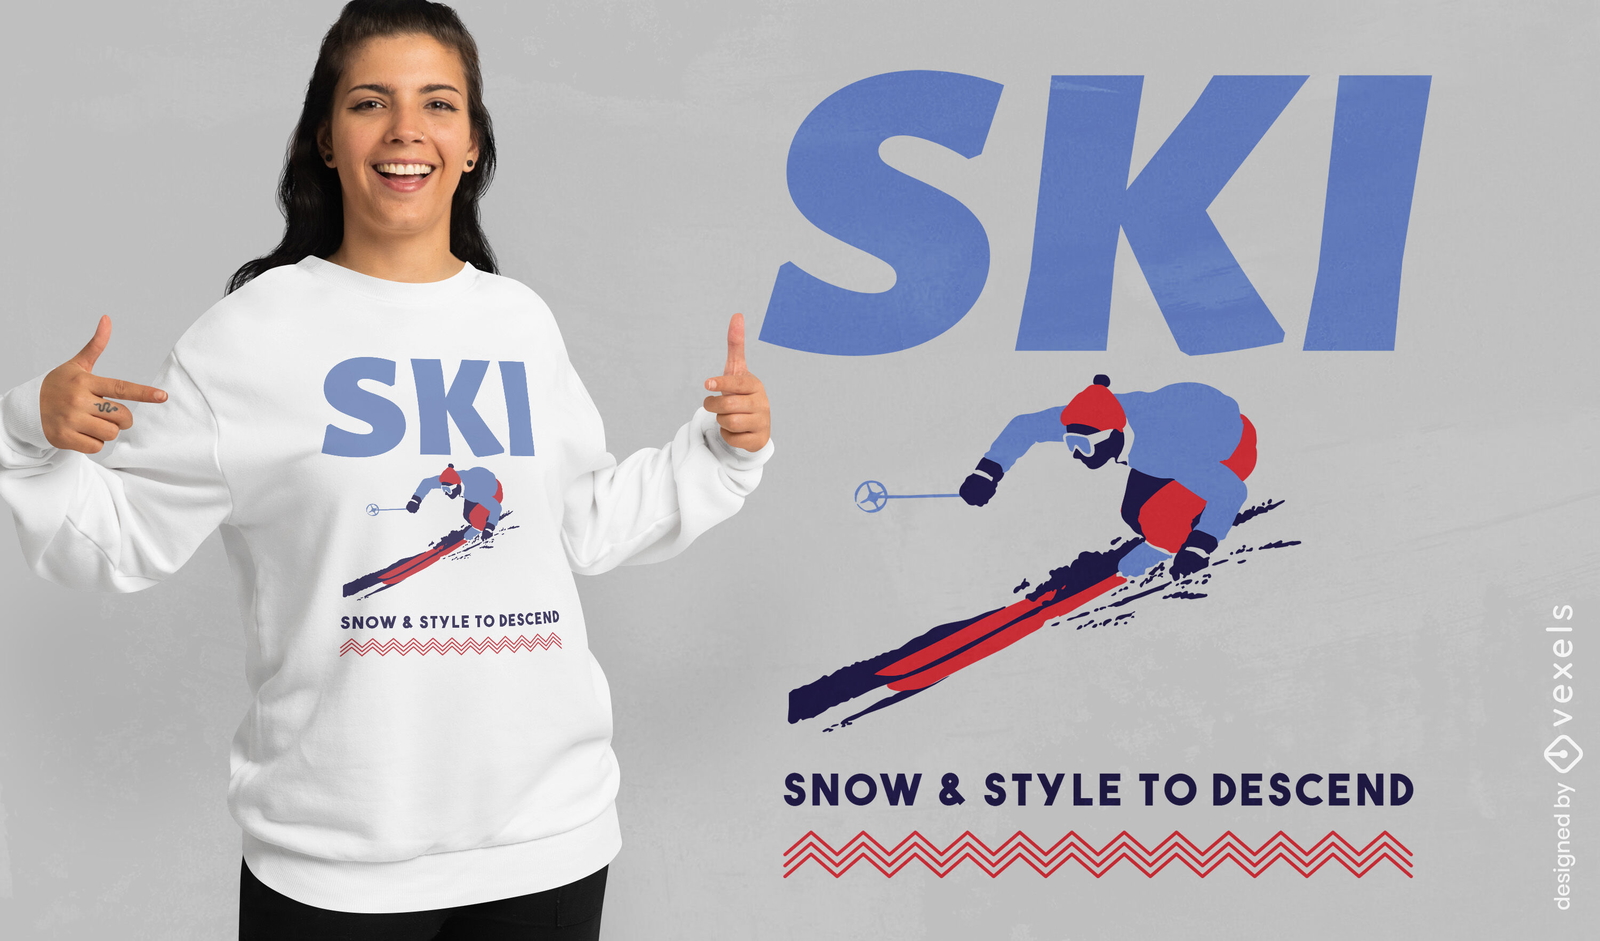
Design de camiseta de esqui na neve e estilo
Pronto para imprimir
para Merch
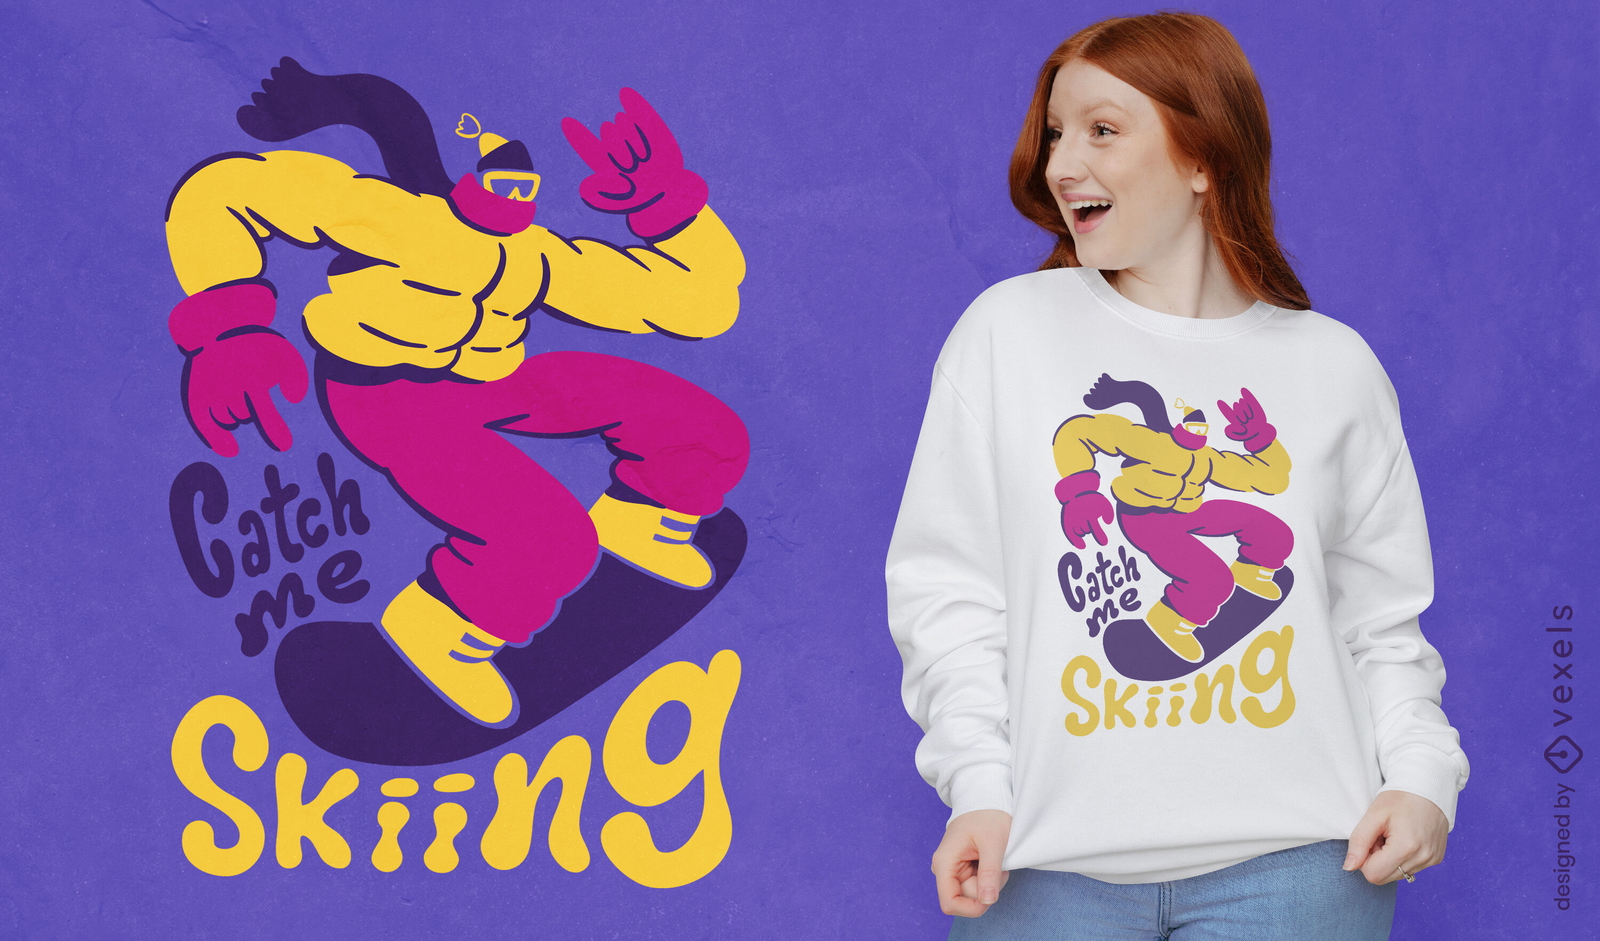
Design de camiseta "Pegue-me esquiando"
Escolha uma pasta
Todos os favoritos
Criar novo
Salvar
Design de camiseta "Pegue-me esquiando"
texto editável
Pronto para imprimir
para Merch
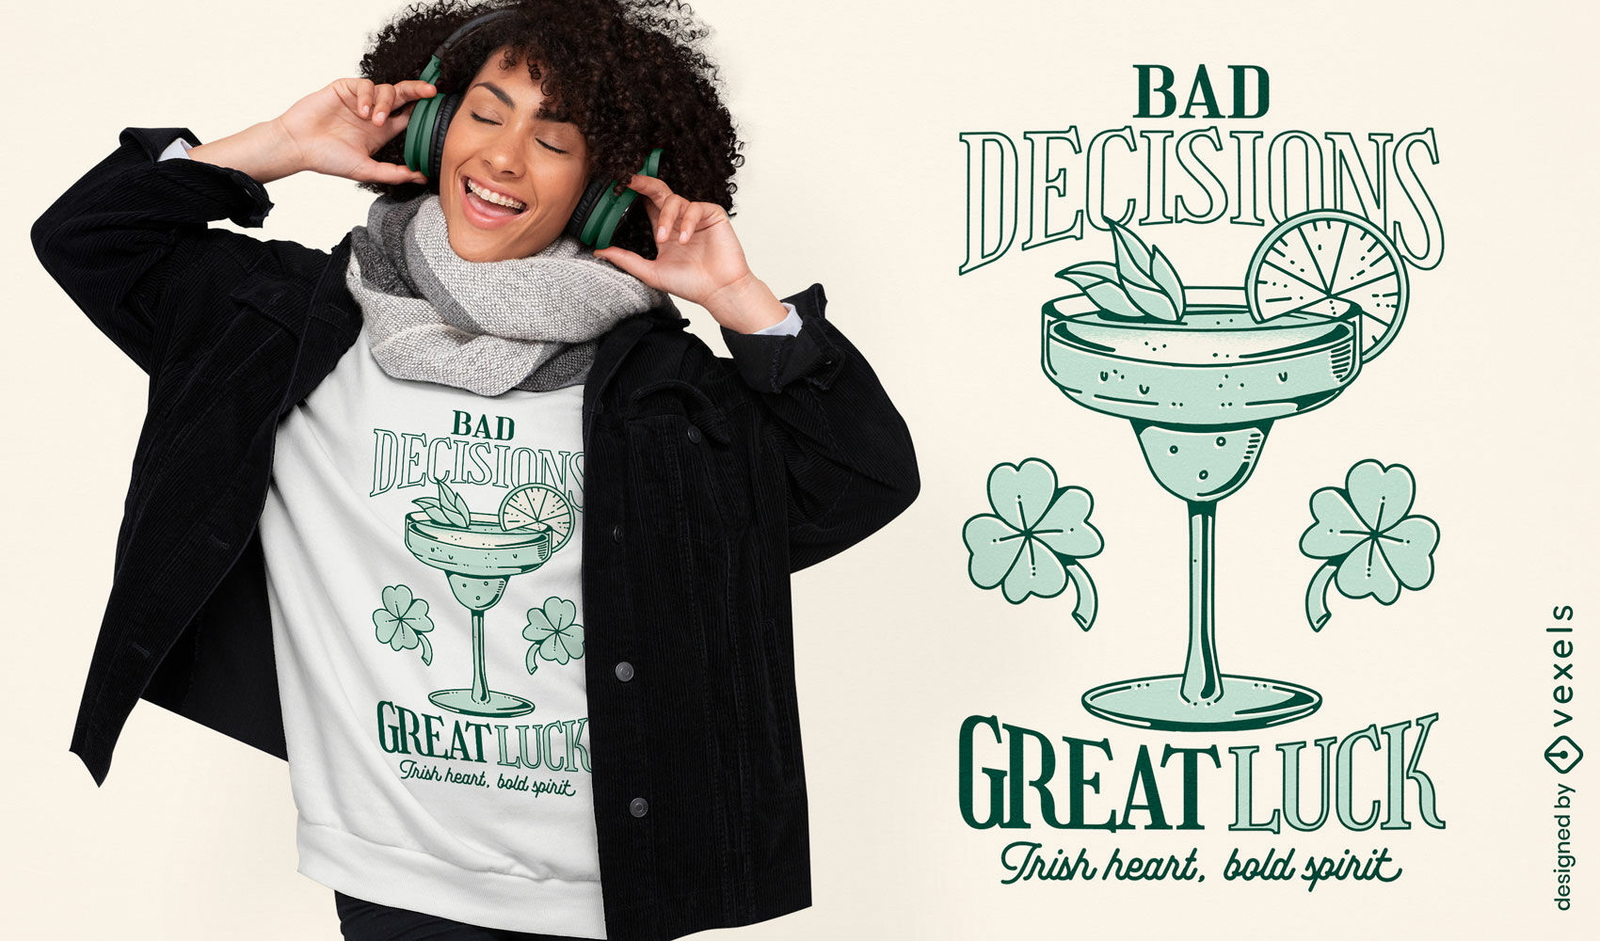
Design de camiseta más decisões, boa sorte
Escolha uma pasta
Todos os favoritos
Criar novo
Salvar
Design de camiseta más decisões, boa sorte
texto editável
Pronto para imprimir
para Merch
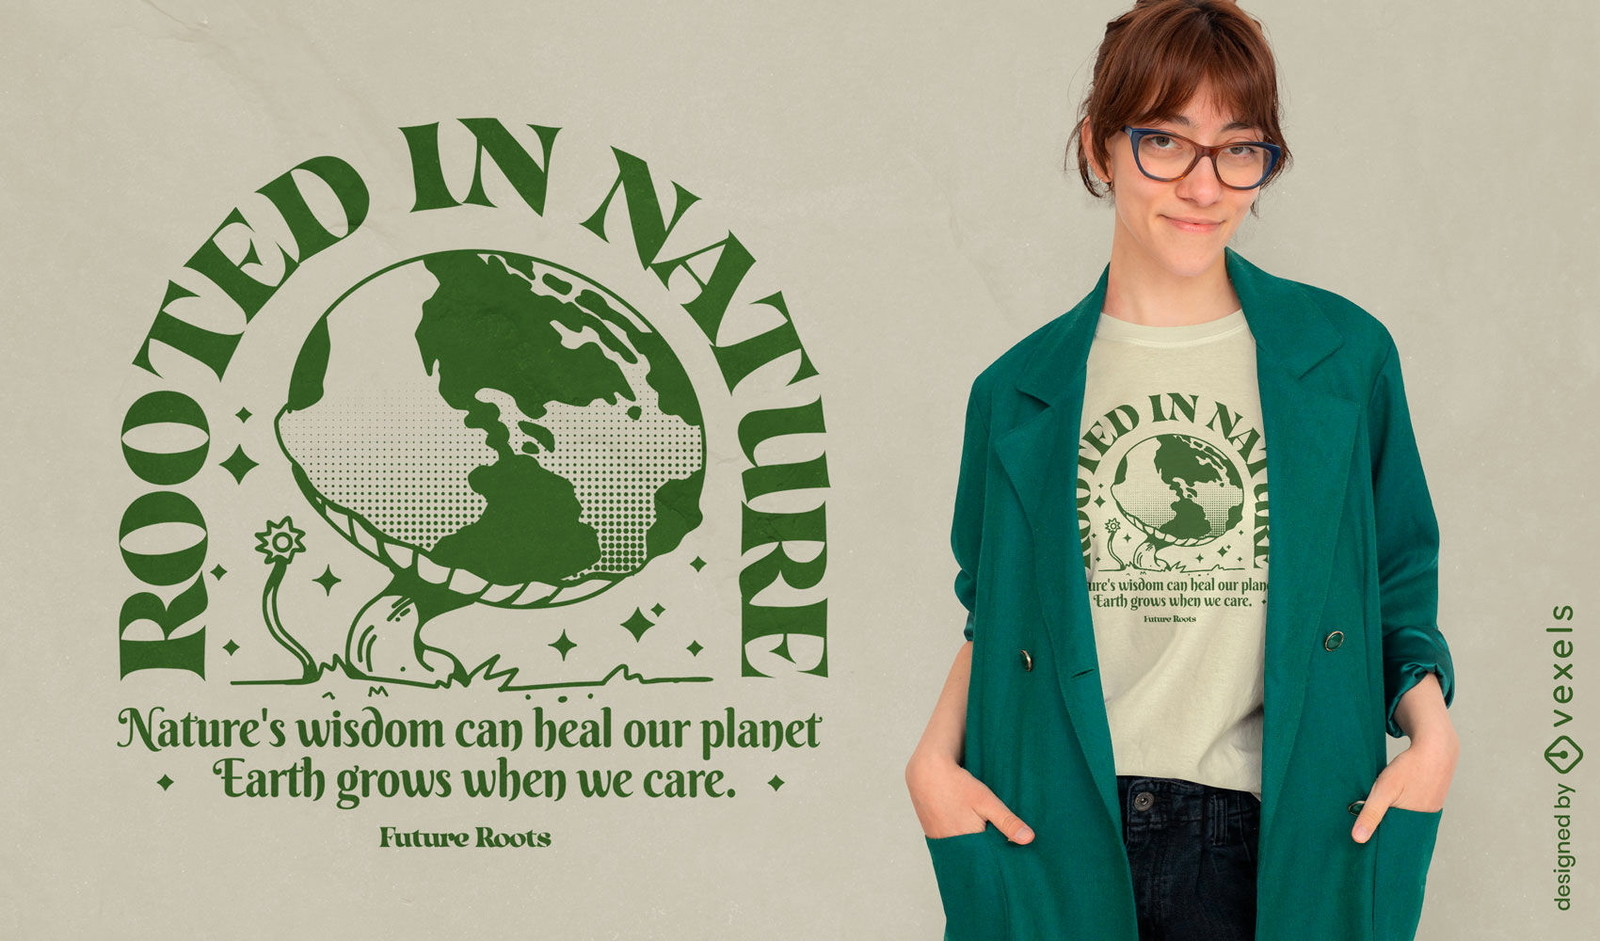
Design de camiseta enraizado na natureza
Escolha uma pasta
Todos os favoritos
Criar novo
Salvar
Design de camiseta enraizado na natureza
Pronto para imprimir
para Merch
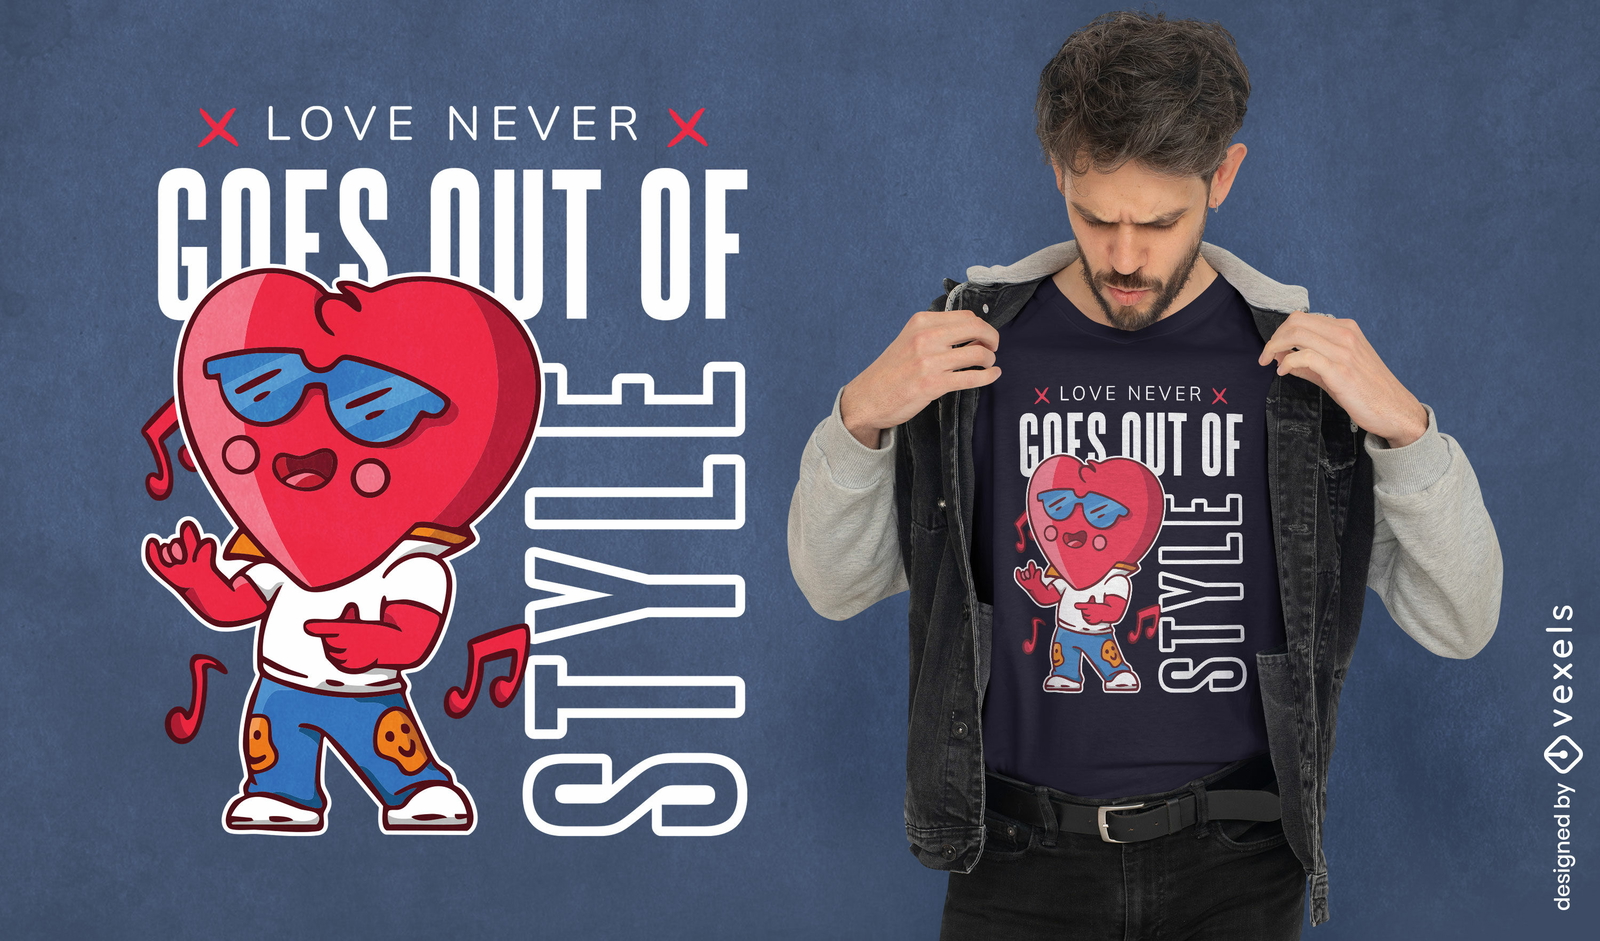
Design legal de camiseta com coração para o dia dos namorados
Escolha uma pasta
Todos os favoritos
Criar novo
Salvar
Design legal de camiseta com coração para o dia dos namorados
texto editável
Pronto para imprimir
para Merch
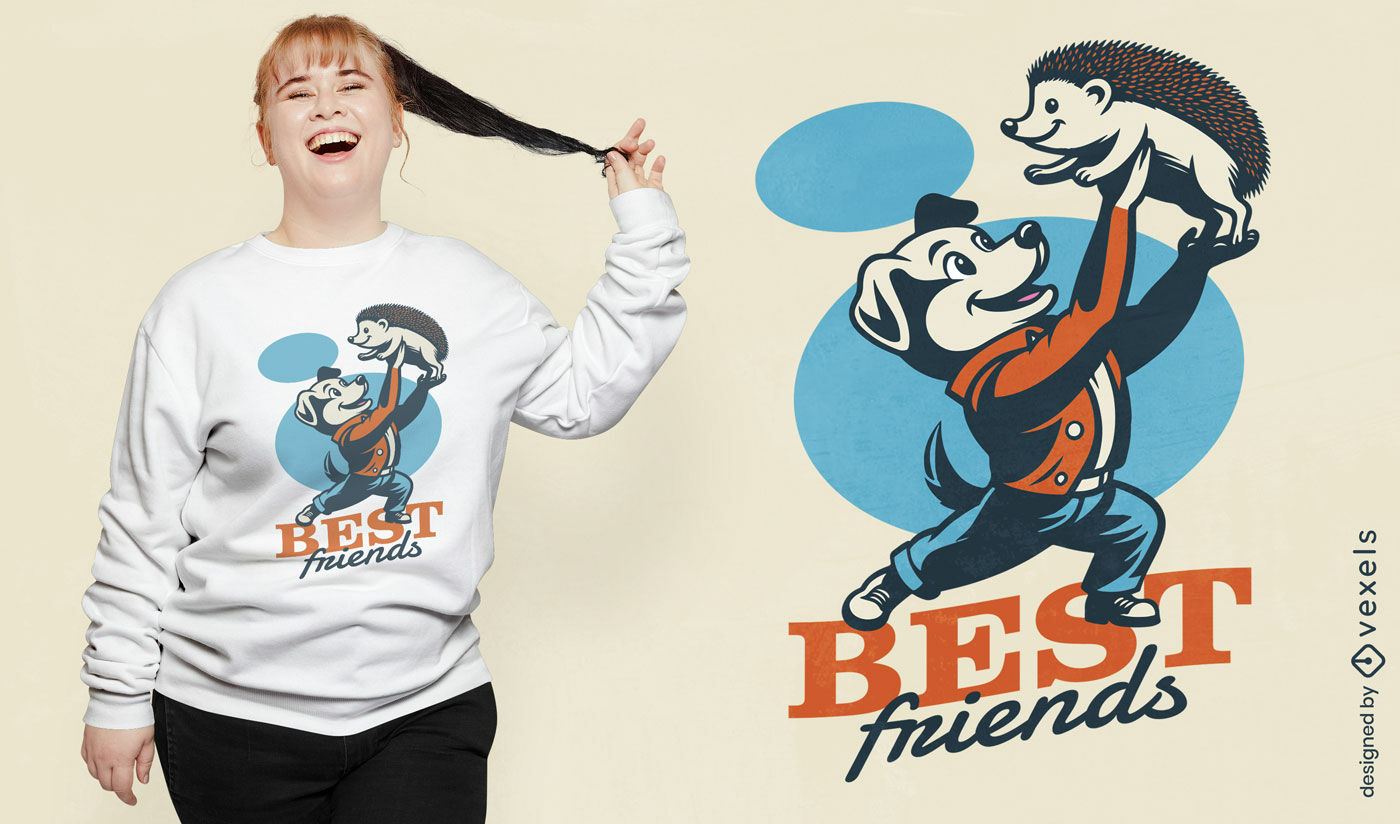
Design de camiseta com animais de estimação dos melhores amigos
Escolha uma pasta
Todos os favoritos
Criar novo
Salvar
Design de camiseta com animais de estimação dos melhores amigos
Gerado por IA, selecionado por nossos designers.
para Merch
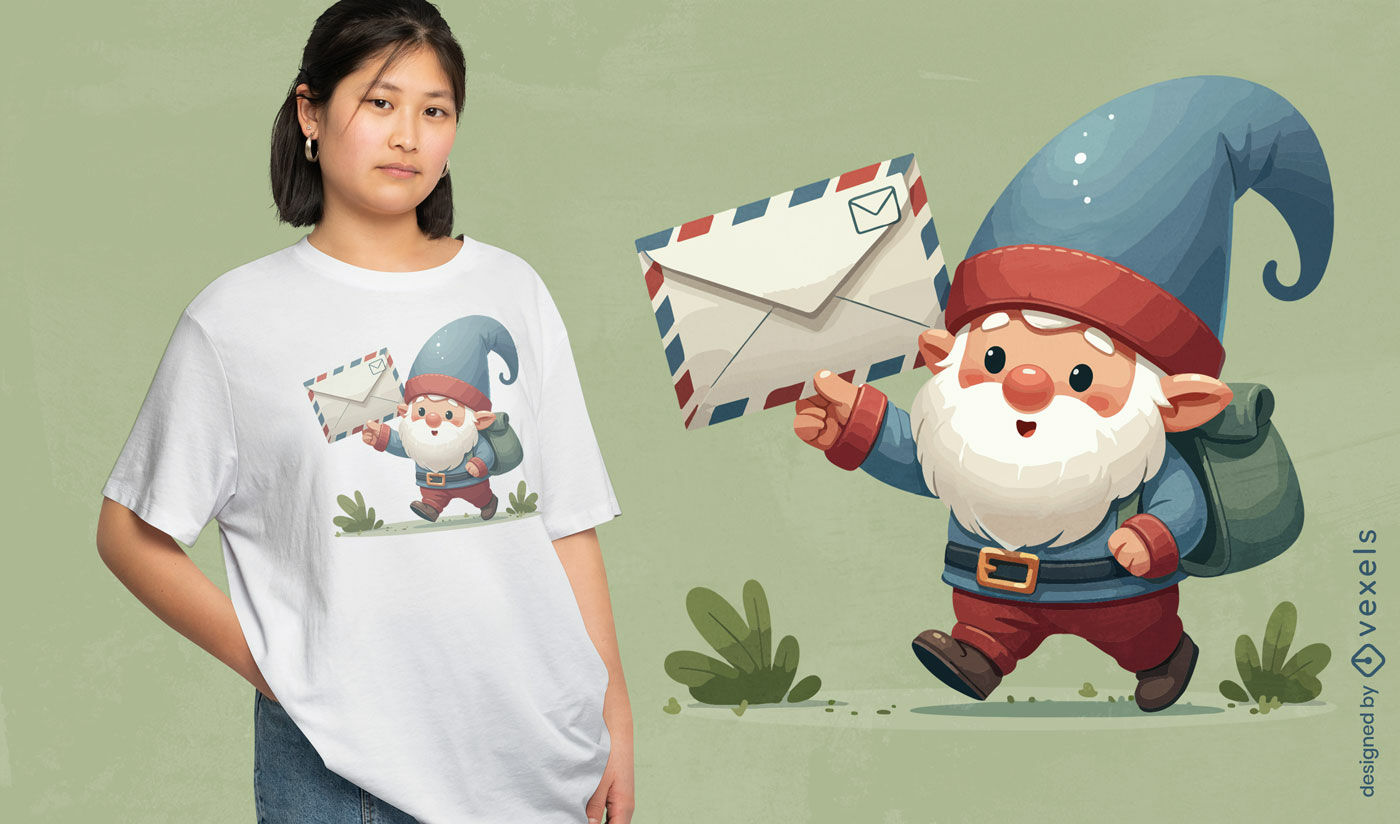
Design de camiseta gnomo de entrega
Escolha uma pasta
Todos os favoritos
Criar novo
Salvar
Design de camiseta gnomo de entrega
texto editável
Pronto para imprimir
para Merch
Design de camiseta do capitão tubarão
Escolha uma pasta
Todos os favoritos
Criar novo
Salvar
Design de camiseta do capitão tubarão
texto editável
Pronto para imprimir
para Merch
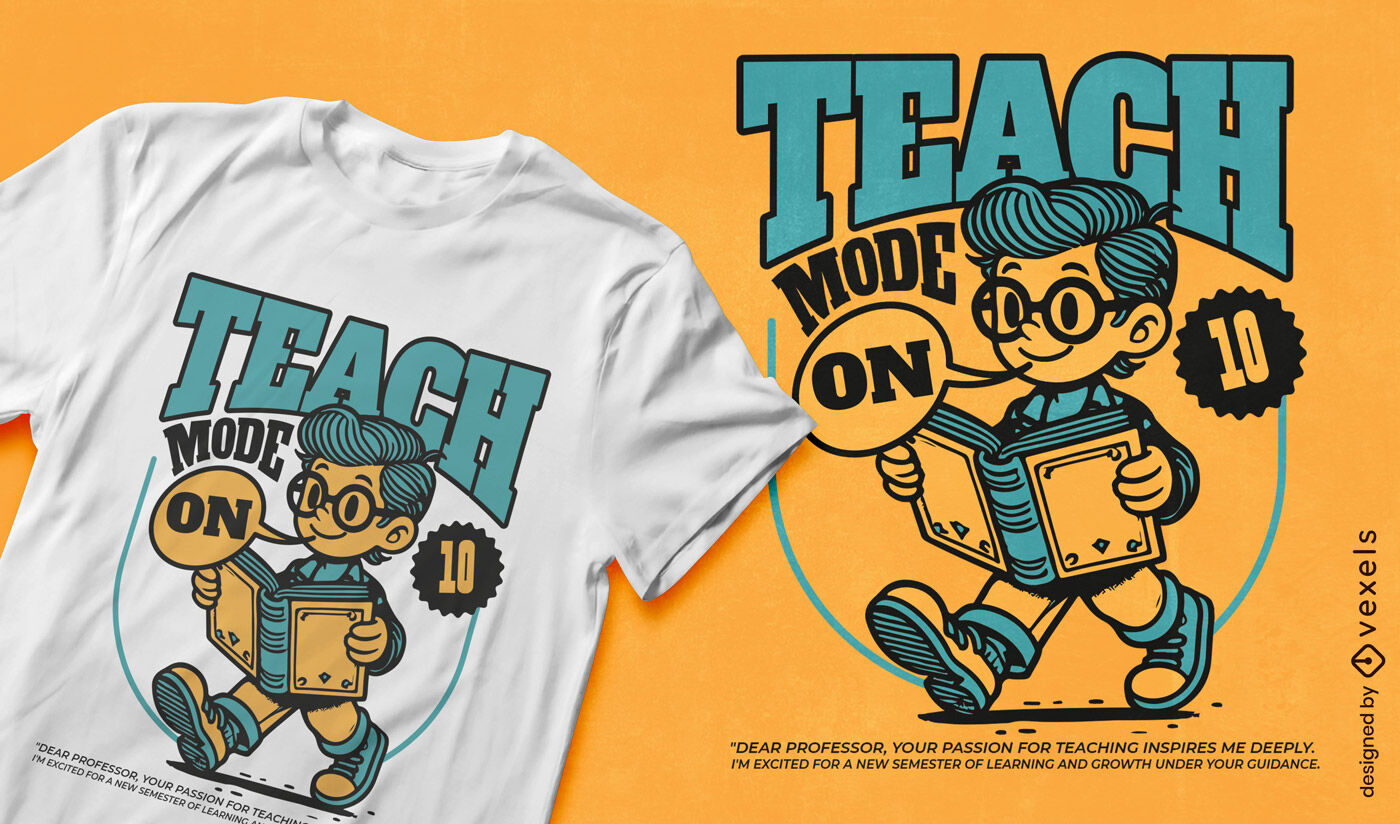
Modo de ensino no design de camisetas
Escolha uma pasta
Todos os favoritos
Criar novo
Salvar
Modo de ensino no design de camisetas
texto editável
Pronto para imprimir
para Merch
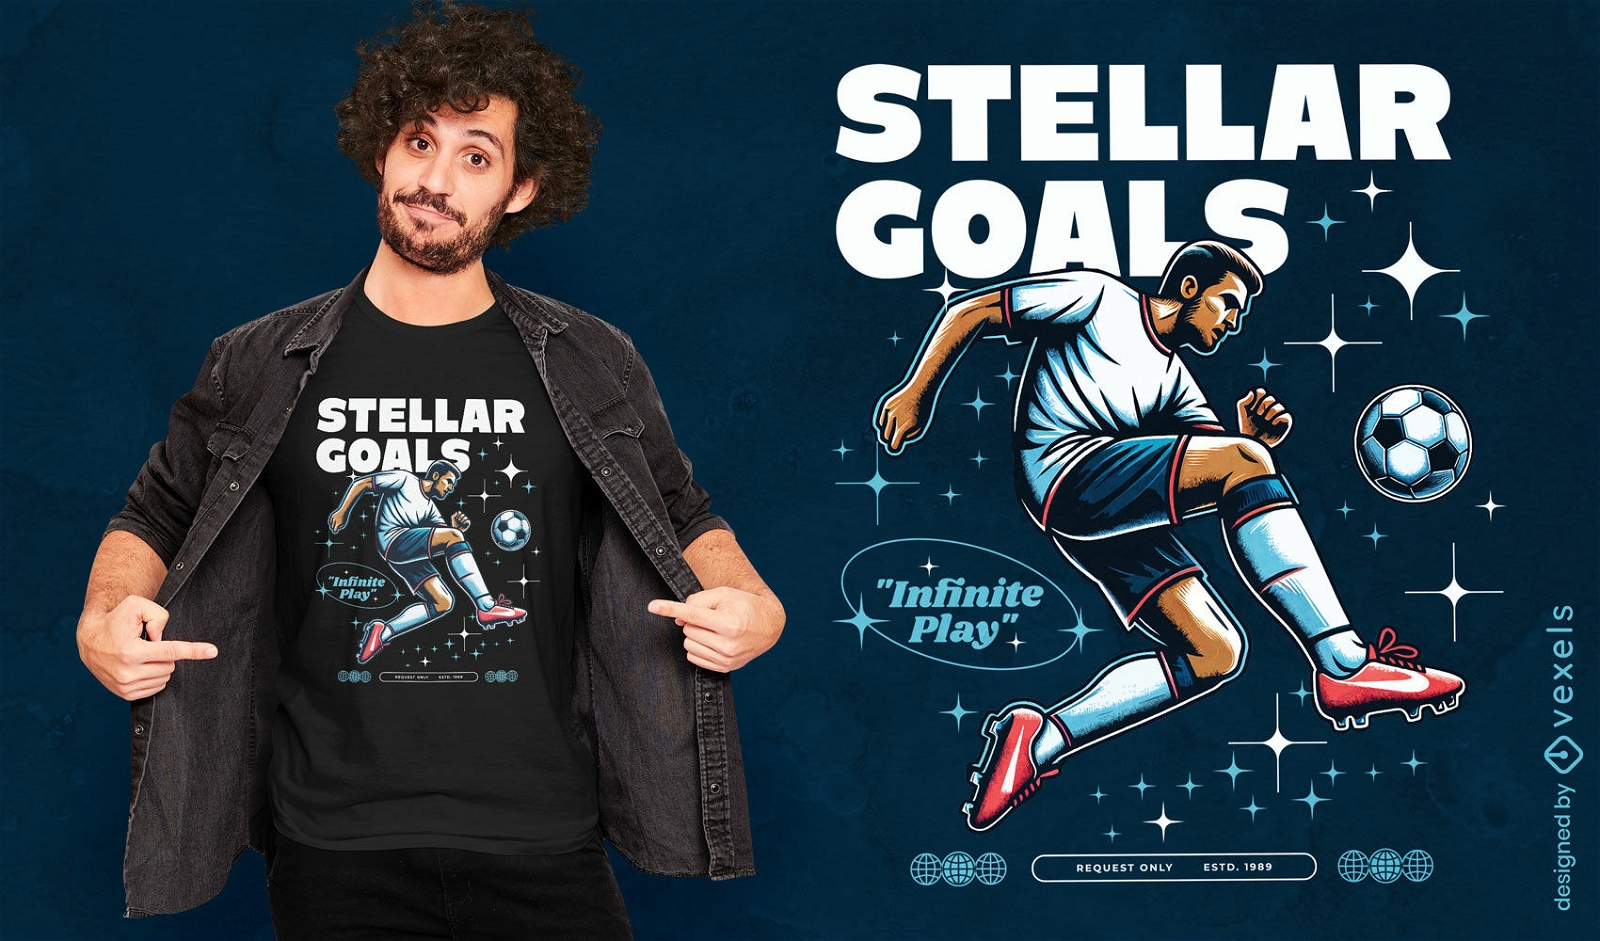
Design de camiseta com objetivos estelares
Escolha uma pasta
Todos os favoritos
Criar novo
Salvar
Design de camiseta com objetivos estelares
texto editável
Pronto para imprimir
para Merch
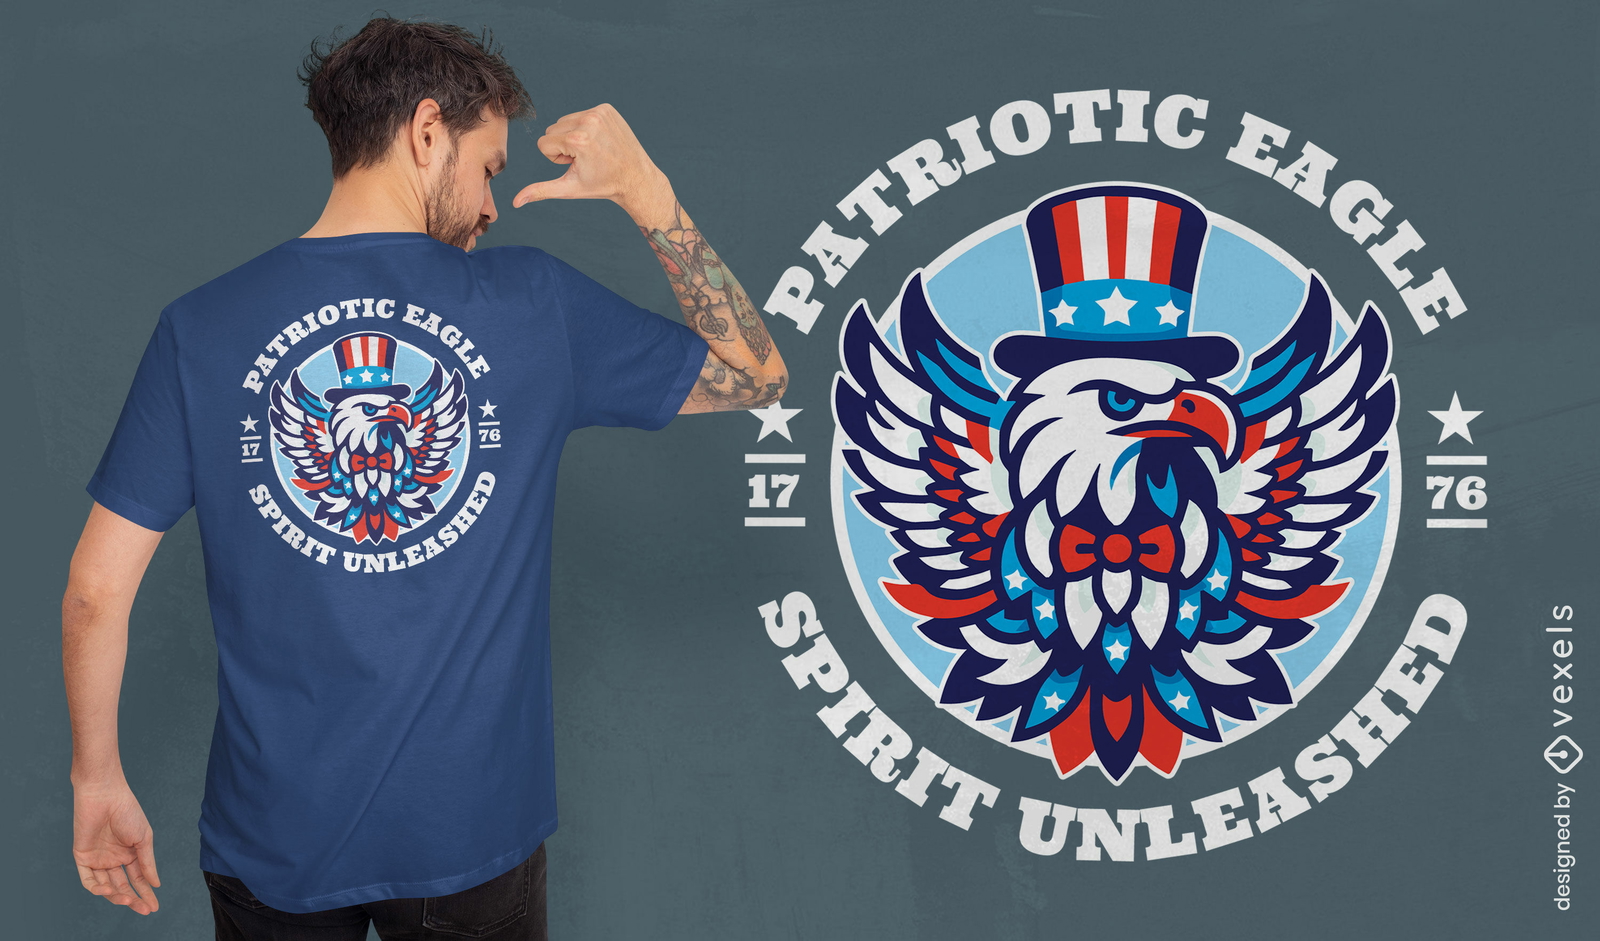
Design patri?tico de camiseta com ?guia americana
Escolha uma pasta
Todos os favoritos
Criar novo
Salvar
Design patri?tico de camiseta com ?guia americana
Pronto para imprimir
para Merch
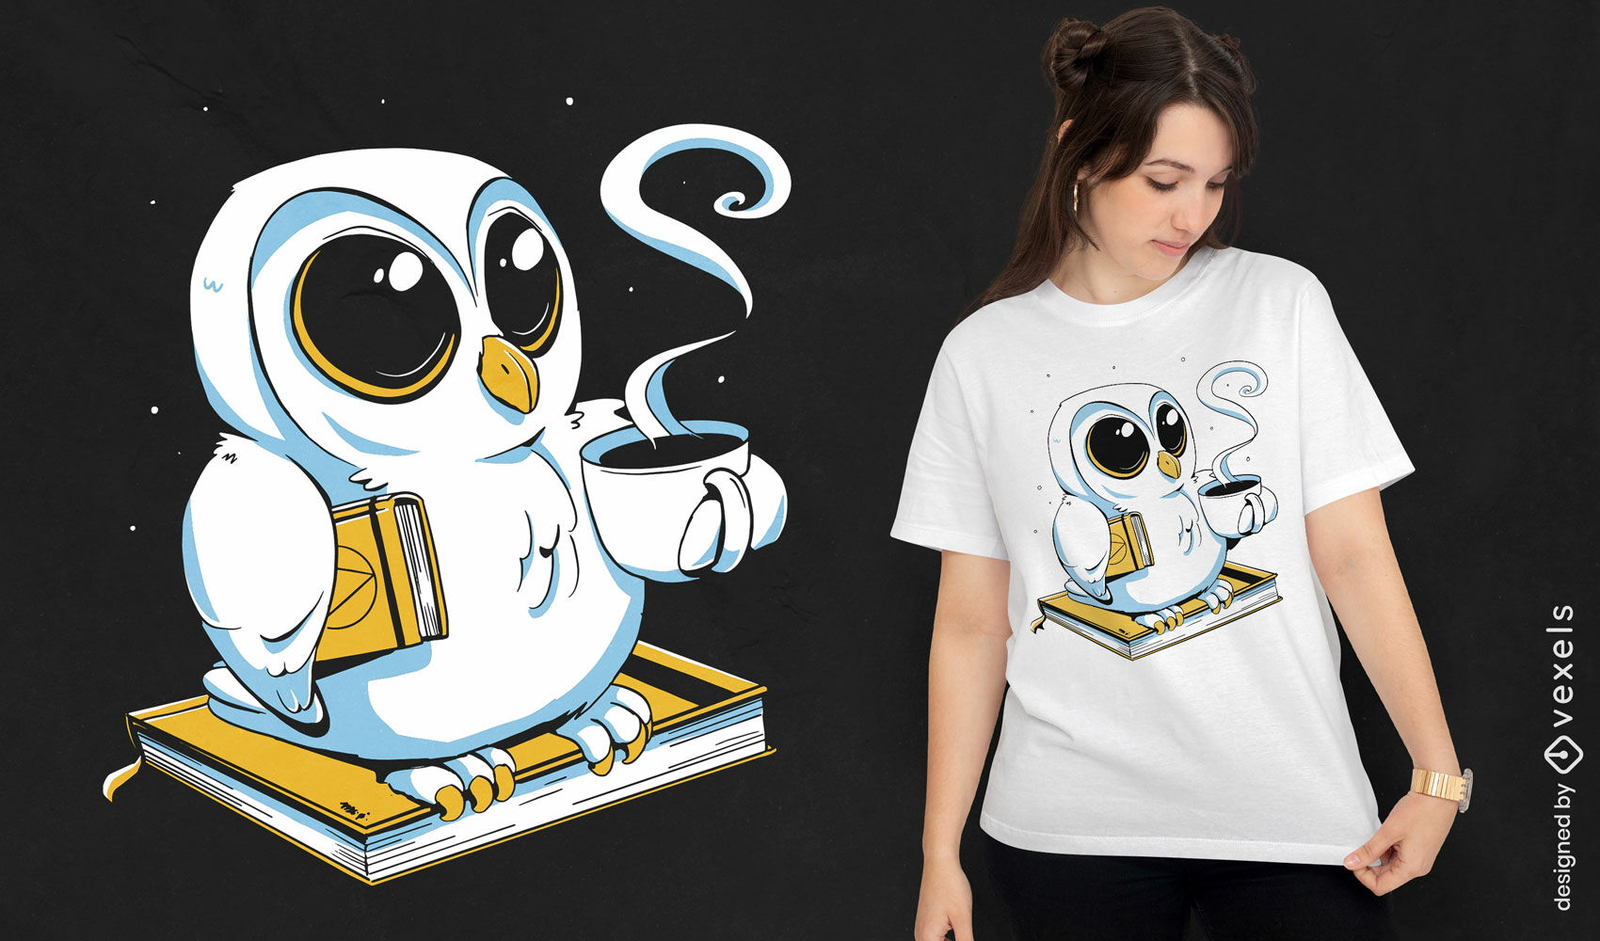
Coruja com biooks e design de t-shirt de café
Escolha uma pasta
Todos os favoritos
Criar novo
Salvar
Coruja com biooks e design de t-shirt de café
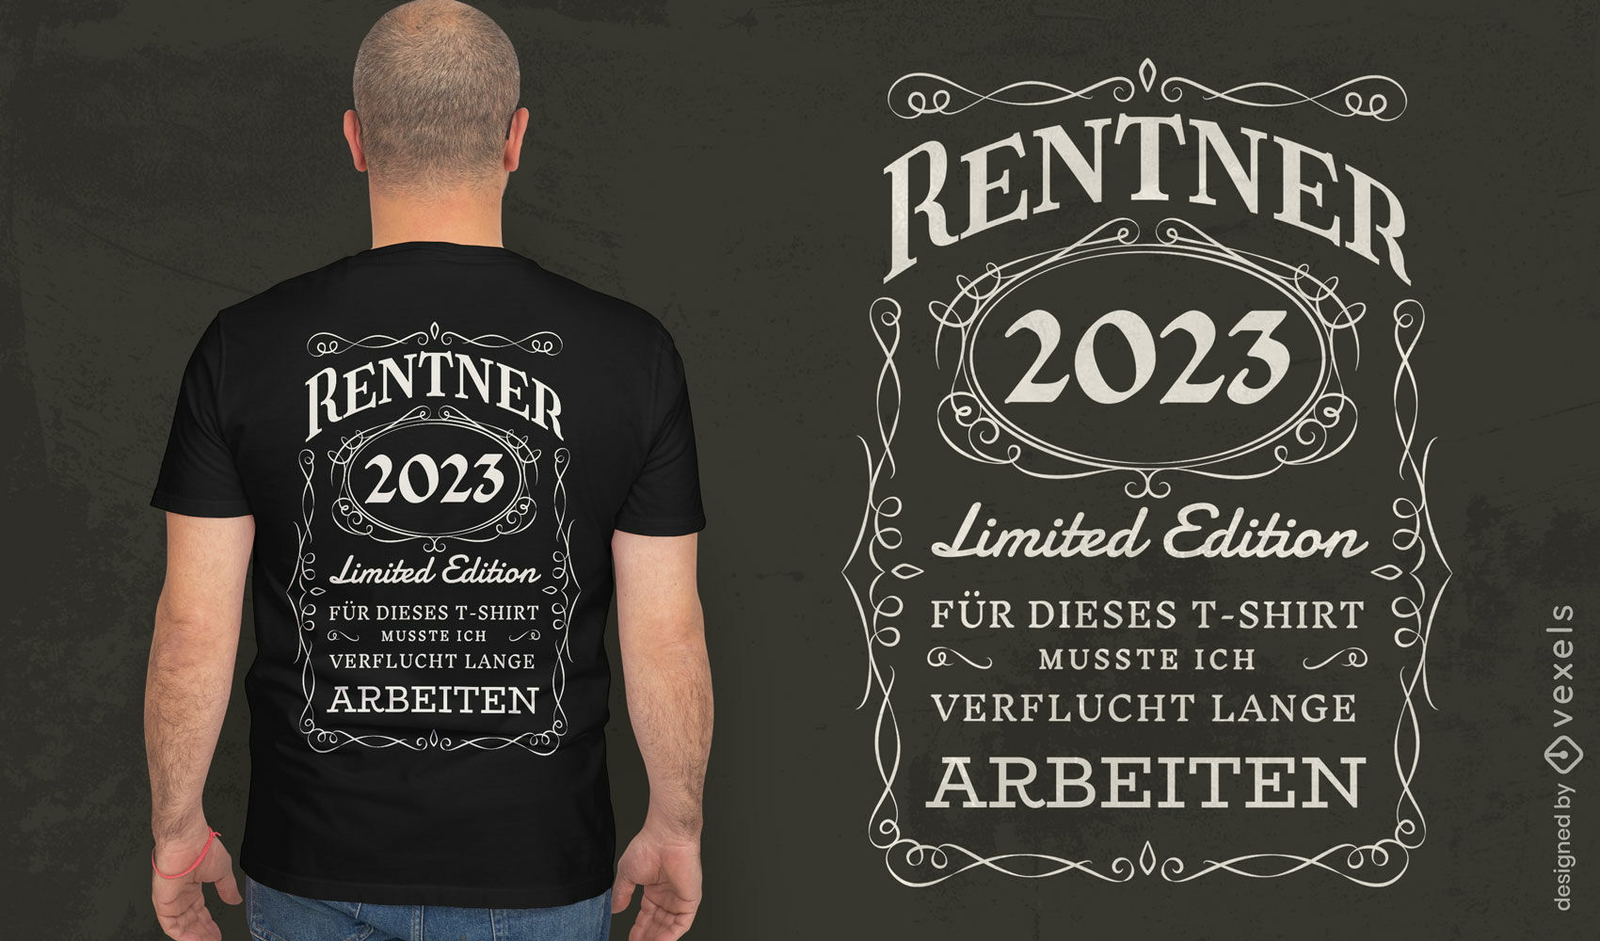
Conteúdo em alemão
Pronto para imprimir
para Merch
Design de camiseta com citação vintage de aposentadoria 2023
Escolha uma pasta
Todos os favoritos
Criar novo
Salvar
Design de camiseta com citação vintage de aposentadoria 2023
Pronto para imprimir
para Merch
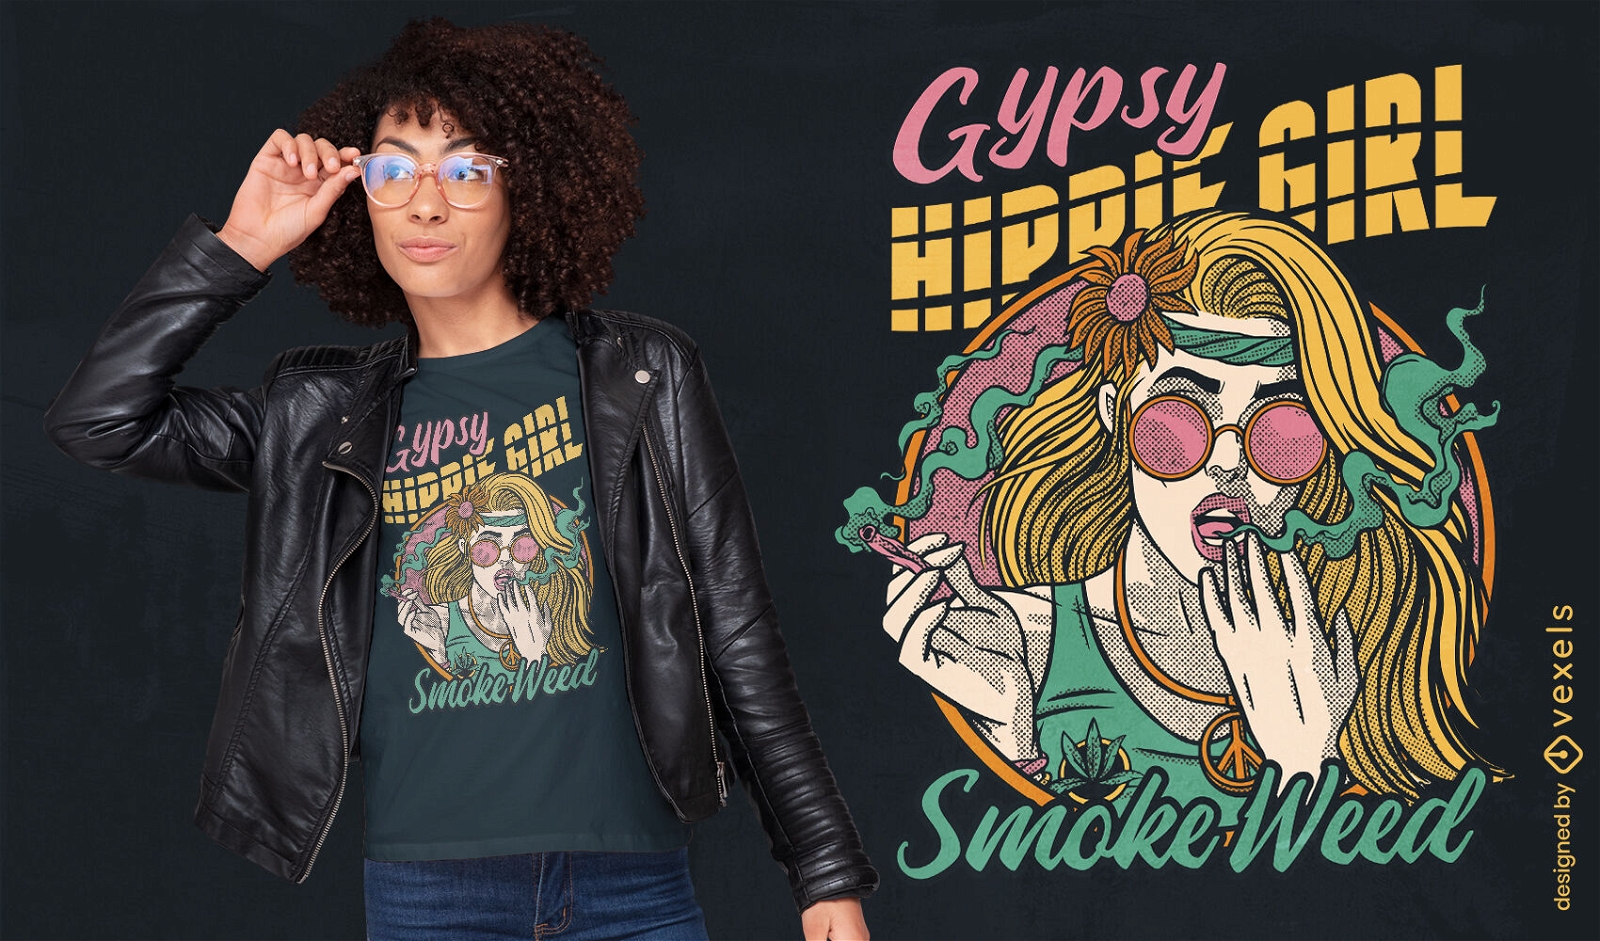
Design de camiseta de garota hippie fumando maconha
Escolha uma pasta
Todos os favoritos
Criar novo
Salvar
Design de camiseta de garota hippie fumando maconha
Pronto para imprimir
para Merch
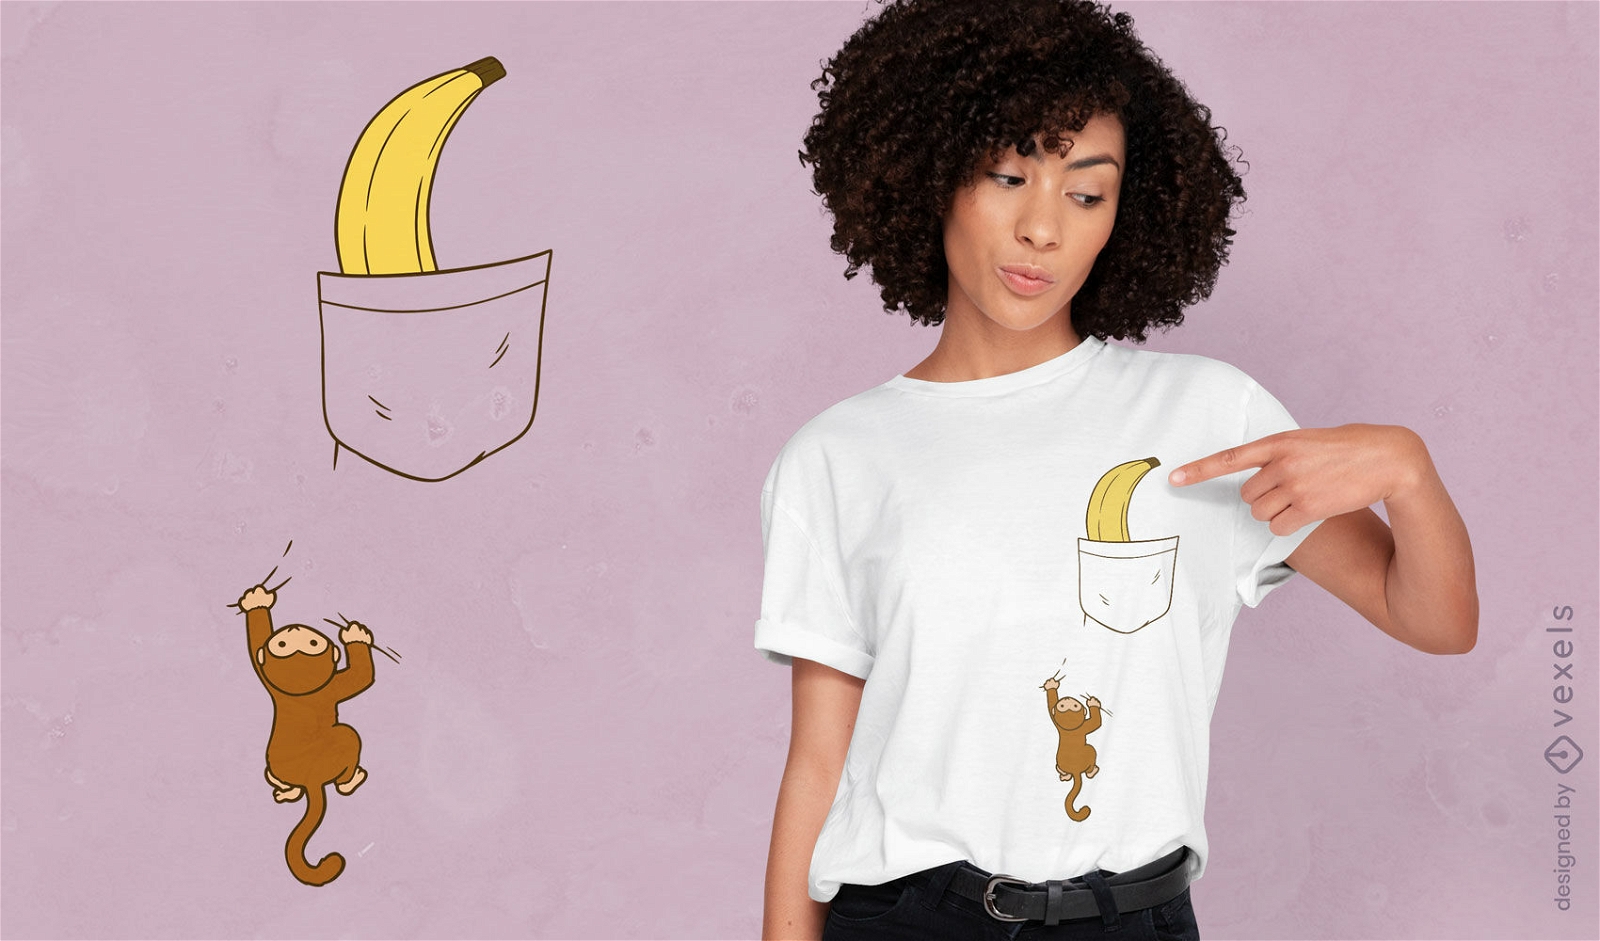
Macaco escalando para design de camiseta de banana
Escolha uma pasta
Todos os favoritos
Criar novo
Salvar
Macaco escalando para design de camiseta de banana
Pronto para imprimir
para Merch
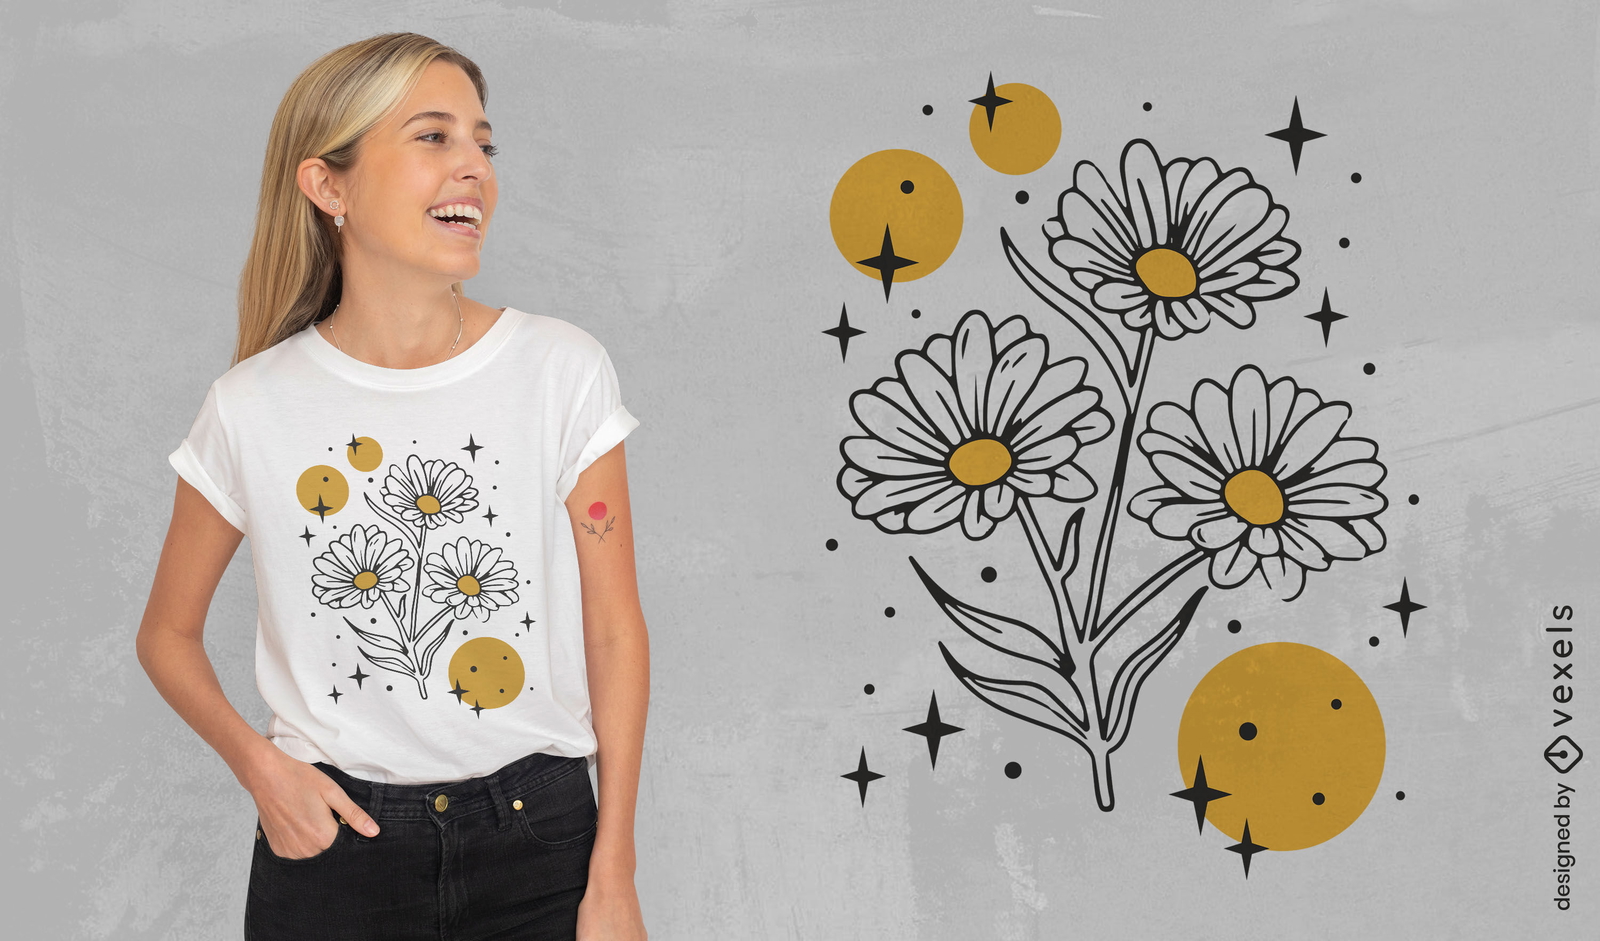
Design de t-shirt de flores e círculos cintilantes
Escolha uma pasta
Todos os favoritos
Criar novo
Salvar
Design de t-shirt de flores e círculos cintilantes
Pronto para imprimir
para Merch
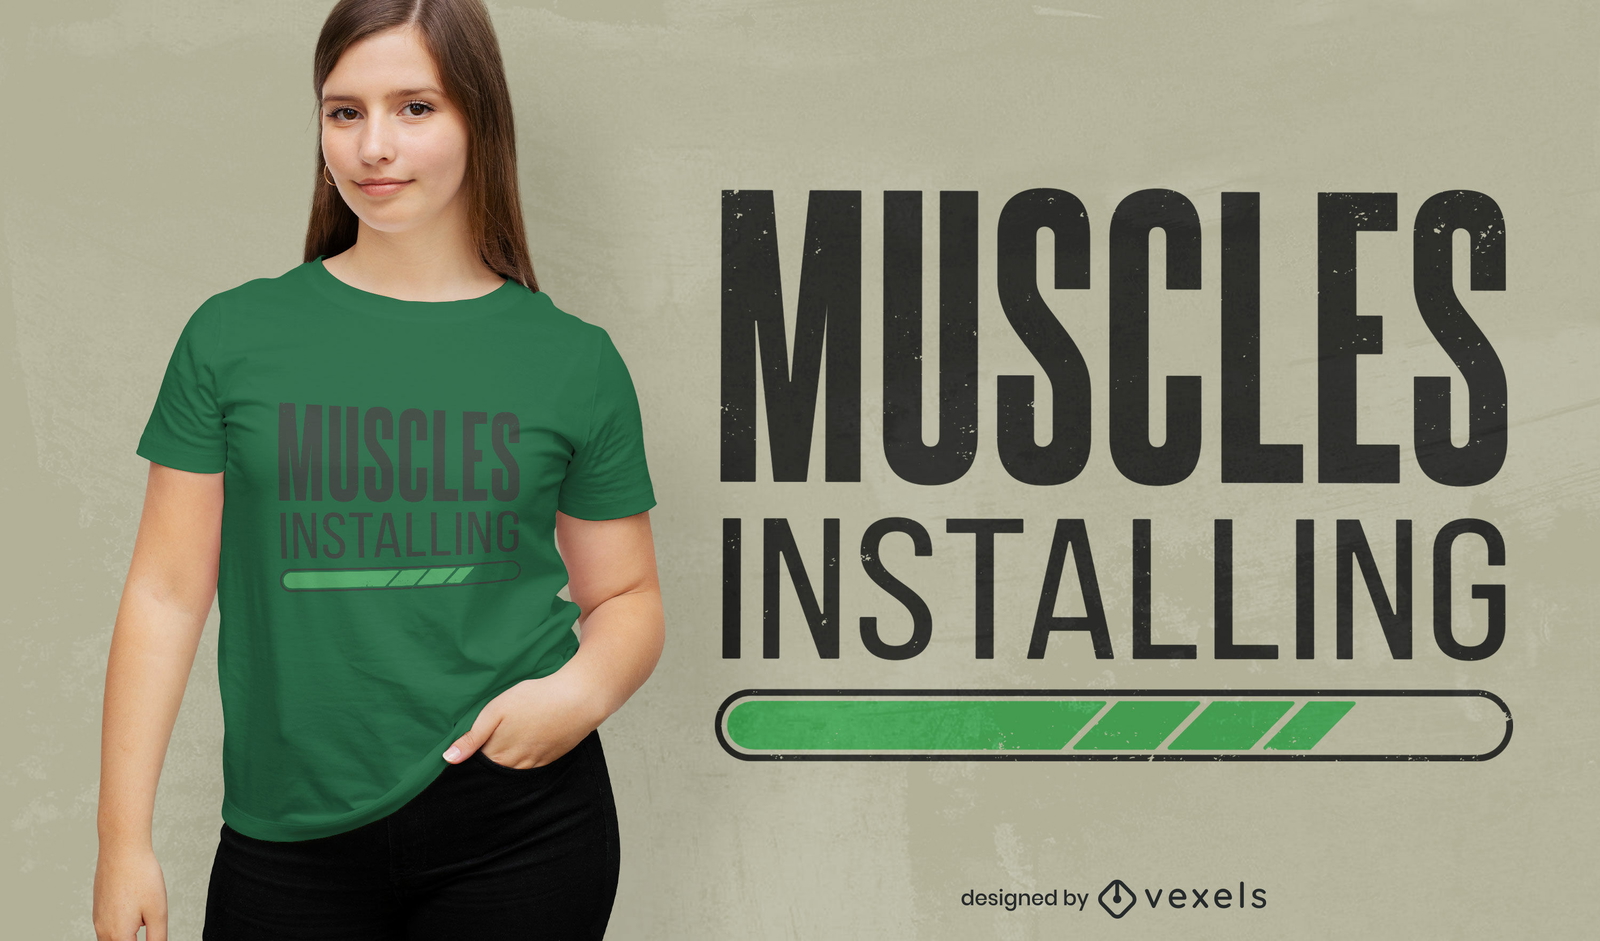
Músculos instalando design de camiseta com citação de academia
Escolha uma pasta
Todos os favoritos
Criar novo
Salvar
Músculos instalando design de camiseta com citação de academia
Pronto para imprimir
para Merch
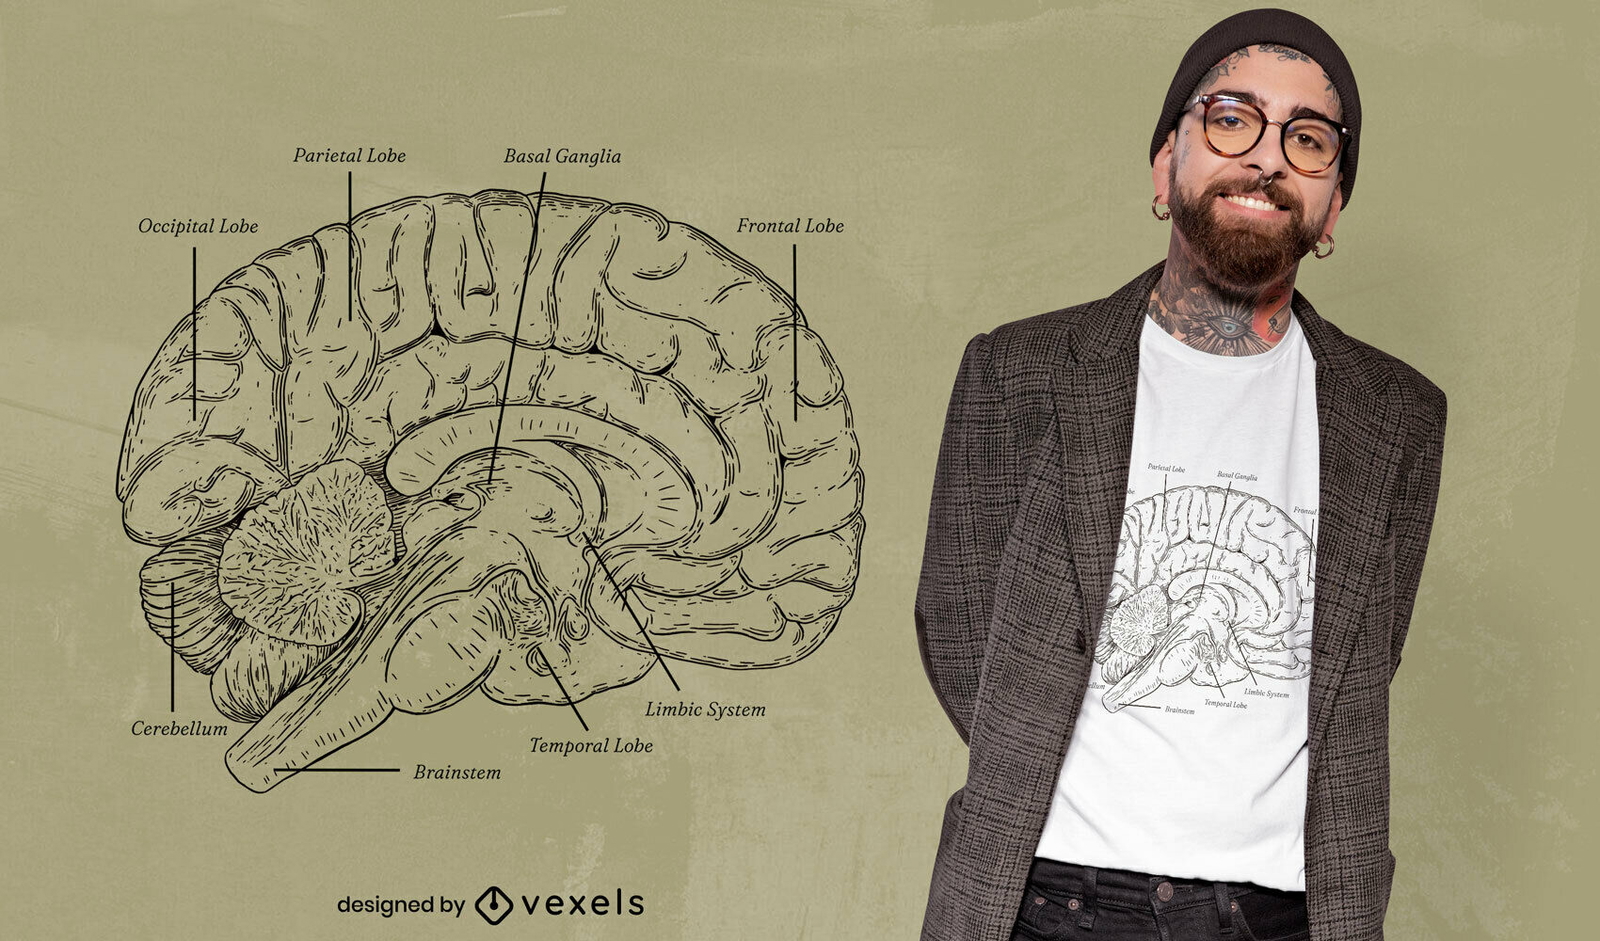
Design incrível de t-shirt com anatomia cerebral
Escolha uma pasta
Todos os favoritos
Criar novo
Salvar
Design incrível de t-shirt com anatomia cerebral
Pronto para imprimir
para Merch
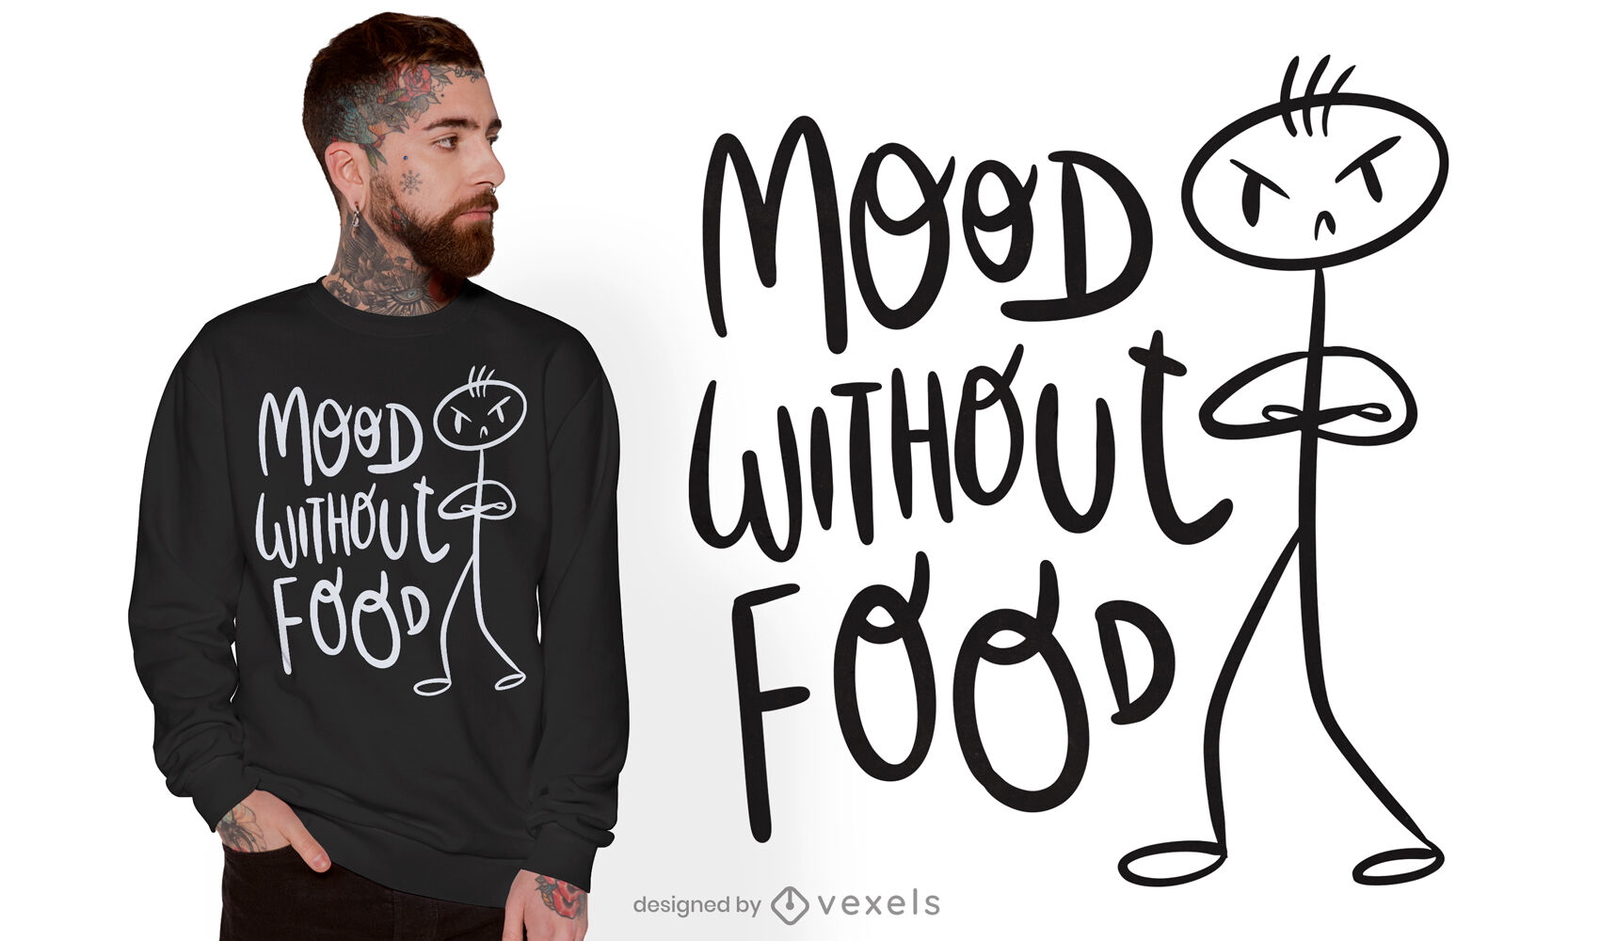
Desenho de t-shirt de boneco de palito zangado
Escolha uma pasta
Todos os favoritos
Criar novo
Salvar
Desenho de t-shirt de boneco de palito zangado
Pronto para imprimir
para Merch
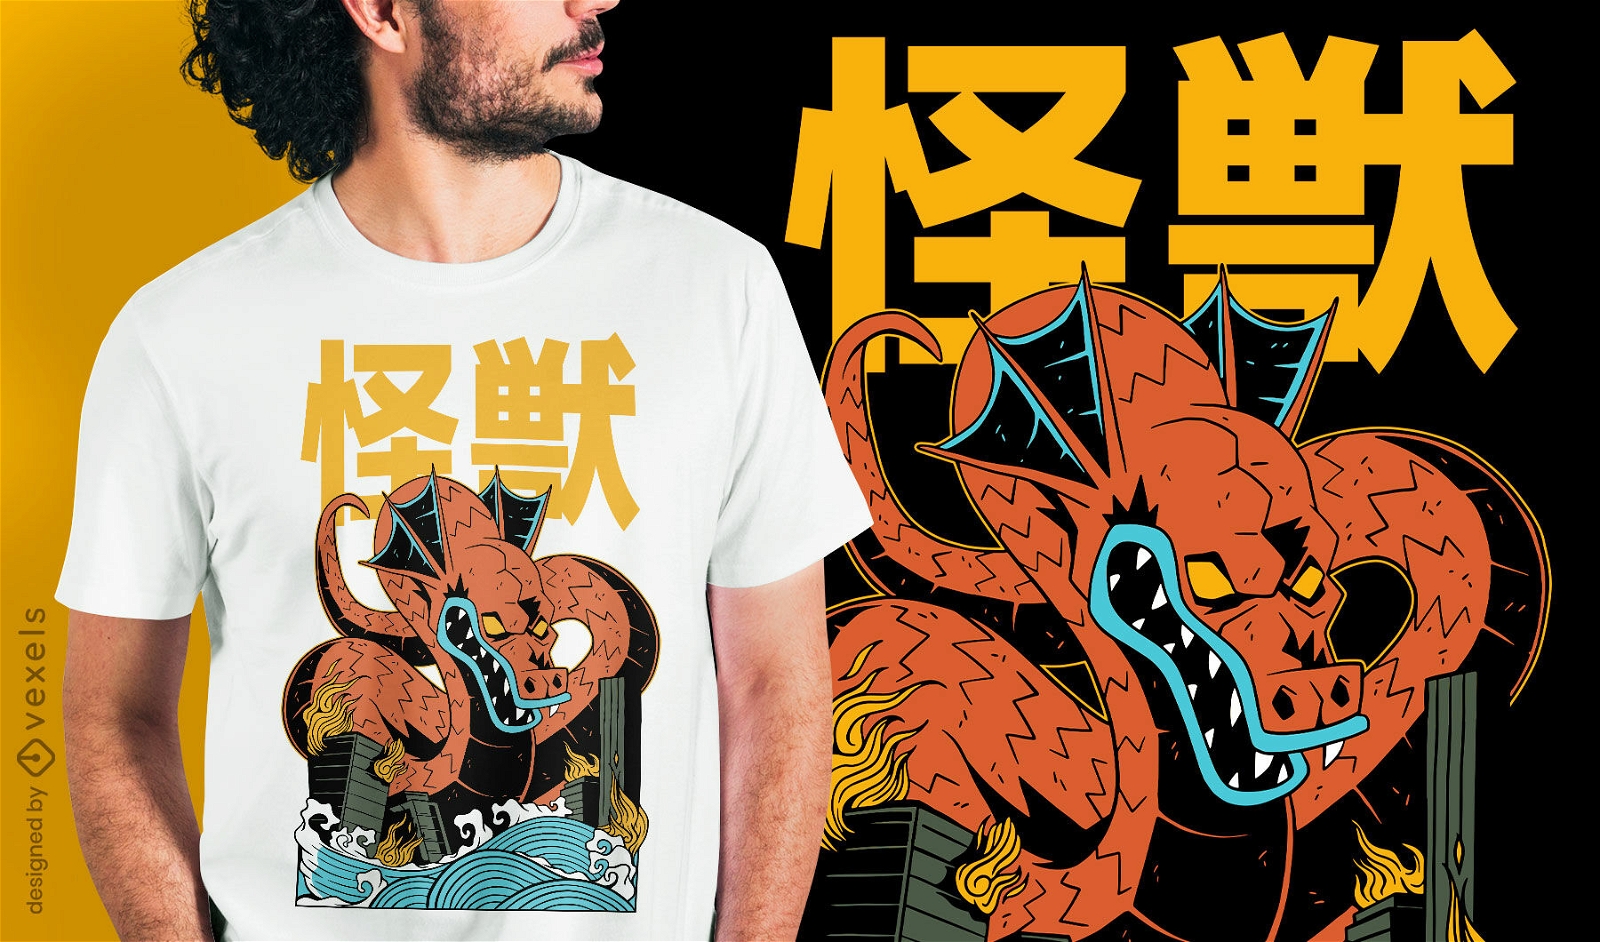
Design de camiseta de criatura japonesa Dragon kaiju
Escolha uma pasta
Todos os favoritos
Criar novo
Salvar
Design de camiseta de criatura japonesa Dragon kaiju
Pronto para imprimir
para Merch
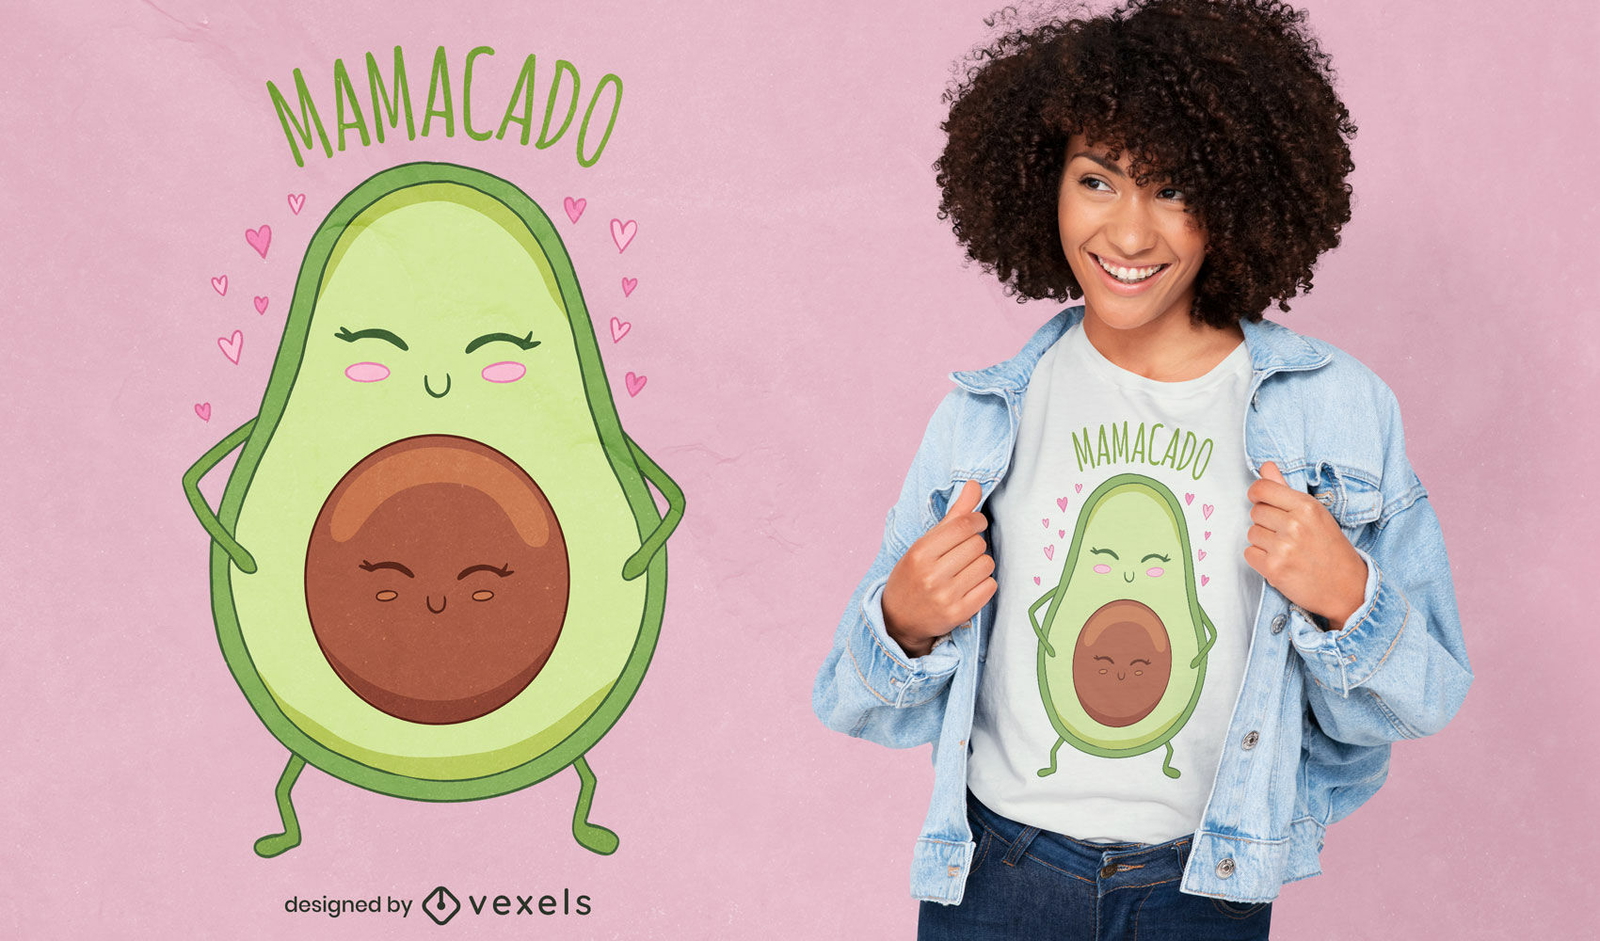
Desenho de t-shirt de desenho animado de mãe abacate fofo
Escolha uma pasta
Todos os favoritos
Criar novo
Salvar
Desenho de t-shirt de desenho animado de mãe abacate fofo
para Merch
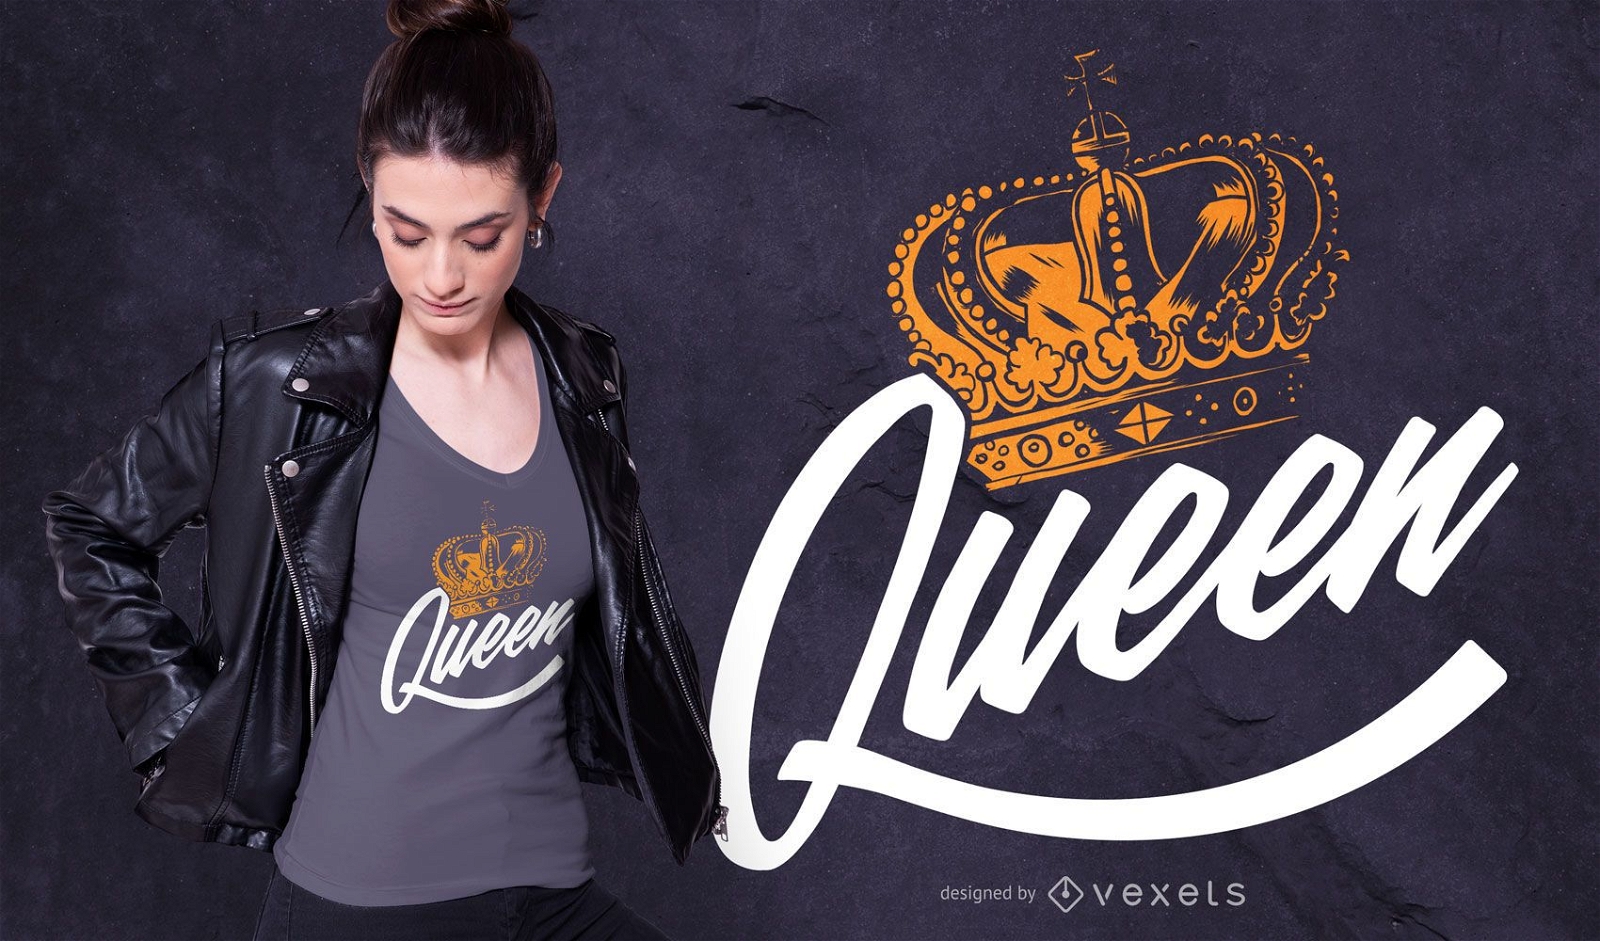
Design de camisetas com letras da rainha
Escolha uma pasta
Todos os favoritos
Criar novo
Salvar
Design de camisetas com letras da rainha
Pronto para imprimir
para Merch
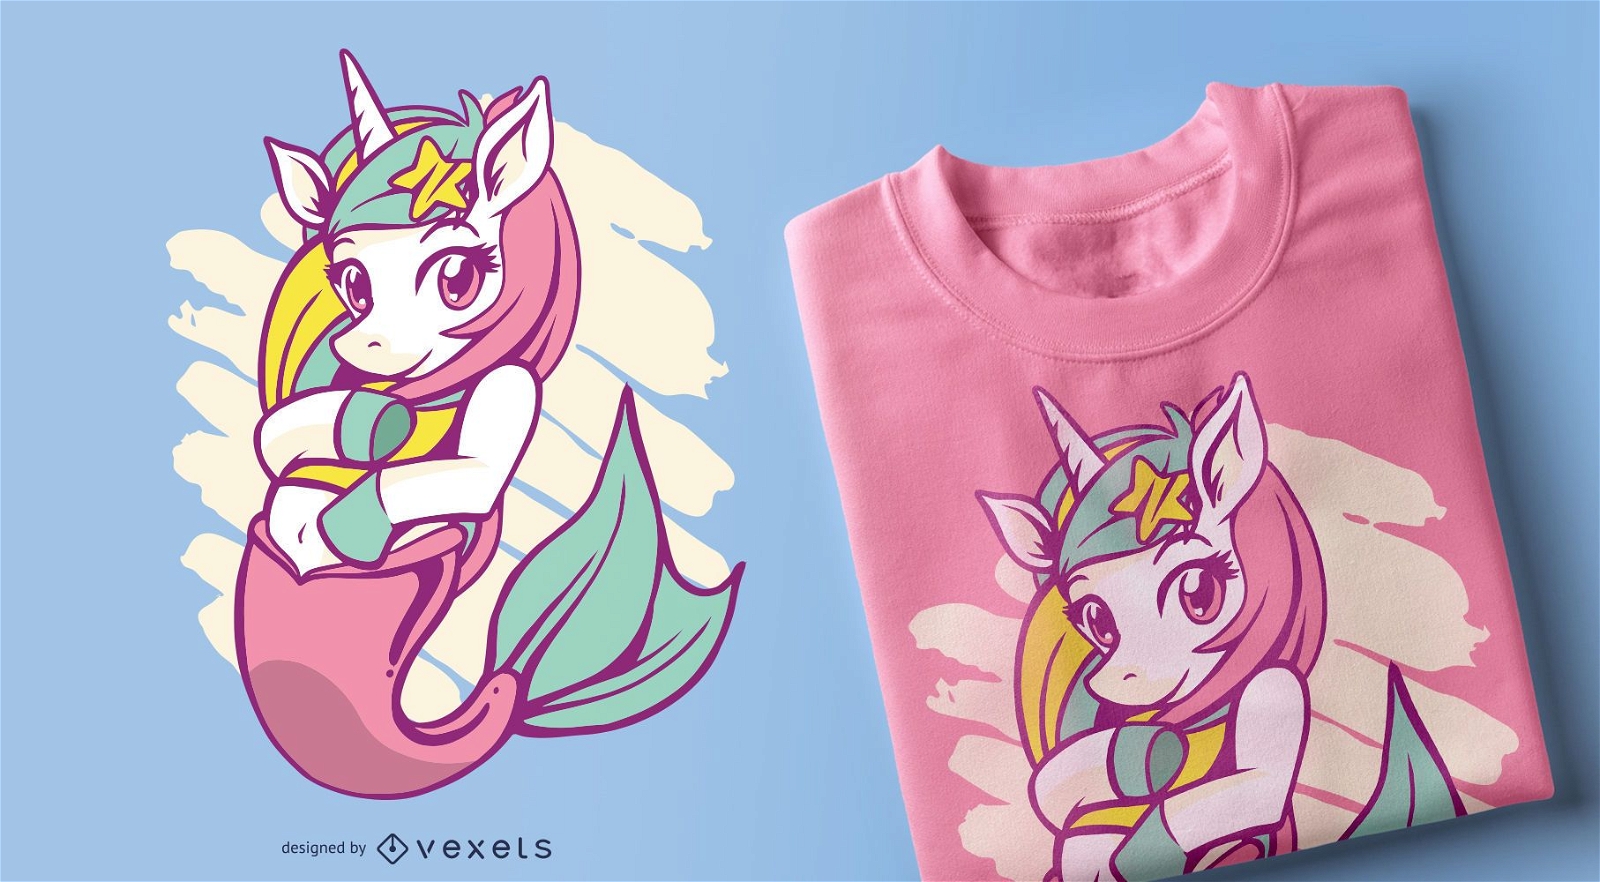
Design de camiseta de unicórnio sereia
Escolha uma pasta
Todos os favoritos
Criar novo
Salvar
Design de camiseta de unicórnio sereia
Conteúdo em alemão
Pronto para imprimir
para Merch
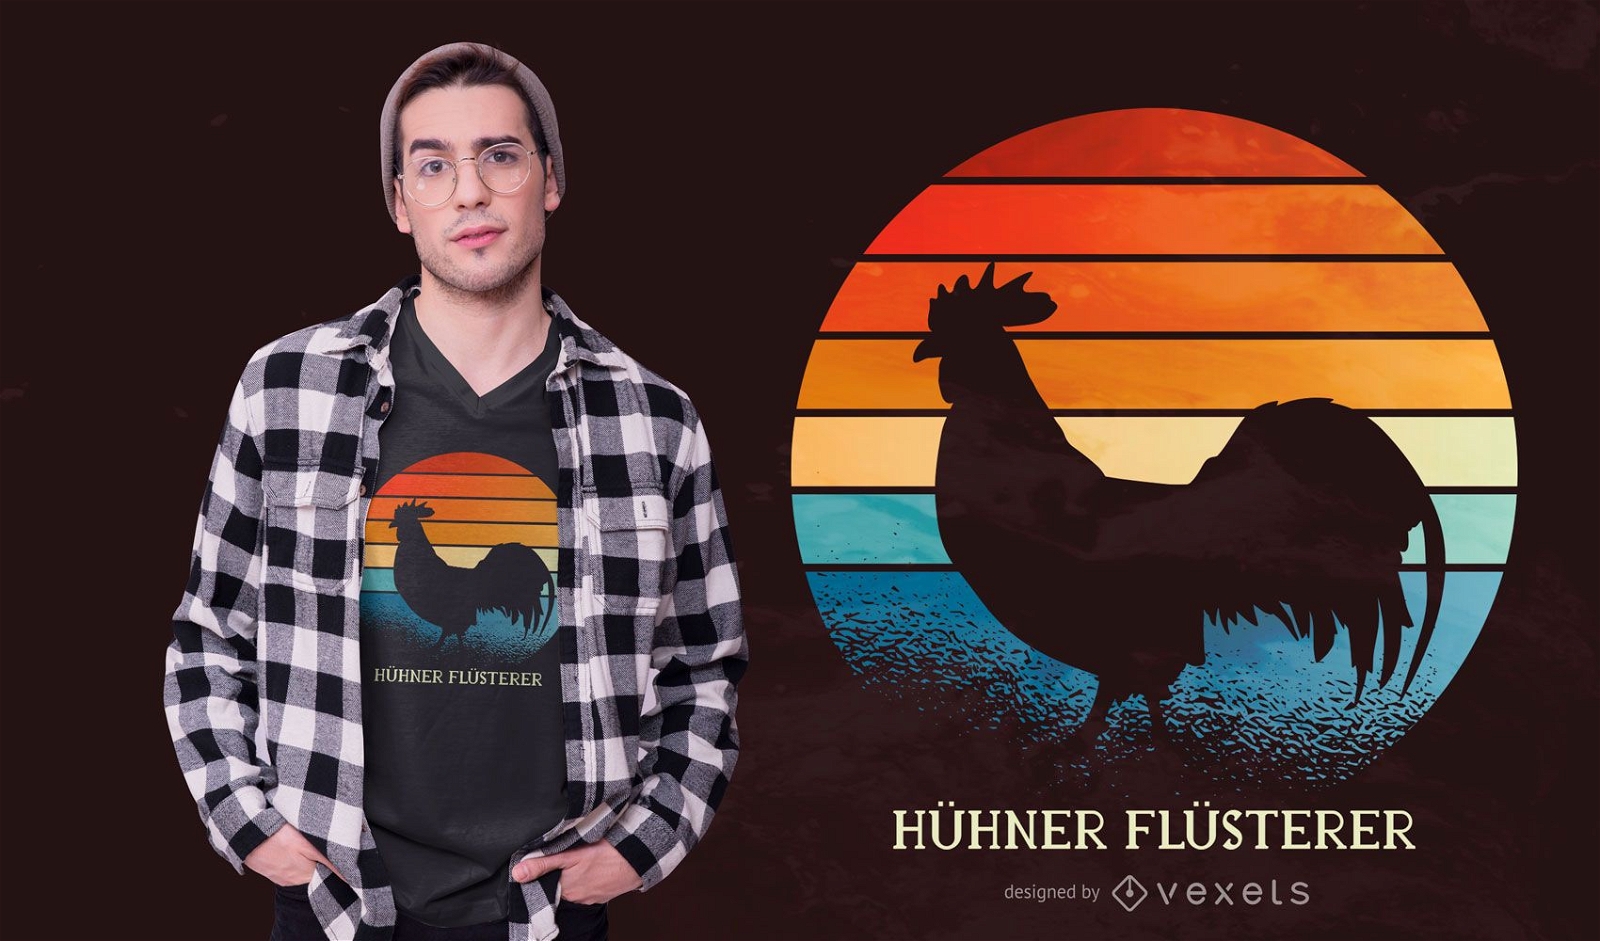
Design de camiseta galo do pôr do sol
Escolha uma pasta
Todos os favoritos
Criar novo
Salvar
Design de camiseta galo do pôr do sol
Pronto para imprimir
para Merch
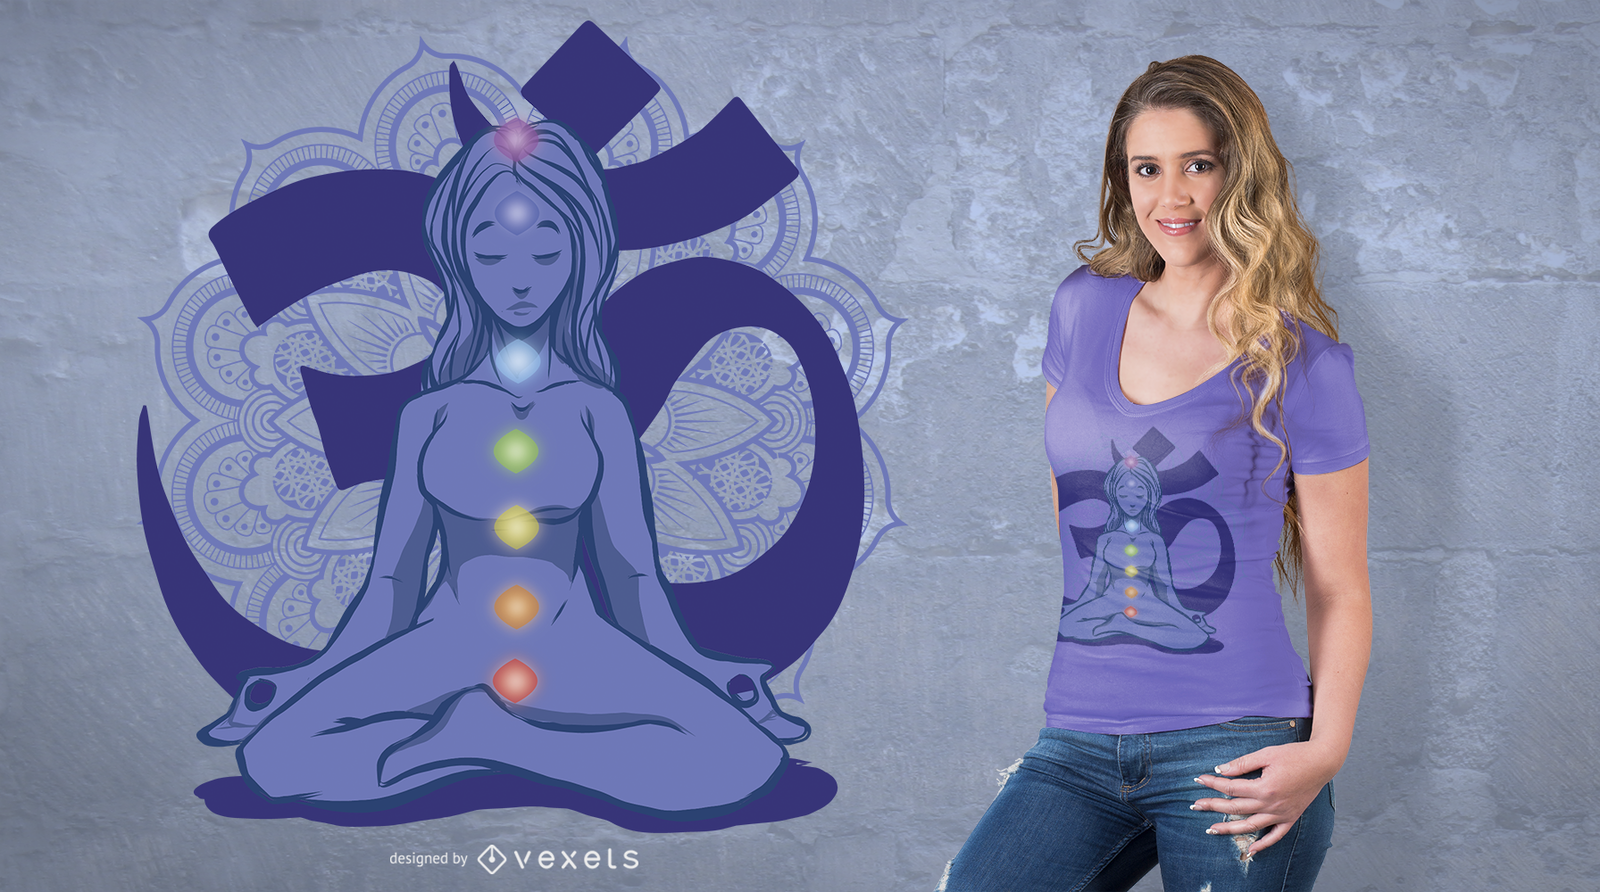
Design de camisetas Chakras
Escolha uma pasta
Todos os favoritos
Criar novo
Salvar
Design de camisetas Chakras
Pronto para imprimir
para Merch
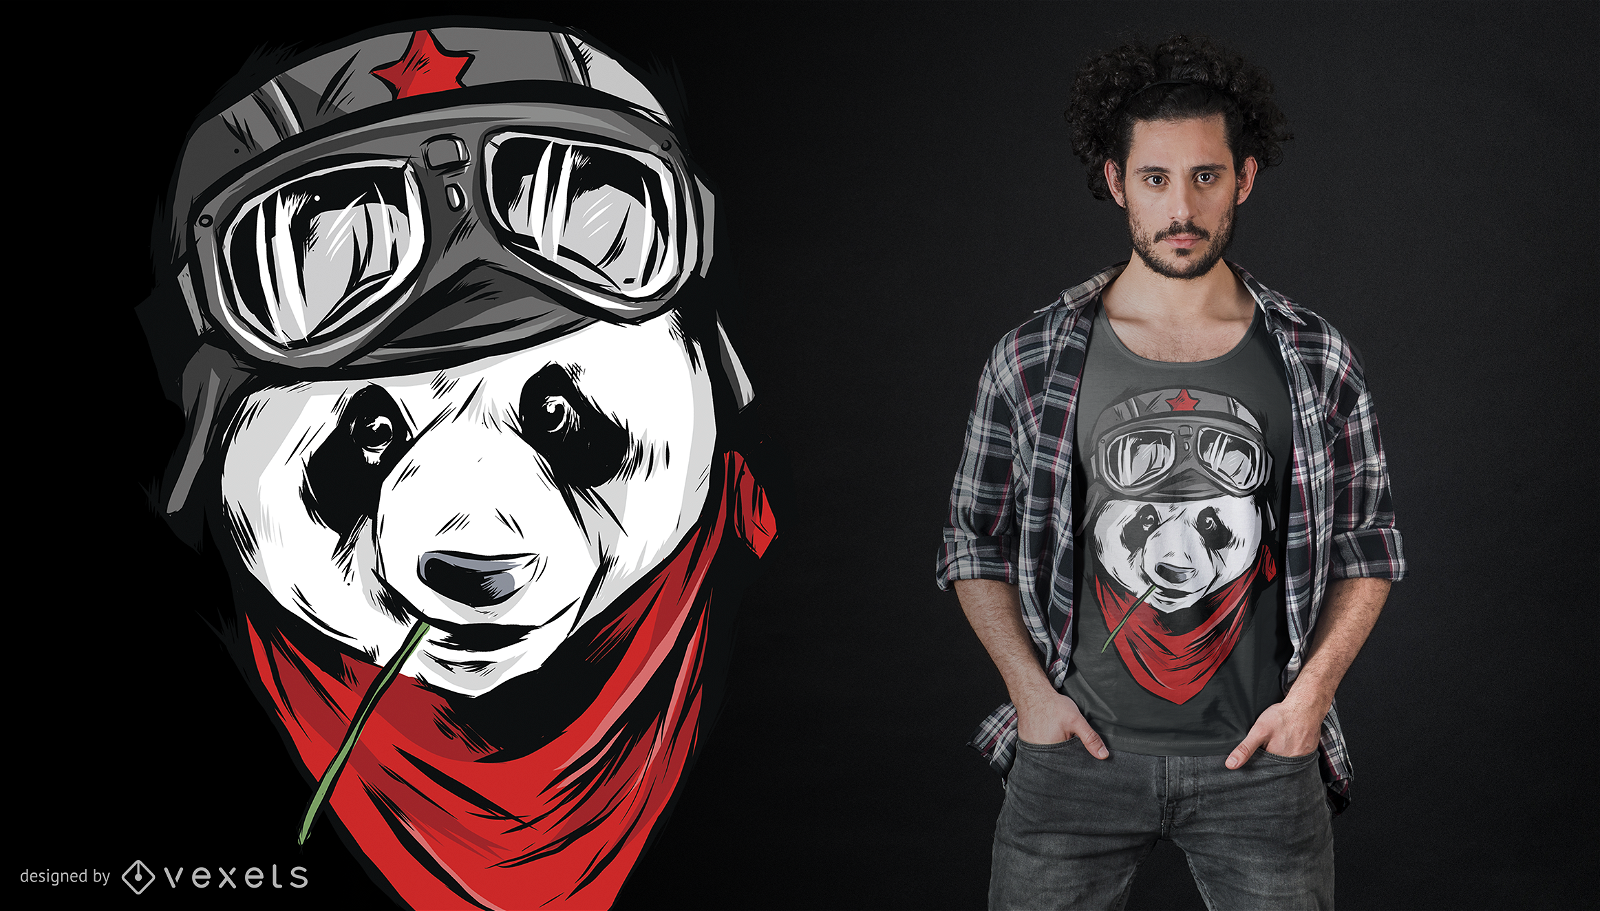
Design legal de camisetas Panda
Escolha uma pasta
Todos os favoritos
Criar novo
Salvar
Design legal de camisetas Panda
Pronto para imprimir
para Merch
Design de t-shirt autism Heart Puzzle
Escolha uma pasta
Todos os favoritos
Criar novo
Salvar
Design de t-shirt autism Heart Puzzle
Impulsione seu negócio
Com a plataforma gráfica líder de mercado.
Ver planos
Próxima
do 546
prev page
next page