Biblioteca de design
Novos designs Merch
Camisetas
Vectores
Designs de Merch de Tendência
PNGs & SVGs
Mockups
Modelos de T-Shirt PSD
Explorar Desenhos
Designs KDP
Pôsteres
Canecas
Capas para celular
Sacos de compras
Almofadas
Ferramentas de desenho
Merch Designer
Novo!
Mockup Generator
Gerador de Design de AI
Vetorizador
Quote Generator
T-Shirt Maker (Antigo)
Ajuda
Merch Digest
Blog
Centro de Ajuda
Saiba mais sobre o Merch
Feedback
Soluções Corporativas
Empresa
Acesso à API
Estúdio de Design
Design em Lote
Preços
Carregando...
Inscrever-se
Conecte-se
Merch Vectors
graficos
Biblioteca de design
Novos designs Merch
Camisetas
Vectores
Designs de Merch de Tendência
PNGs & SVGs
Mockups
Modelos de T-Shirt PSD
Explorar Desenhos
Designs KDP
Pôsteres
Canecas
Capas para celular
Sacos de compras
Almofadas
Ferramentas de desenho
Merch Designer
Novo!
Mockup Generator
Gerador de Design de AI
Vetorizador
Quote Generator
T-Shirt Maker (Antigo)
Ajuda
Merch Digest
Blog
Centro de Ajuda
Saiba mais sobre o Merch
Feedback
Soluções Corporativas
Empresa
Acesso à API
Estúdio de Design
Design em Lote
PLANOS
Merch Vectors
graficos
27291 Designs Vetoriais de graficos para Camisetas e Merch
Baixar e comprar Designs Vetoriais AI de graficos para Camisetas, Capas do Celular, Capas do Livros e outros produtos Merch
Relacionado:
graficos vetoriais
,
desenhos graficos de ações
,
graficos tridimensionais
Ordenar por
Mais relevante
Resultados patrocinados da
Ganhe 15% de desconto com o código: VEXELS15
veja mais detalhes
texto editável
Pronto para imprimir
para Merch
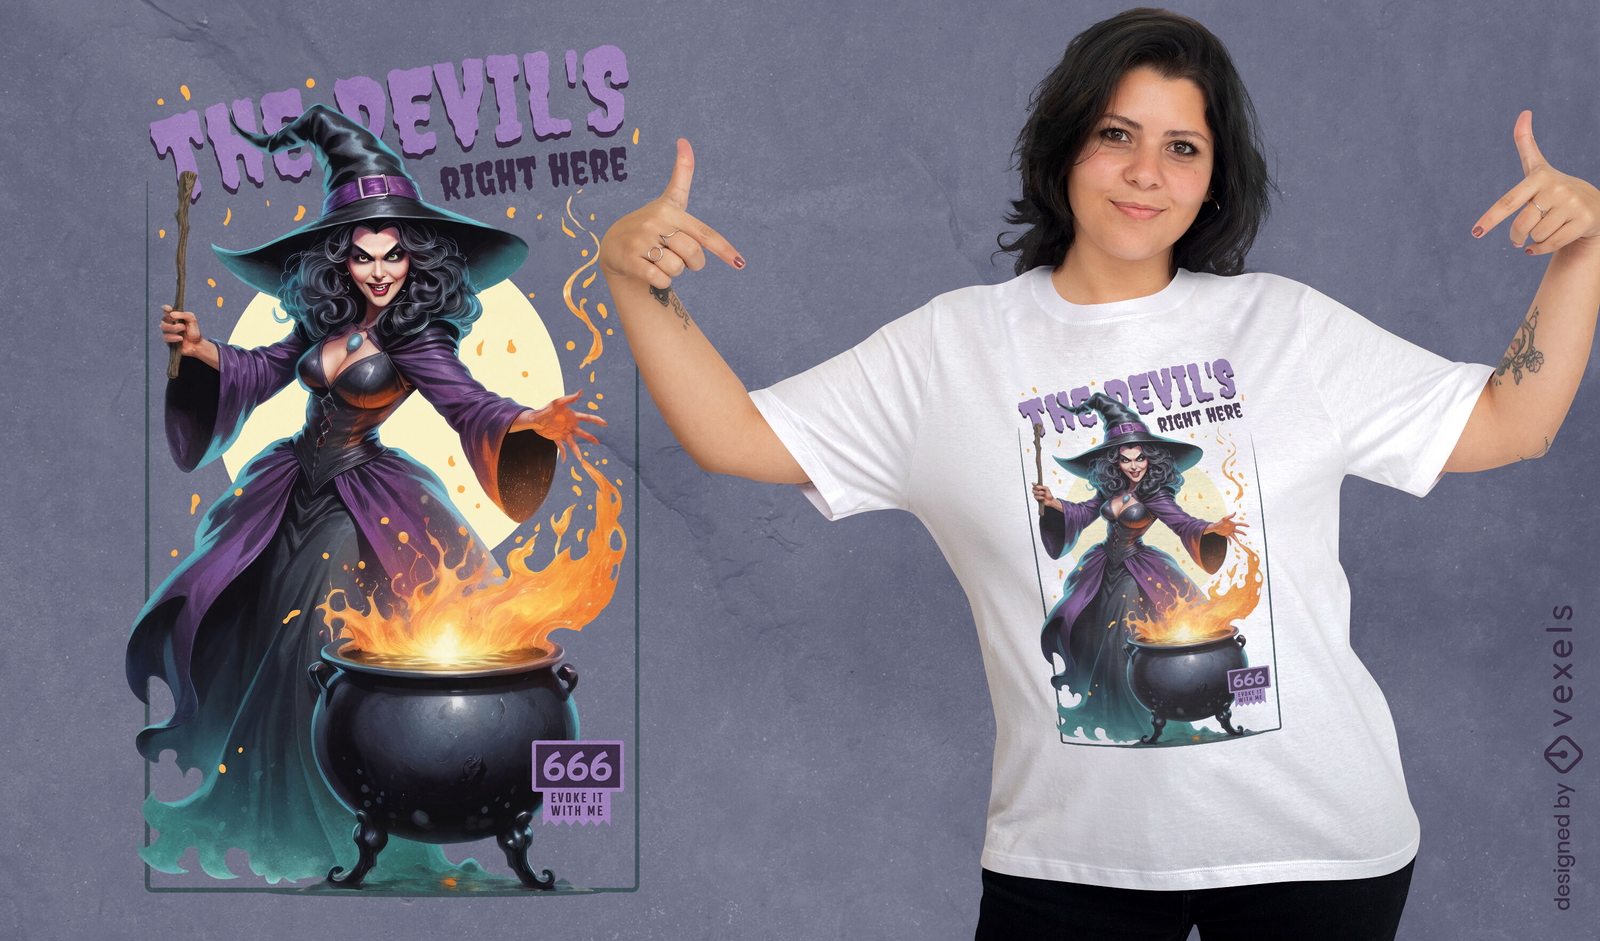
Design de camiseta "O diabo está aqui"
Escolha uma pasta
Todos os favoritos
Criar novo
Salvar
Design de camiseta "O diabo está aqui"
texto editável
Pronto para imprimir
para Merch
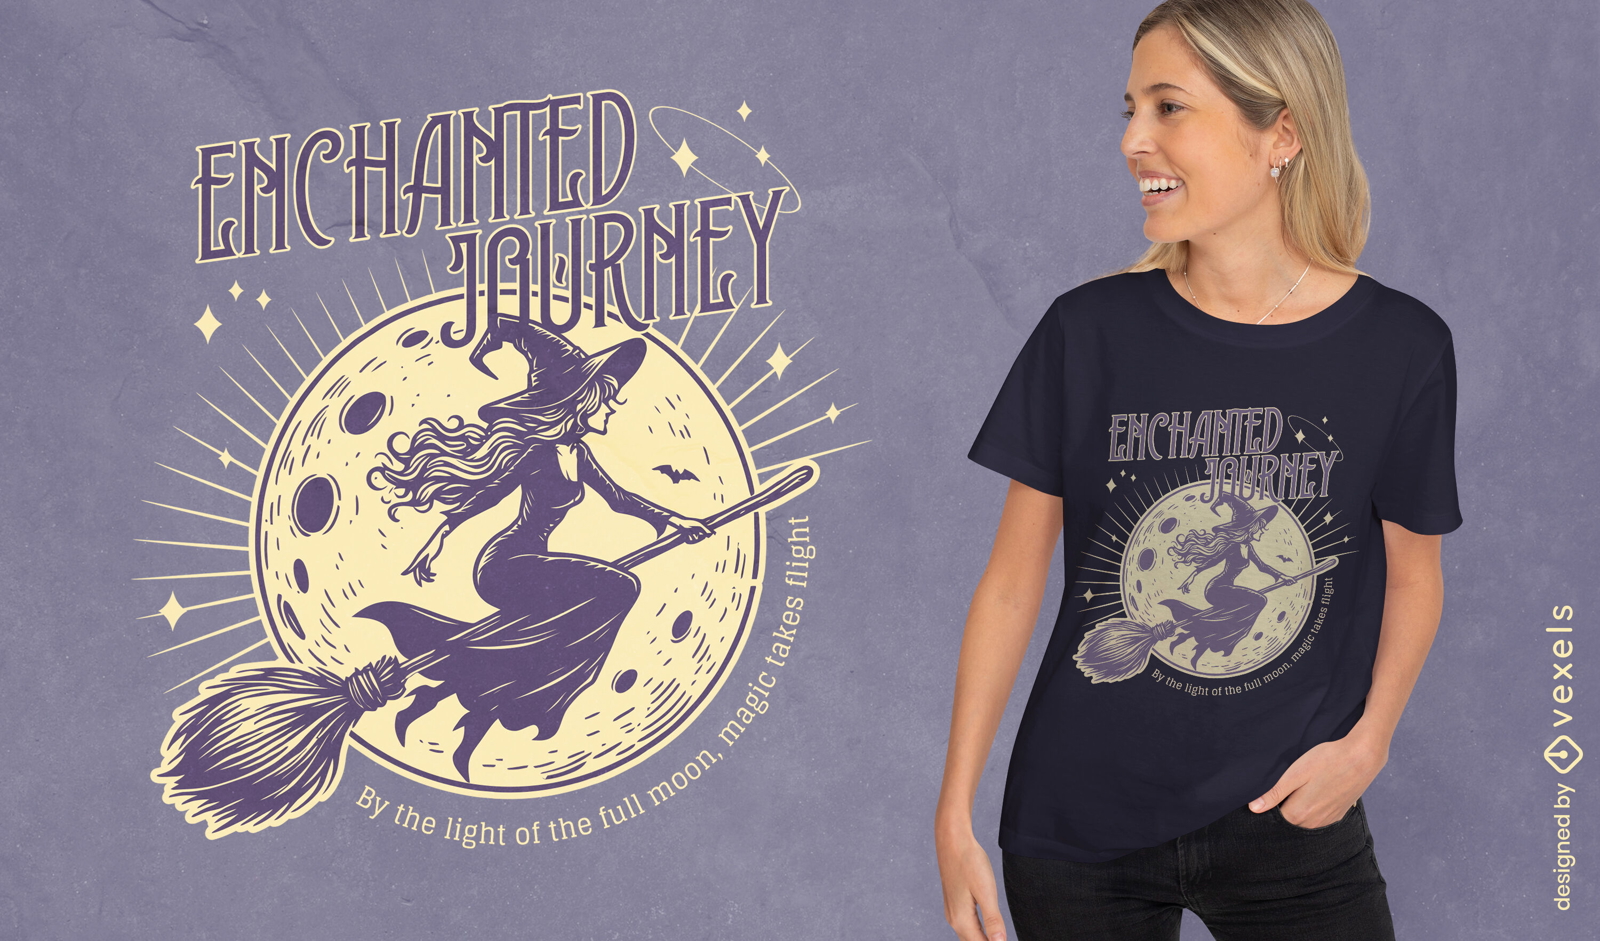
Design de camiseta de viagem encantada
Escolha uma pasta
Todos os favoritos
Criar novo
Salvar
Design de camiseta de viagem encantada
Pronto para imprimir
para Merch
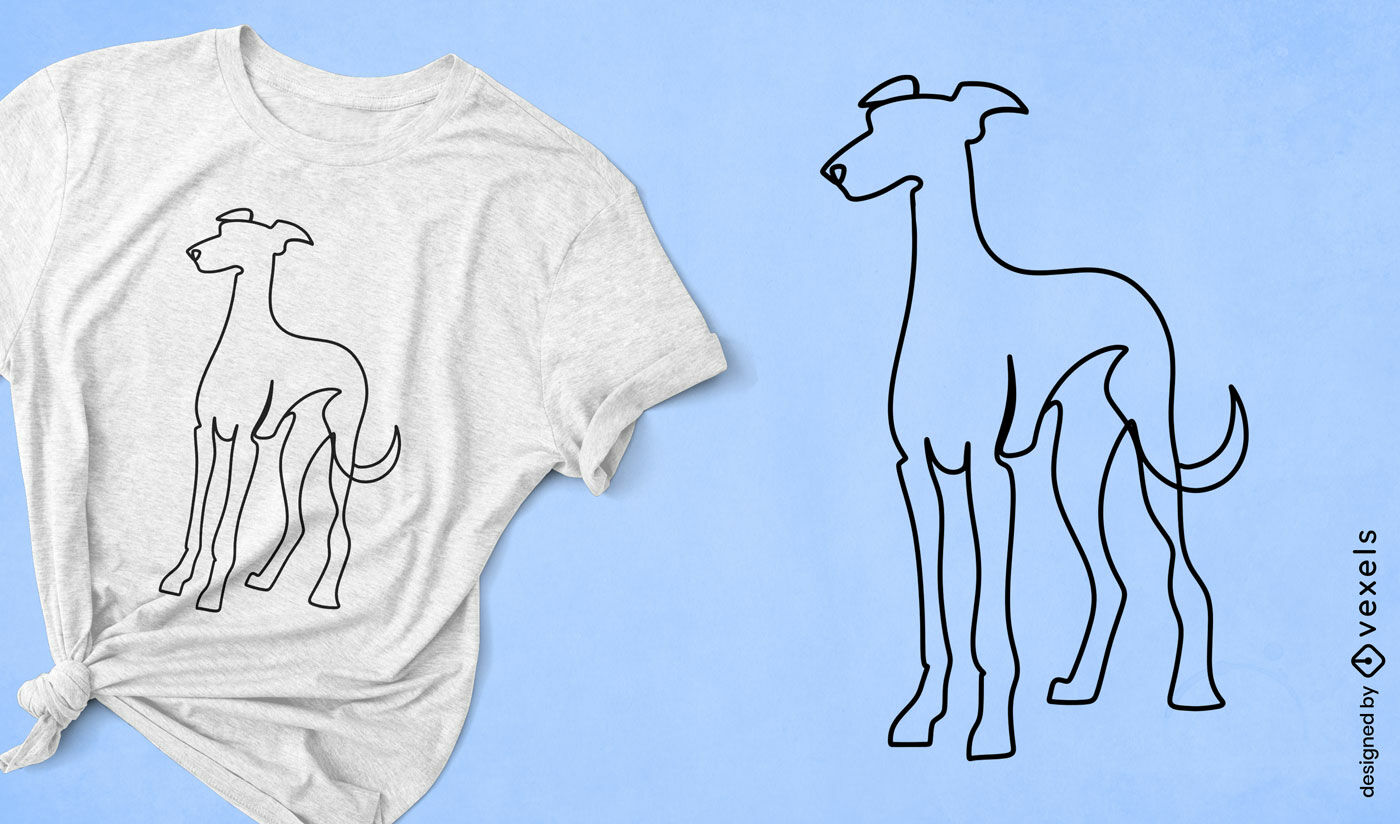
Design minimalista de camiseta para cachorro com linha contínua
Escolha uma pasta
Todos os favoritos
Criar novo
Salvar
Design minimalista de camiseta para cachorro com linha contínua
Pronto para imprimir
para Merch
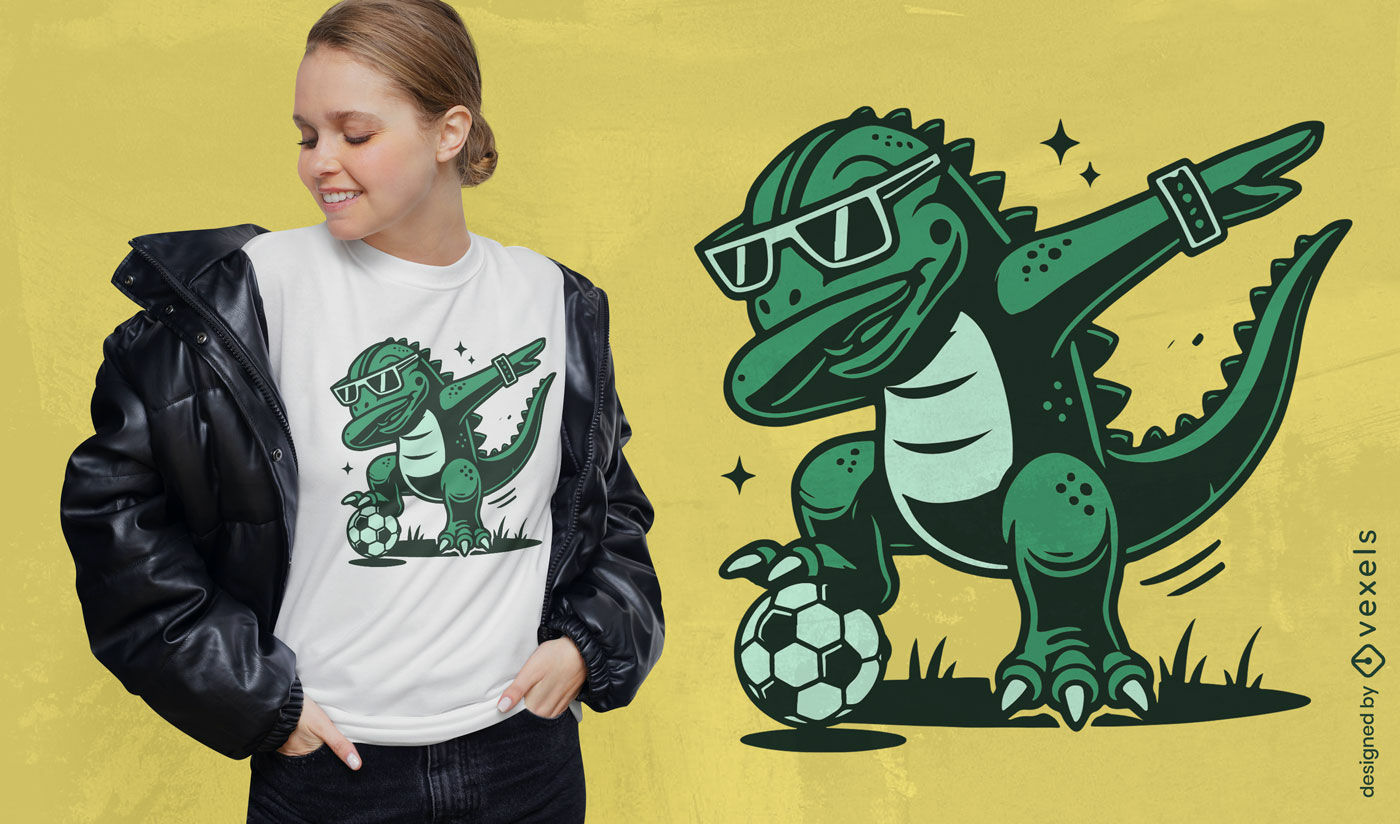
Design de camiseta de jogador de futebol de dinossauro
Escolha uma pasta
Todos os favoritos
Criar novo
Salvar
Design de camiseta de jogador de futebol de dinossauro
texto editável
Pronto para imprimir
para Merch
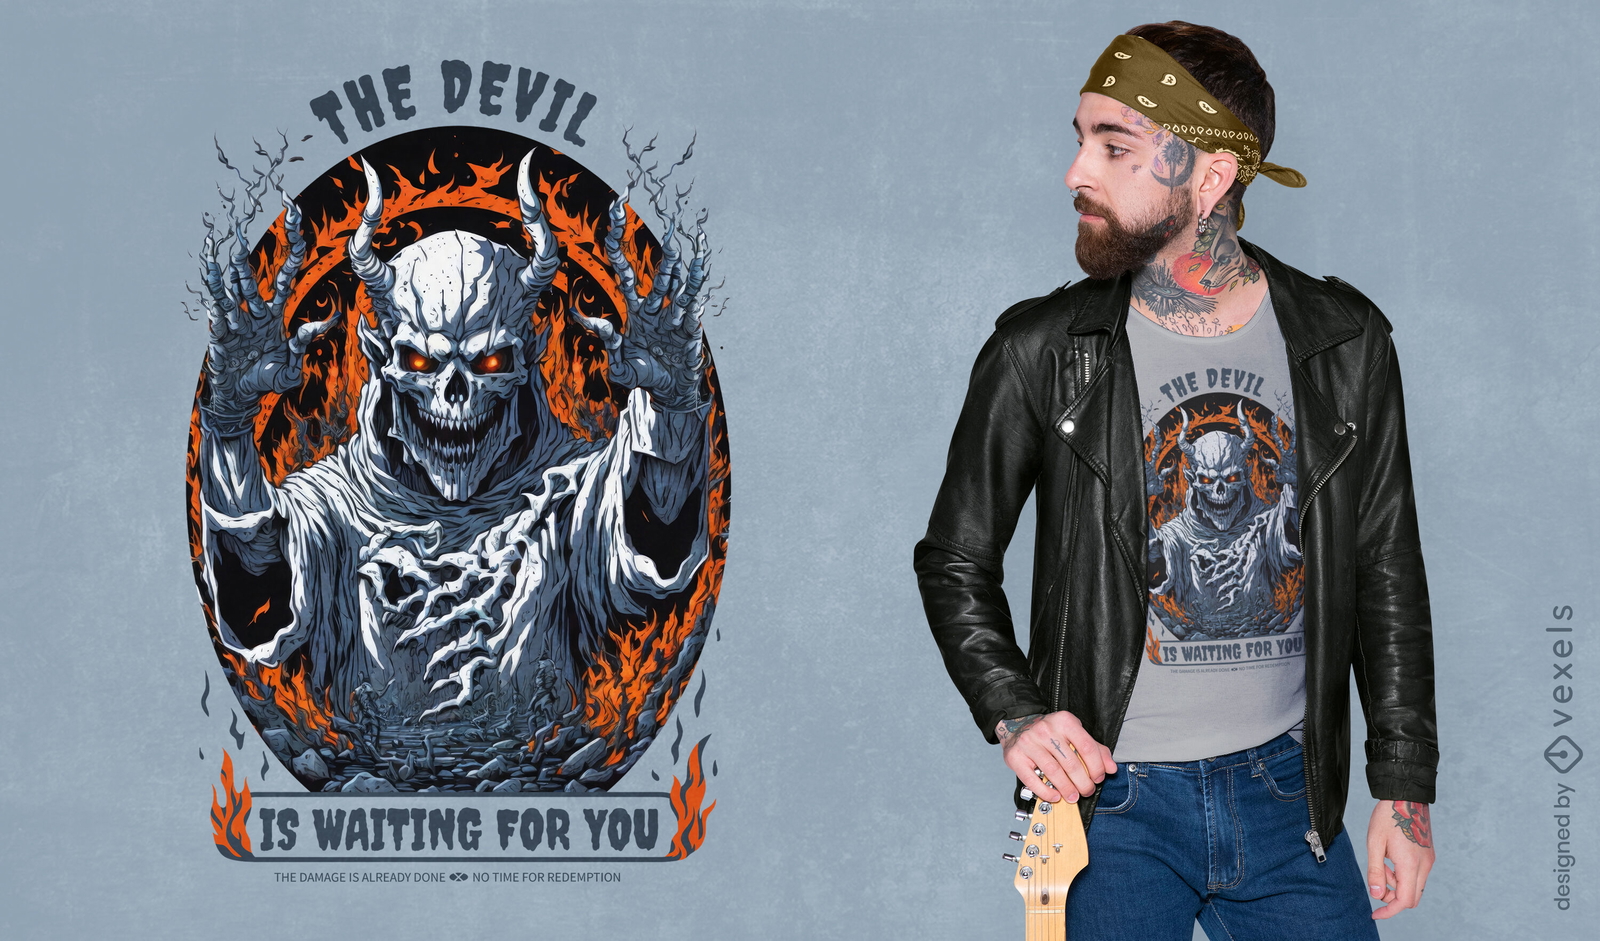
Design de camiseta com aviso do diabo
Escolha uma pasta
Todos os favoritos
Criar novo
Salvar
Design de camiseta com aviso do diabo
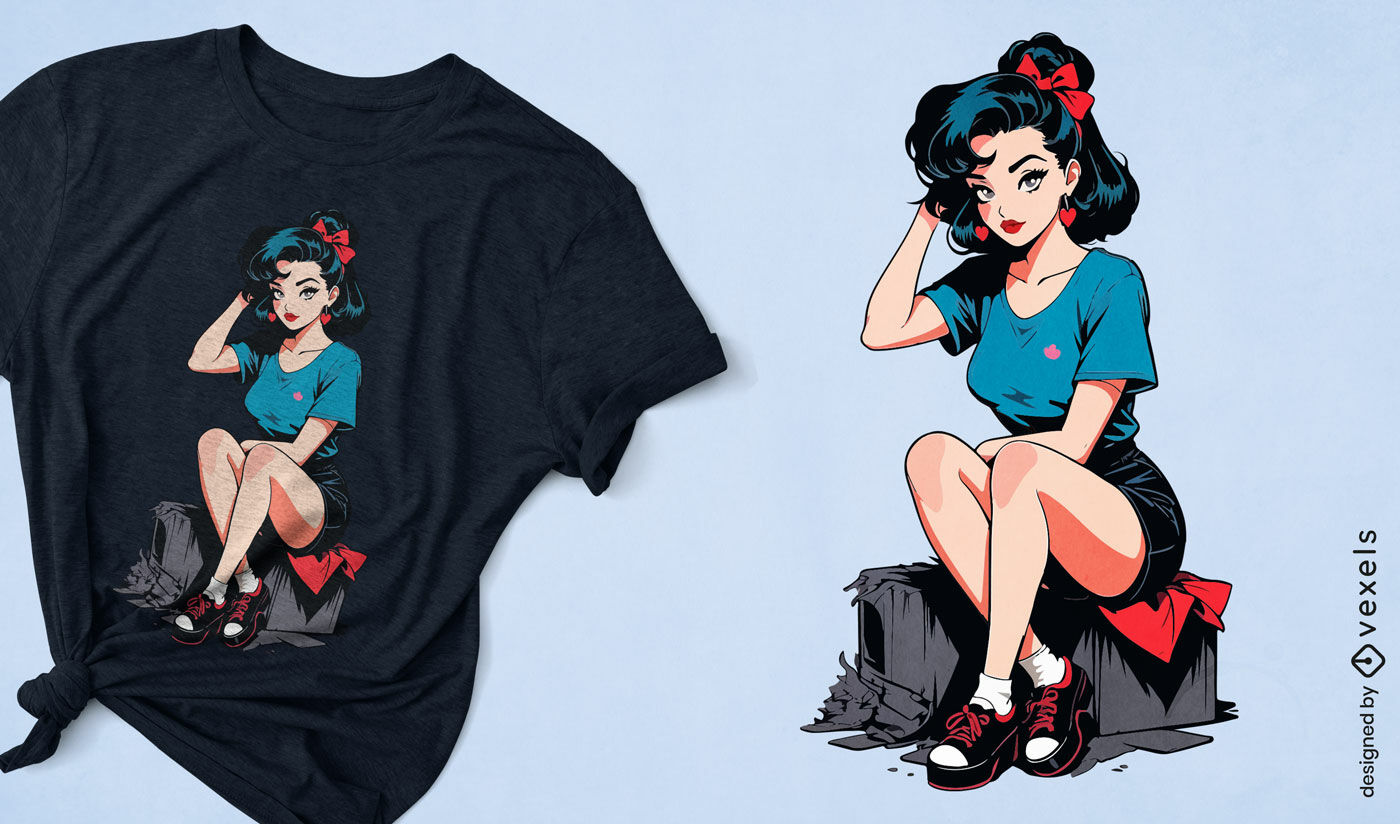
Gerado por IA, selecionado por nossos designers.
para Merch
Garota pinup retrô com design de camiseta de cabelo azul
Escolha uma pasta
Todos os favoritos
Criar novo
Salvar
Garota pinup retrô com design de camiseta de cabelo azul
texto editável
Pronto para imprimir
para Merch
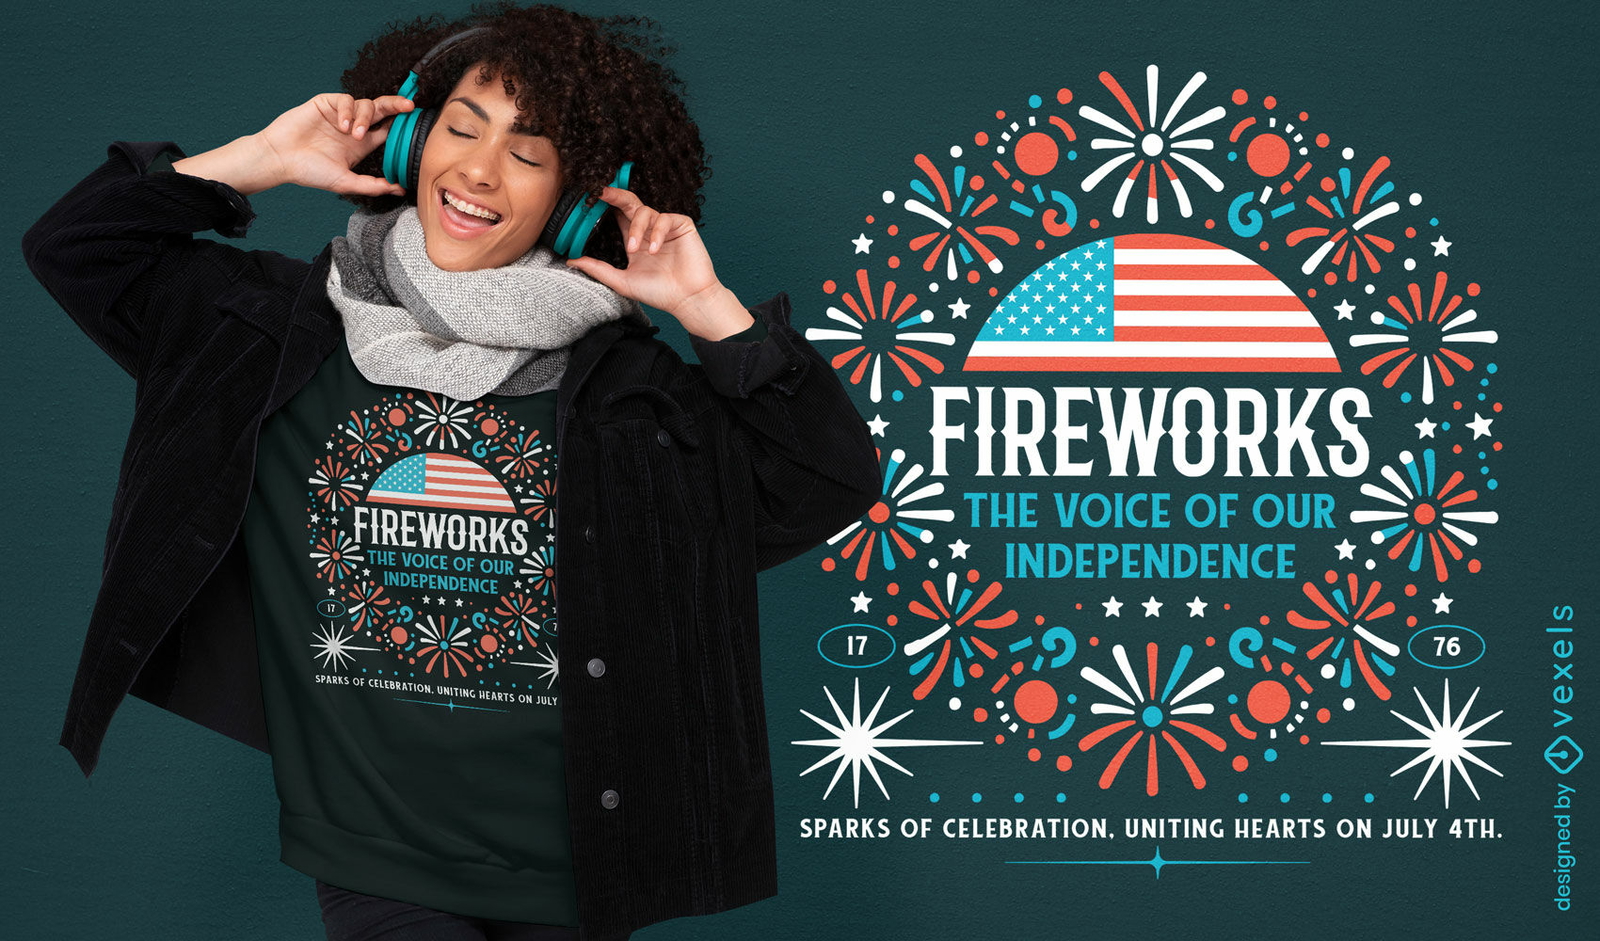
Design de camiseta de independ?ncia de fogos de artif?cio
Escolha uma pasta
Todos os favoritos
Criar novo
Salvar
Design de camiseta de independ?ncia de fogos de artif?cio
Gerado por IA, selecionado por nossos designers.
para Merch
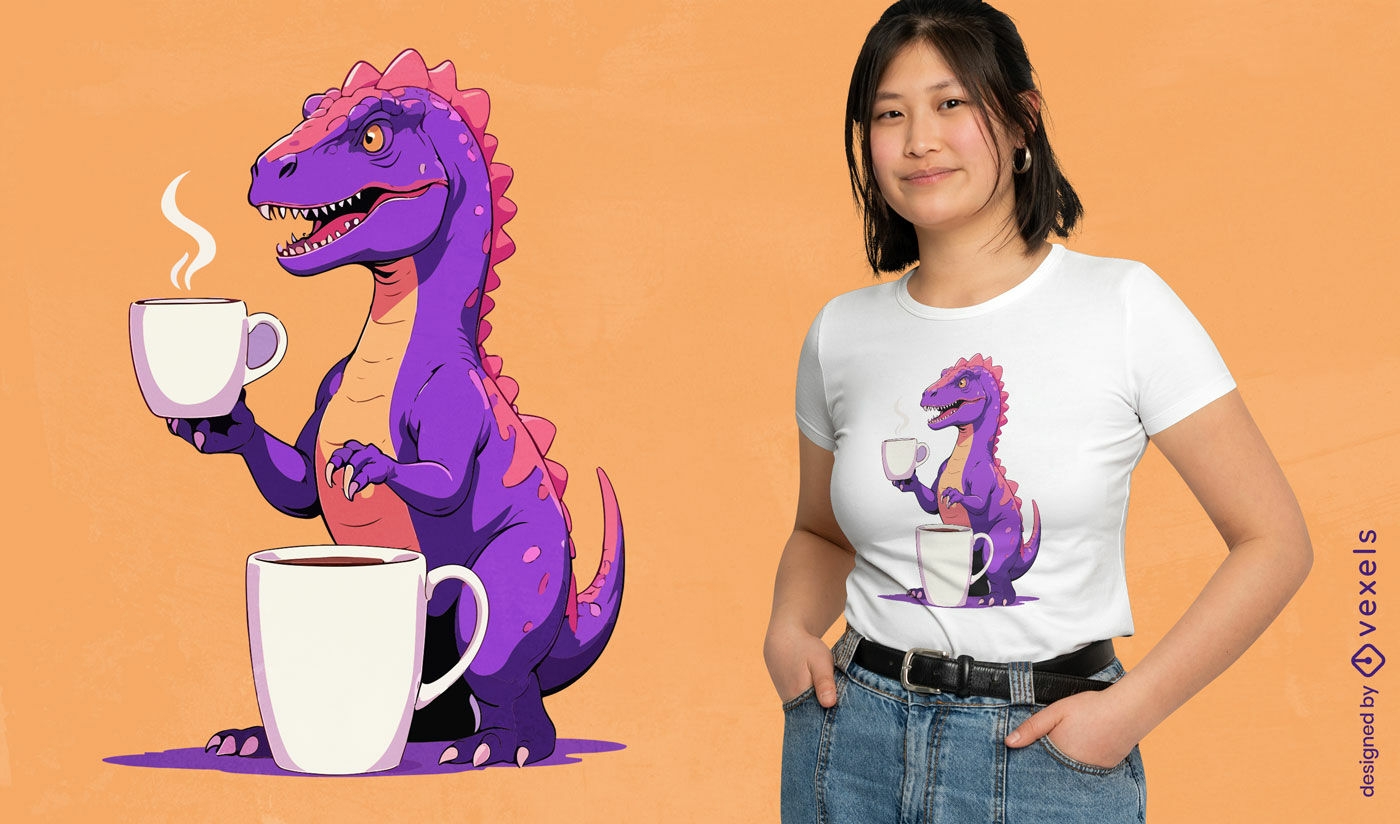
Design de camiseta com caf? dinossauro
Escolha uma pasta
Todos os favoritos
Criar novo
Salvar
Design de camiseta com caf? dinossauro
Pronto para imprimir
para Merch
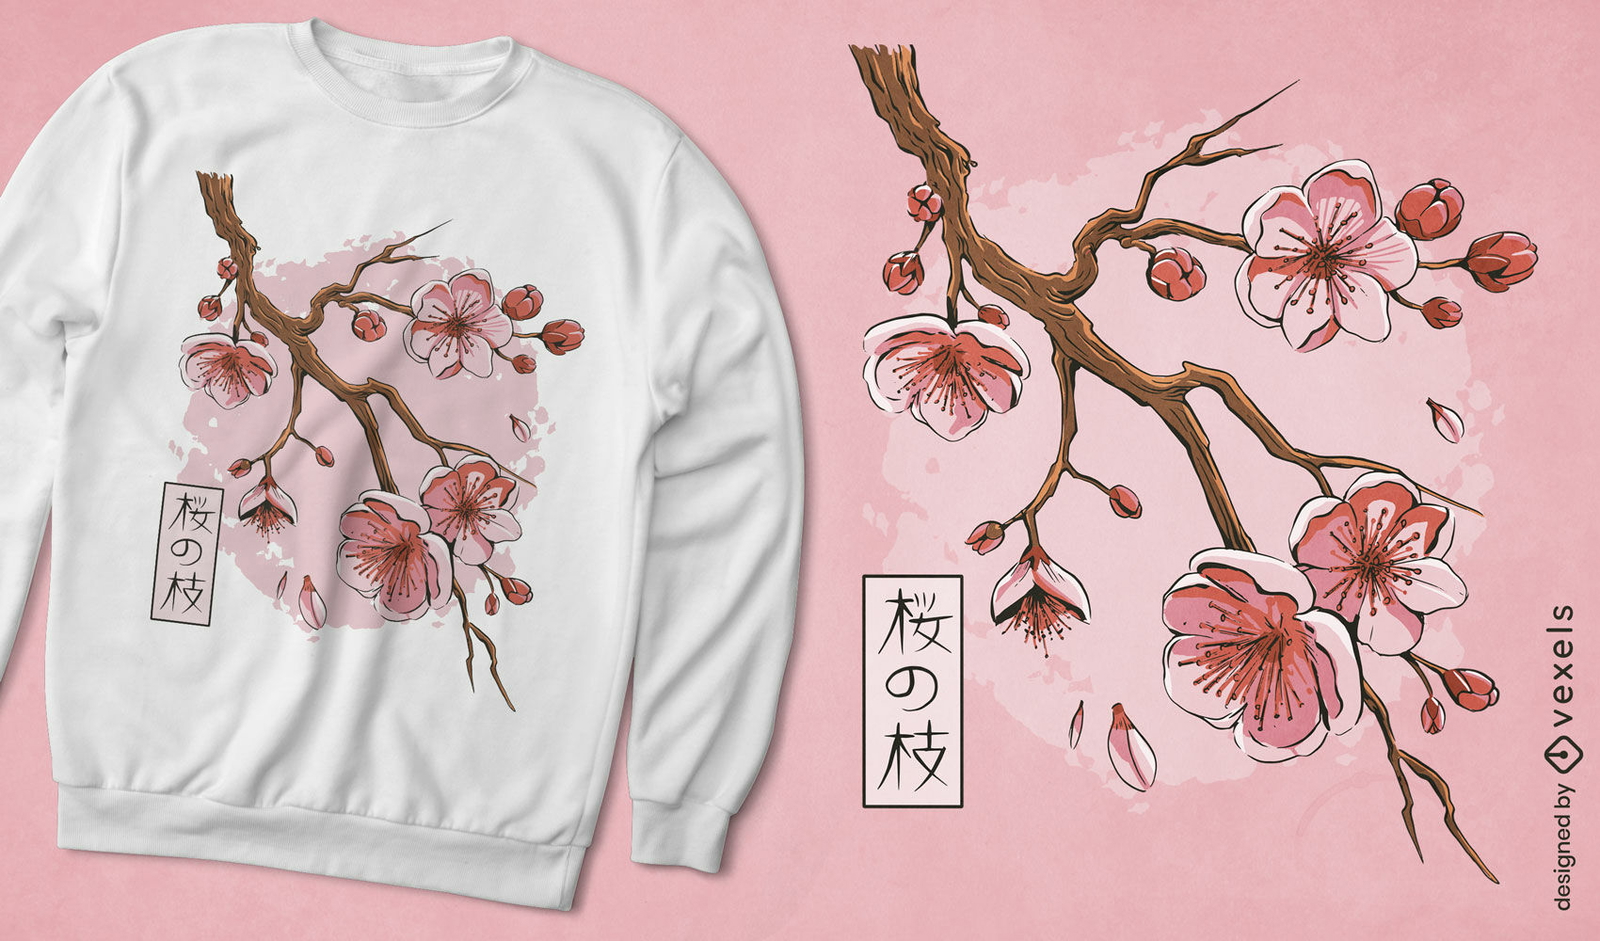
Sakura flor árvore design de camiseta japonesa
Escolha uma pasta
Todos os favoritos
Criar novo
Salvar
Sakura flor árvore design de camiseta japonesa
texto editável
Pronto para imprimir
para Merch
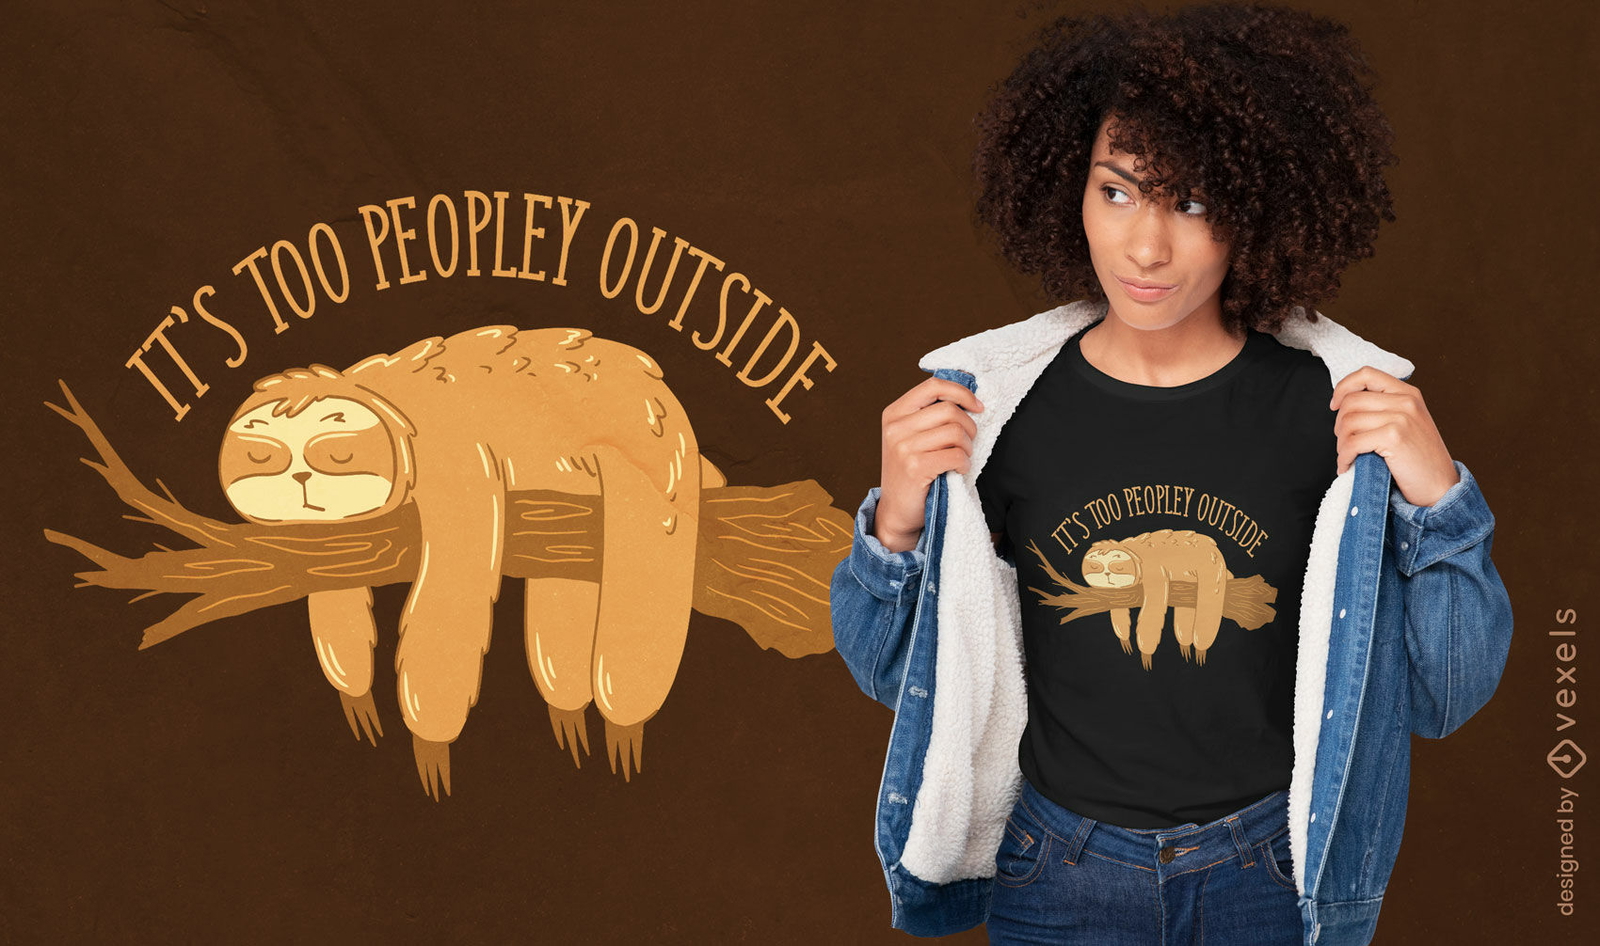
Design de camiseta anti-preguiça social
Escolha uma pasta
Todos os favoritos
Criar novo
Salvar
Design de camiseta anti-preguiça social
Pronto para imprimir
para Merch
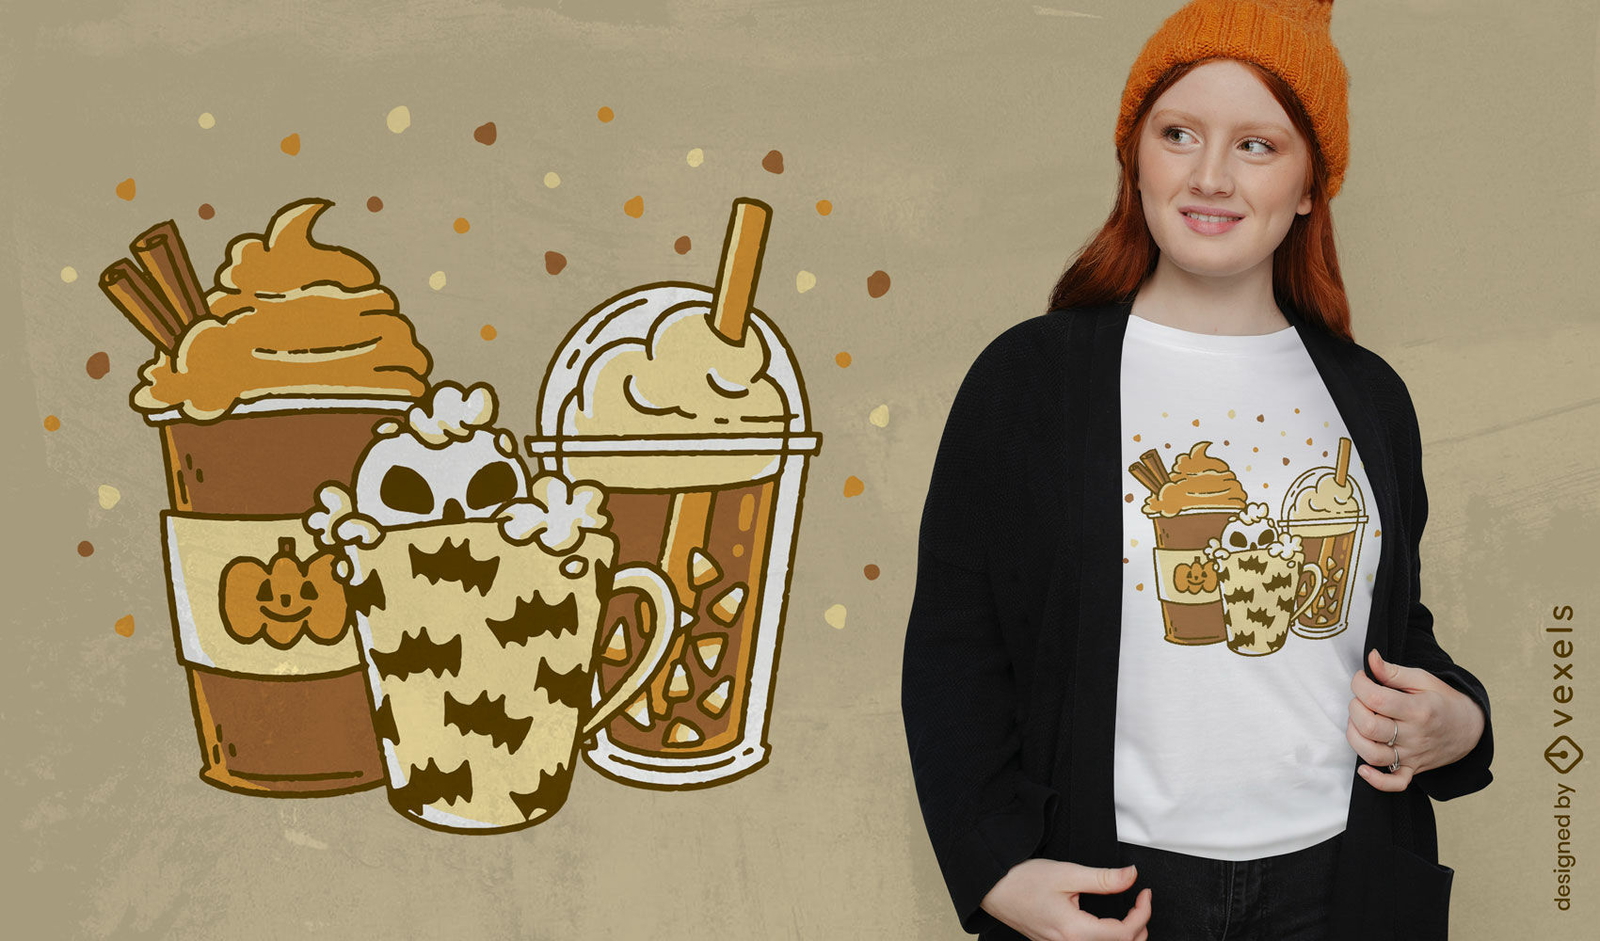
Design de camiseta de cafés assustadores
Escolha uma pasta
Todos os favoritos
Criar novo
Salvar
Design de camiseta de cafés assustadores
texto editável
Pronto para imprimir
para Merch
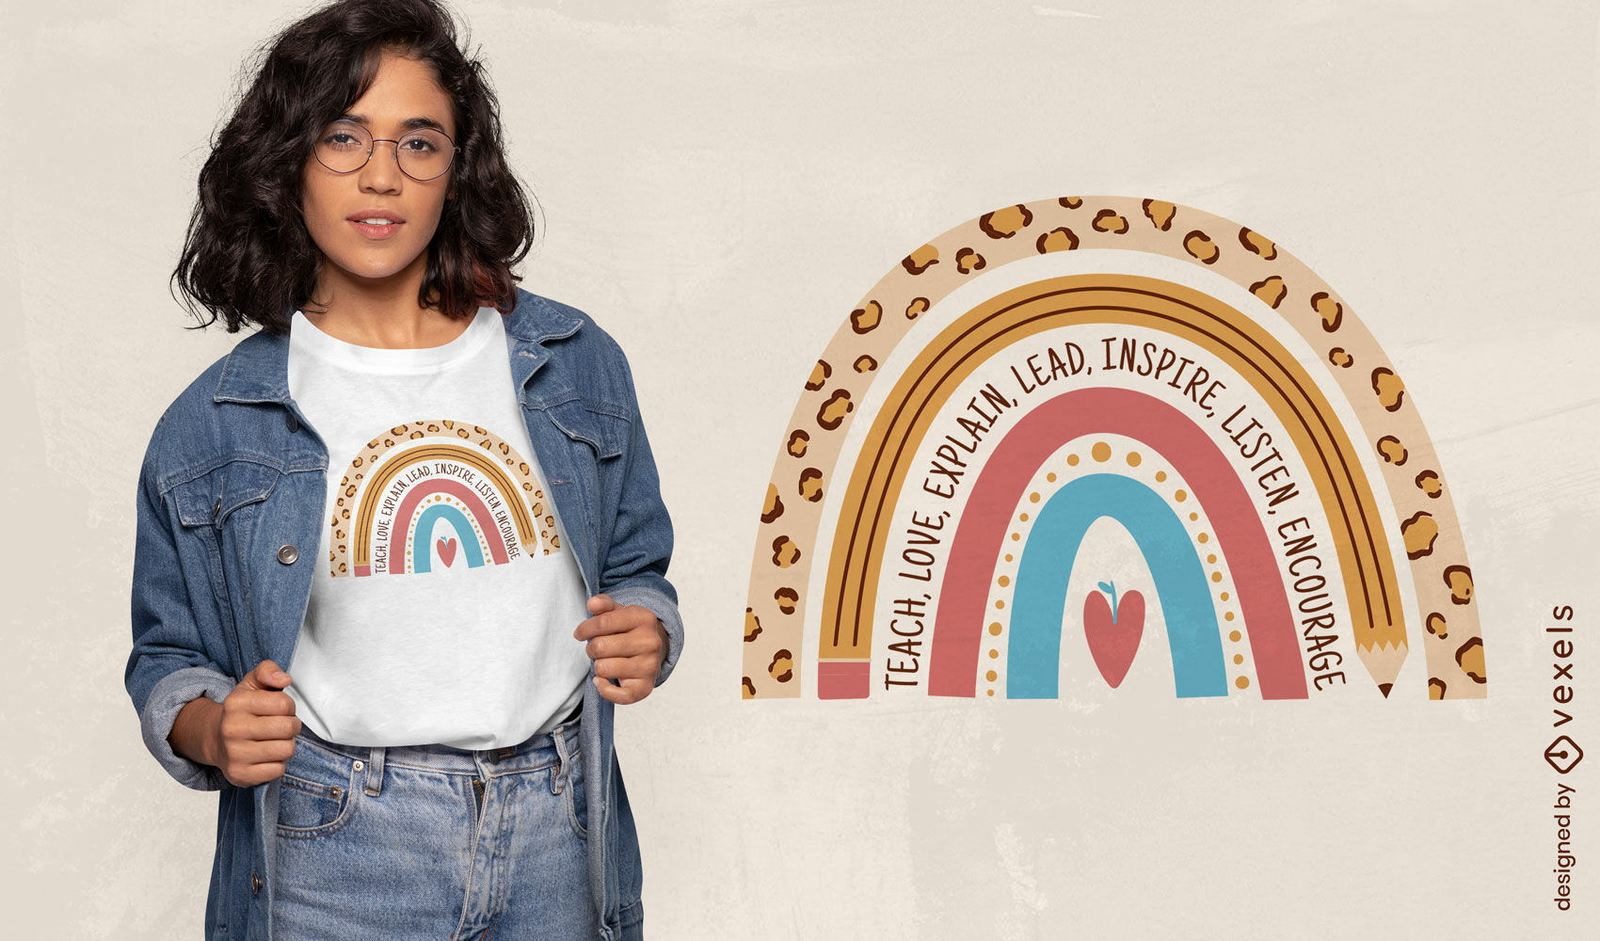
Design colorido de camiseta de educação do arco-íris
Escolha uma pasta
Todos os favoritos
Criar novo
Salvar
Design colorido de camiseta de educação do arco-íris
Pronto para imprimir
para Merch
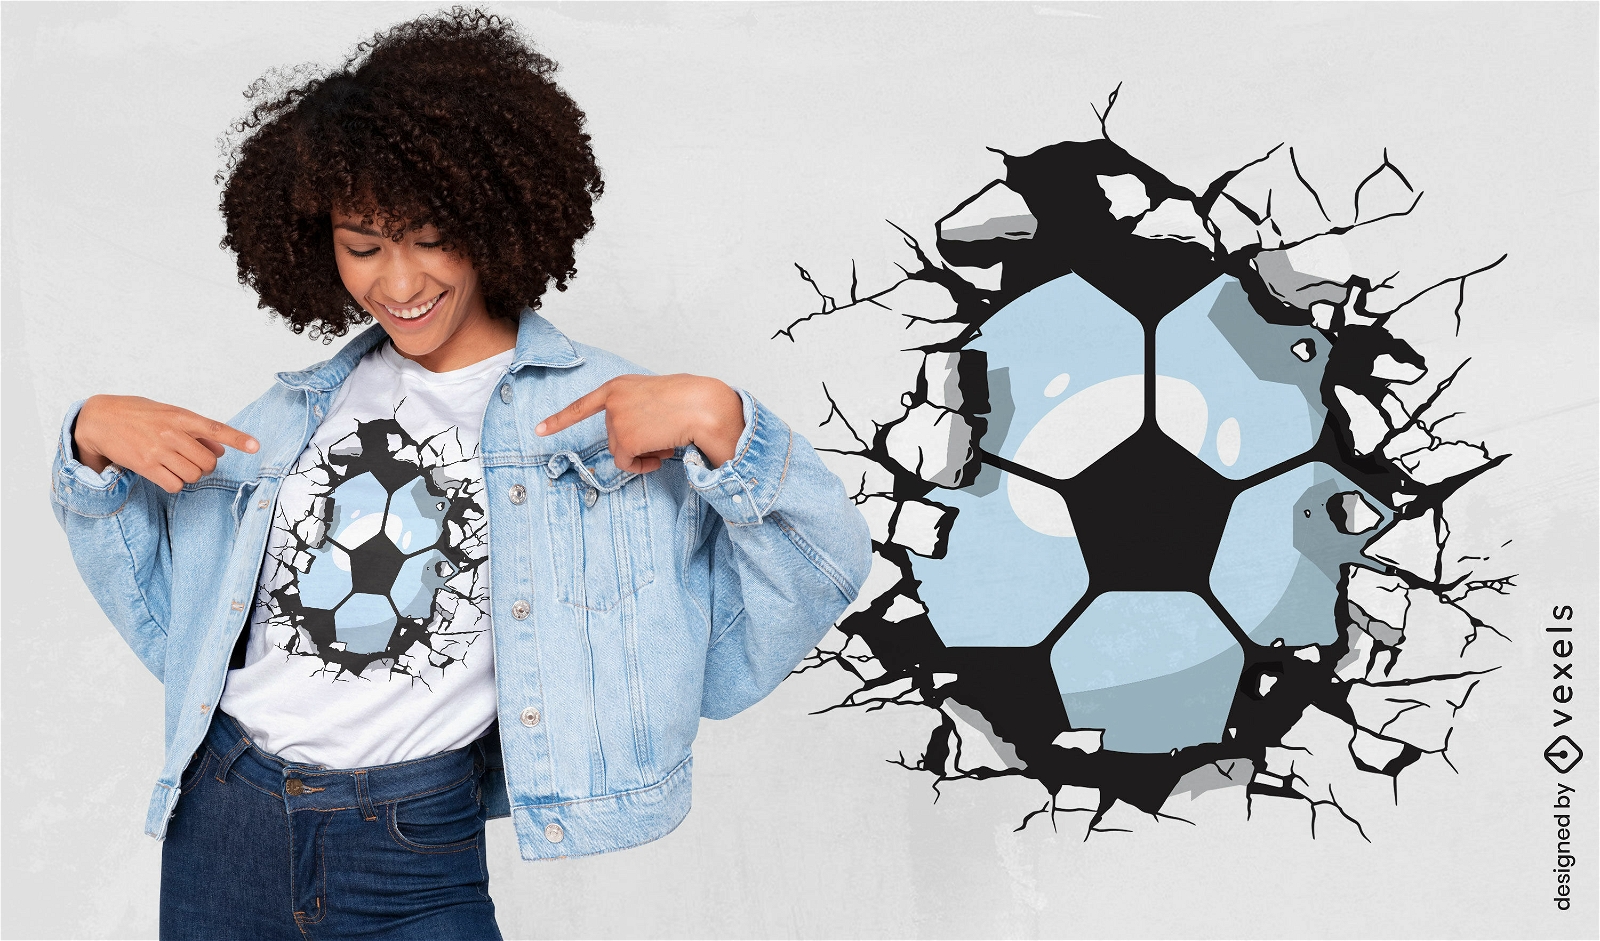
Design de camiseta de parede quebrando bola de futebol
Escolha uma pasta
Todos os favoritos
Criar novo
Salvar
Design de camiseta de parede quebrando bola de futebol
Pronto para imprimir
para Merch
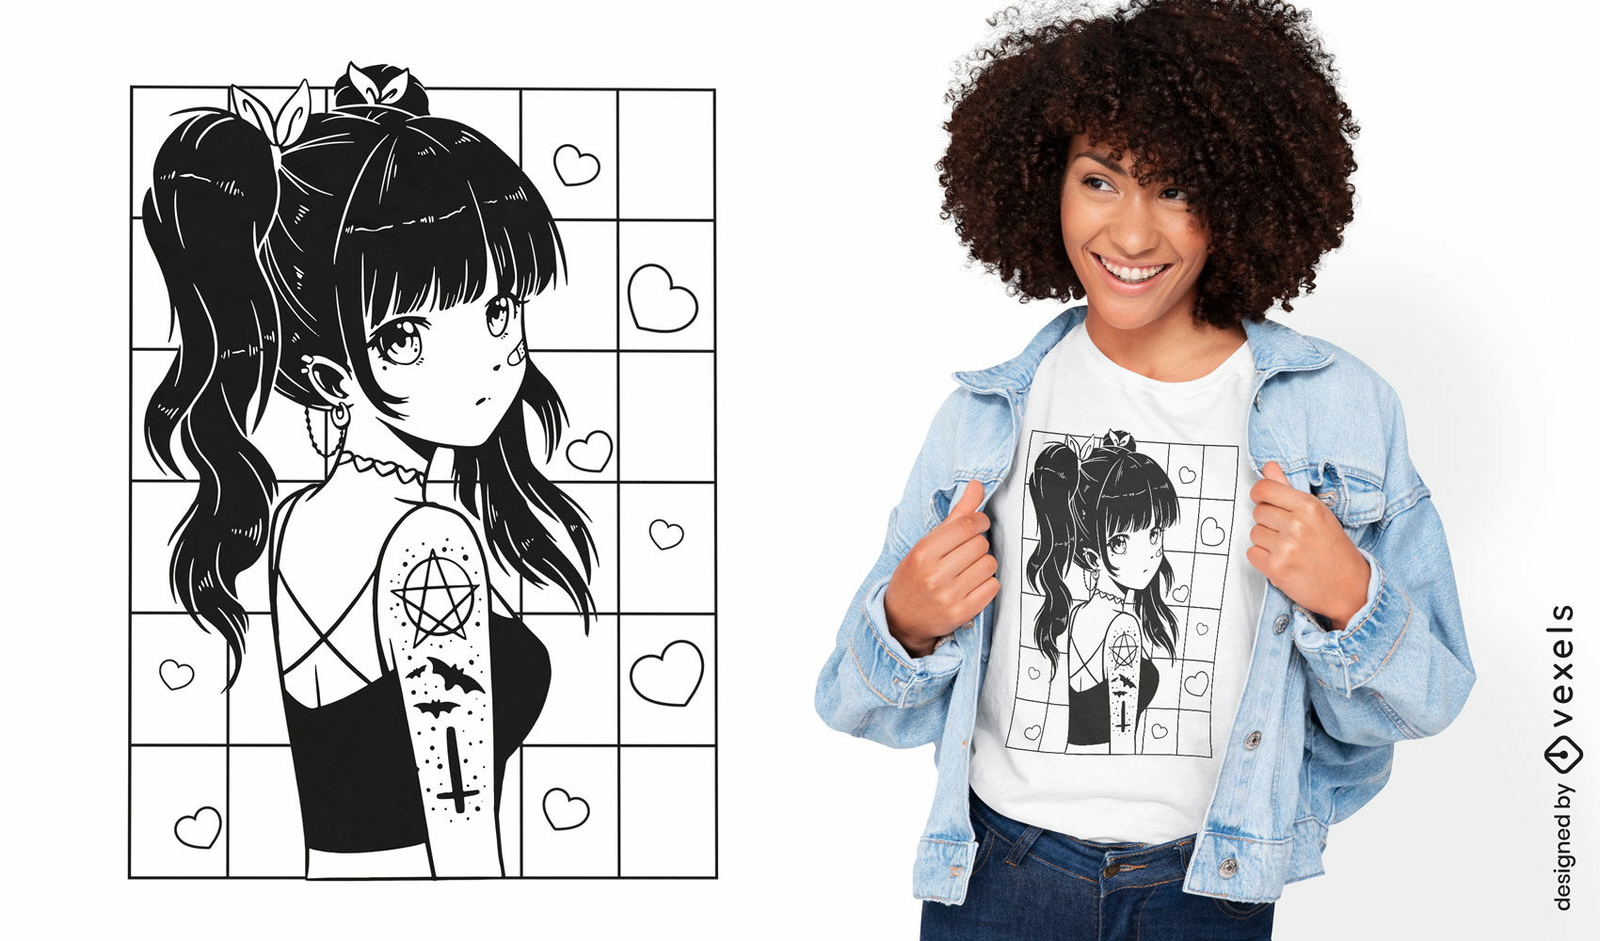
Design de camiseta de anime gótico bonito
Escolha uma pasta
Todos os favoritos
Criar novo
Salvar
Design de camiseta de anime gótico bonito
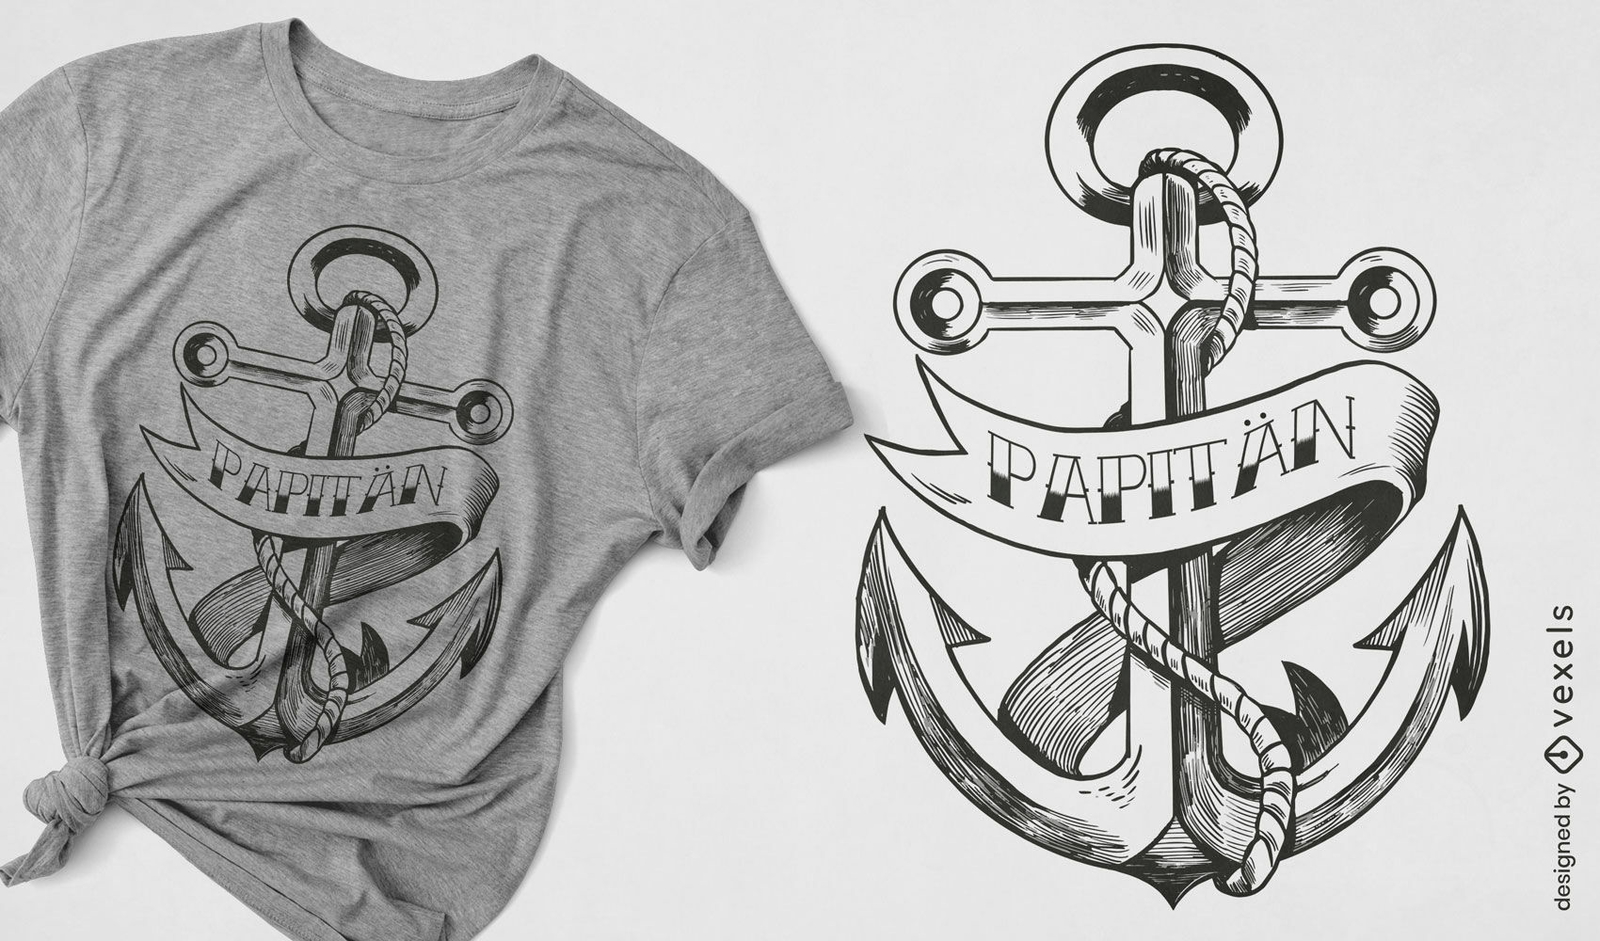
Conteúdo em alemão
Pronto para imprimir
para Merch
Âncora com design de camiseta náutica de corda
Escolha uma pasta
Todos os favoritos
Criar novo
Salvar
Âncora com design de camiseta náutica de corda
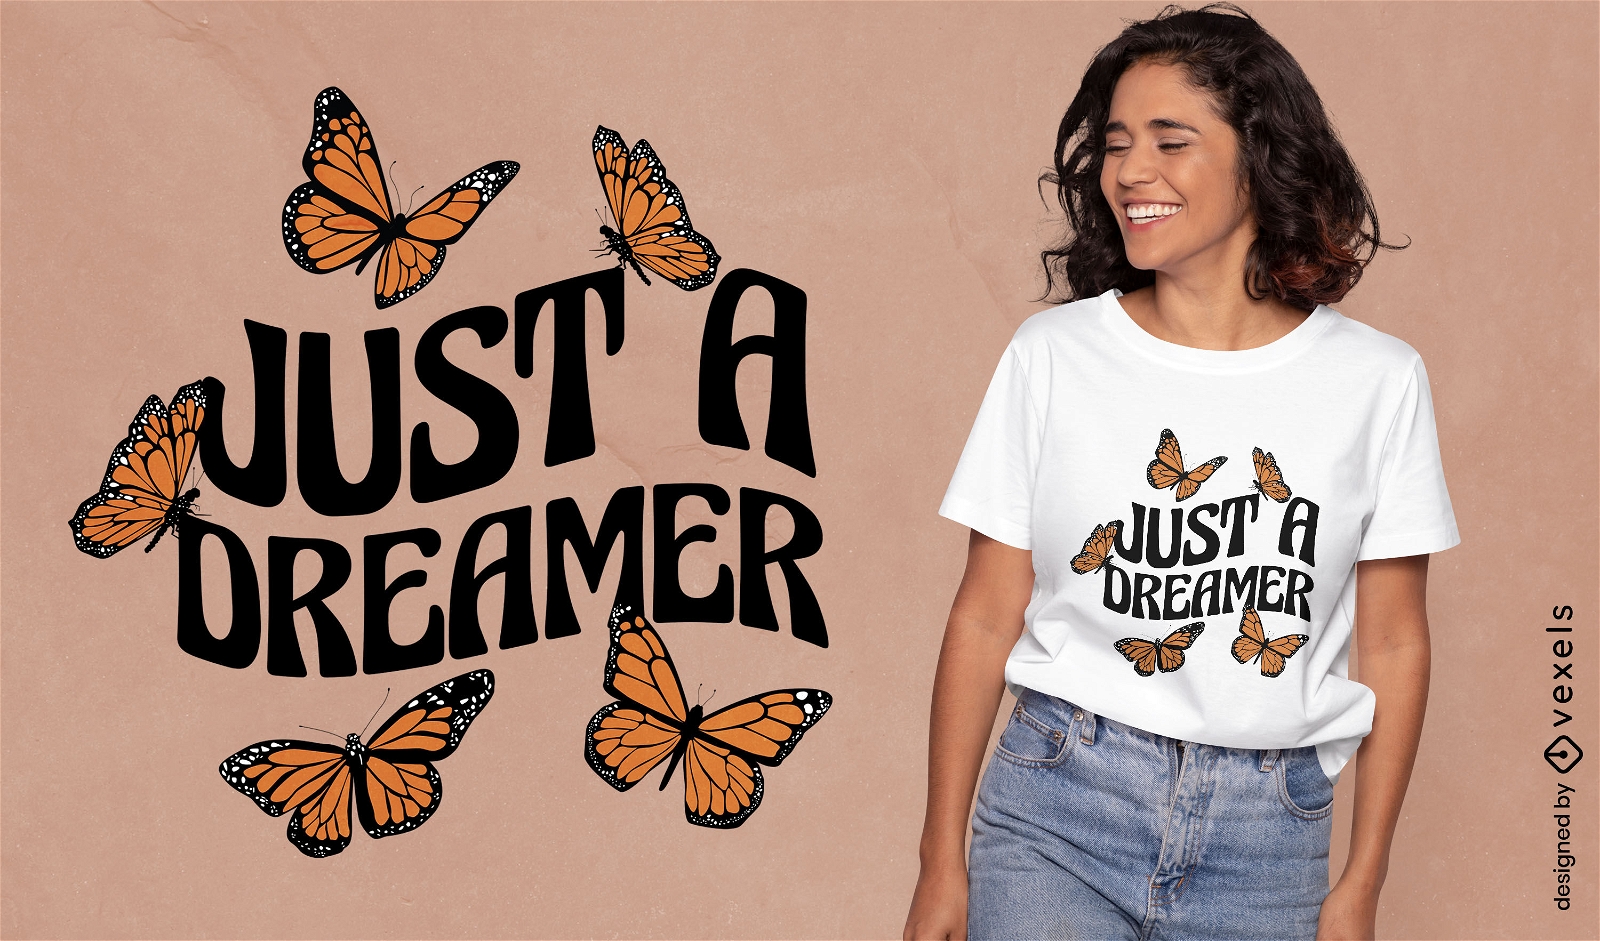
texto editável
Pronto para imprimir
para Merch
Apenas um design de camiseta com letras de borboletas sonhadoras
Escolha uma pasta
Todos os favoritos
Criar novo
Salvar
Apenas um design de camiseta com letras de borboletas sonhadoras
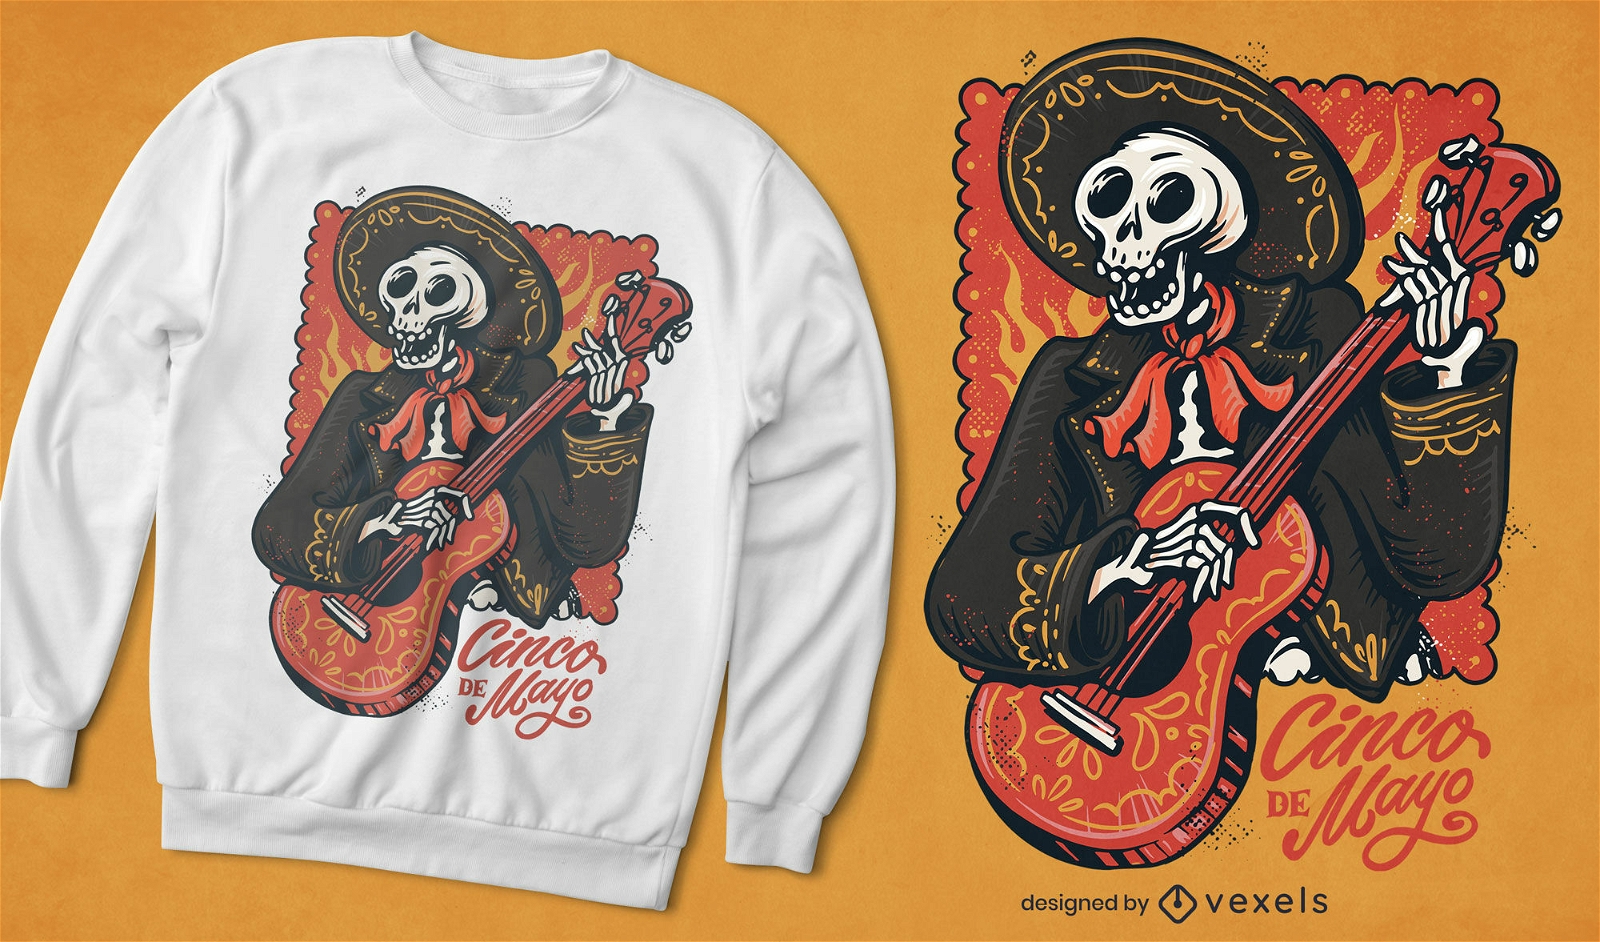
Pronto para imprimir
para Merch
Design de camiseta de esqueleto Mariachi Cinco de Mayo
Escolha uma pasta
Todos os favoritos
Criar novo
Salvar
Design de camiseta de esqueleto Mariachi Cinco de Mayo
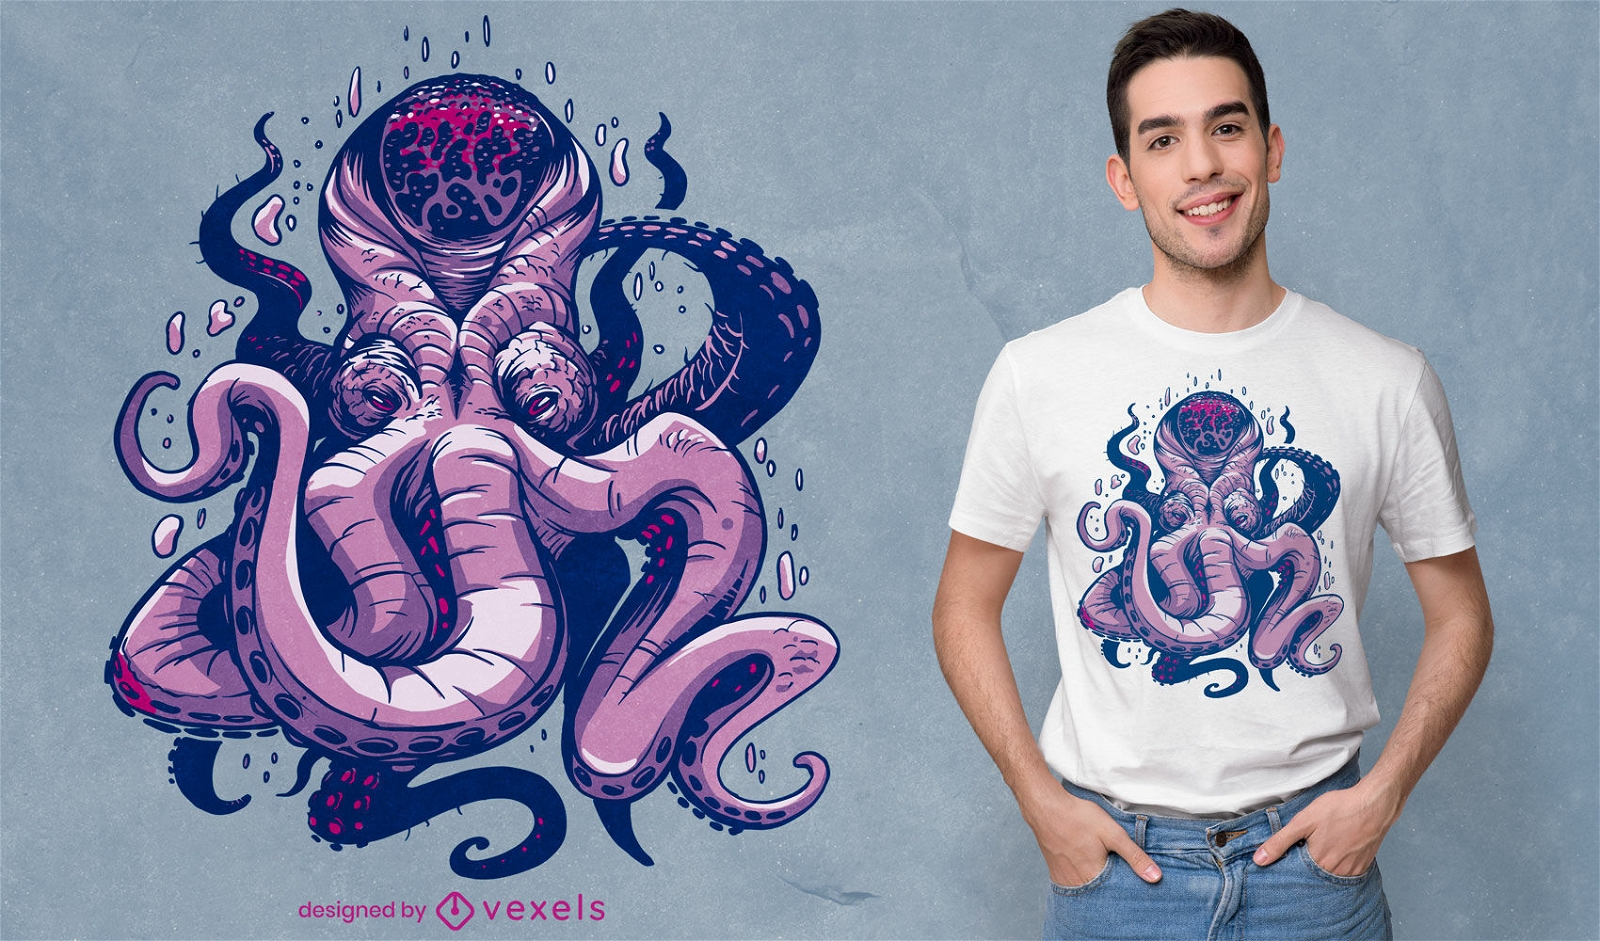
Pronto para imprimir
para Merch
Design de camiseta roxa kraken
Escolha uma pasta
Todos os favoritos
Criar novo
Salvar
Design de camiseta roxa kraken
Pronto para imprimir
para Merch
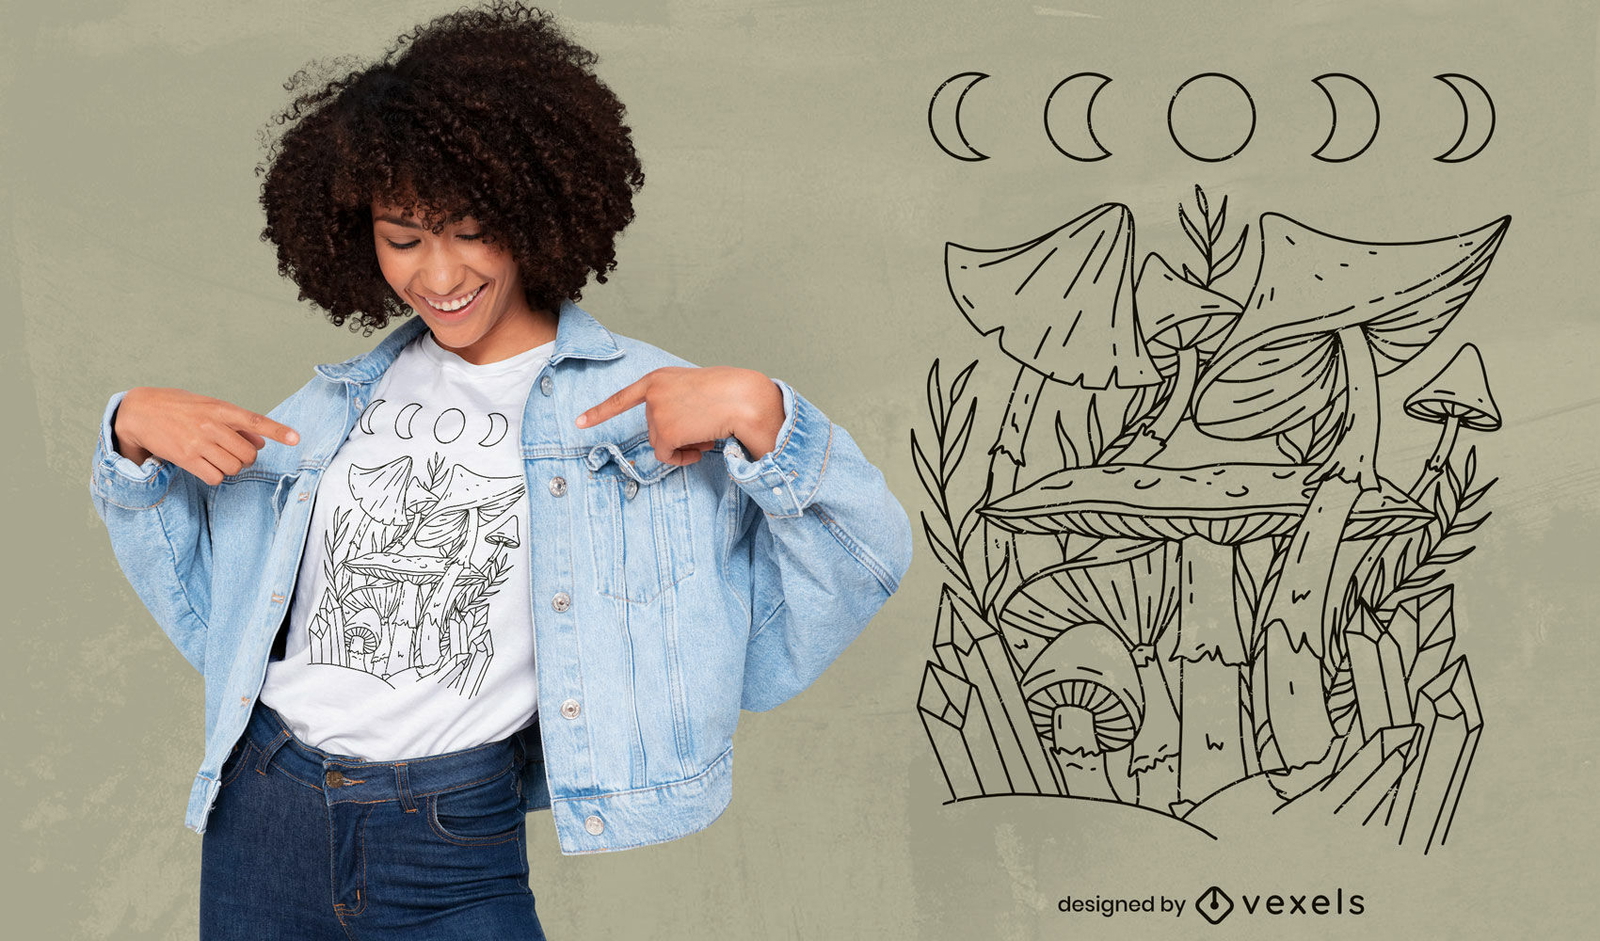
Design de camisetas com cristais de cogumelo esotérico
Escolha uma pasta
Todos os favoritos
Criar novo
Salvar
Design de camisetas com cristais de cogumelo esotérico
Pronto para imprimir
para Merch
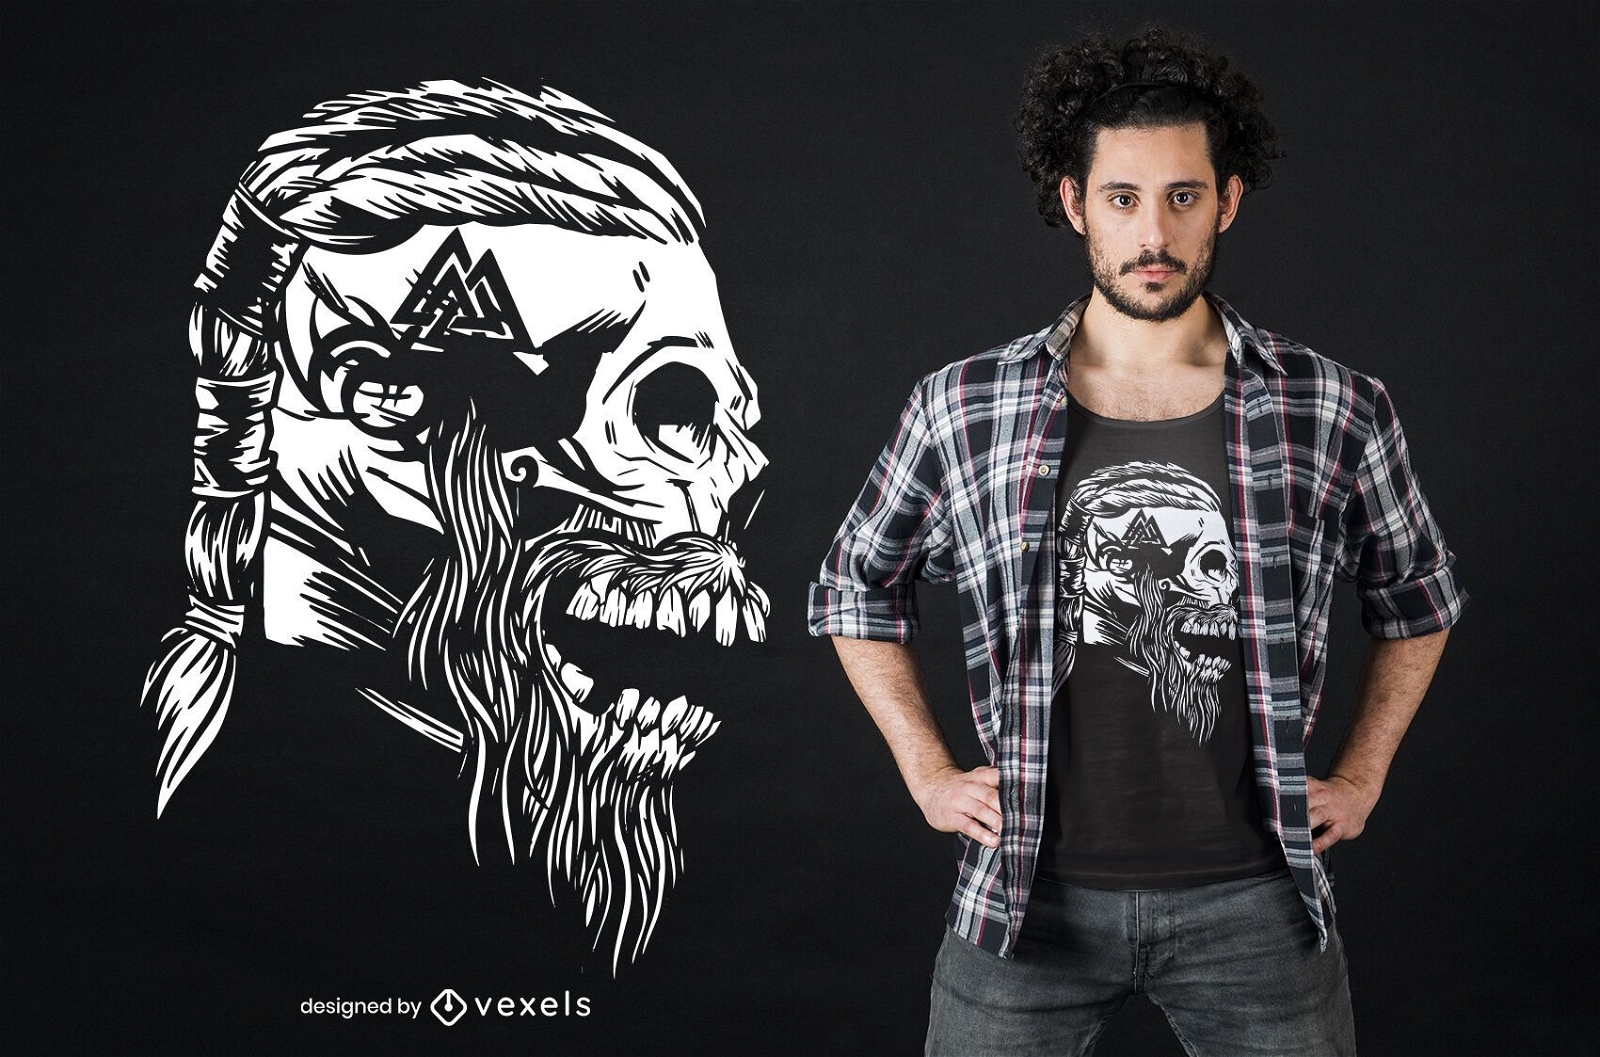
Design de camiseta com caveira Viking
Escolha uma pasta
Todos os favoritos
Criar novo
Salvar
Design de camiseta com caveira Viking
Pronto para imprimir
para Merch
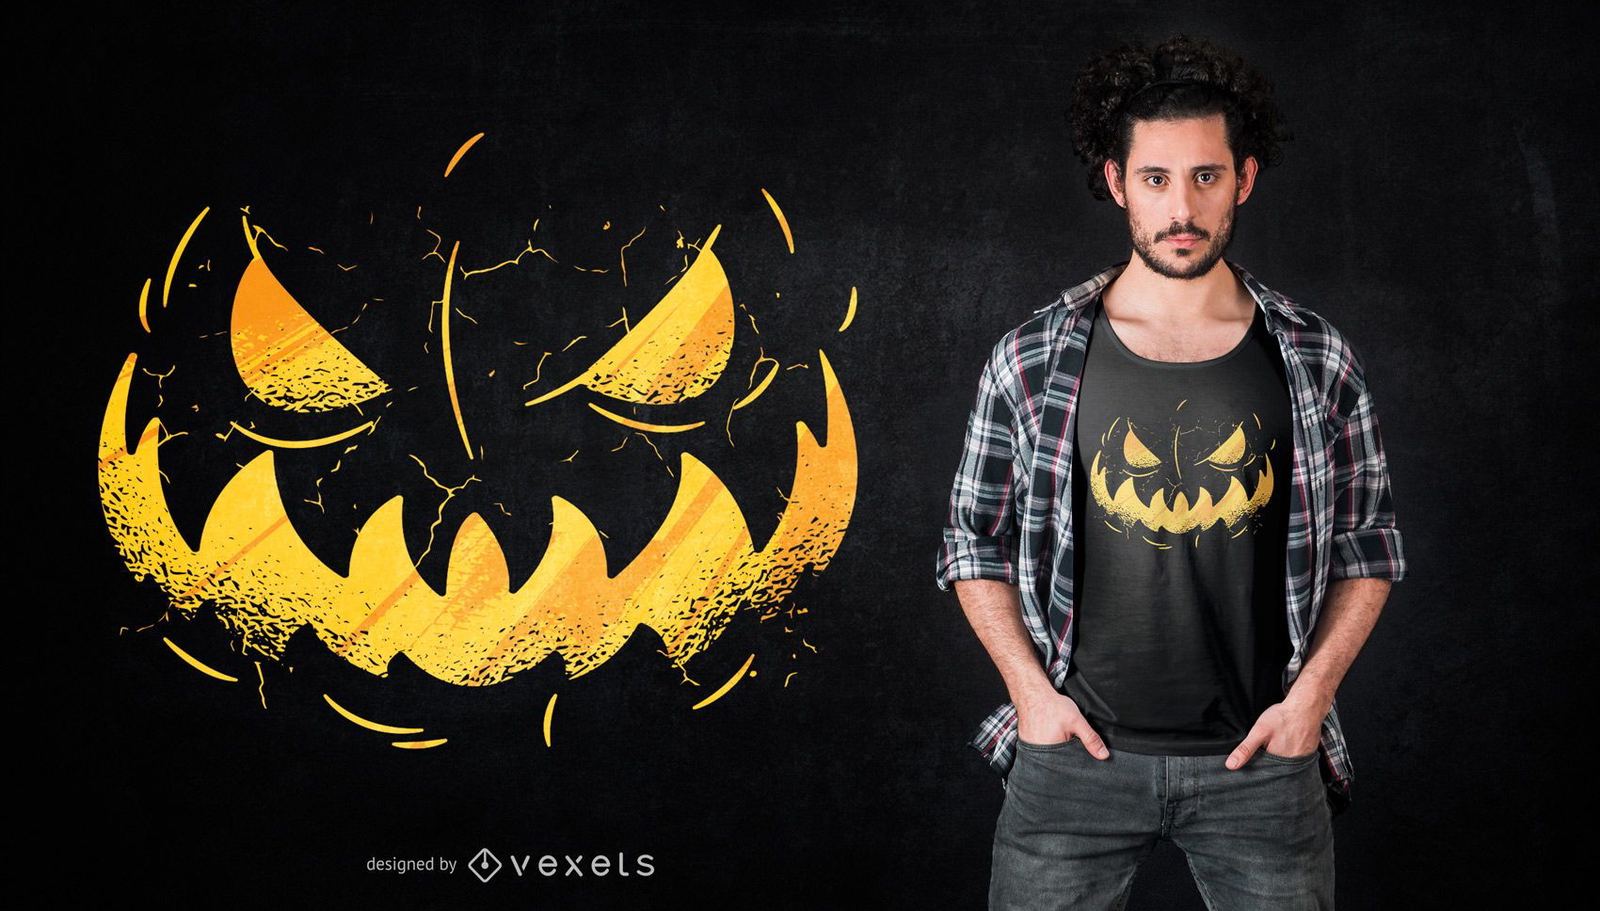
Design da camiseta do Jack o'Lantern Face
Escolha uma pasta
Todos os favoritos
Criar novo
Salvar
Design da camiseta do Jack o'Lantern Face
Pronto para imprimir
para Merch
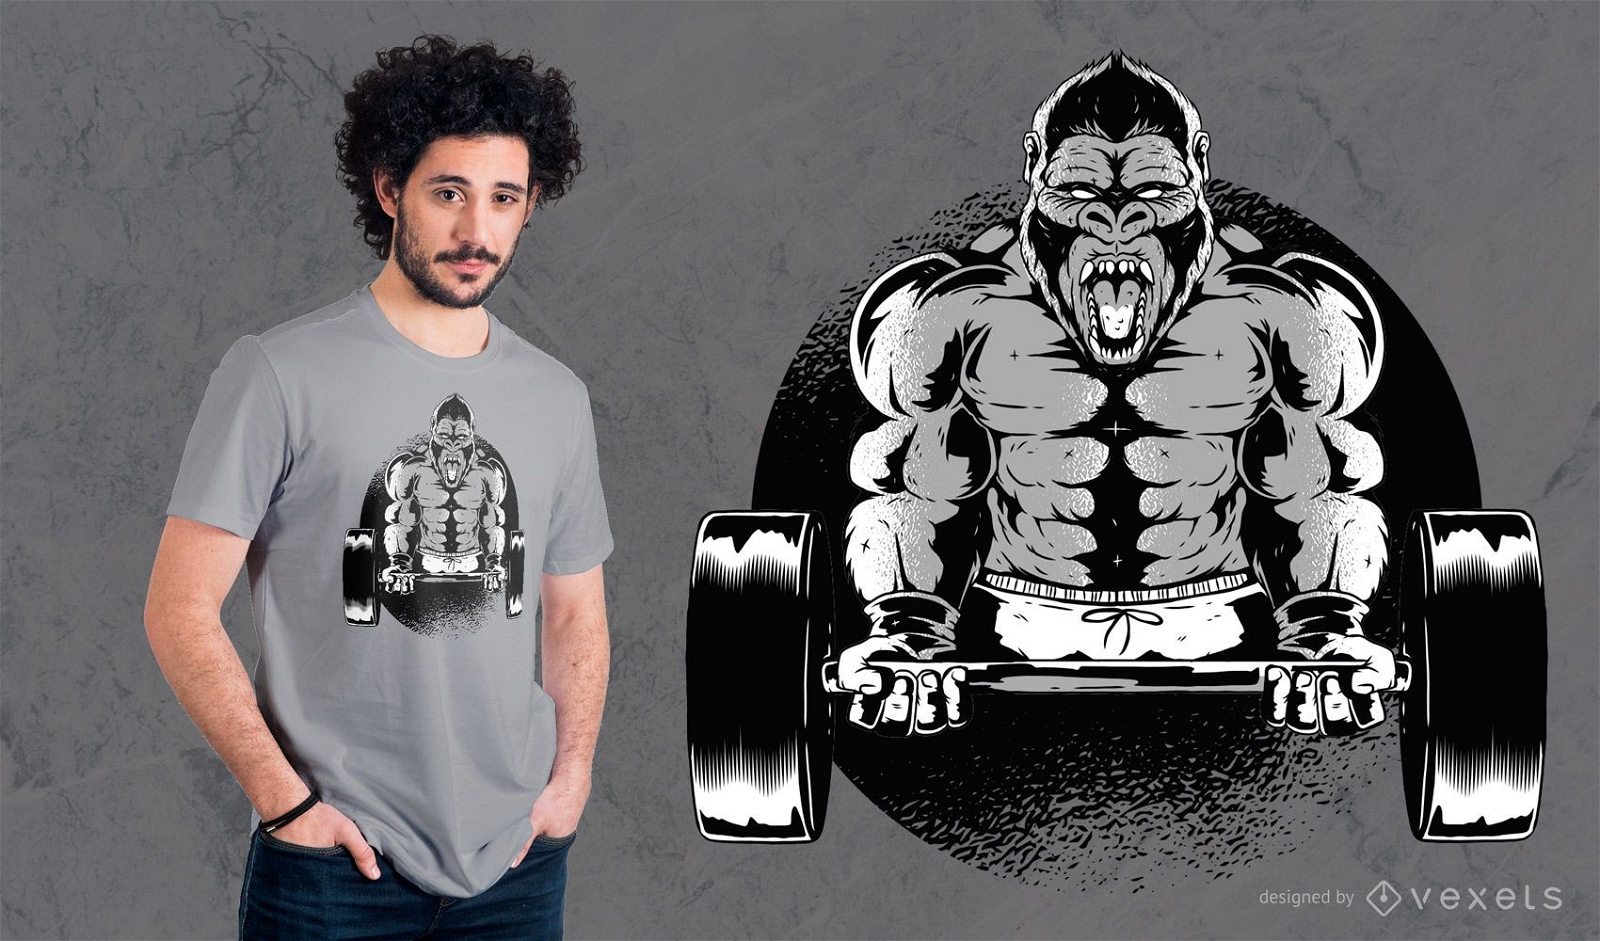
Design de camiseta com halteres gorila
Escolha uma pasta
Todos os favoritos
Criar novo
Salvar
Design de camiseta com halteres gorila
Gerado por IA, selecionado por nossos designers.
para Merch
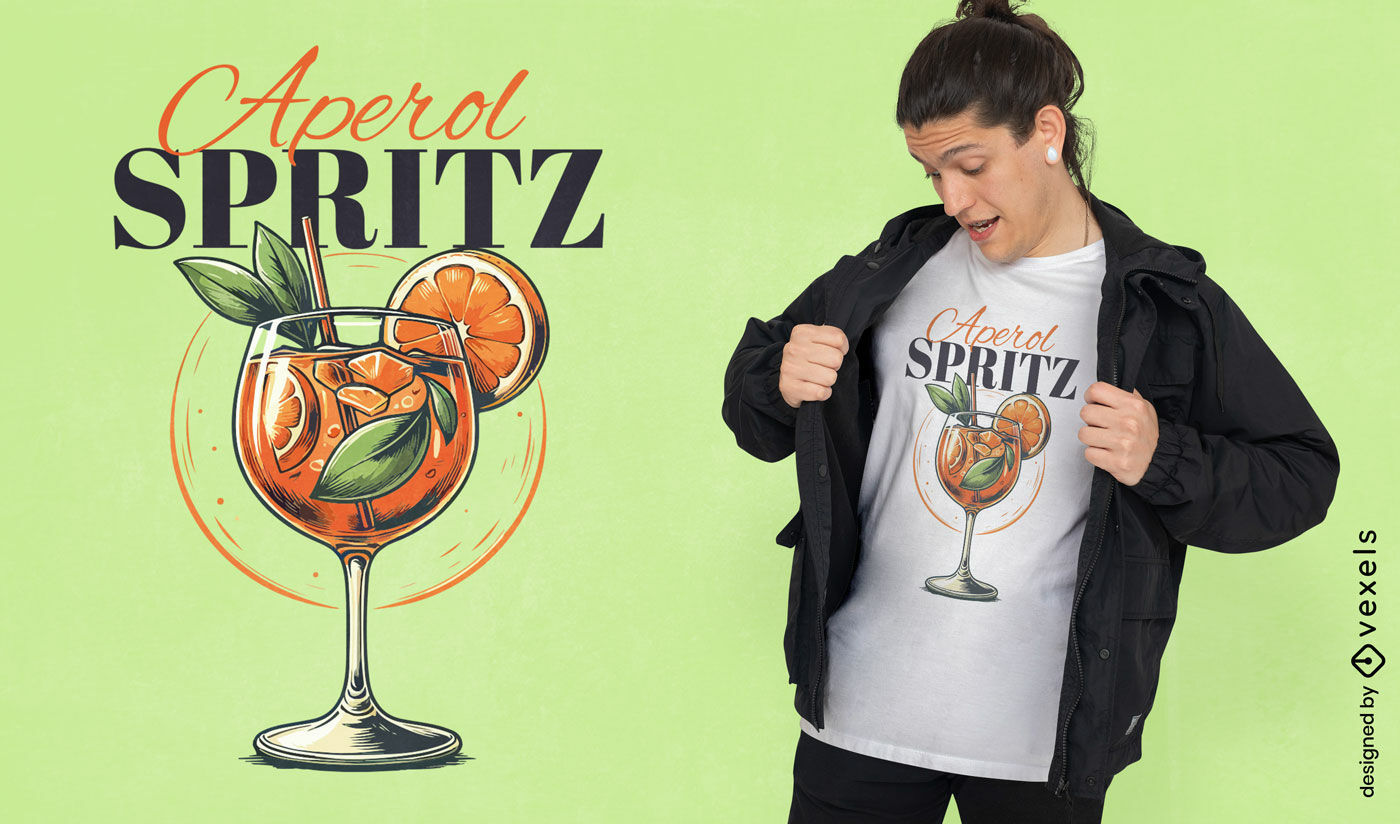
Design de camiseta com coquetel Aperol Spritz
Escolha uma pasta
Todos os favoritos
Criar novo
Salvar
Design de camiseta com coquetel Aperol Spritz
texto editável
Pronto para imprimir
para Merch
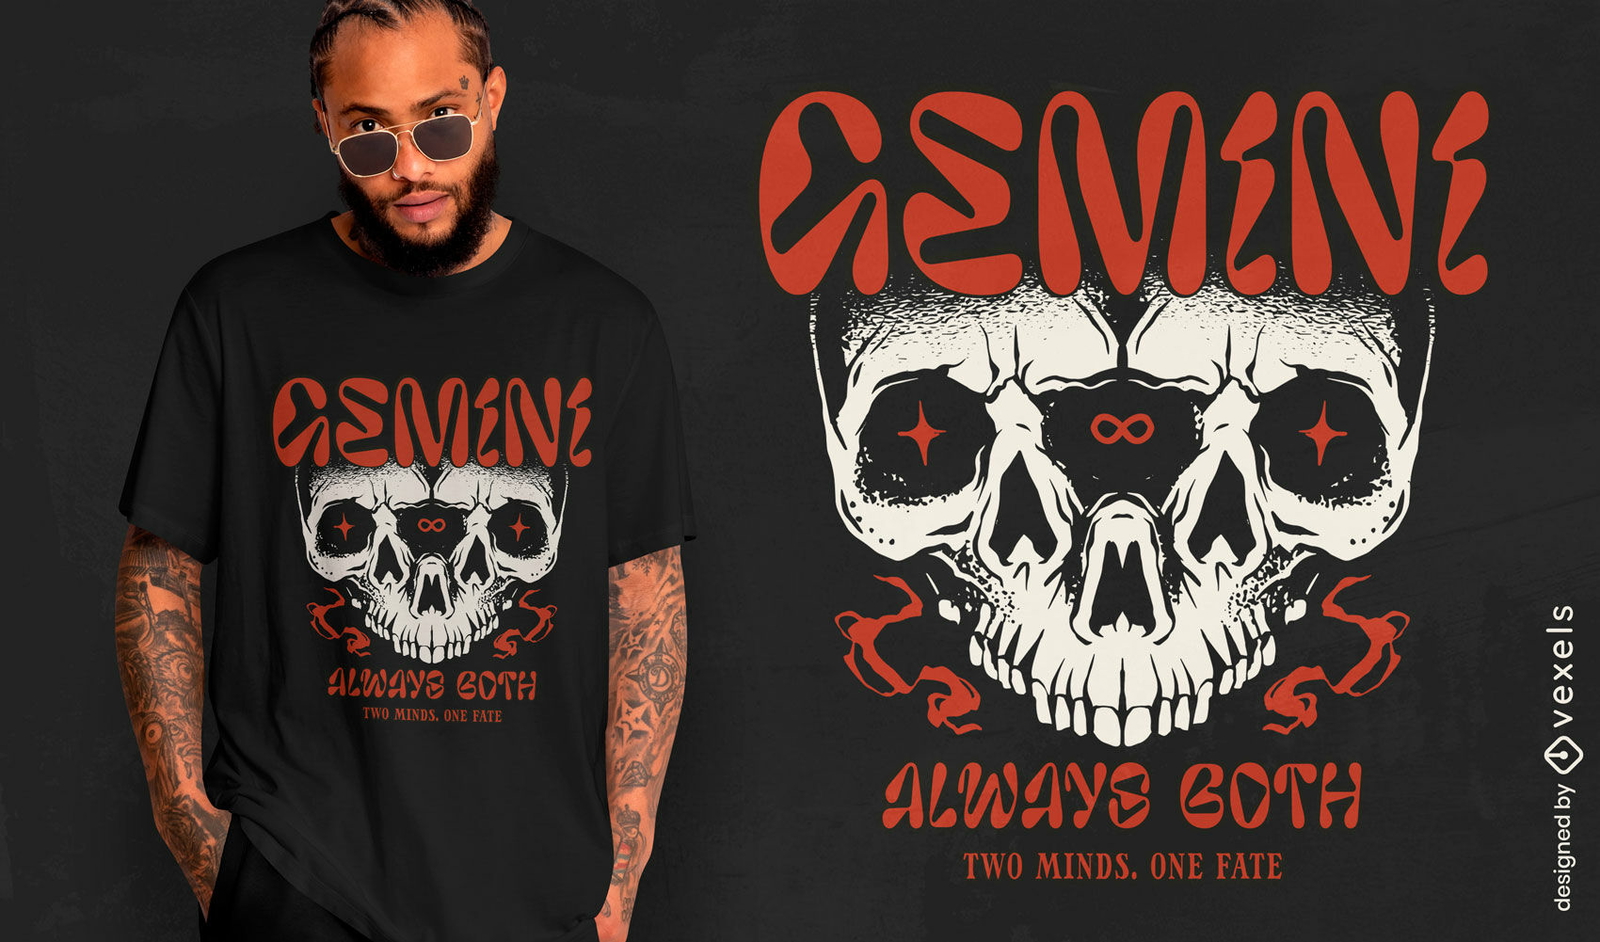
Design ousado de camiseta com caveira de gêmeos
Escolha uma pasta
Todos os favoritos
Criar novo
Salvar
Design ousado de camiseta com caveira de gêmeos
texto editável
Pronto para imprimir
para Merch
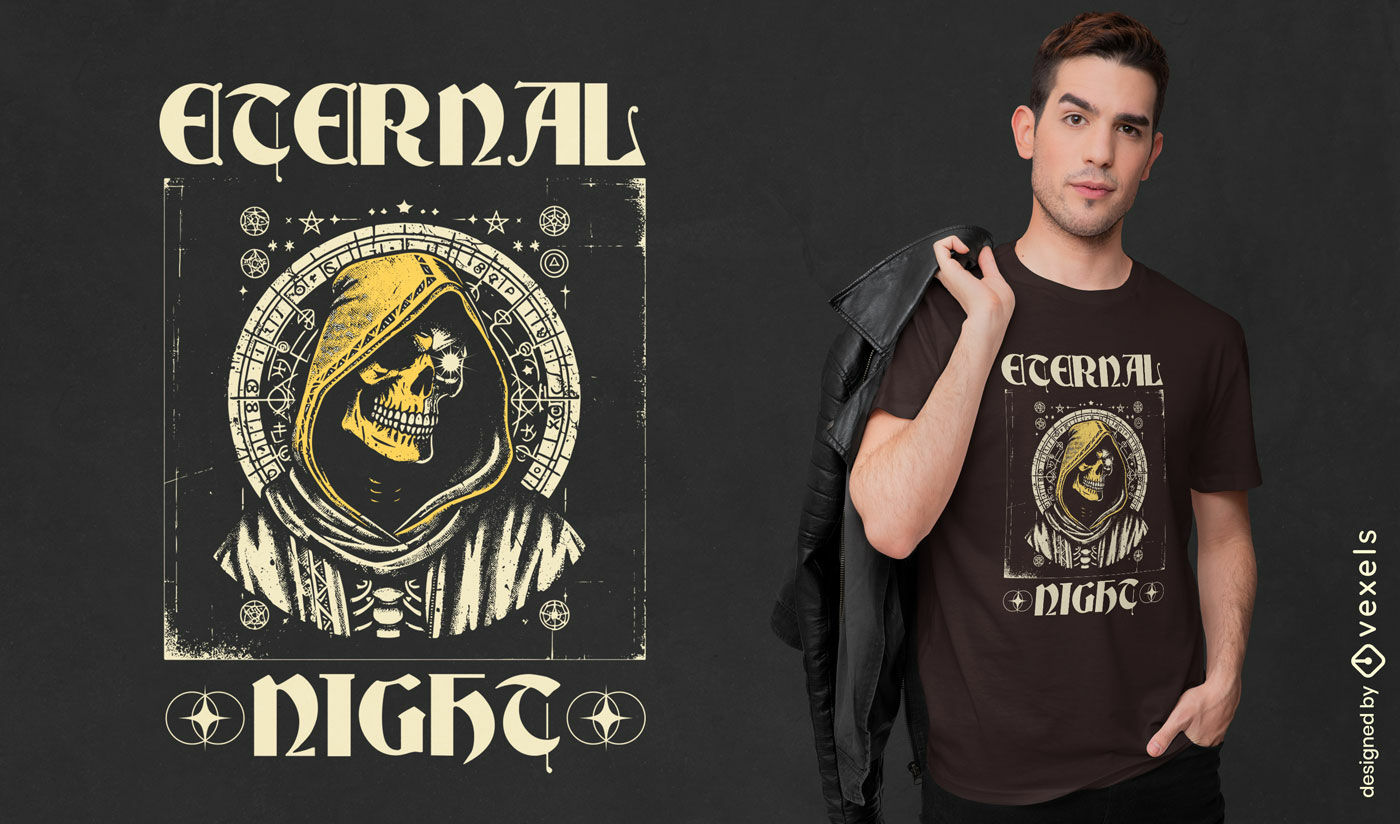
Design de camiseta gótica com caveira de noite eterna
Escolha uma pasta
Todos os favoritos
Criar novo
Salvar
Design de camiseta gótica com caveira de noite eterna
texto editável
Pronto para imprimir
para Merch
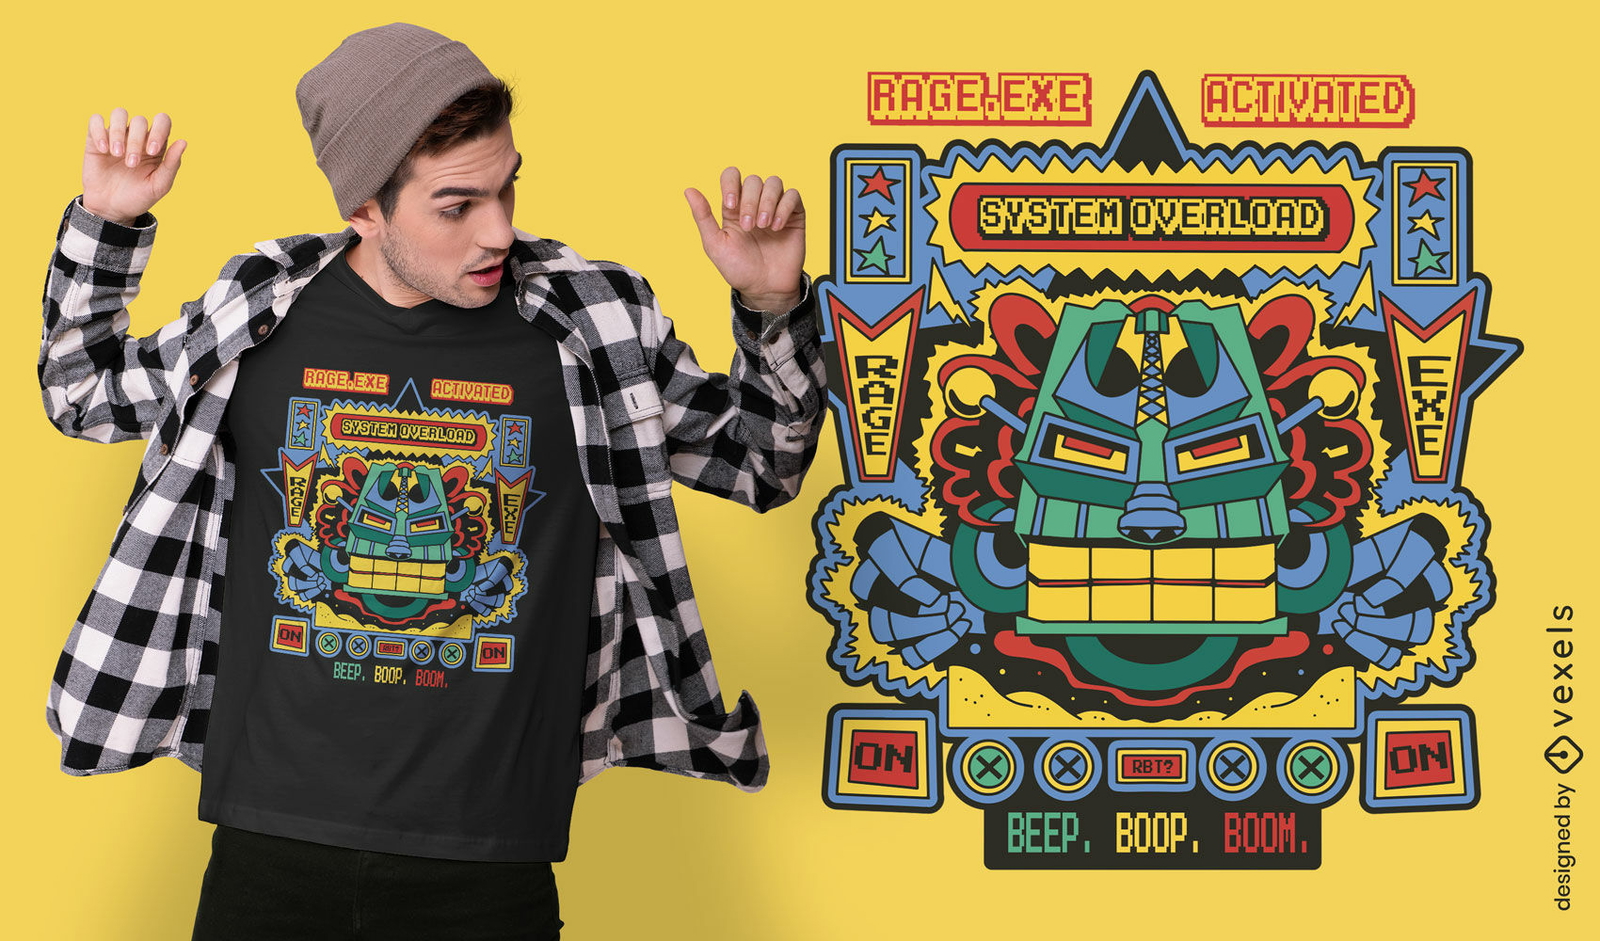
Design de camiseta com raiva de robô retrô
Escolha uma pasta
Todos os favoritos
Criar novo
Salvar
Design de camiseta com raiva de robô retrô
Gerado por IA, selecionado por nossos designers.
para Merch
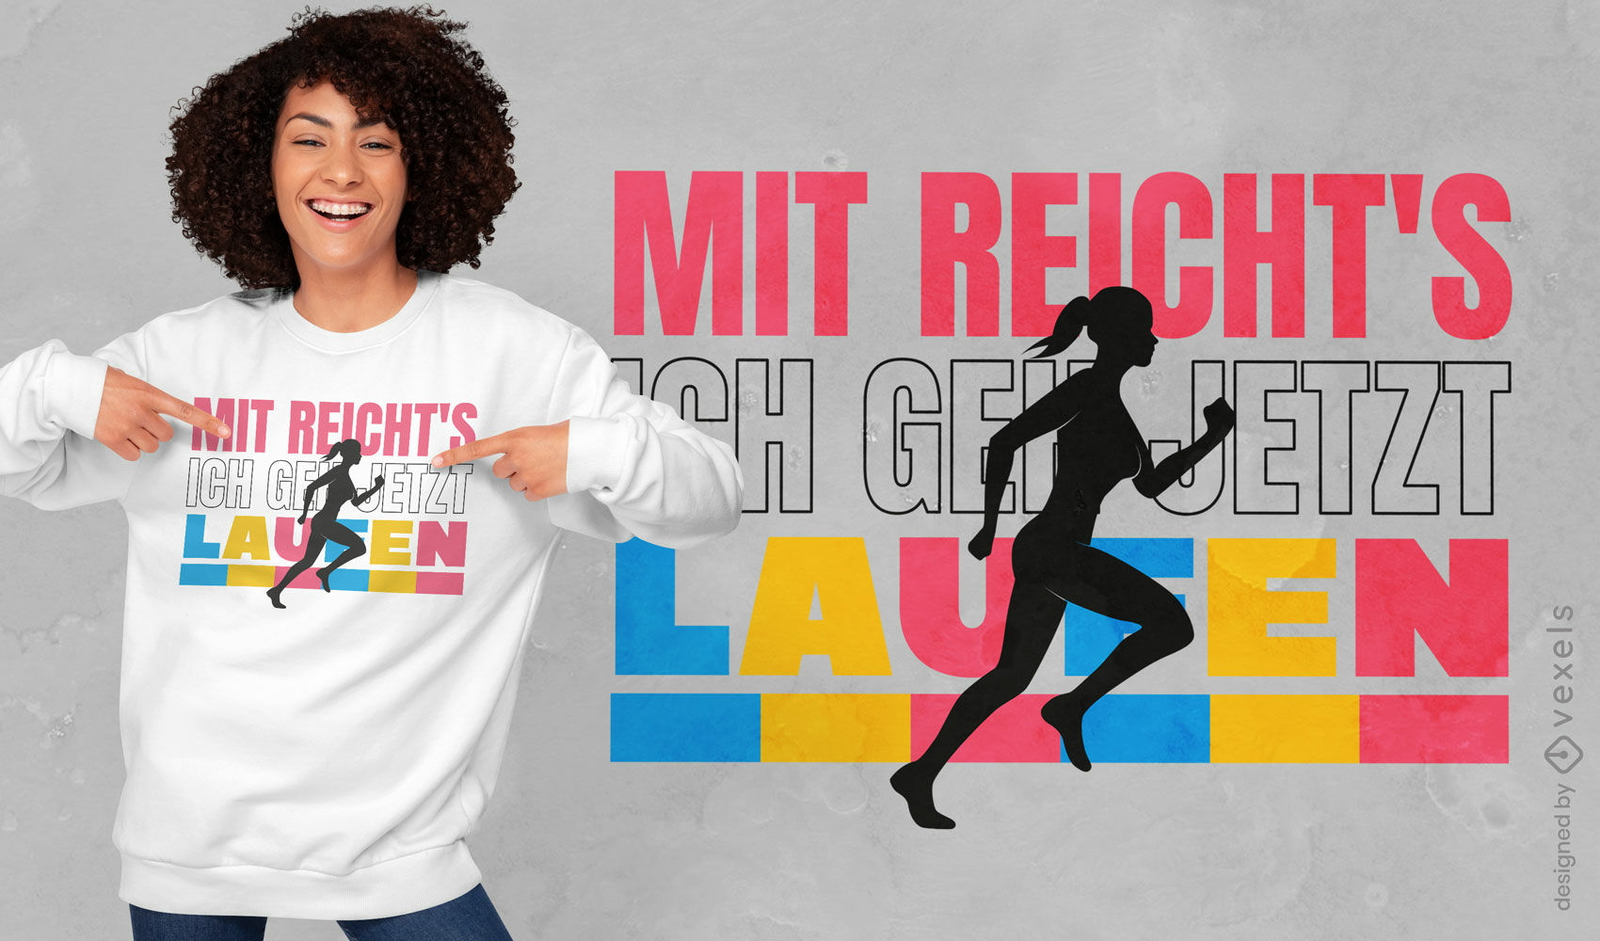
Design de camiseta motivacional para corrida alemã
Escolha uma pasta
Todos os favoritos
Criar novo
Salvar
Design de camiseta motivacional para corrida alemã
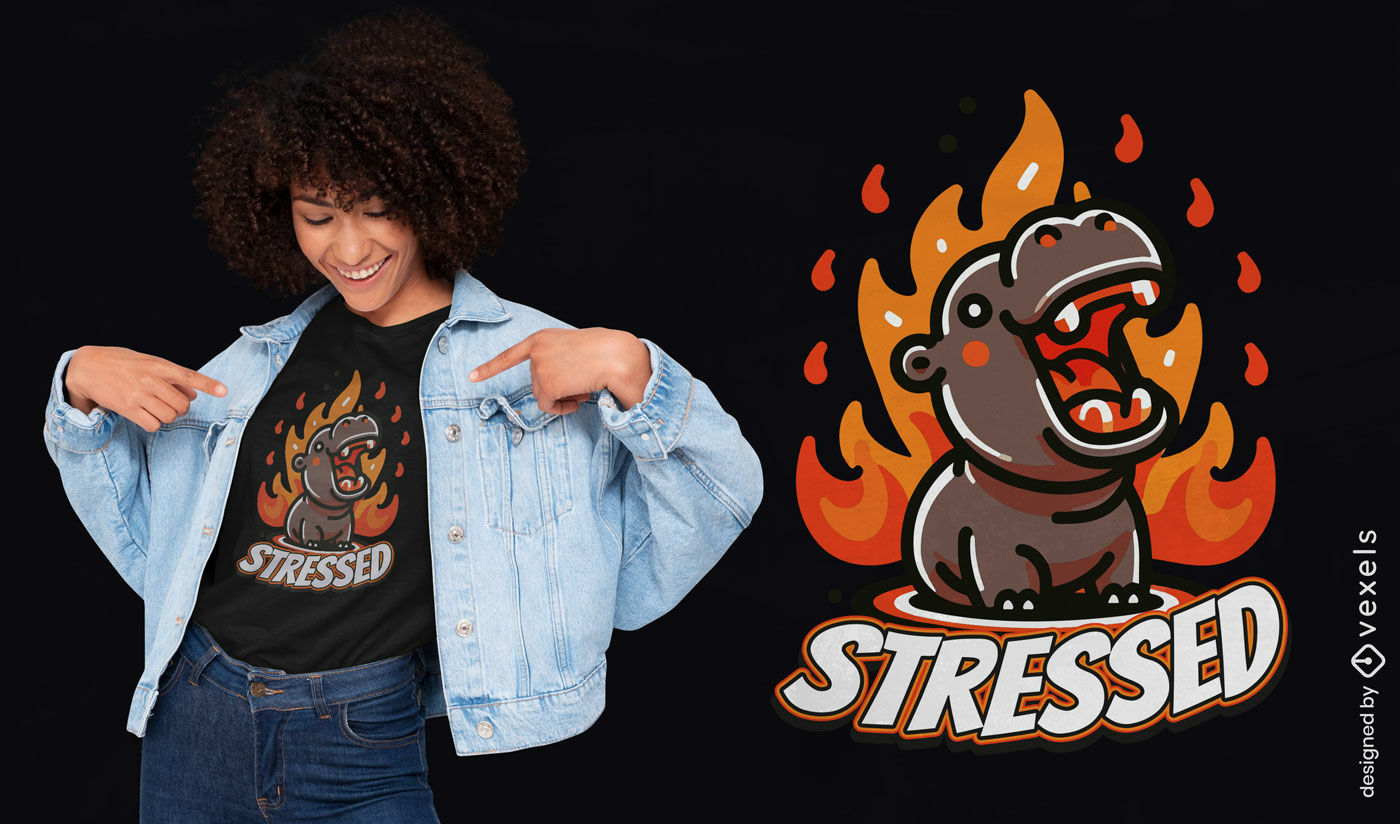
Gerado por IA, selecionado por nossos designers.
para Merch
Design de camiseta hipopótamo estressado
Escolha uma pasta
Todos os favoritos
Criar novo
Salvar
Design de camiseta hipopótamo estressado
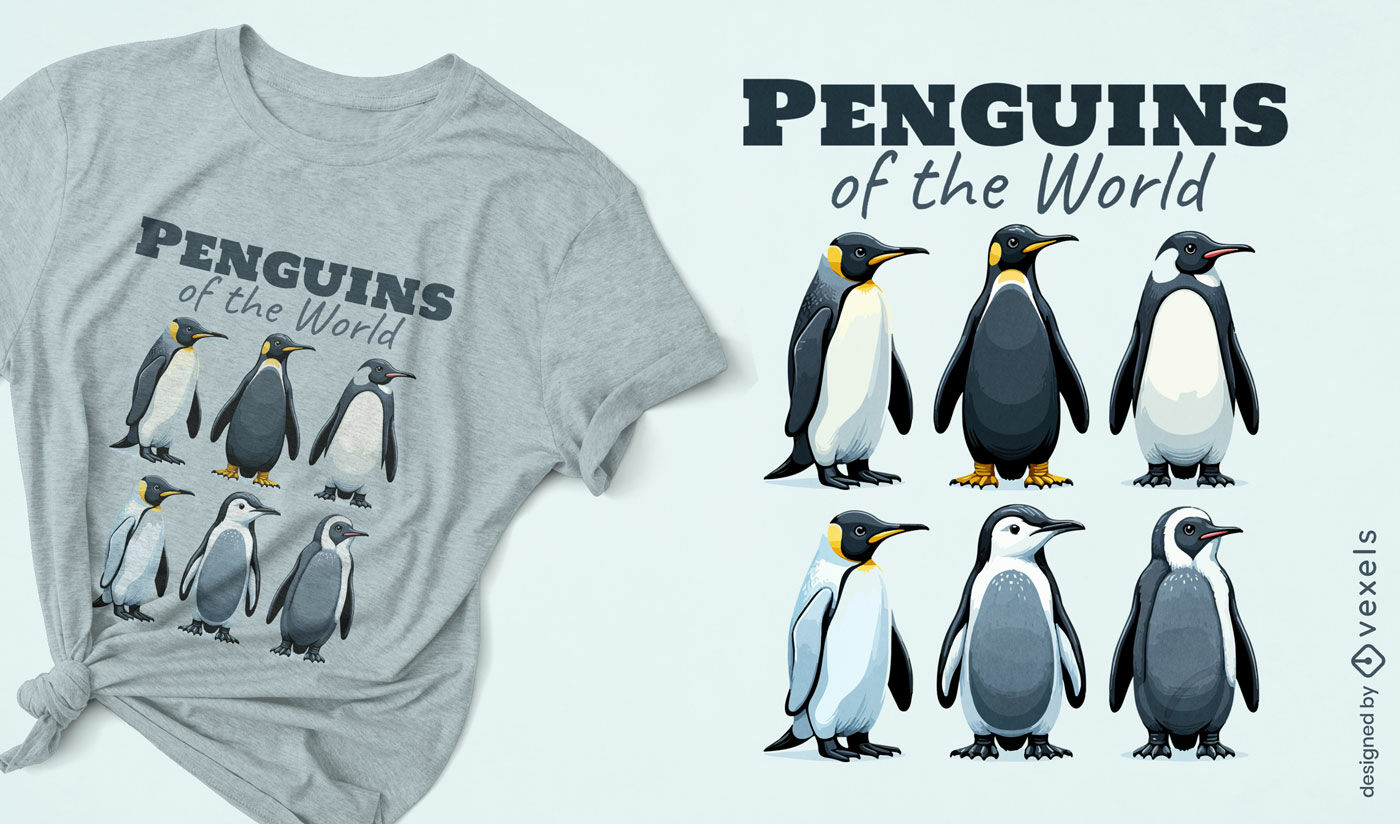
Gerado por IA, selecionado por nossos designers.
para Merch
Design de camiseta Pinguins do Mundo
Escolha uma pasta
Todos os favoritos
Criar novo
Salvar
Design de camiseta Pinguins do Mundo
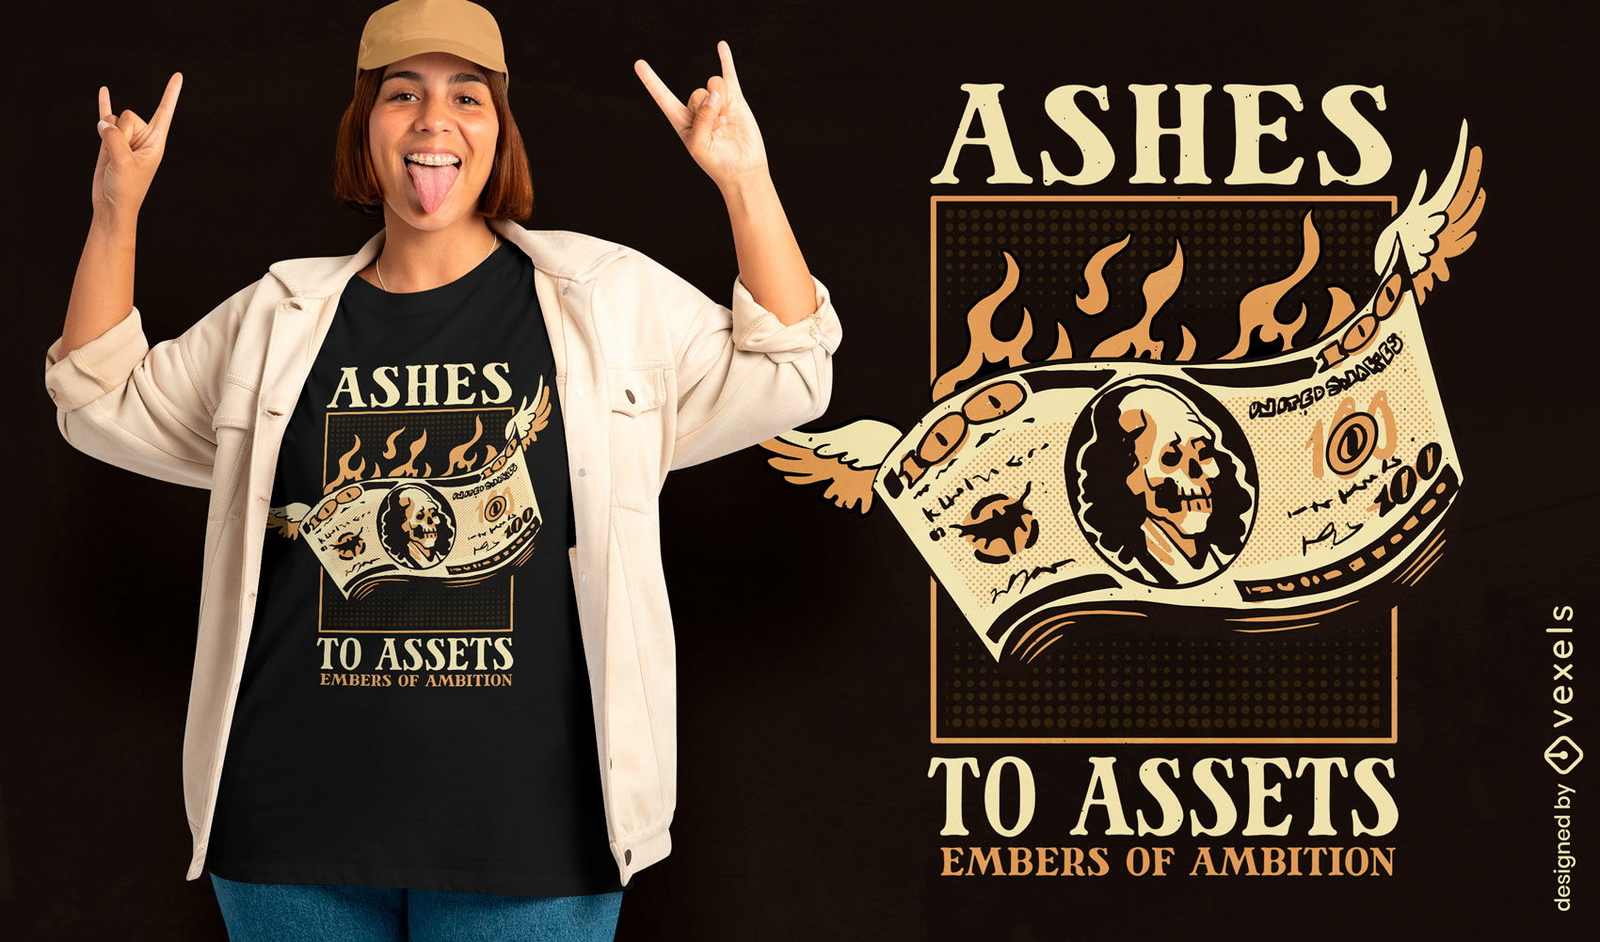
texto editável
Pronto para imprimir
para Merch
Design de camiseta com ambição de dinheiro
Escolha uma pasta
Todos os favoritos
Criar novo
Salvar
Design de camiseta com ambição de dinheiro
Gerado por IA, selecionado por nossos designers.
para Merch
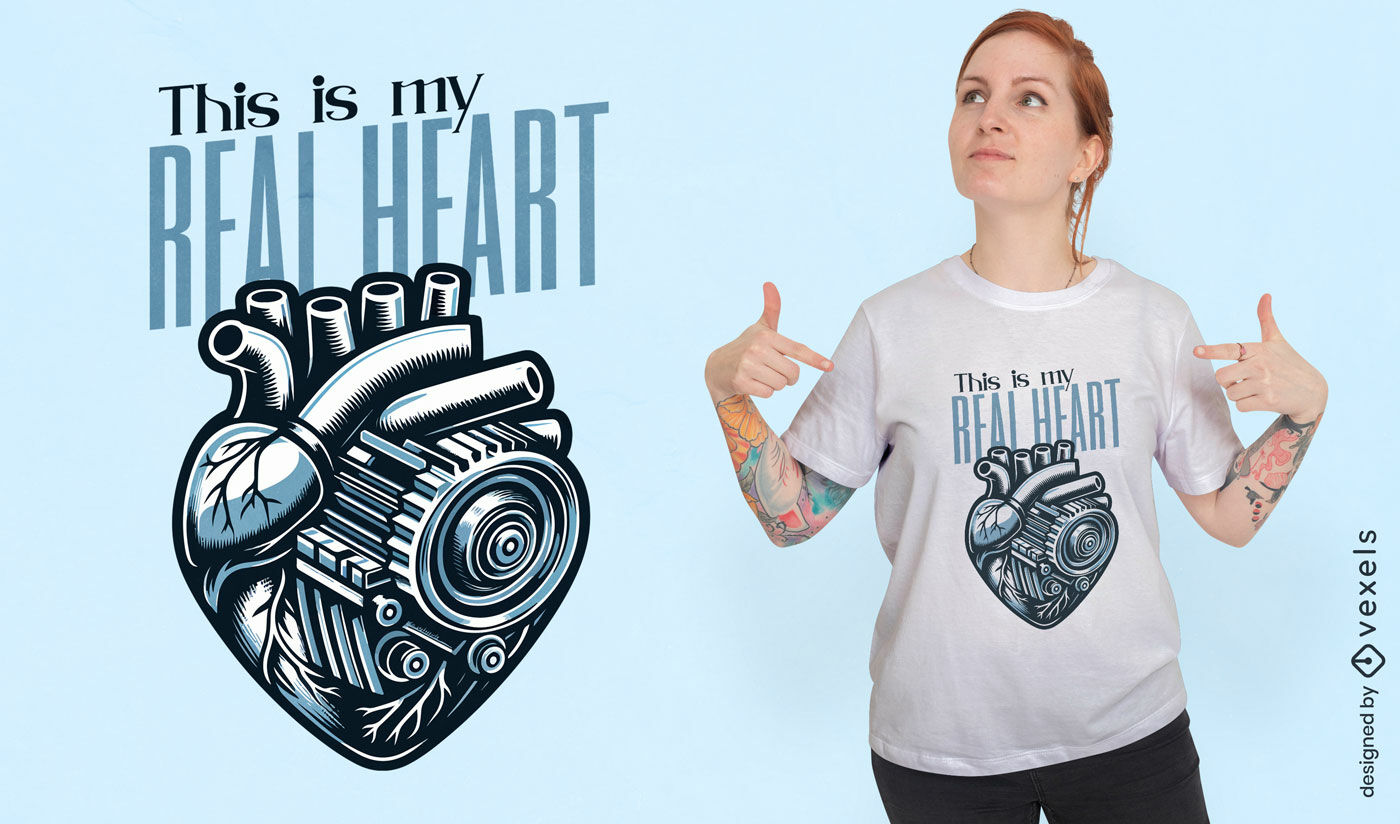
Design de camiseta com anatomia do coração mecânico
Escolha uma pasta
Todos os favoritos
Criar novo
Salvar
Design de camiseta com anatomia do coração mecânico
Gerado por IA, selecionado por nossos designers.
para Merch
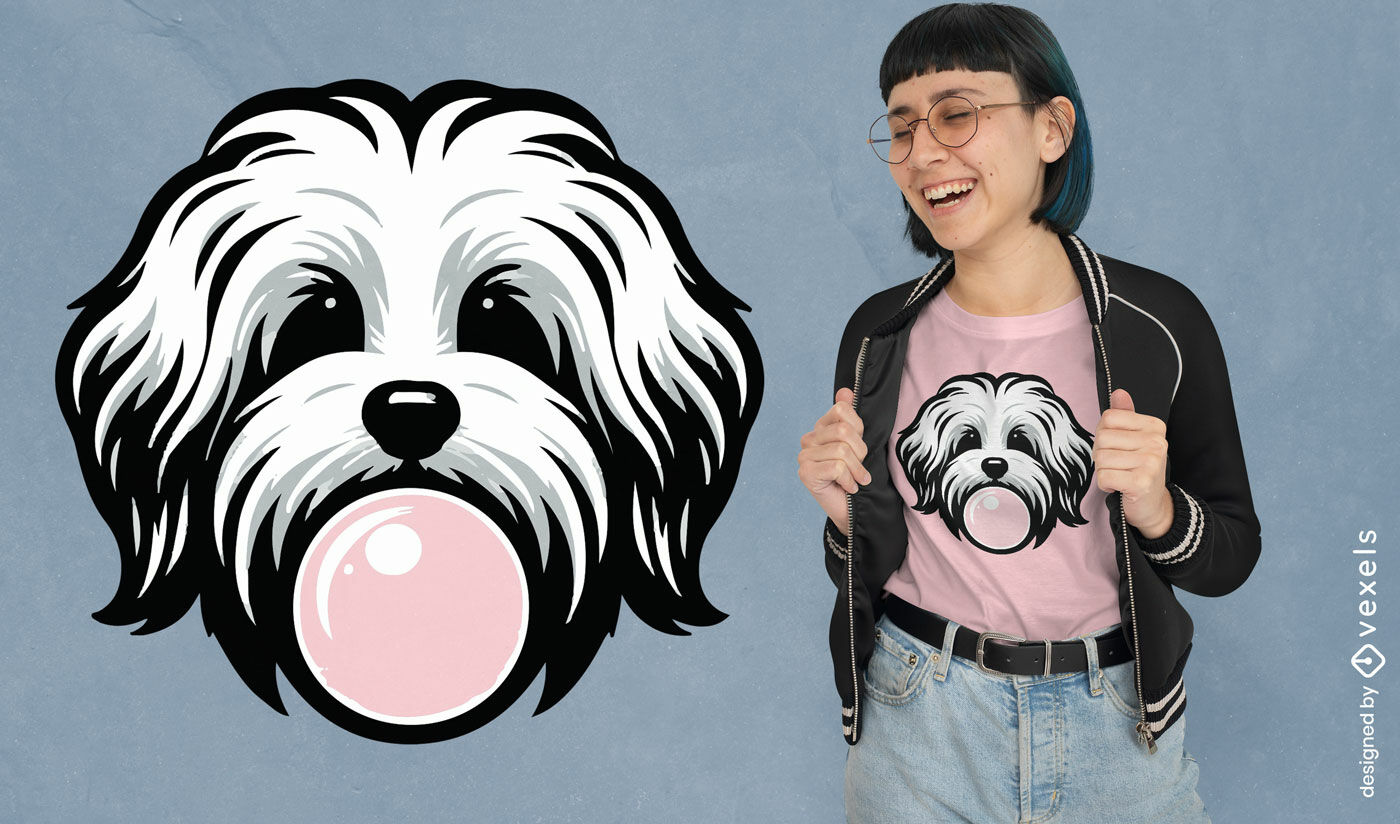
Design de camiseta para cachorro com goma de mascar
Escolha uma pasta
Todos os favoritos
Criar novo
Salvar
Design de camiseta para cachorro com goma de mascar
texto editável
Pronto para imprimir
para Merch
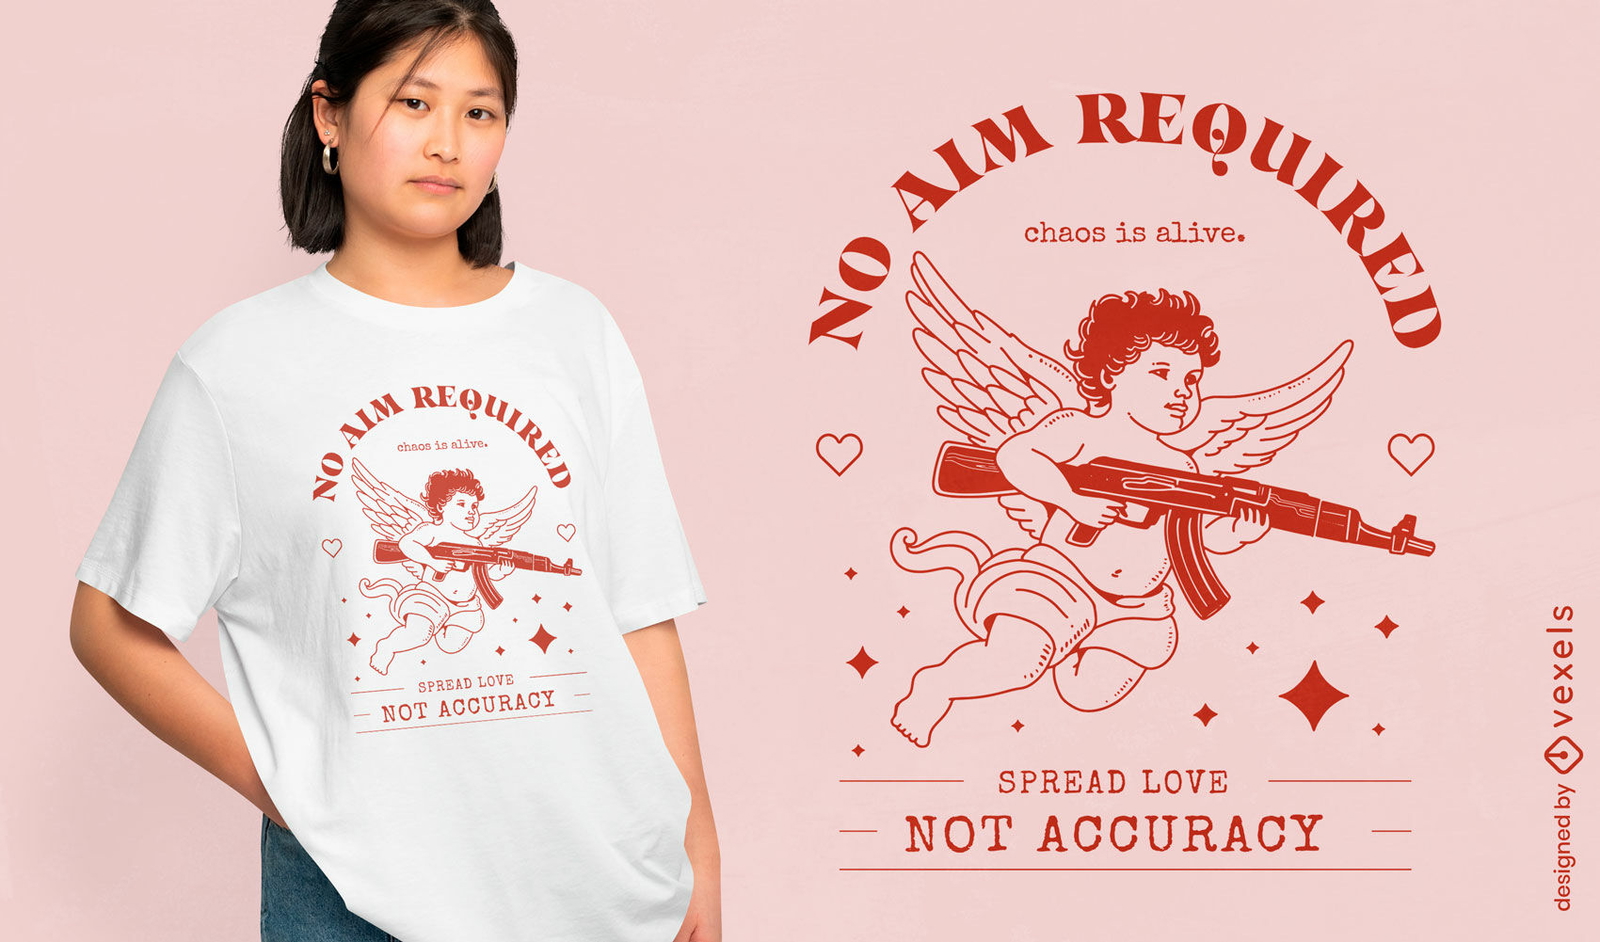
Design de camiseta sem munição necessária
Escolha uma pasta
Todos os favoritos
Criar novo
Salvar
Design de camiseta sem munição necessária
texto editável
Pronto para imprimir
para Merch
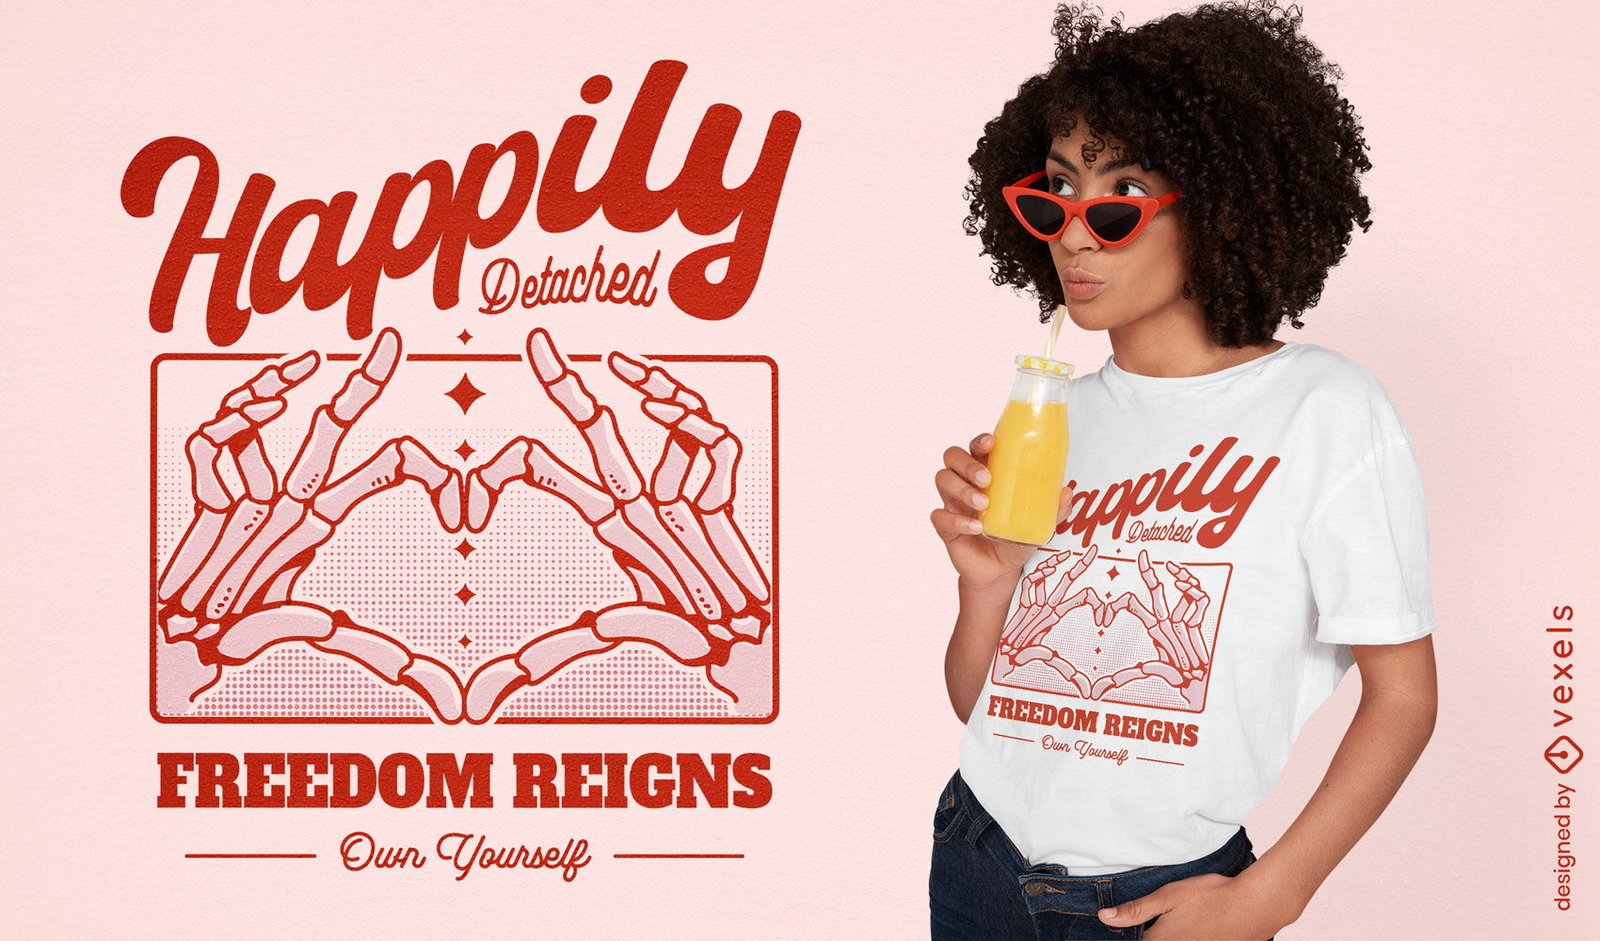
Design de camiseta felizmente destacado
Escolha uma pasta
Todos os favoritos
Criar novo
Salvar
Design de camiseta felizmente destacado
texto editável
Pronto para imprimir
para Merch
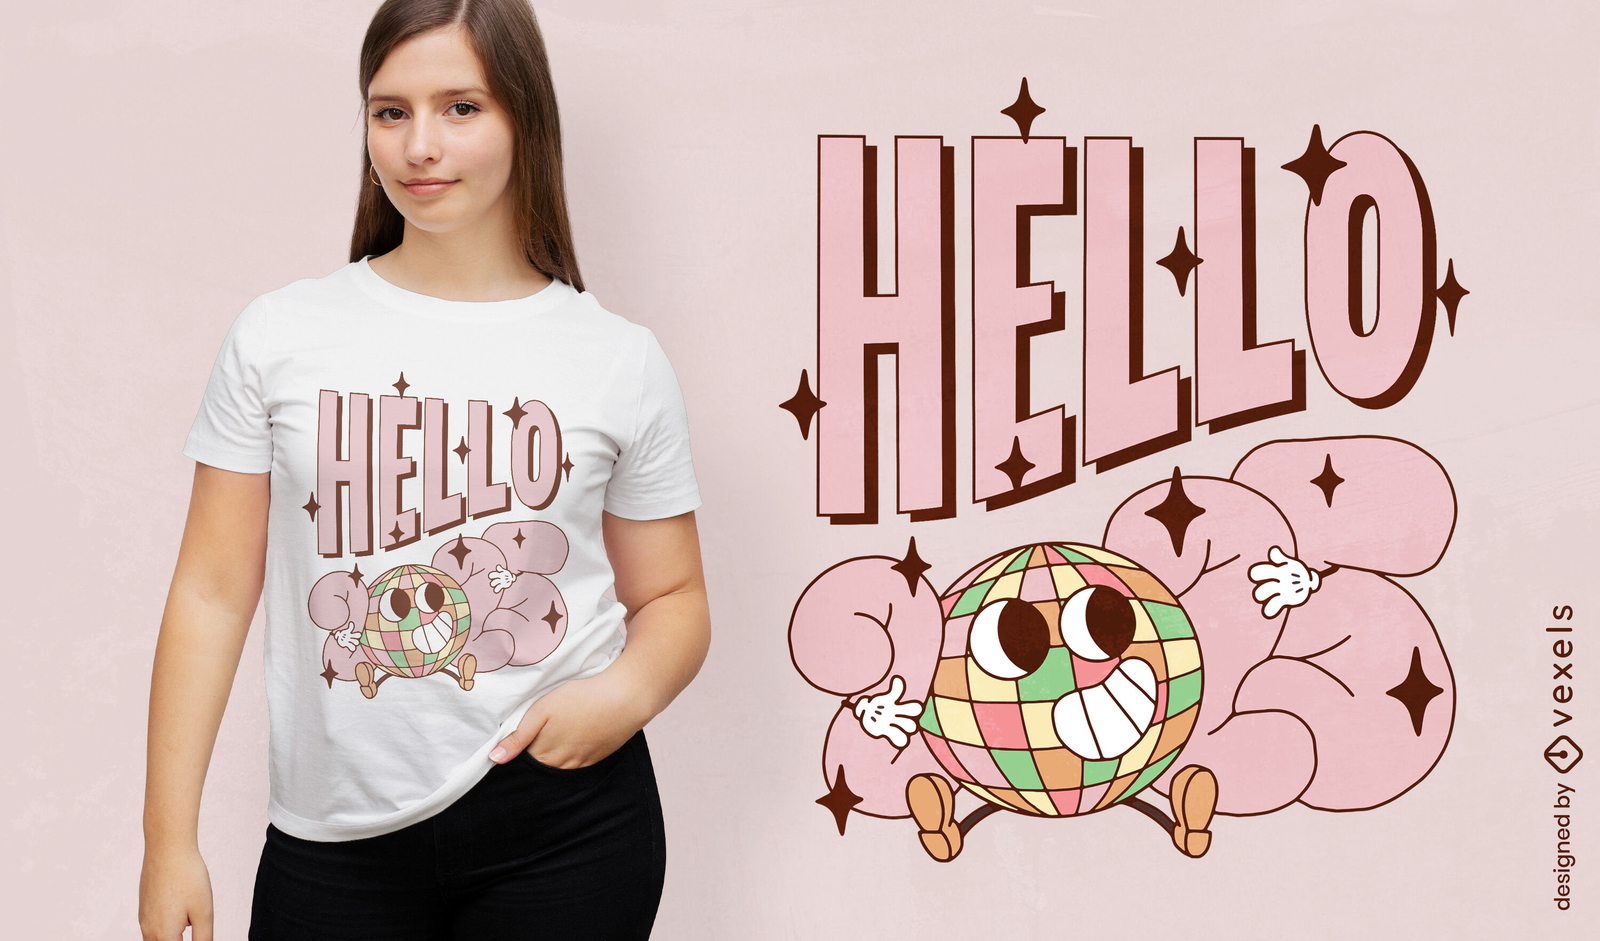
Design de camiseta Olá 2025
Escolha uma pasta
Todos os favoritos
Criar novo
Salvar
Design de camiseta Olá 2025
Gerado por IA, selecionado por nossos designers.
para Merch
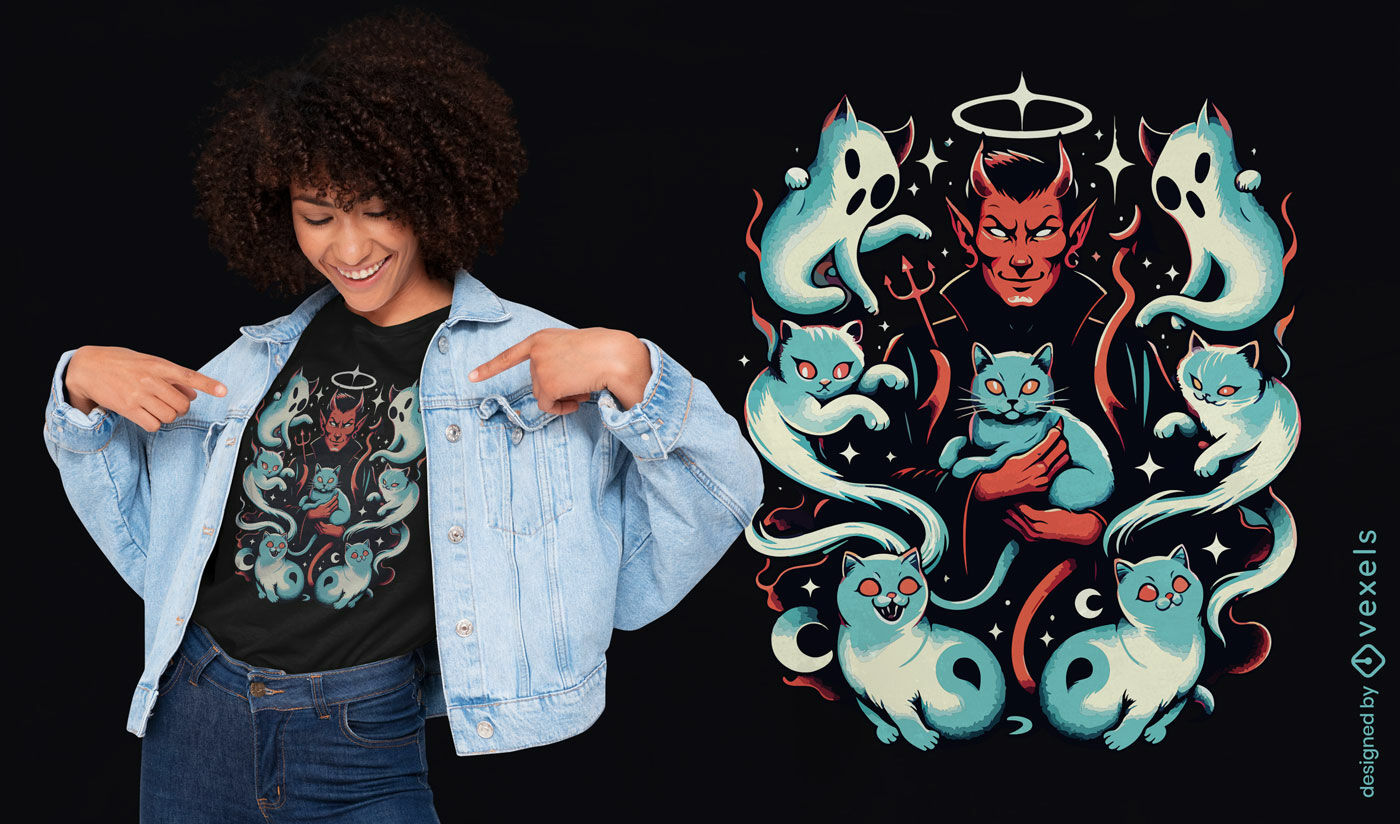
Design de camiseta com gatos fantasmas e demônios
Escolha uma pasta
Todos os favoritos
Criar novo
Salvar
Design de camiseta com gatos fantasmas e demônios
Gerado por IA, selecionado por nossos designers.
para Merch
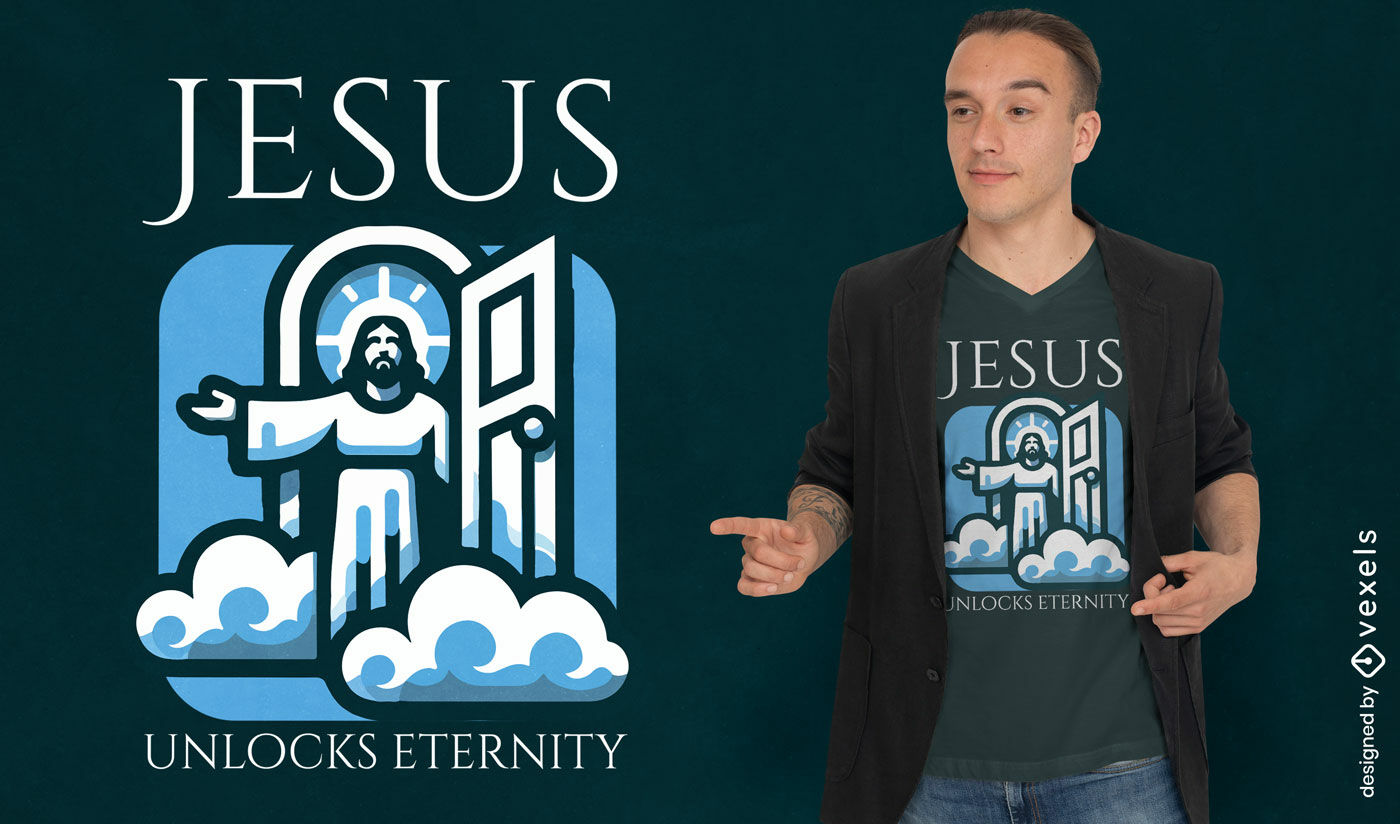
Design de camiseta Jesus desbloqueia a eternidade
Escolha uma pasta
Todos os favoritos
Criar novo
Salvar
Design de camiseta Jesus desbloqueia a eternidade
Pronto para imprimir
para Merch
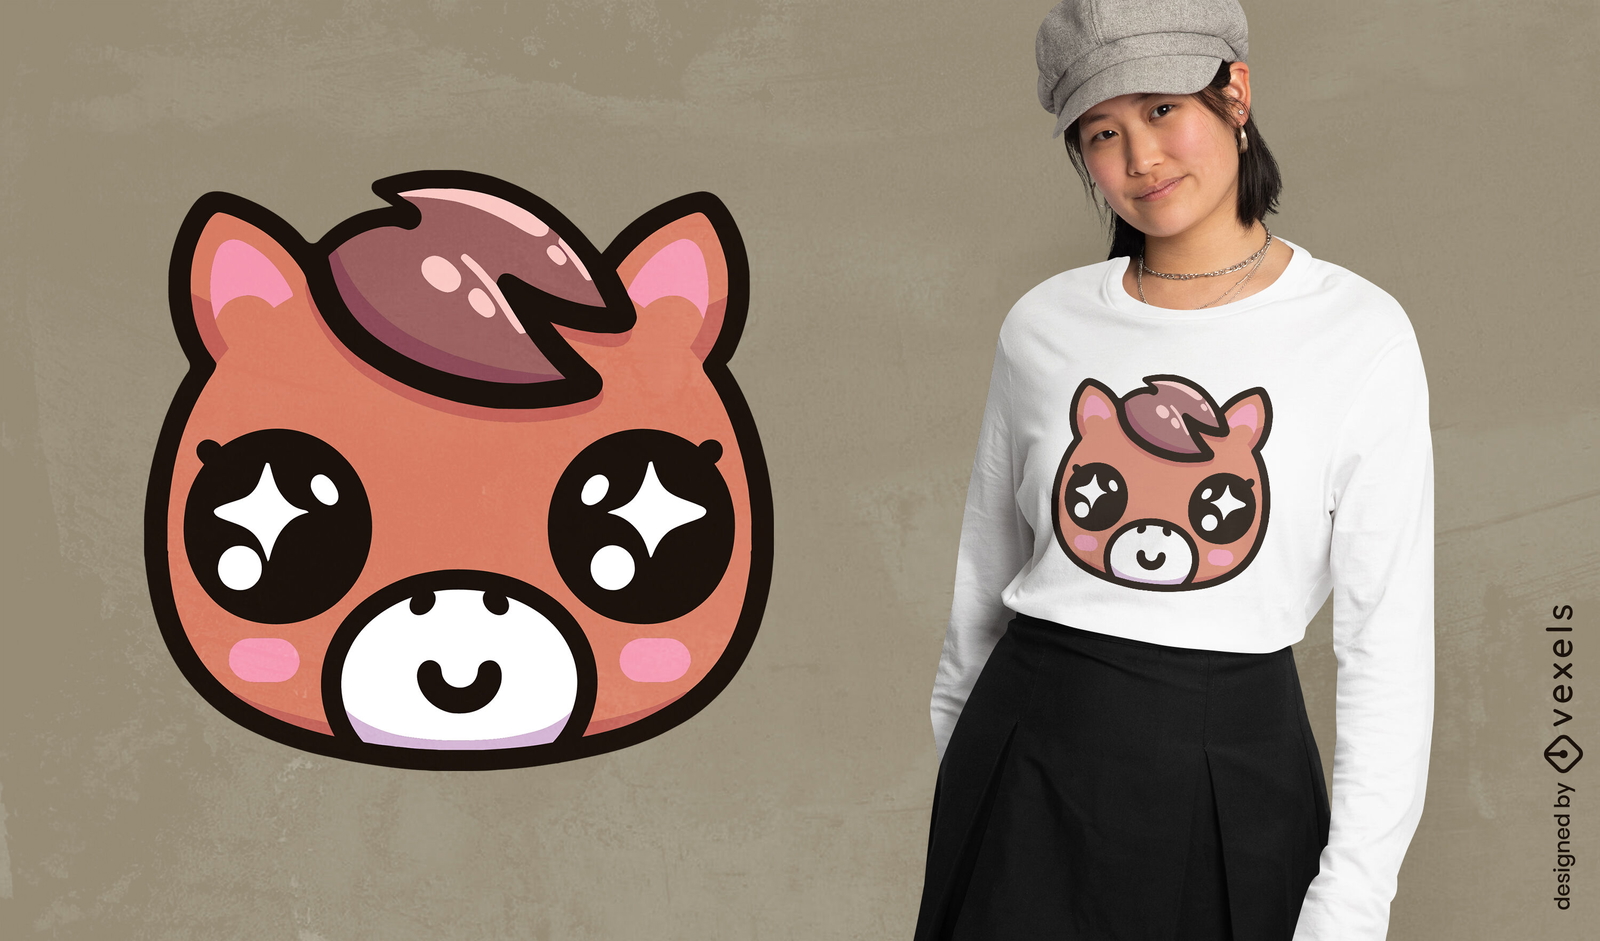
Design de camiseta com cara de cavalo kawaii
Escolha uma pasta
Todos os favoritos
Criar novo
Salvar
Design de camiseta com cara de cavalo kawaii
Gerado por IA, selecionado por nossos designers.
para Merch
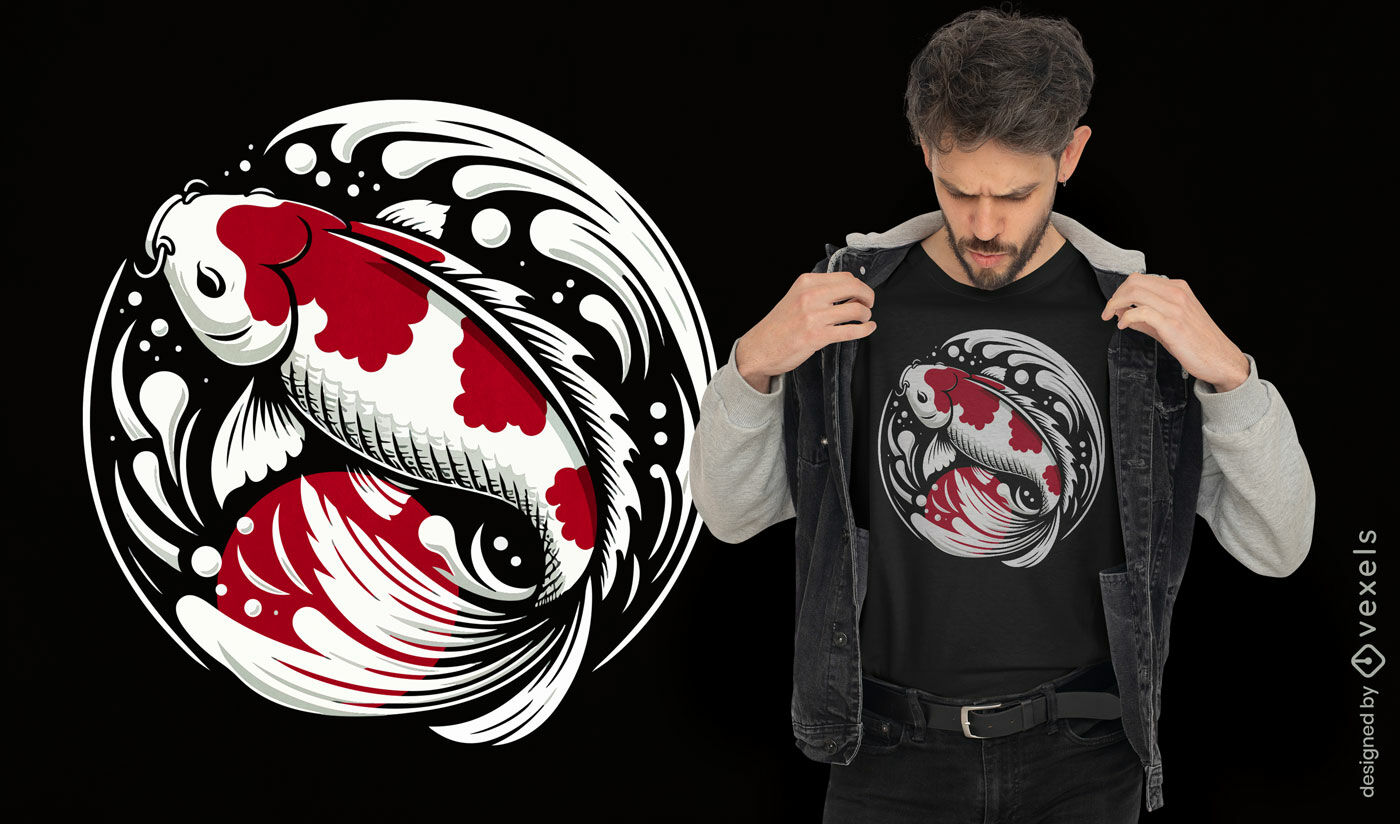
Design de camiseta japonesa com carpa esvoaçante
Escolha uma pasta
Todos os favoritos
Criar novo
Salvar
Design de camiseta japonesa com carpa esvoaçante
Gerado por IA, selecionado por nossos designers.
para Merch
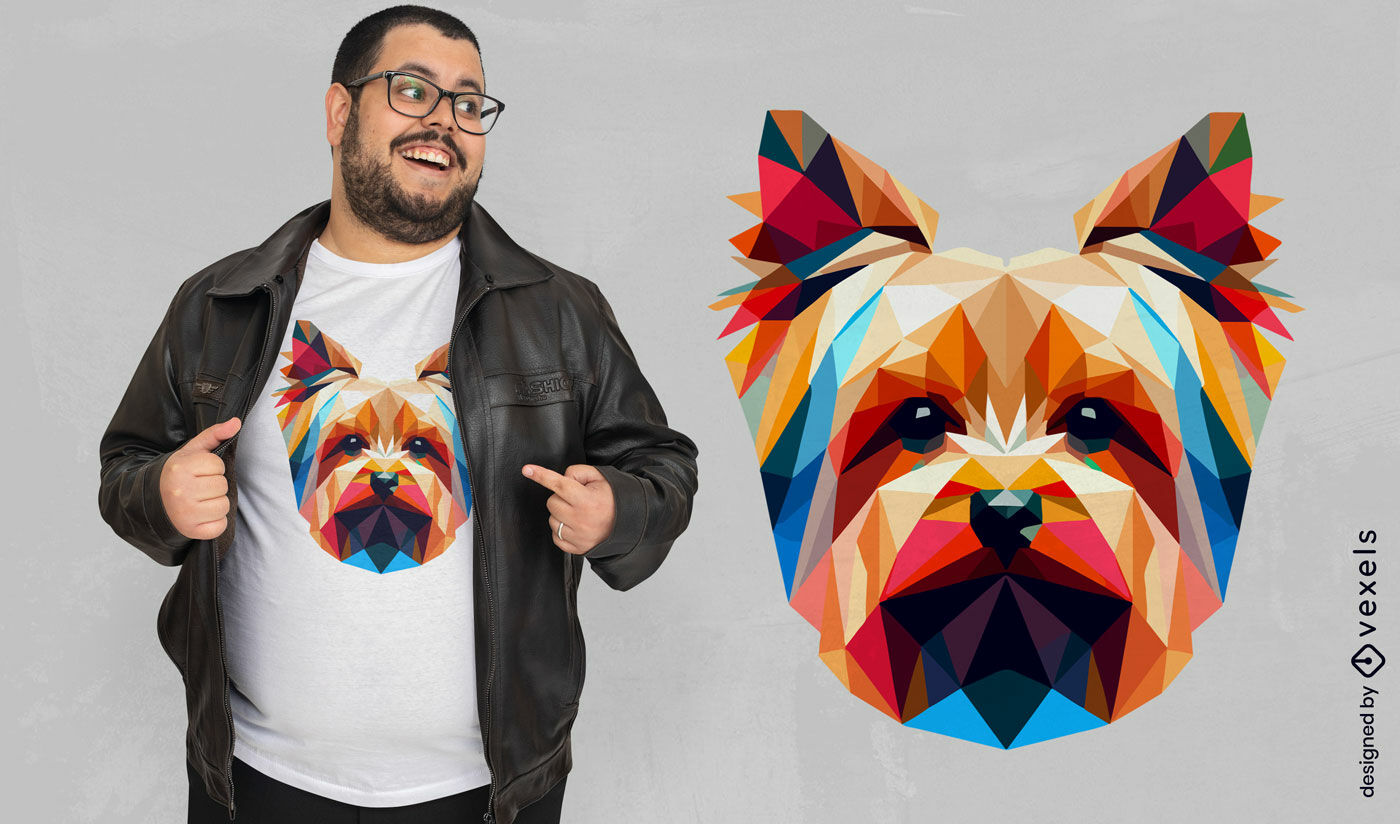
Design de camiseta geométrica Yorkshire terrier
Escolha uma pasta
Todos os favoritos
Criar novo
Salvar
Design de camiseta geométrica Yorkshire terrier
Pronto para imprimir
para Merch
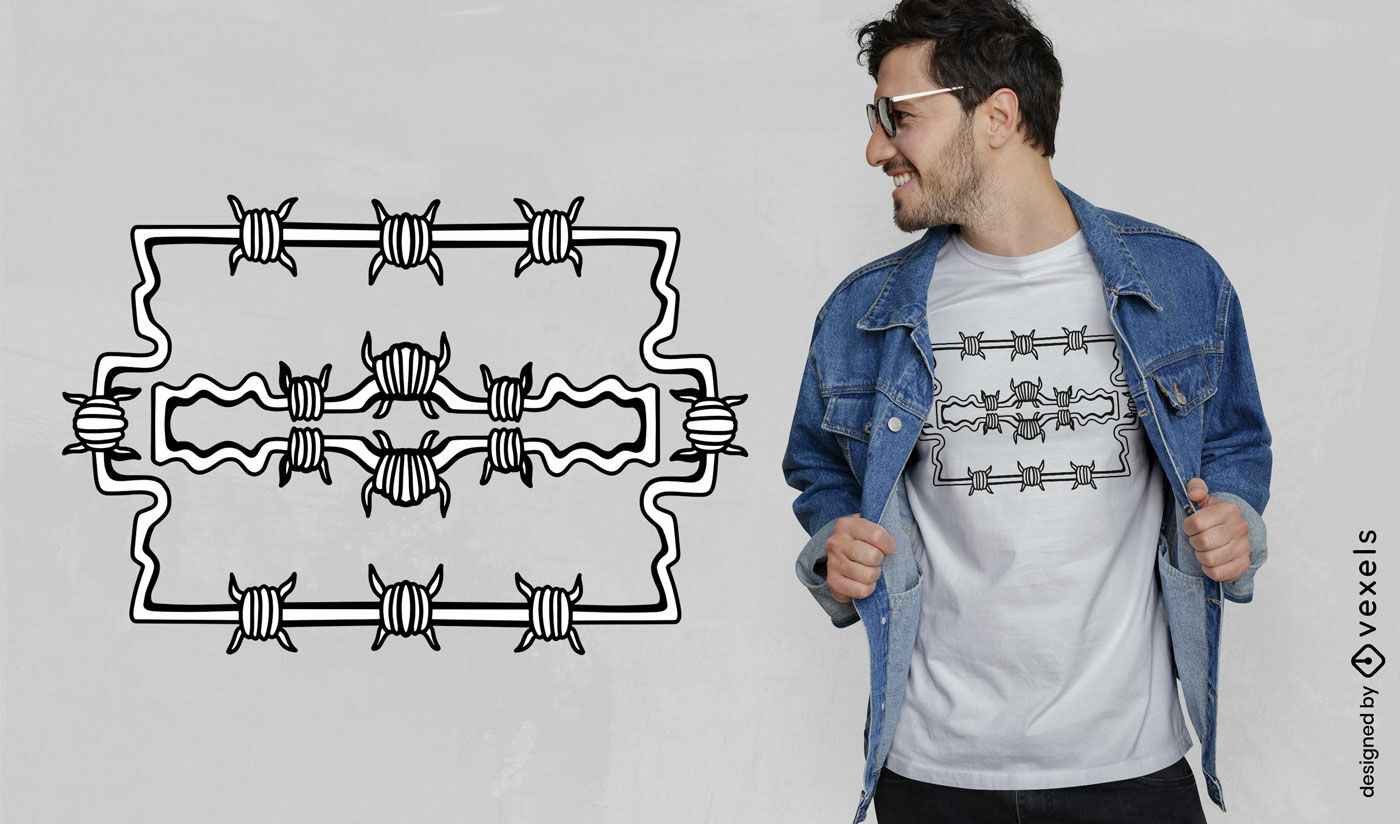
Design de camiseta com arame farpado e lâmina de barbear
Escolha uma pasta
Todos os favoritos
Criar novo
Salvar
Design de camiseta com arame farpado e lâmina de barbear
Gerado por IA, selecionado por nossos designers.
para Merch
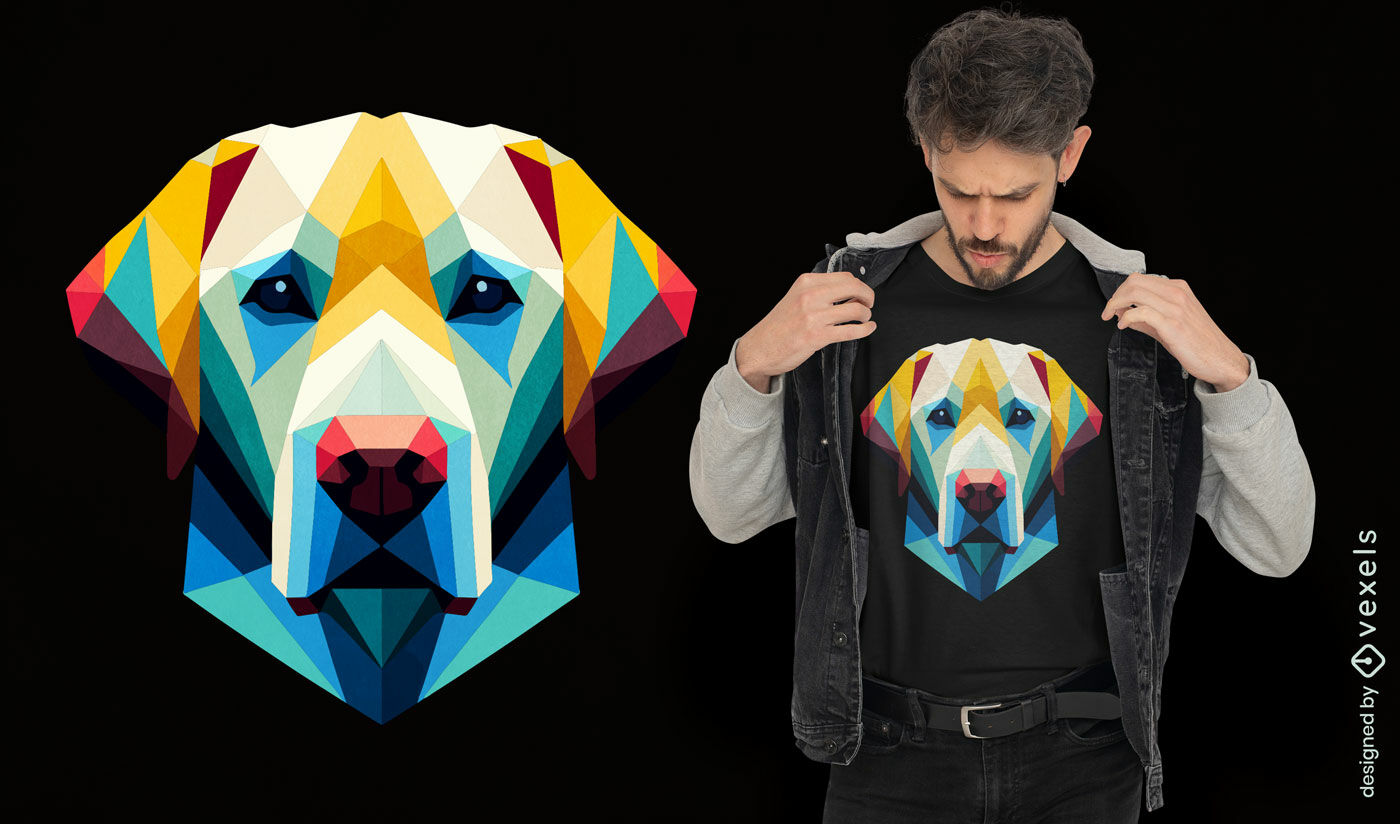
Design geométrico para camiseta de cachorro Labrador
Escolha uma pasta
Todos os favoritos
Criar novo
Salvar
Design geométrico para camiseta de cachorro Labrador
Gerado por IA, selecionado por nossos designers.
para Merch
Design de camiseta esportiva de tigre
Escolha uma pasta
Todos os favoritos
Criar novo
Salvar
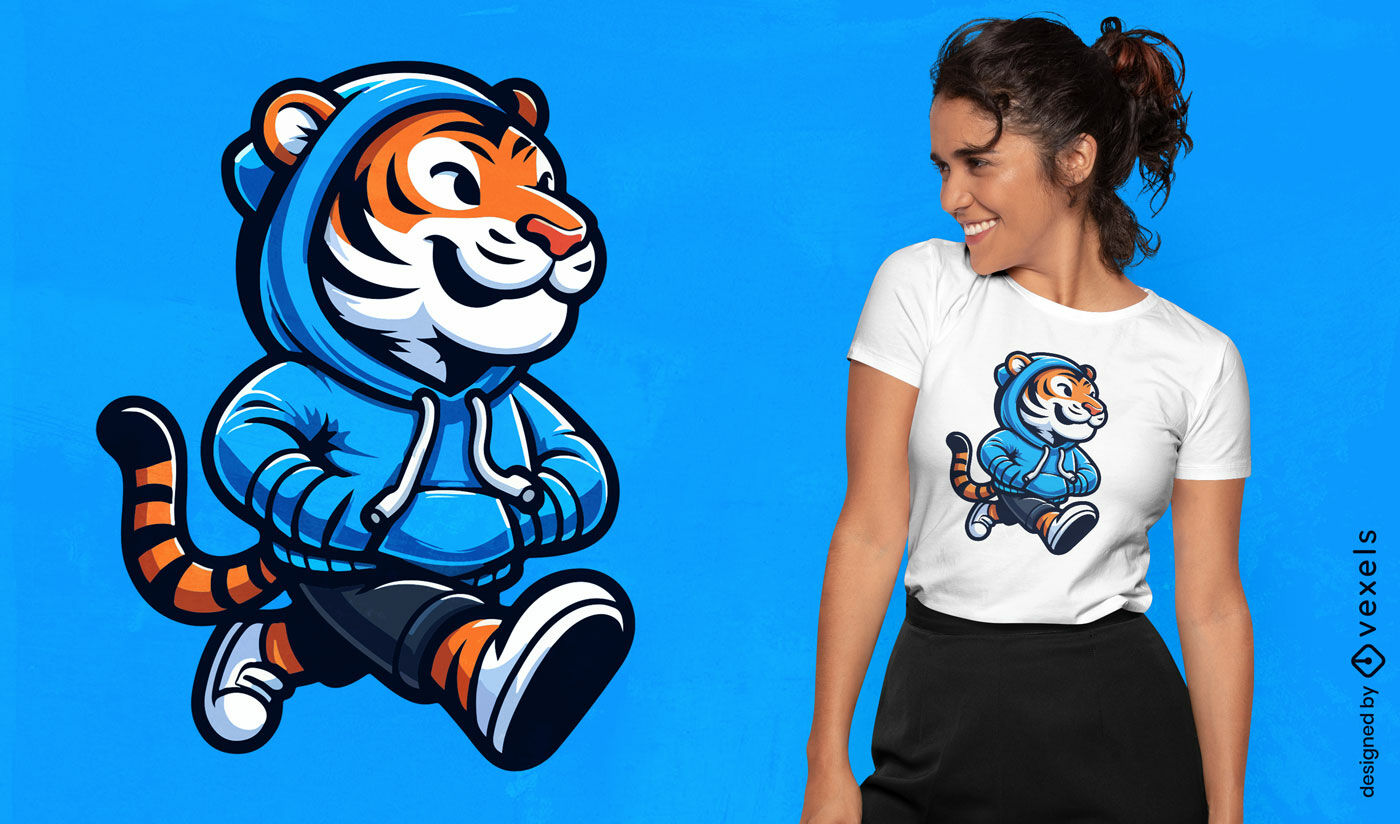
Design de camiseta esportiva de tigre
texto editável
Pronto para imprimir
para Merch
Design de camiseta com o emblema Harris
Escolha uma pasta
Todos os favoritos
Criar novo
Salvar
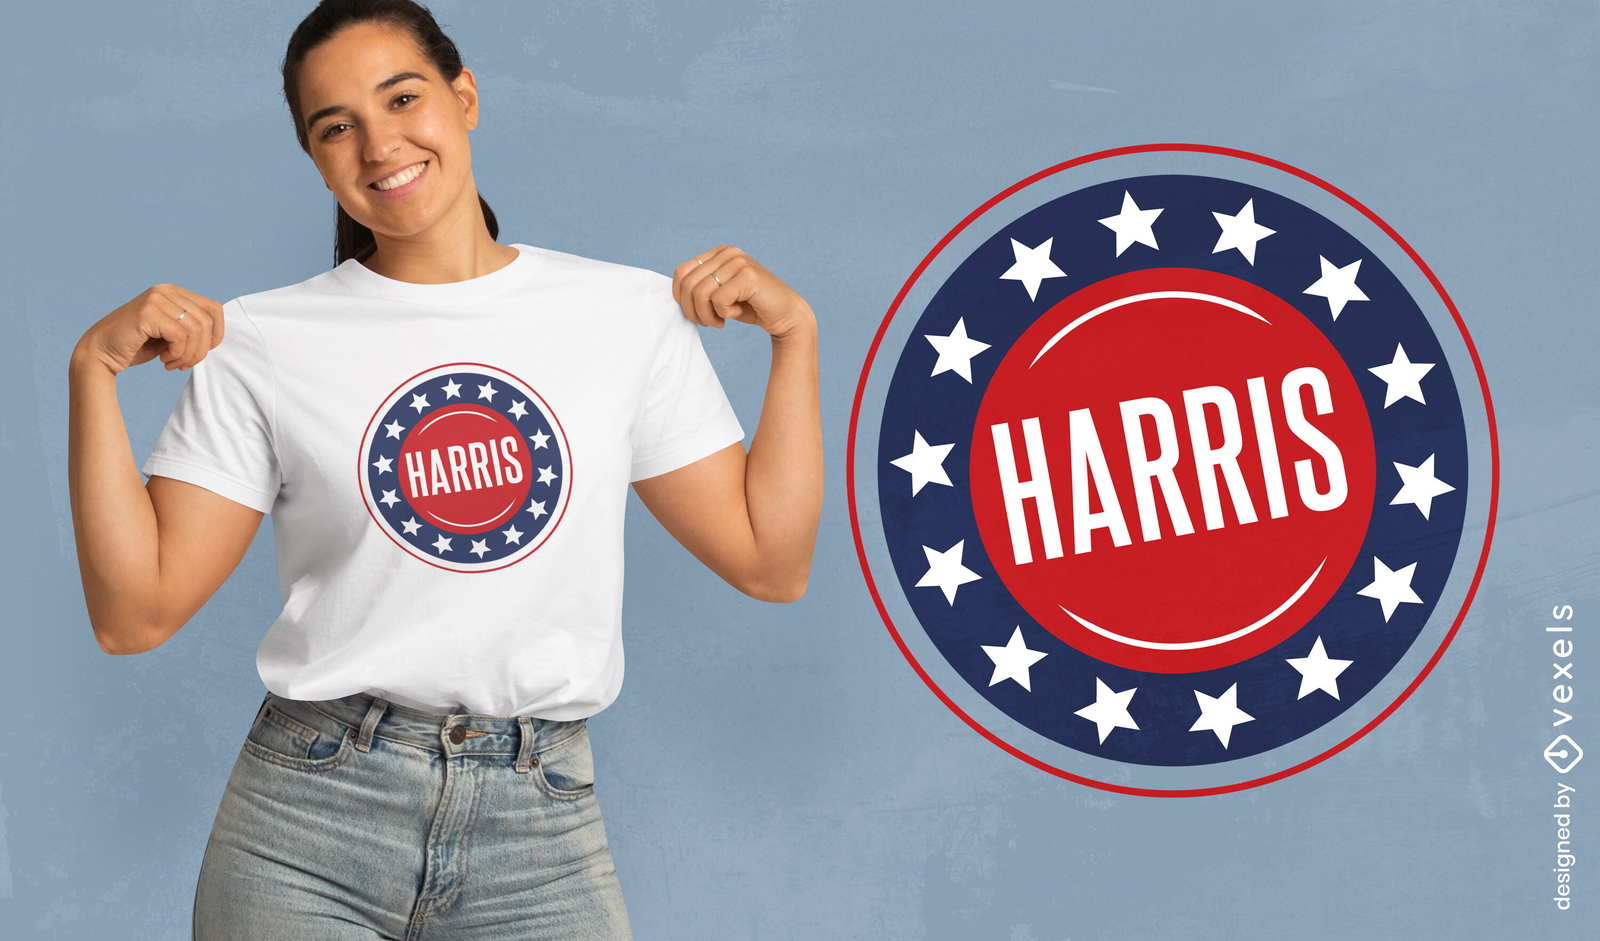
Design de camiseta com o emblema Harris
texto editável
Pronto para imprimir
para Merch
Design de camiseta de tubarão intrépido surfando
Escolha uma pasta
Todos os favoritos
Criar novo
Salvar
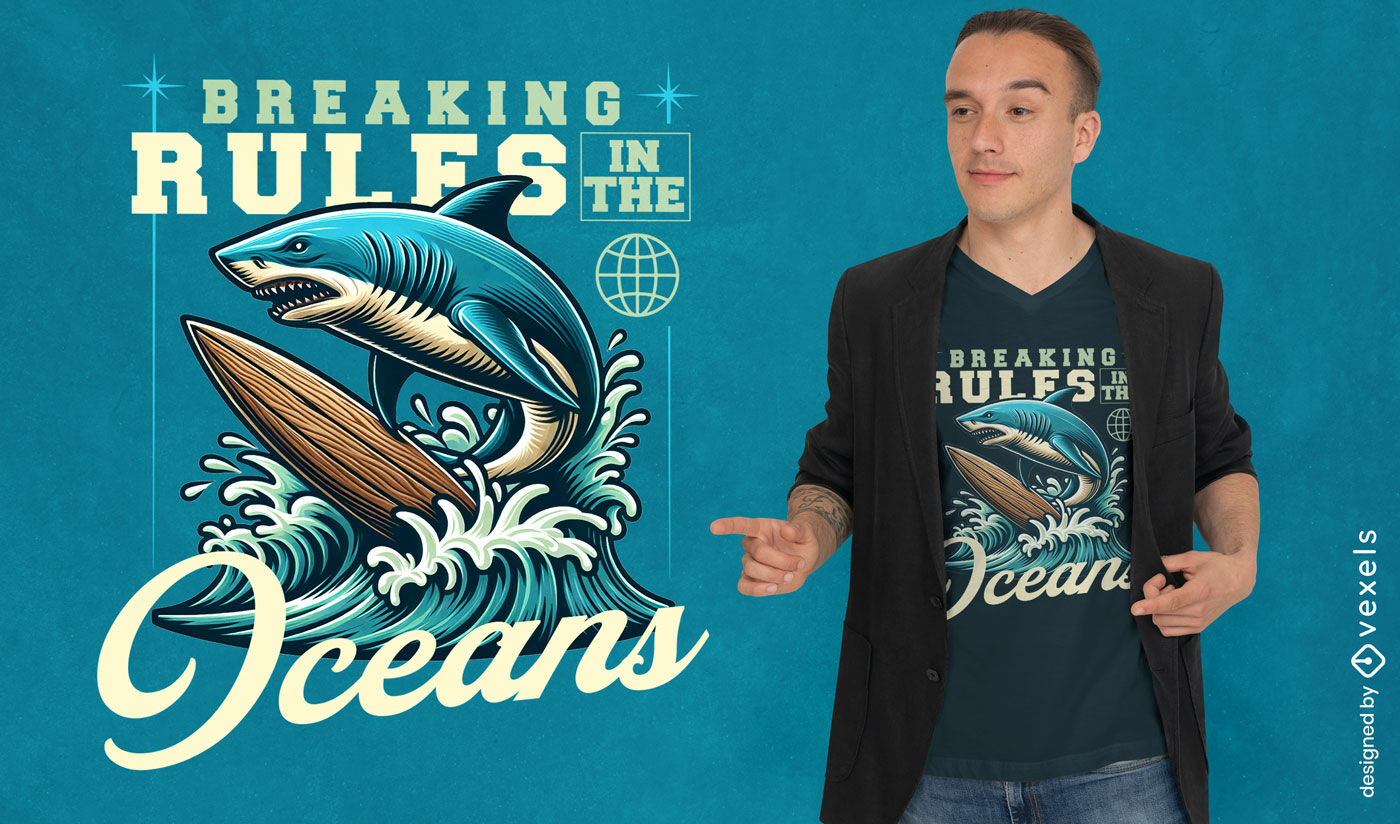
Design de camiseta de tubarão intrépido surfando
Gerado por IA, selecionado por nossos designers.
para Merch
Design de camiseta para entusiasta de cortadores de grama
Escolha uma pasta
Todos os favoritos
Criar novo
Salvar
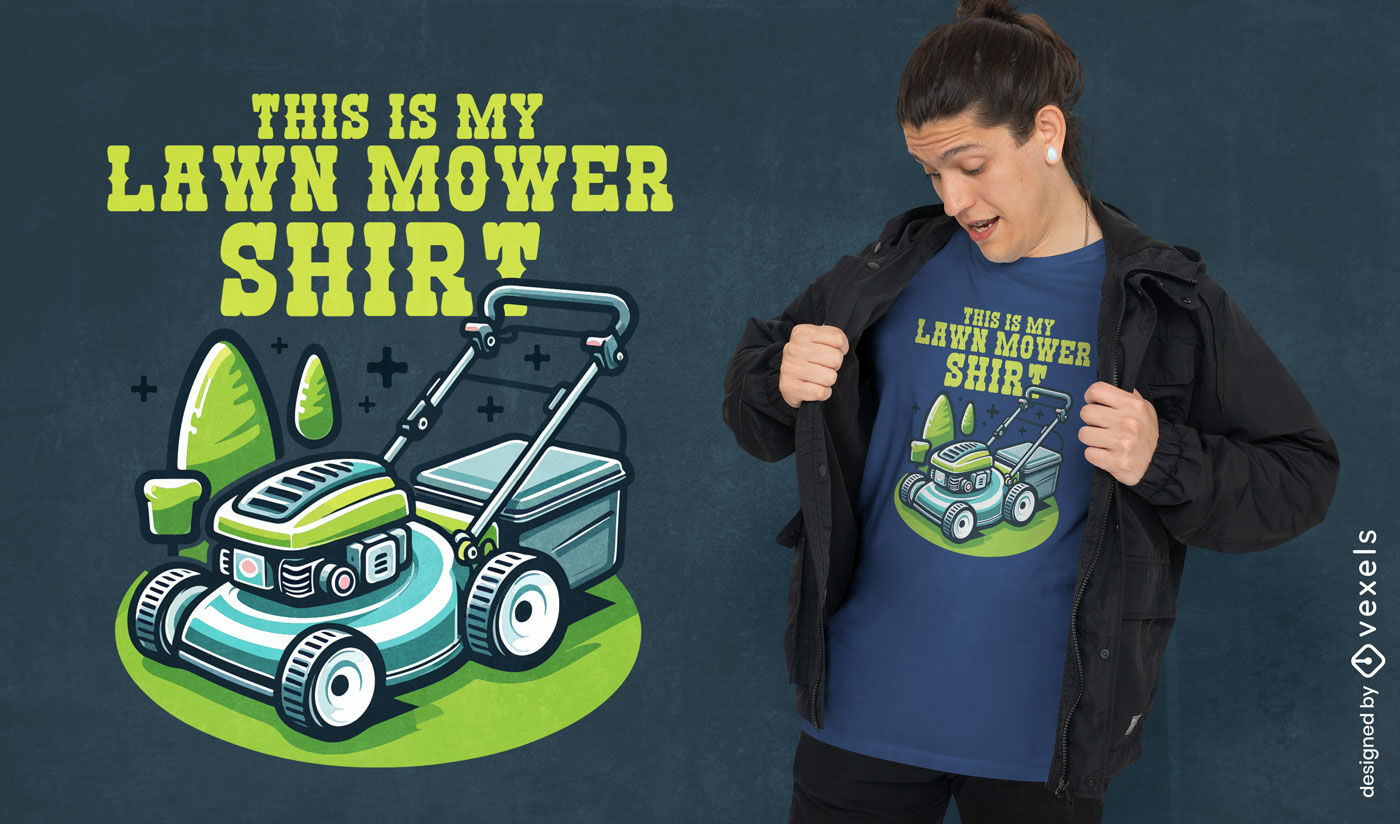
Design de camiseta para entusiasta de cortadores de grama
texto editável
Pronto para imprimir
para Merch
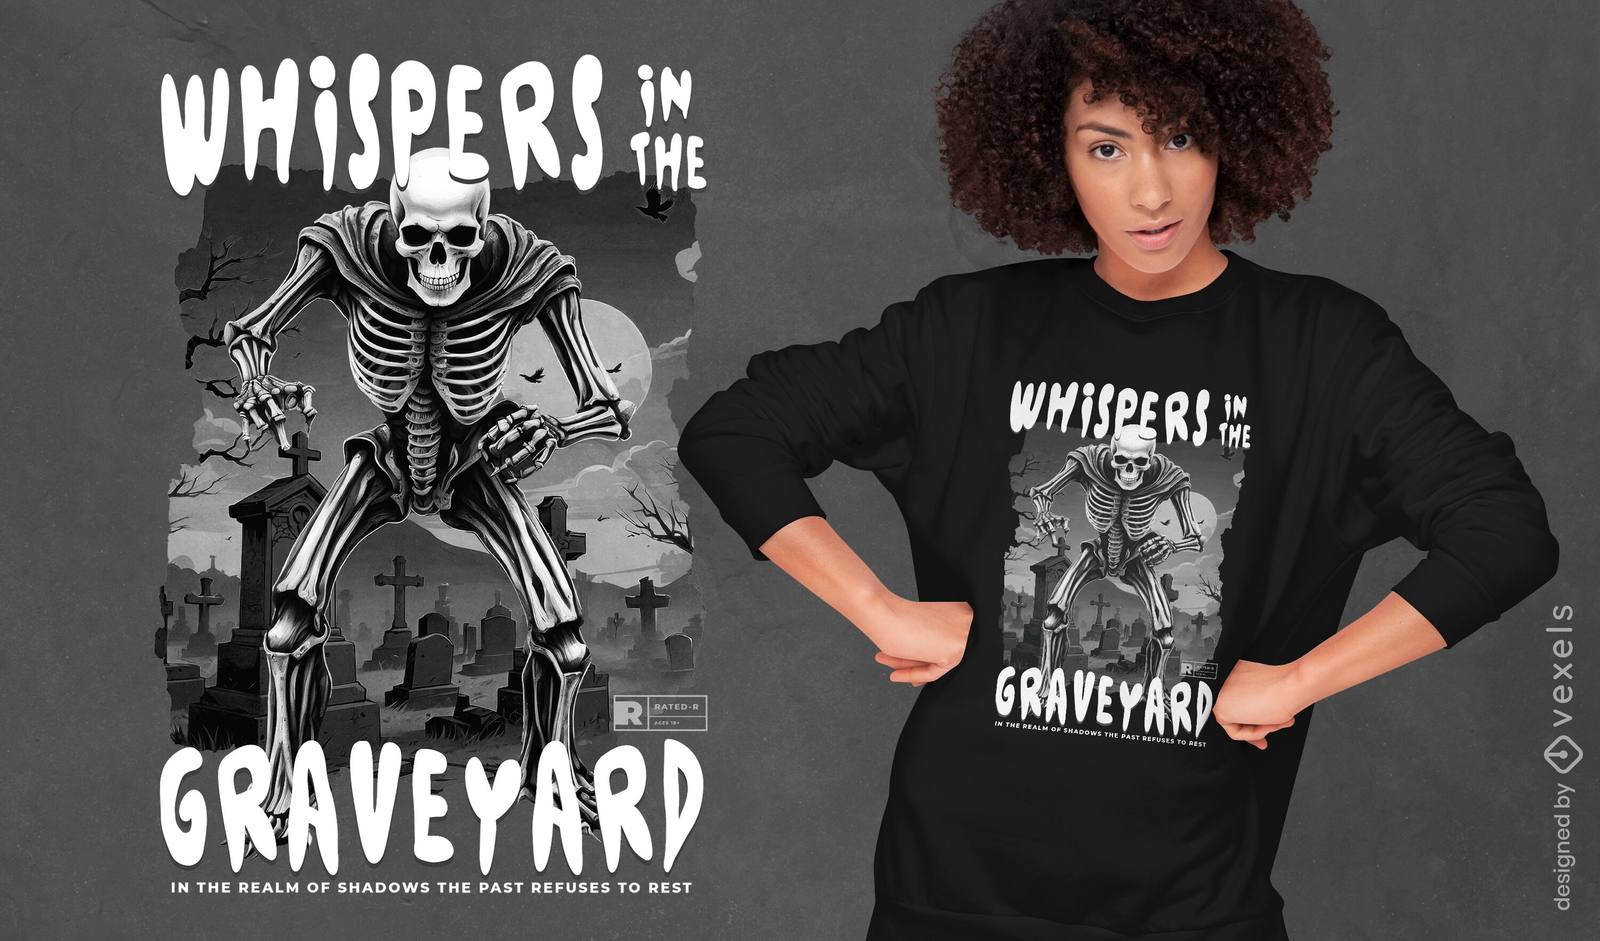
Design de camiseta Sussurros no cemitério
Escolha uma pasta
Todos os favoritos
Criar novo
Salvar
Design de camiseta Sussurros no cemitério
texto editável
Pronto para imprimir
para Merch
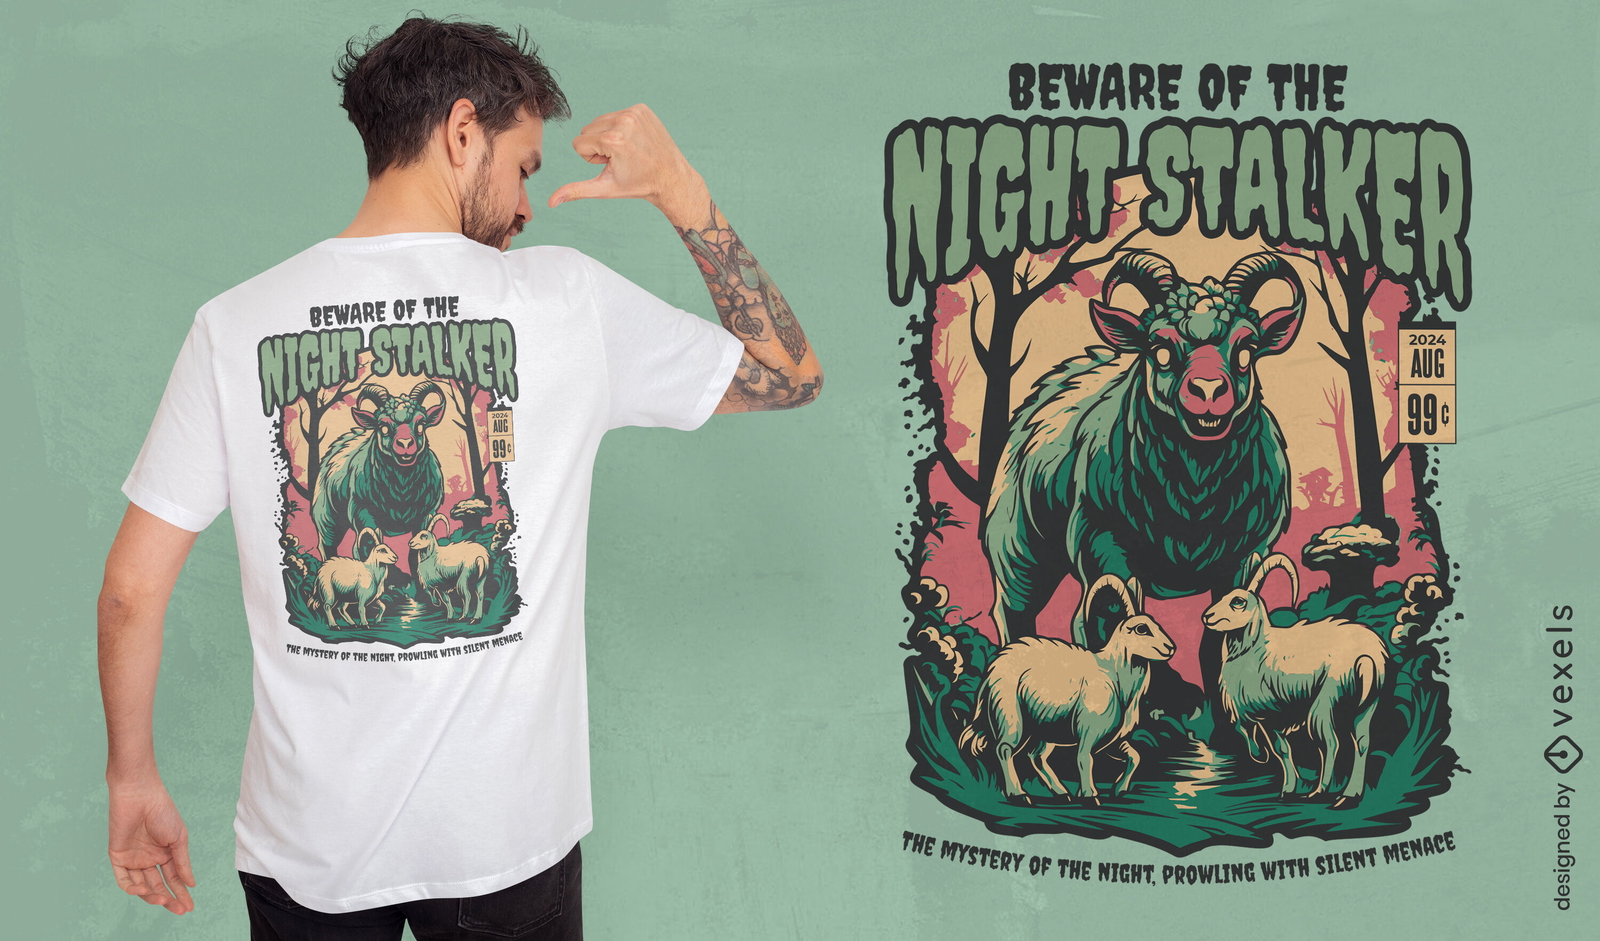
Design de camiseta Bware of the Night Stalker
Escolha uma pasta
Todos os favoritos
Criar novo
Salvar
Design de camiseta Bware of the Night Stalker
Gerado por IA, selecionado por nossos designers.
para Merch
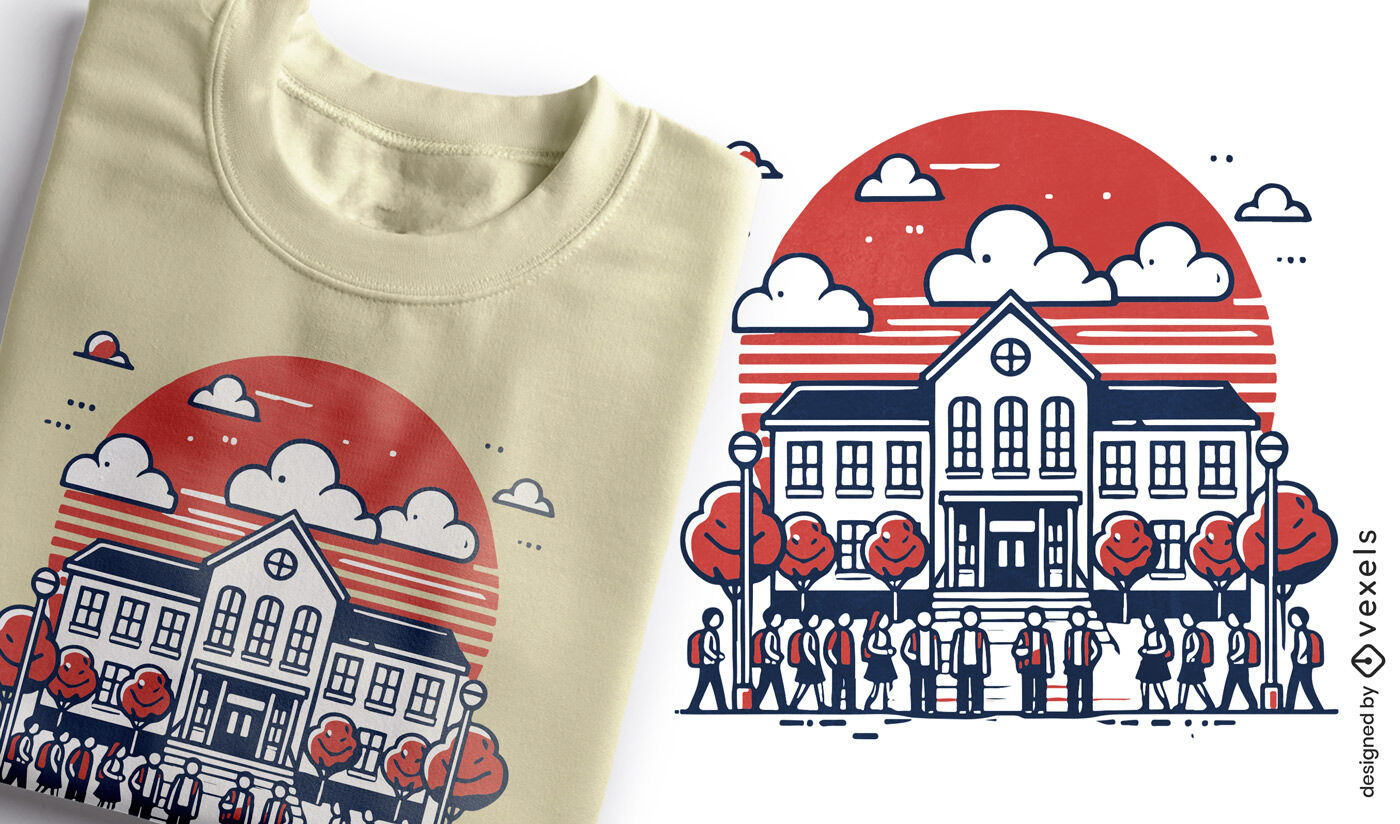
Design de camiseta com cena de pr?dio escolar
Escolha uma pasta
Todos os favoritos
Criar novo
Salvar
Design de camiseta com cena de pr?dio escolar
Pronto para imprimir
para Merch
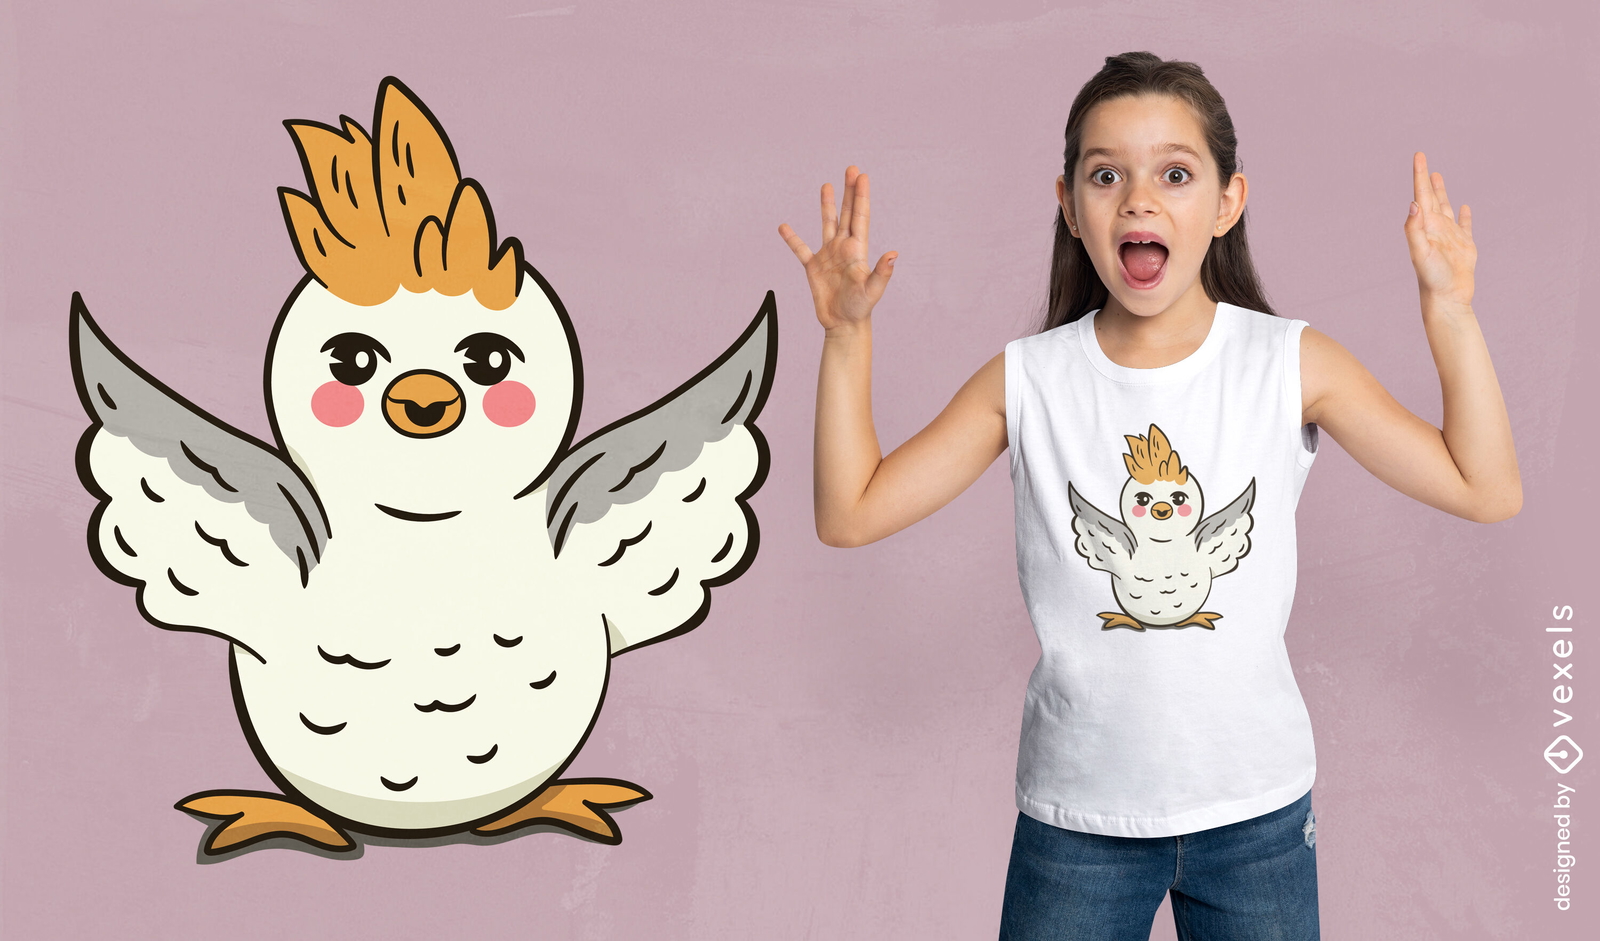
Design encantador de camiseta de calopsita de desenho animado
Escolha uma pasta
Todos os favoritos
Criar novo
Salvar
Design encantador de camiseta de calopsita de desenho animado
Impulsione seu negócio
Com a plataforma gráfica líder de mercado.
Ver planos
Próxima
do 546
prev page
next page