Biblioteca de design
Novos designs Merch
Camisetas
Vectores
Designs de Merch de Tendência
PNGs & SVGs
Mockups
Modelos de T-Shirt PSD
Explorar Desenhos
Designs KDP
Pôsteres
Canecas
Capas para celular
Sacos de compras
Almofadas
Ferramentas de desenho
Merch Designer
Novo!
Mockup Generator
Gerador de Design de AI
Vetorizador
Quote Generator
T-Shirt Maker (Antigo)
Ajuda
Merch Digest
Blog
Centro de Ajuda
Saiba mais sobre o Merch
Feedback
Soluções Corporativas
Empresa
Acesso à API
Estúdio de Design
Design em Lote
Preços
Carregando...
Inscrever-se
Conecte-se
Merch Vectors
graficos
Biblioteca de design
Novos designs Merch
Camisetas
Vectores
Designs de Merch de Tendência
PNGs & SVGs
Mockups
Modelos de T-Shirt PSD
Explorar Desenhos
Designs KDP
Pôsteres
Canecas
Capas para celular
Sacos de compras
Almofadas
Ferramentas de desenho
Merch Designer
Novo!
Mockup Generator
Gerador de Design de AI
Vetorizador
Quote Generator
T-Shirt Maker (Antigo)
Ajuda
Merch Digest
Blog
Centro de Ajuda
Saiba mais sobre o Merch
Feedback
Soluções Corporativas
Empresa
Acesso à API
Estúdio de Design
Design em Lote
PLANOS
Merch Vectors
graficos
27291 Designs Vetoriais de graficos para Camisetas e Merch
Baixar e comprar Designs Vetoriais AI de graficos para Camisetas, Capas do Celular, Capas do Livros e outros produtos Merch
Relacionado:
graficos vetoriais
,
desenhos graficos de ações
,
graficos tridimensionais
Ordenar por
Mais relevante
Resultados patrocinados da
Ganhe 15% de desconto com o código: VEXELS15
veja mais detalhes
texto editável
Pronto para imprimir
para Merch
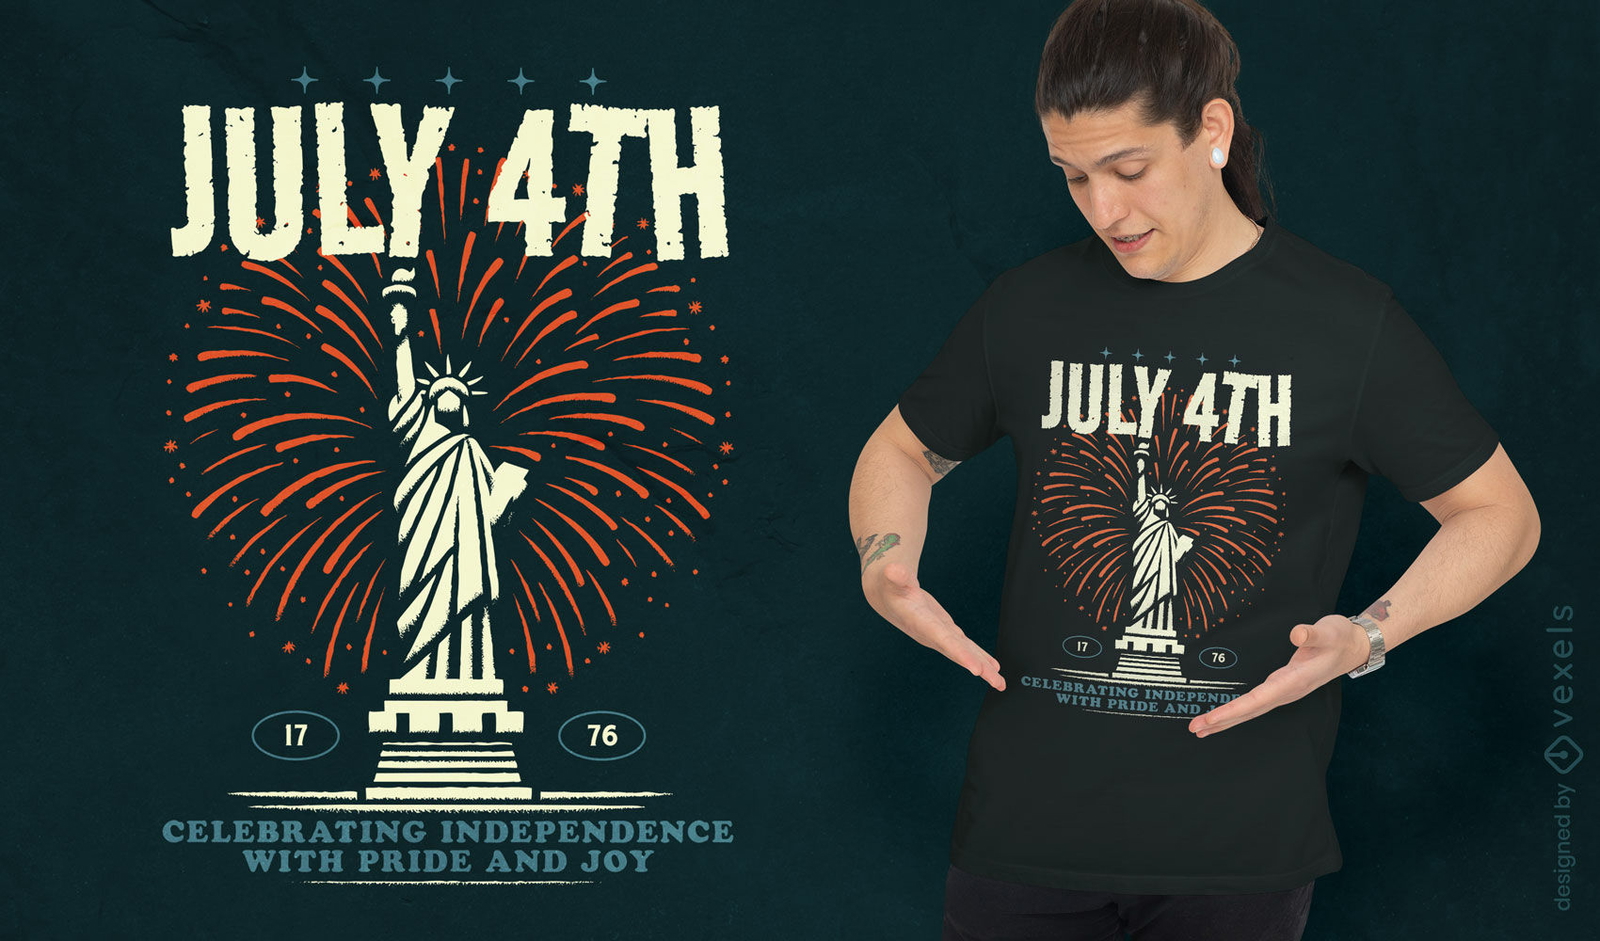
Design de camiseta com fogos de artif?cio para 4 de julho
Escolha uma pasta
Todos os favoritos
Criar novo
Salvar
Design de camiseta com fogos de artif?cio para 4 de julho
Gerado por IA, selecionado por nossos designers.
para Merch
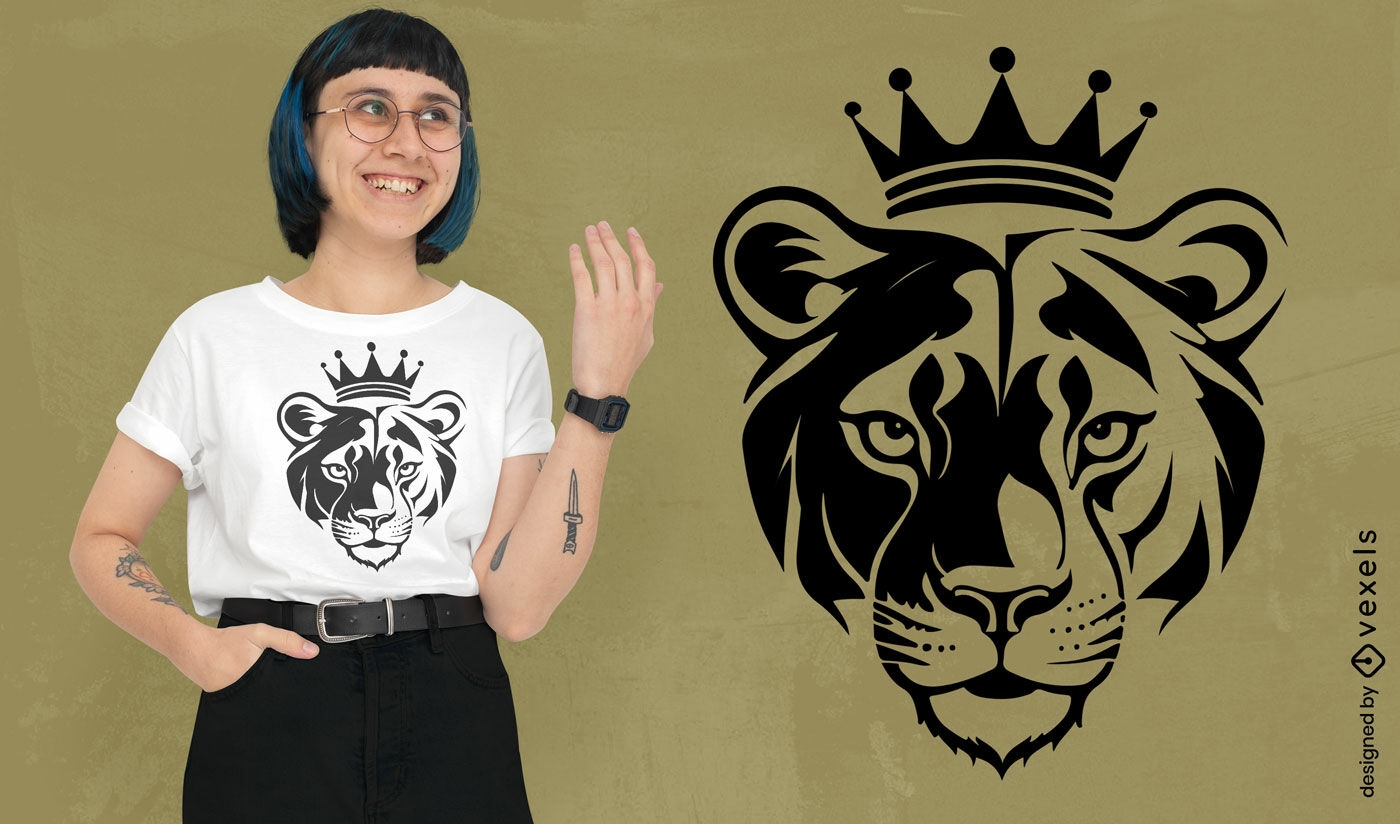
Design de camiseta com coroa de leoa rainha
Escolha uma pasta
Todos os favoritos
Criar novo
Salvar
Design de camiseta com coroa de leoa rainha
Gerado por IA, selecionado por nossos designers.
para Merch
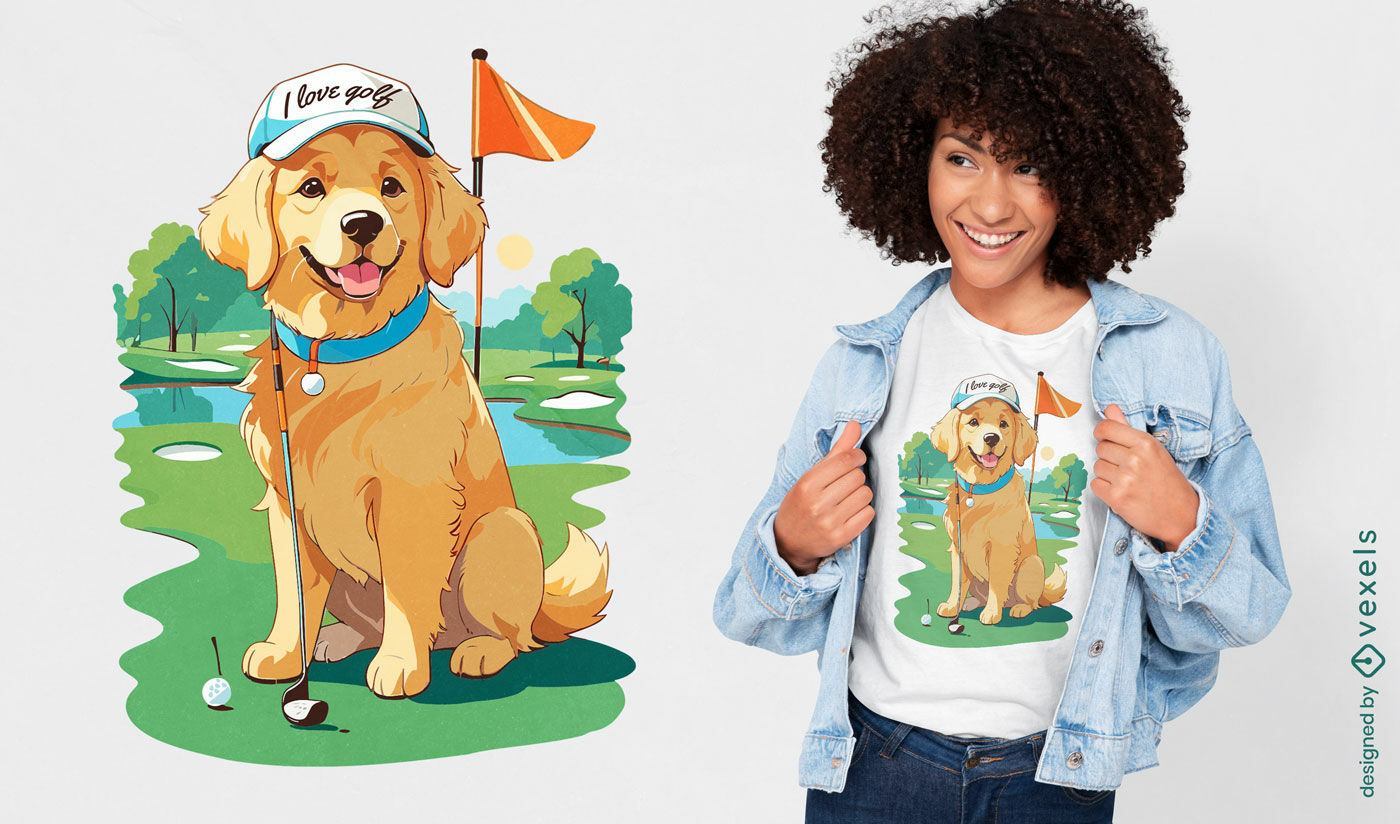
Design de camiseta com ilustra??o de cachorro de golfe
Escolha uma pasta
Todos os favoritos
Criar novo
Salvar
Design de camiseta com ilustra??o de cachorro de golfe
Pronto para imprimir
para Merch
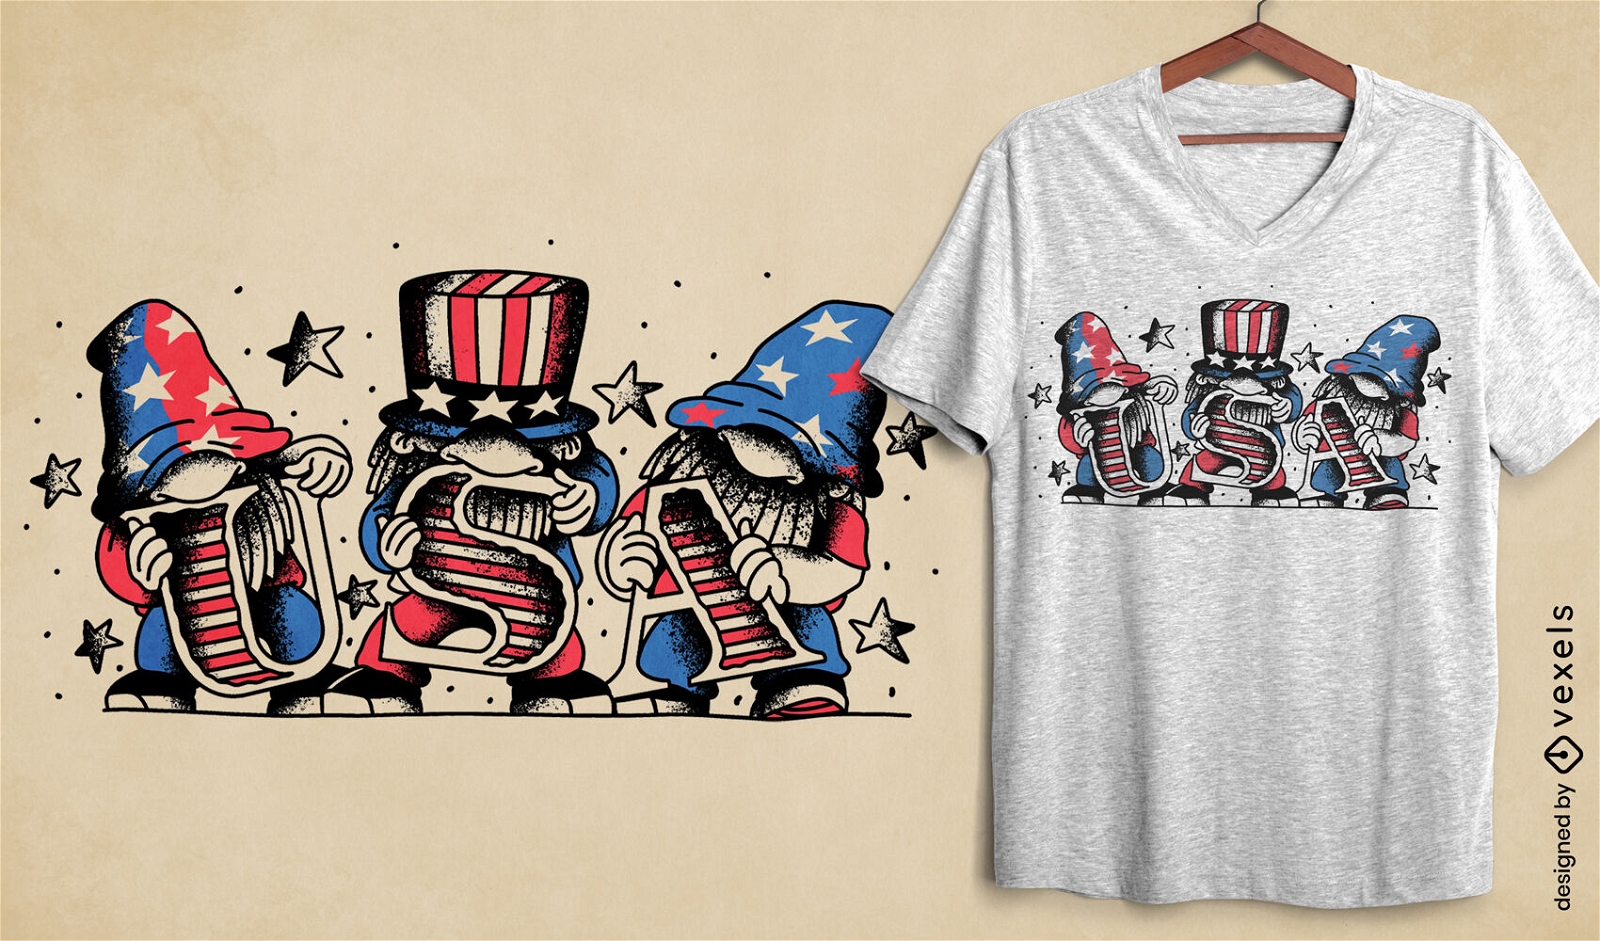
Design de camiseta dos gnomos dos EUA em 4 de julho
Escolha uma pasta
Todos os favoritos
Criar novo
Salvar
Design de camiseta dos gnomos dos EUA em 4 de julho
Pronto para imprimir
para Merch
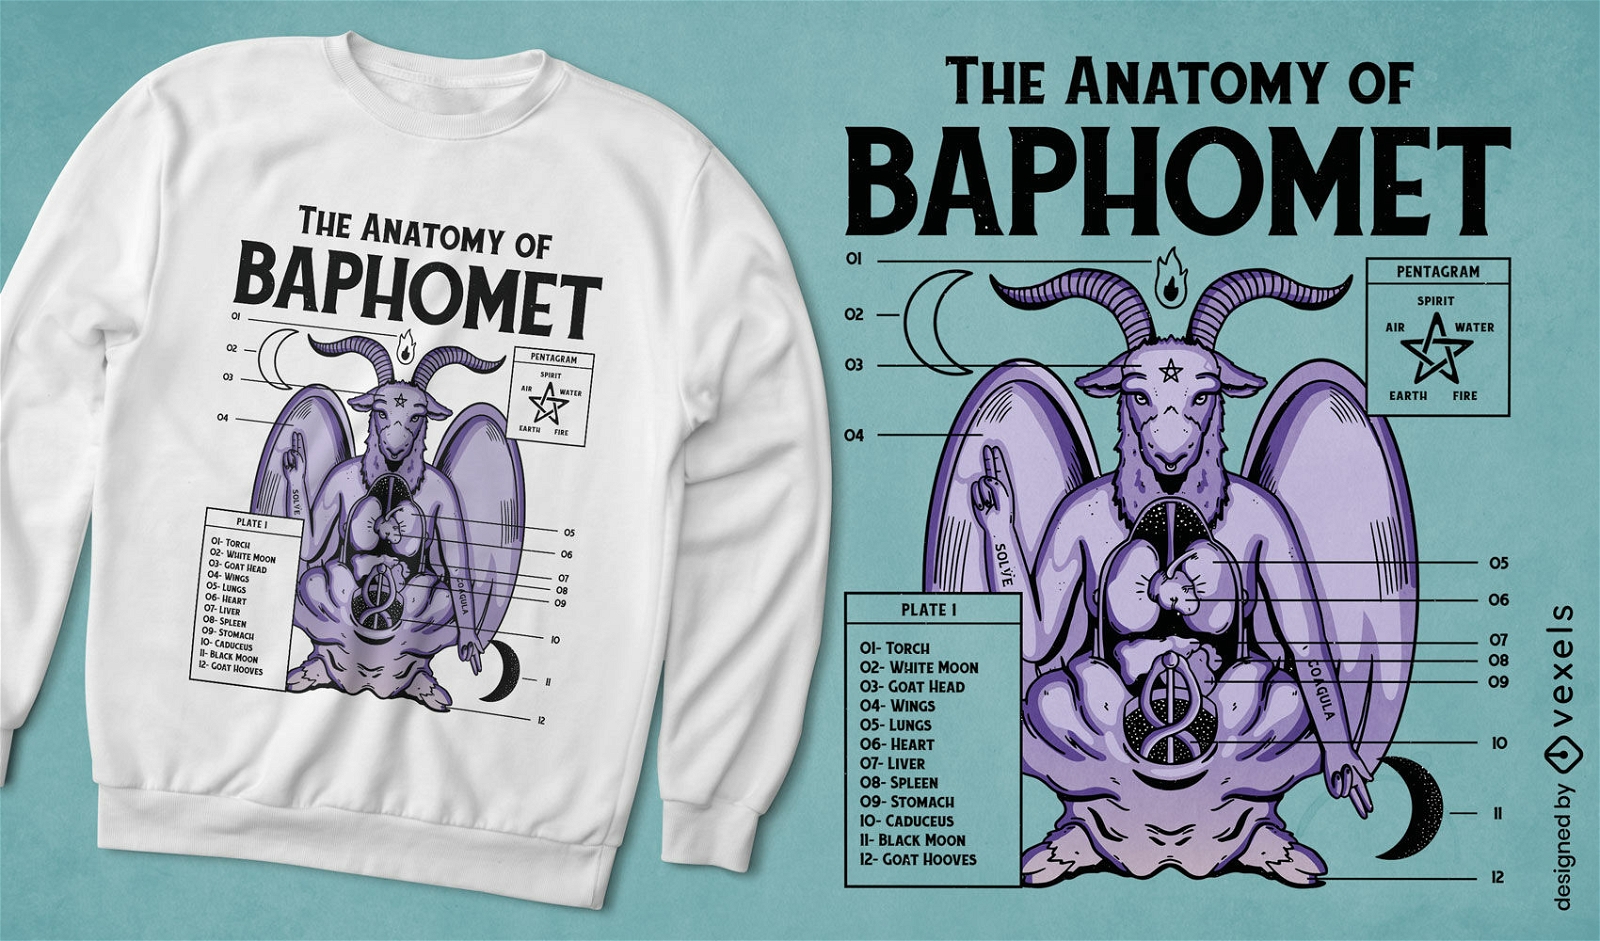
Design de camiseta de divindade de anatomia Baphomet
Escolha uma pasta
Todos os favoritos
Criar novo
Salvar
Design de camiseta de divindade de anatomia Baphomet
Pronto para imprimir
para Merch
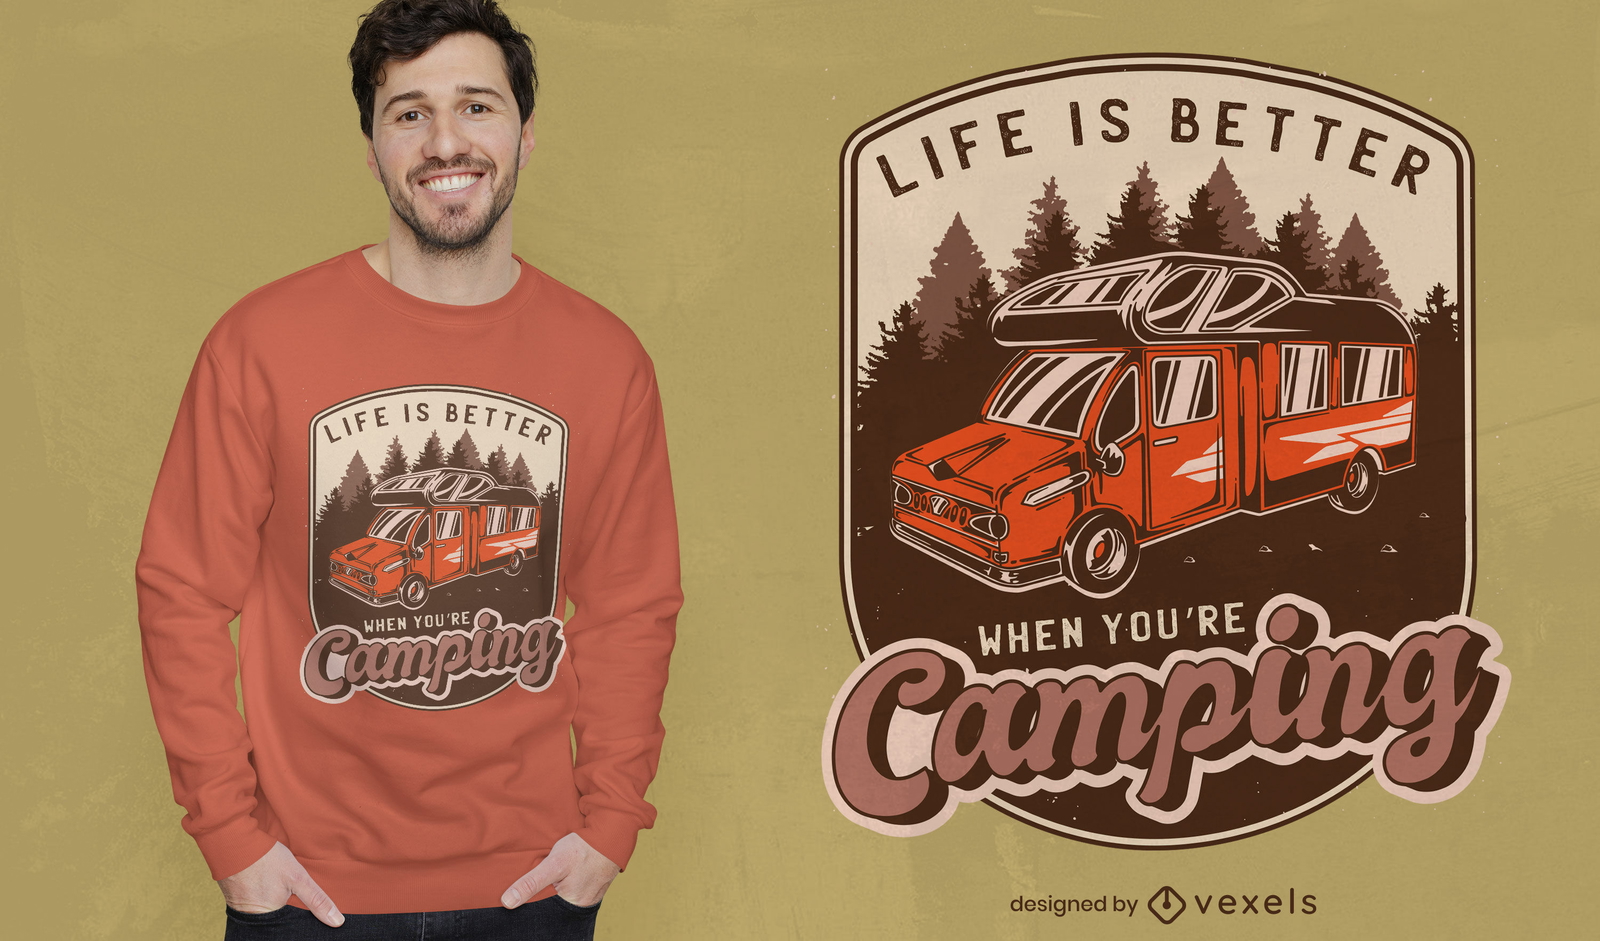
Design de t-shirt com crachá vintage para camionete camping
Escolha uma pasta
Todos os favoritos
Criar novo
Salvar
Design de t-shirt com crachá vintage para camionete camping
Pronto para imprimir
para Merch
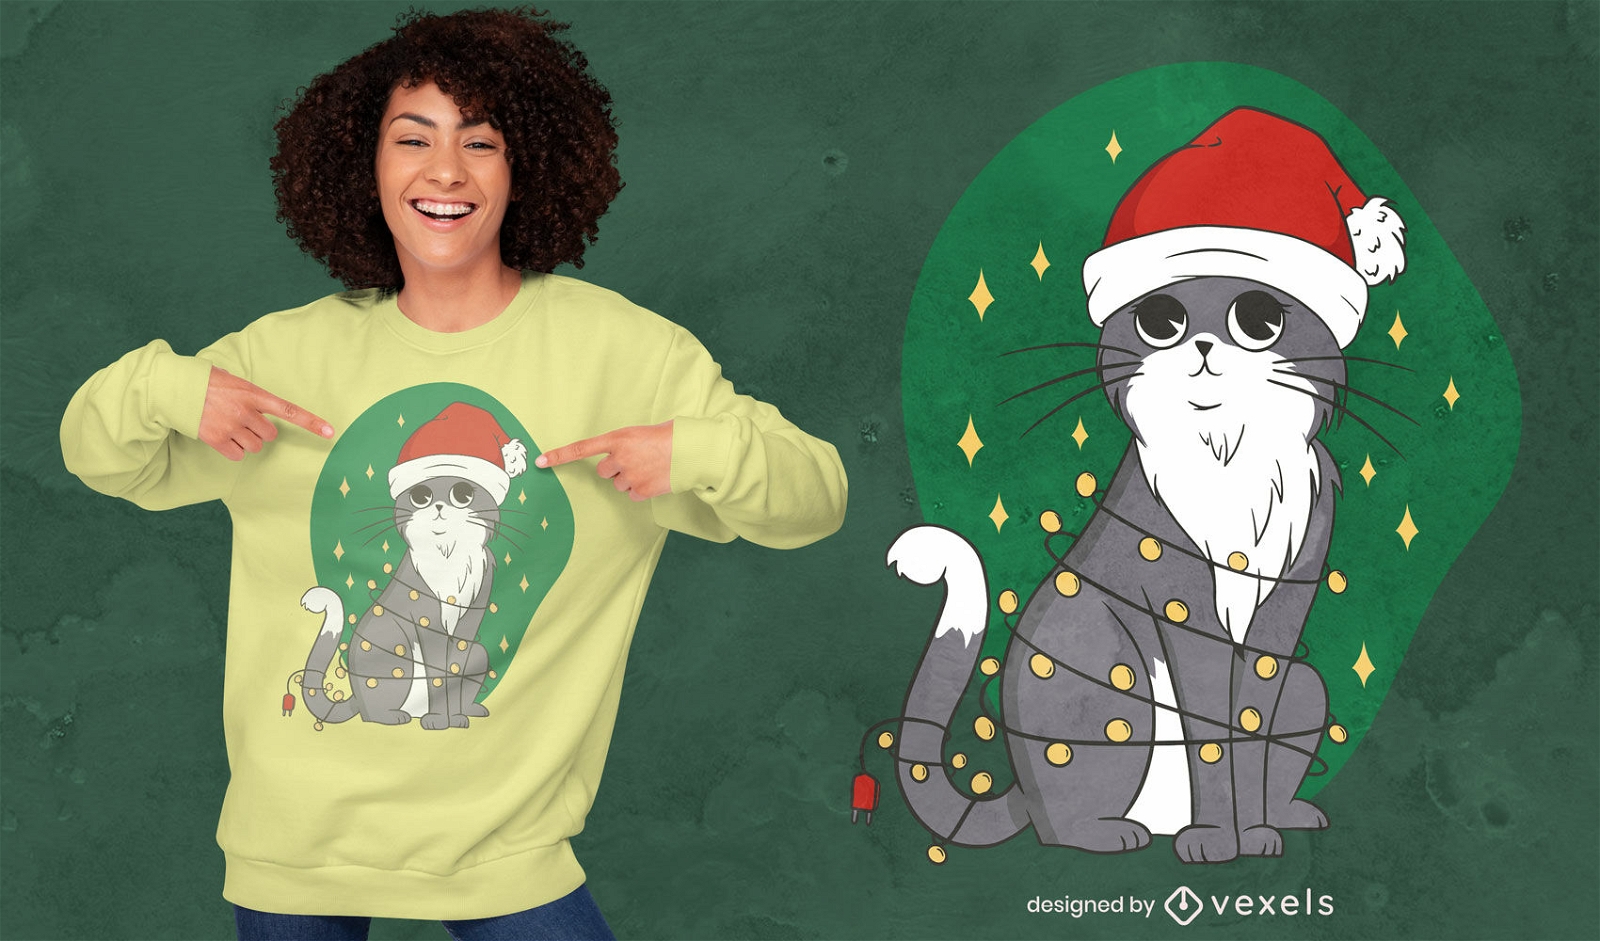
Gato com design de camiseta de luzes de fada
Escolha uma pasta
Todos os favoritos
Criar novo
Salvar
Gato com design de camiseta de luzes de fada
Pronto para imprimir
para Merch
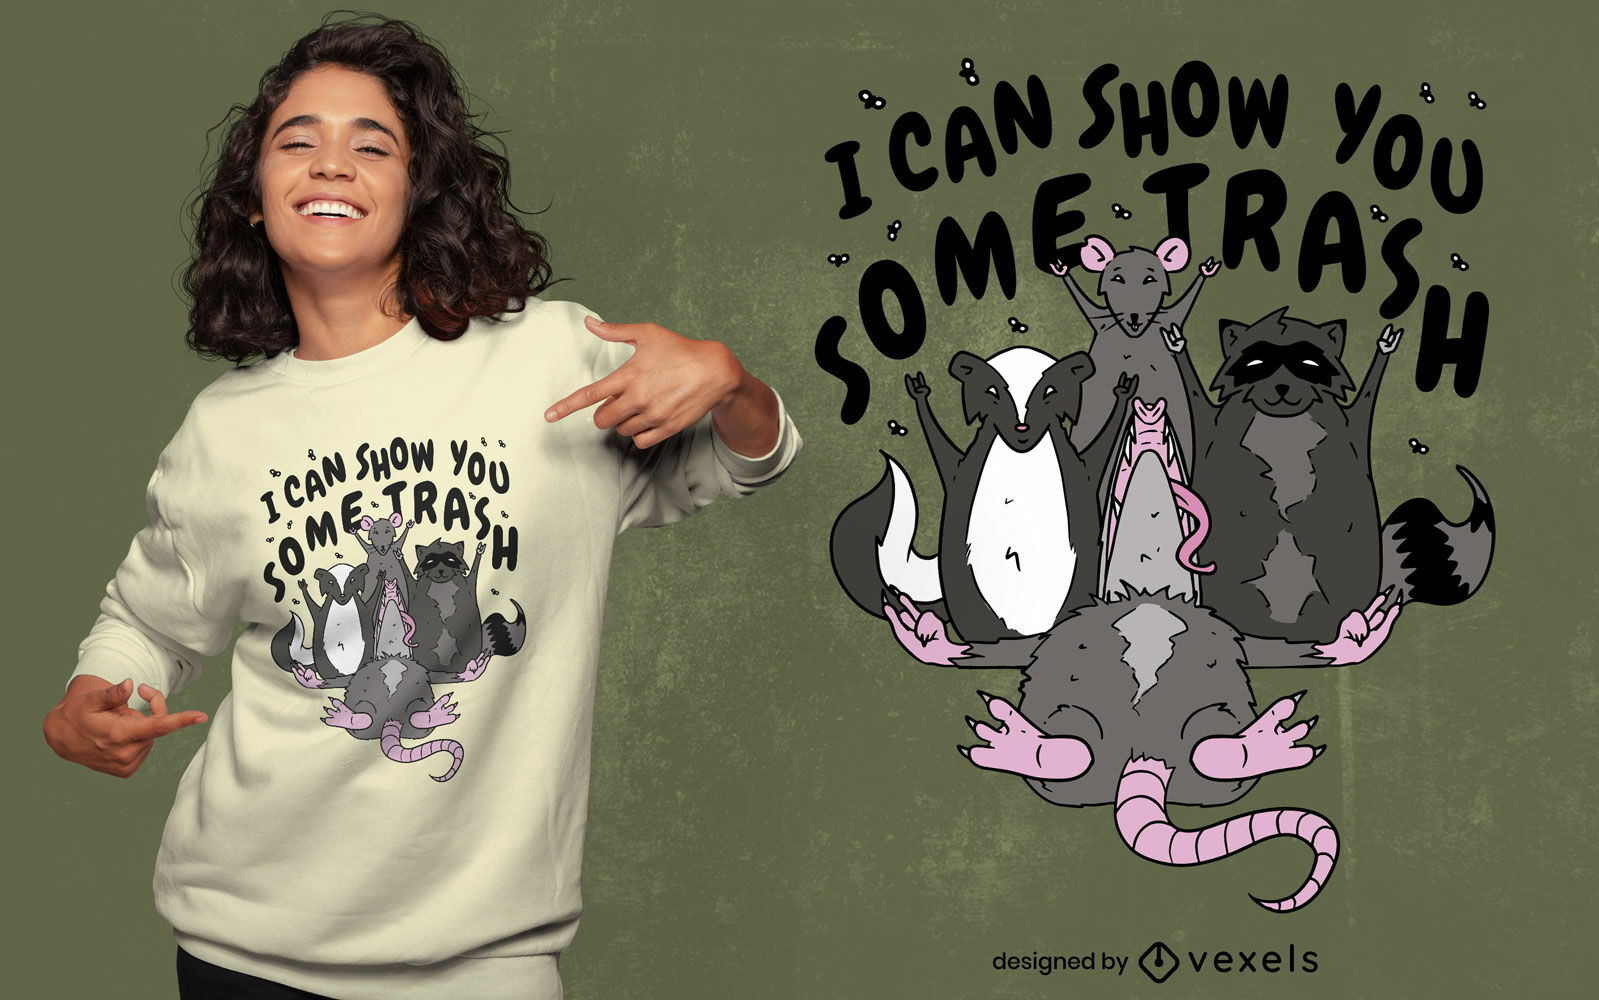
Design engraçado de camisetas de animais de lixo
Escolha uma pasta
Todos os favoritos
Criar novo
Salvar
Design engraçado de camisetas de animais de lixo
Pronto para imprimir
para Merch
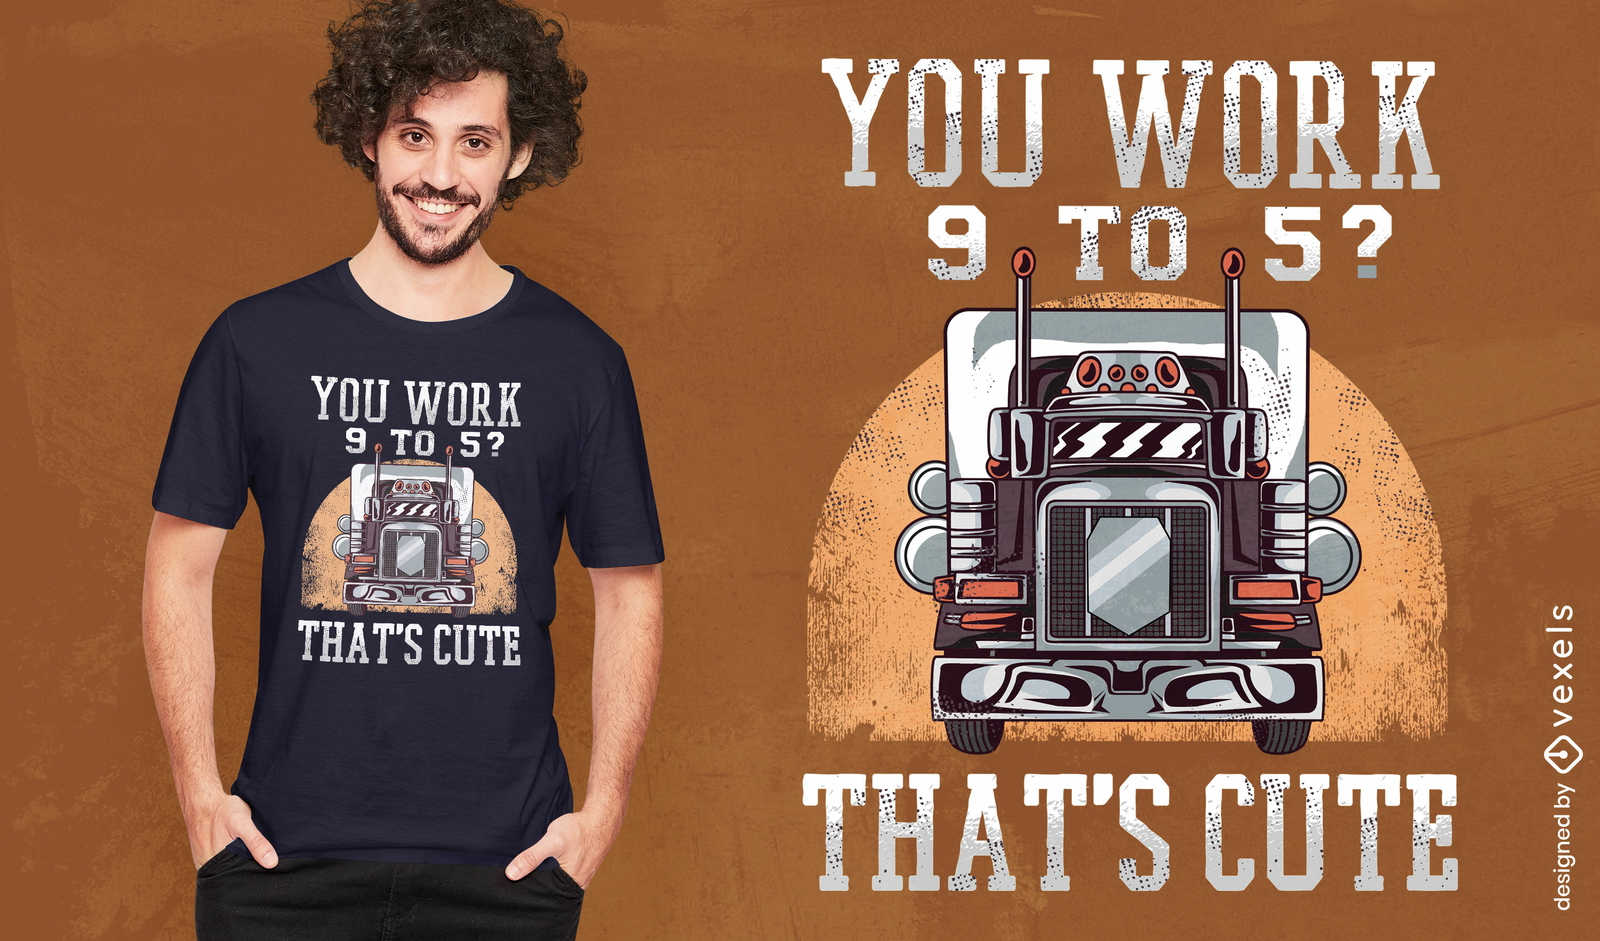
Design de camiseta de citação engraçada de trabalho de caminhoneiro
Escolha uma pasta
Todos os favoritos
Criar novo
Salvar
Design de camiseta de citação engraçada de trabalho de caminhoneiro
Pronto para imprimir
para Merch
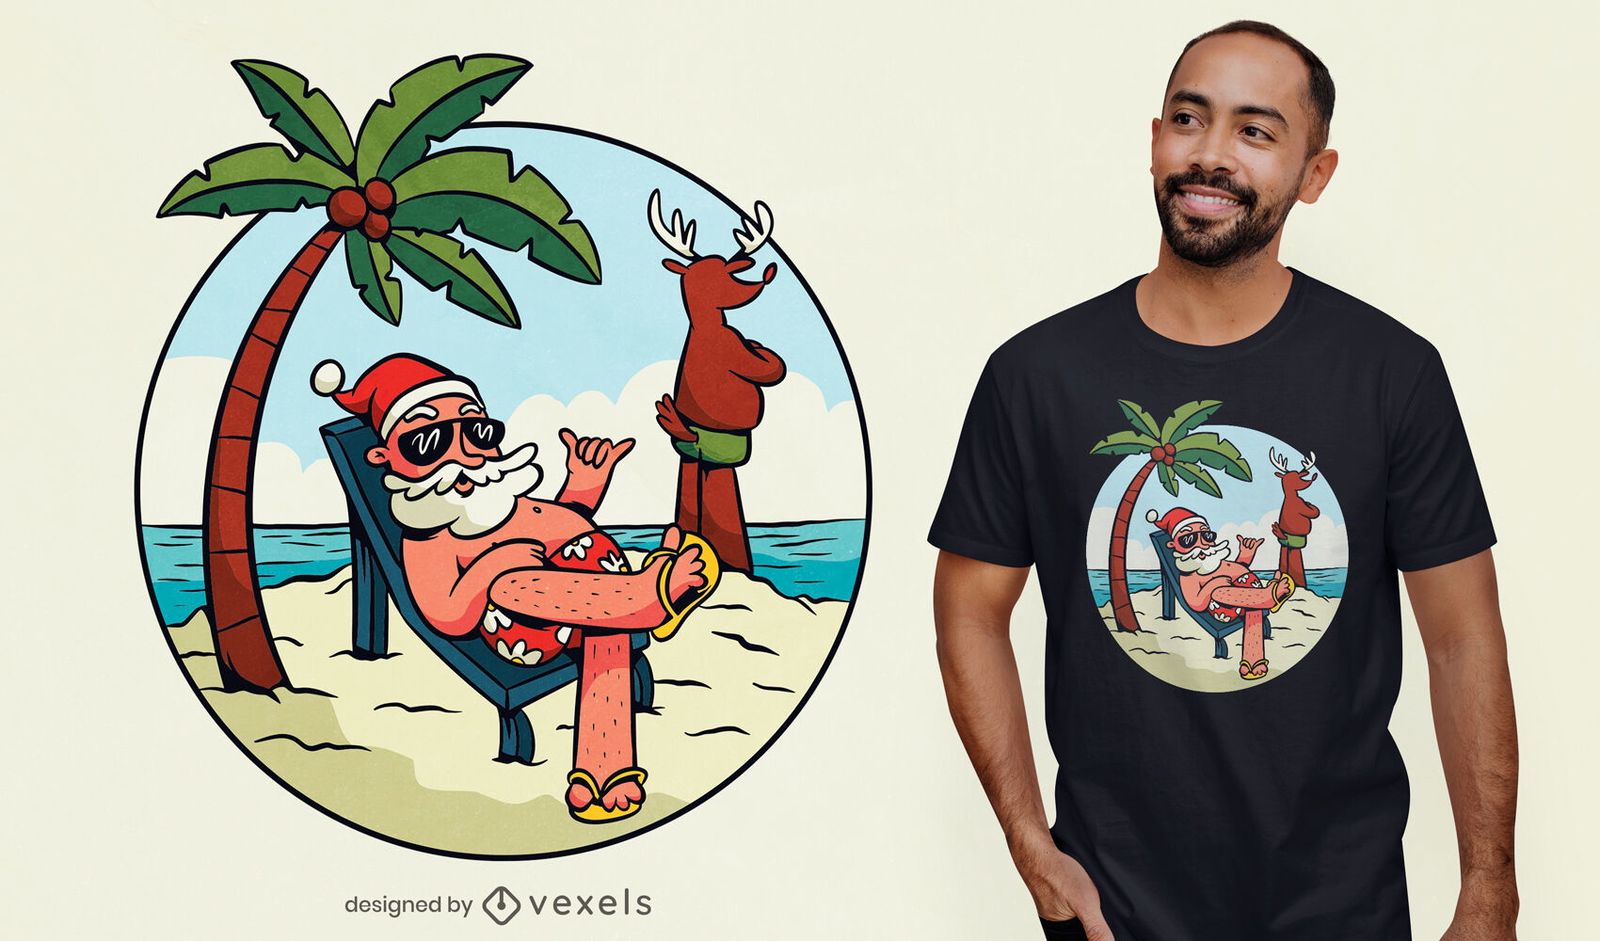
Design de t-shirt de verão praia do Pai Natal
Escolha uma pasta
Todos os favoritos
Criar novo
Salvar
Design de t-shirt de verão praia do Pai Natal
Pronto para imprimir
para Merch
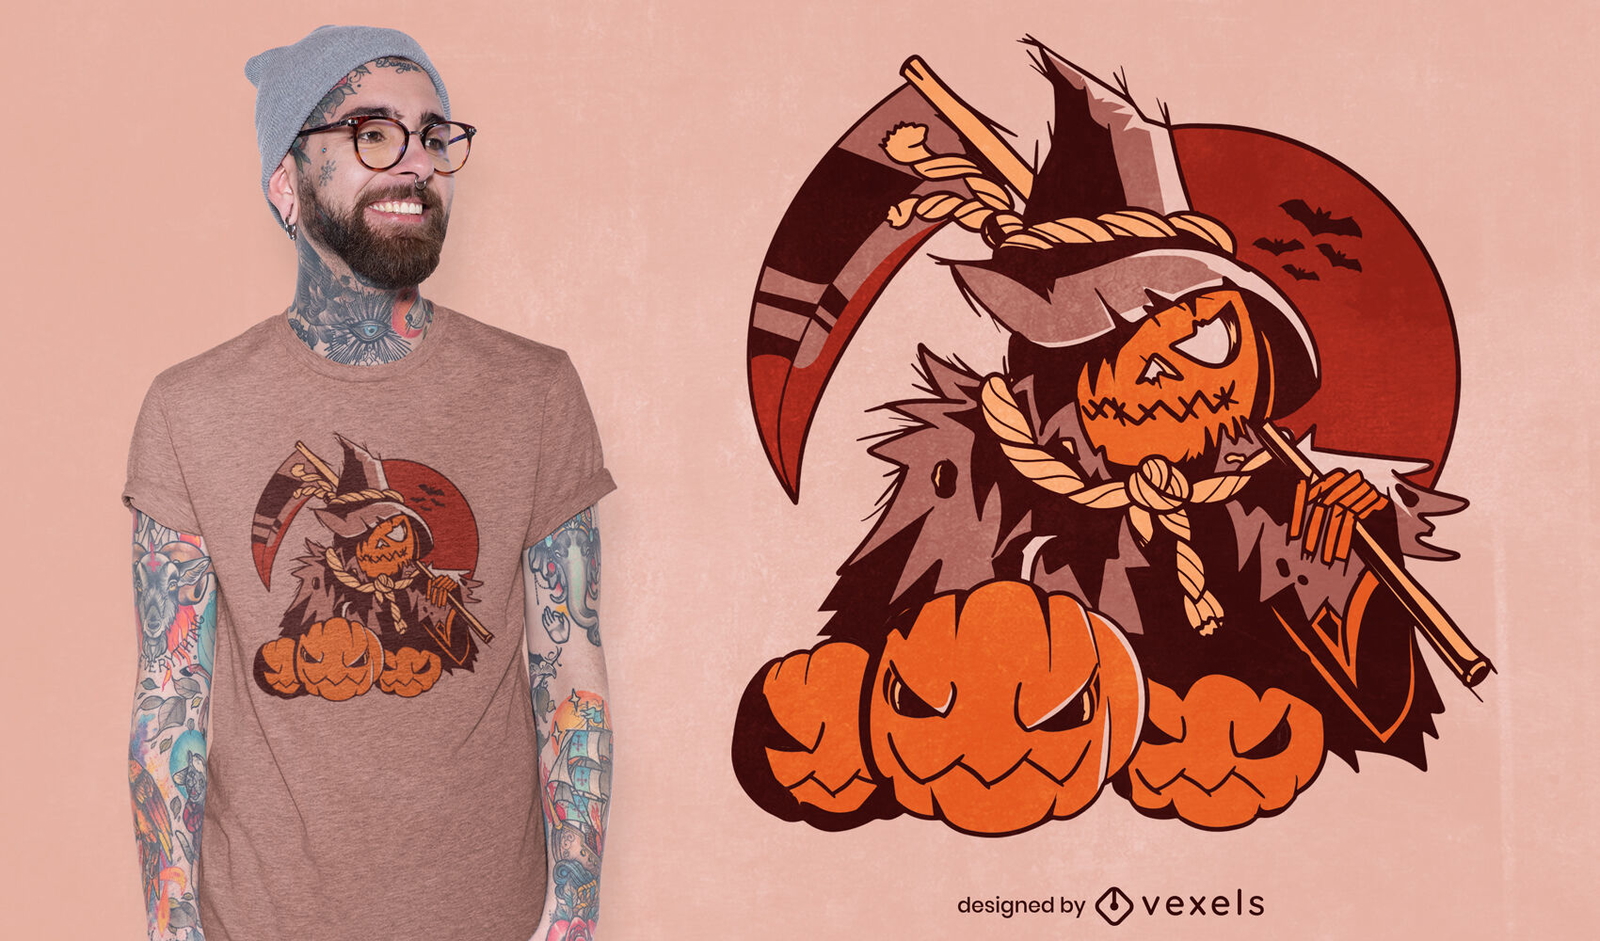
Design de t-shirt do Dia das Bruxas do Ceifador Abóbora
Escolha uma pasta
Todos os favoritos
Criar novo
Salvar
Design de t-shirt do Dia das Bruxas do Ceifador Abóbora
Pronto para imprimir
para Merch
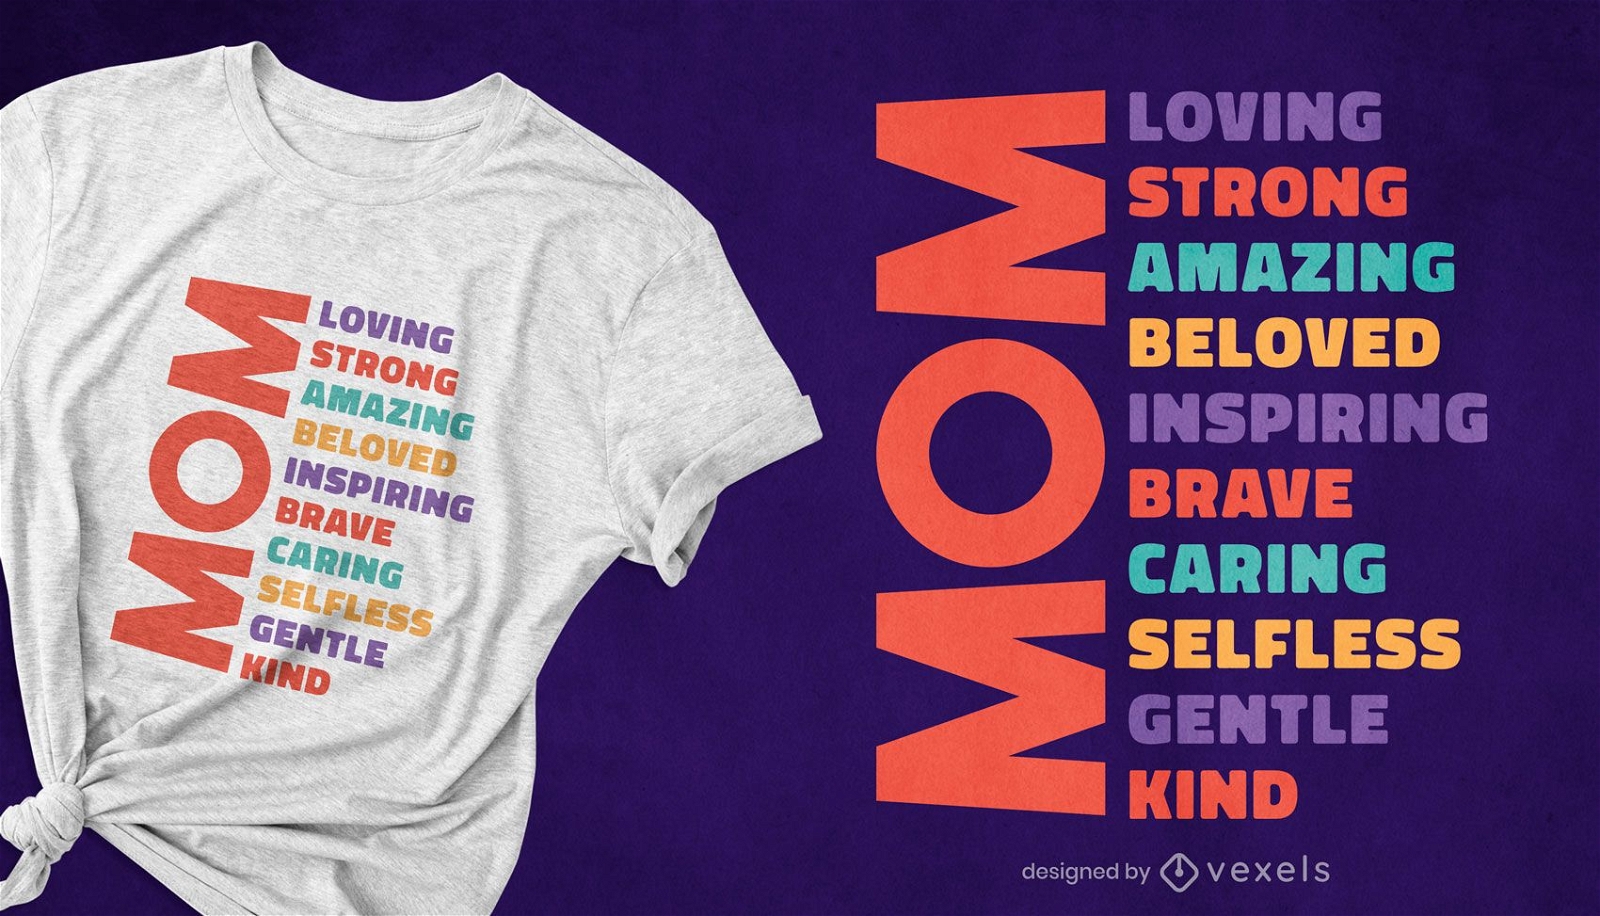
Design de camiseta com adjetivo para o dia das mães
Escolha uma pasta
Todos os favoritos
Criar novo
Salvar
Design de camiseta com adjetivo para o dia das mães
Pronto para imprimir
para Merch
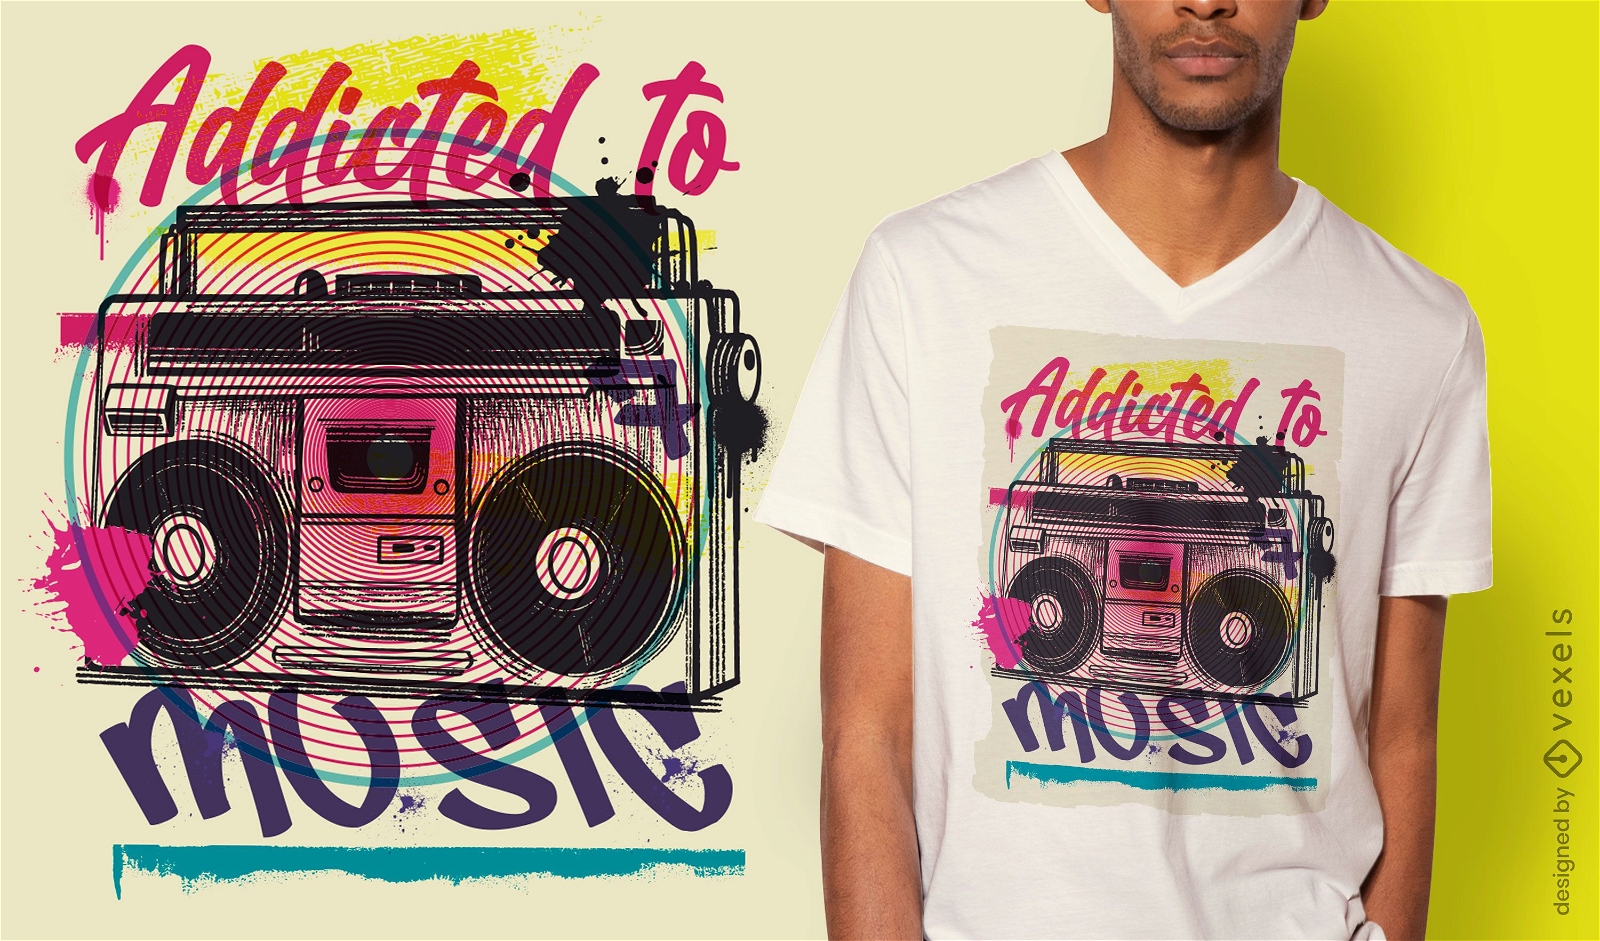
Design de camiseta de grafite urbano Boombox
Escolha uma pasta
Todos os favoritos
Criar novo
Salvar
Design de camiseta de grafite urbano Boombox
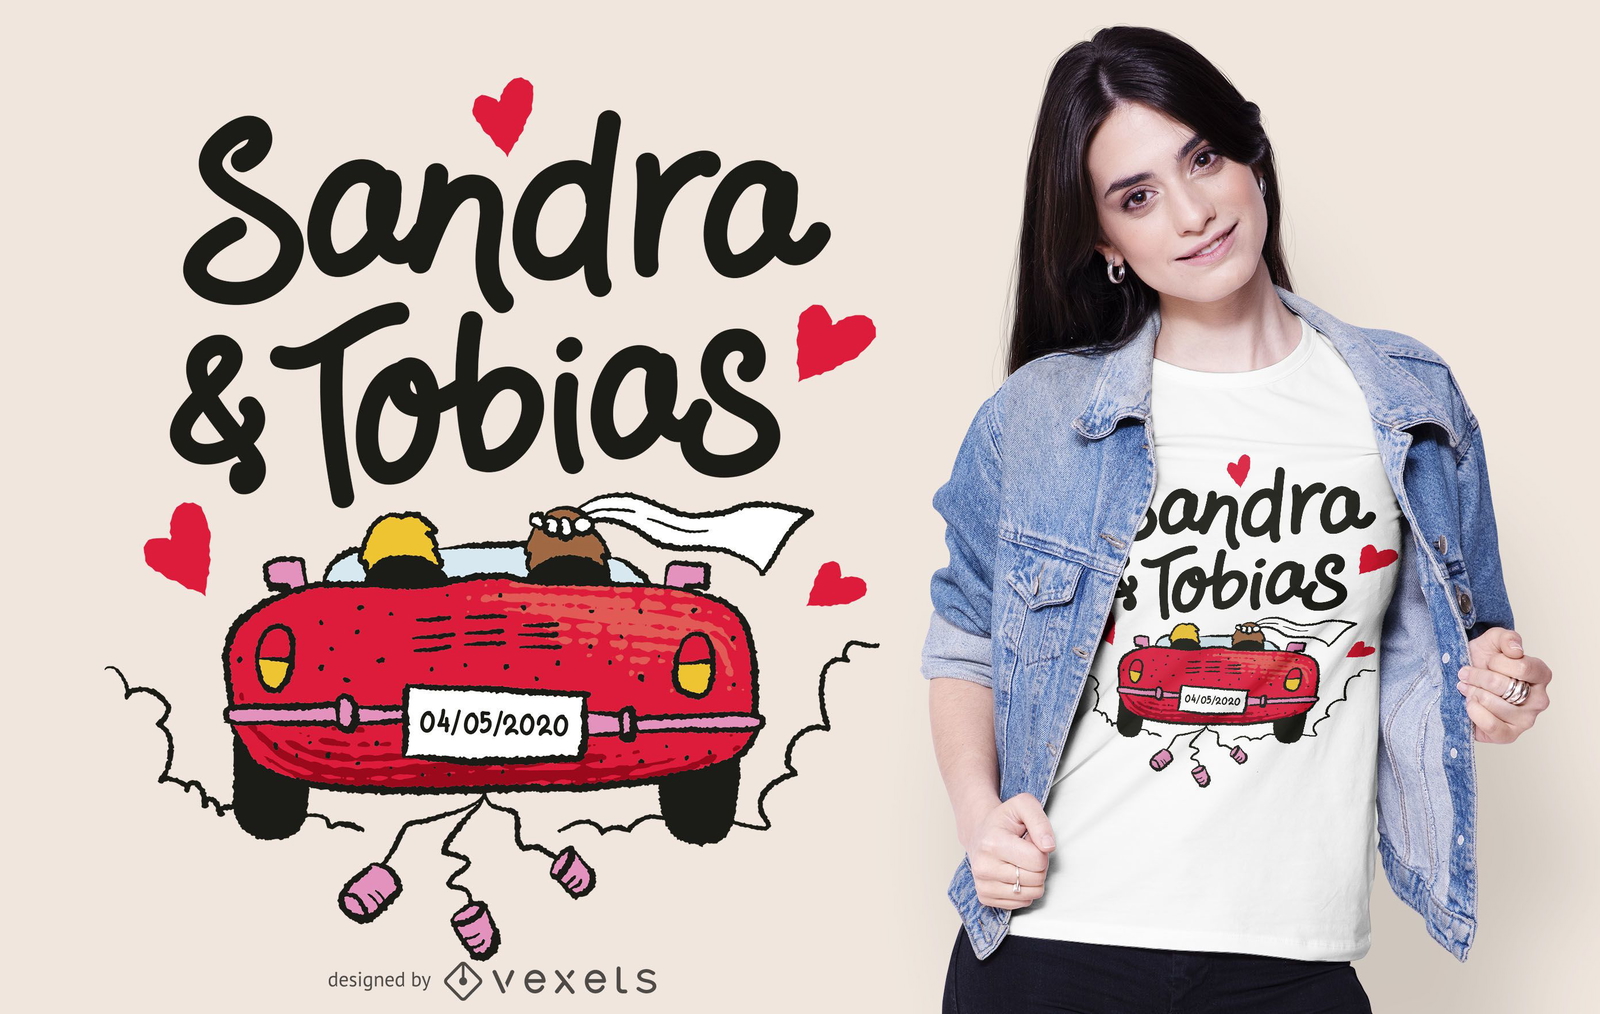
texto editável
Pronto para imprimir
para Merch
Design de t-shirt com texto de carro de casamento
Escolha uma pasta
Todos os favoritos
Criar novo
Salvar
Design de t-shirt com texto de carro de casamento
para Merch
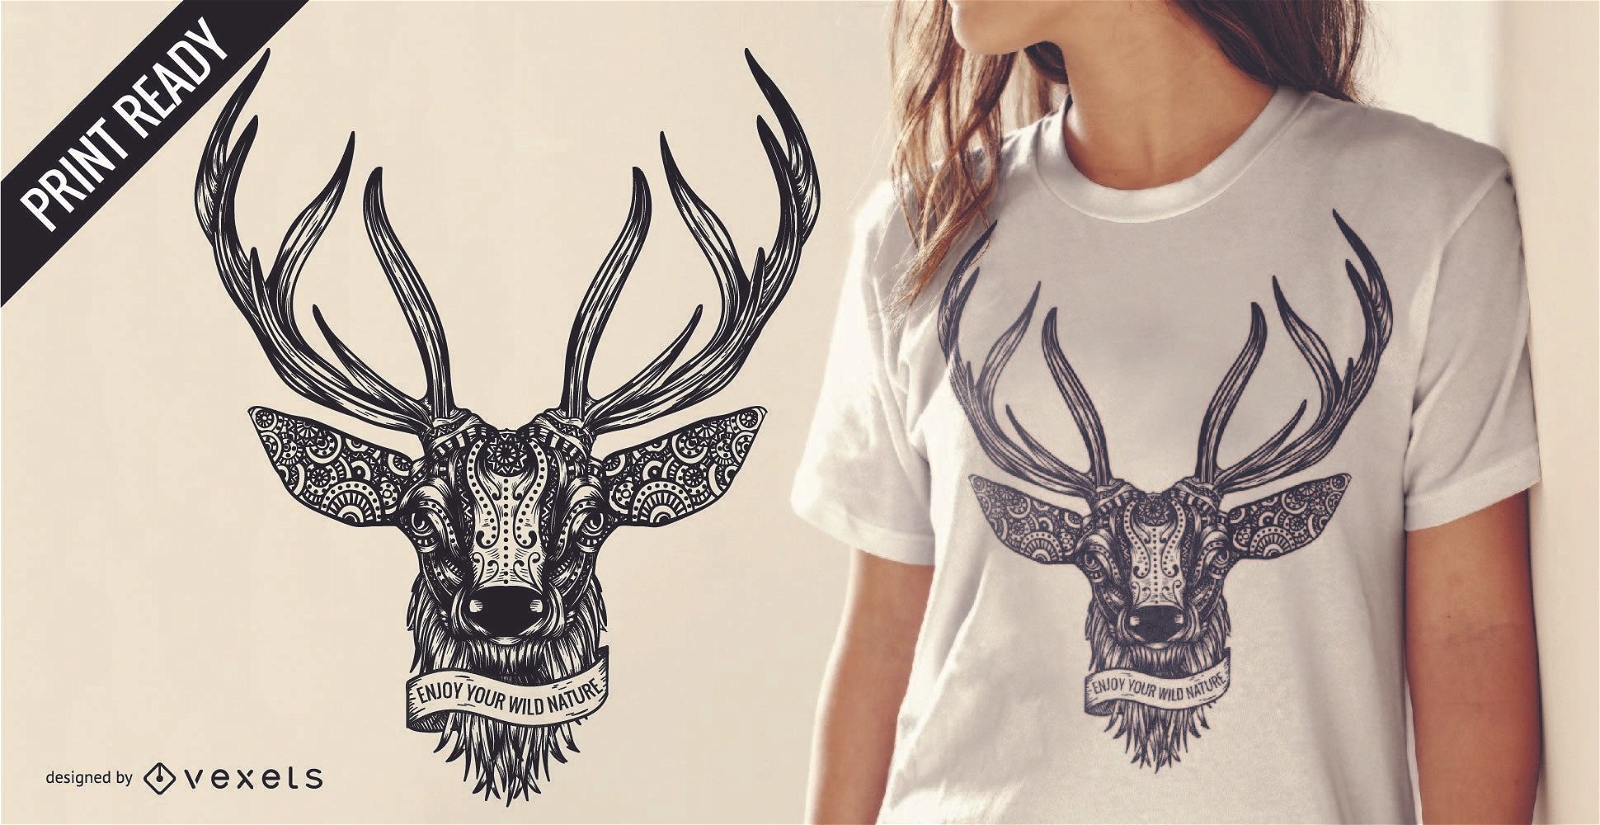
Desenho de t-shirt com ilustração de cervos com texto
Escolha uma pasta
Todos os favoritos
Criar novo
Salvar
Desenho de t-shirt com ilustração de cervos com texto
texto editável
Pronto para imprimir
para Merch
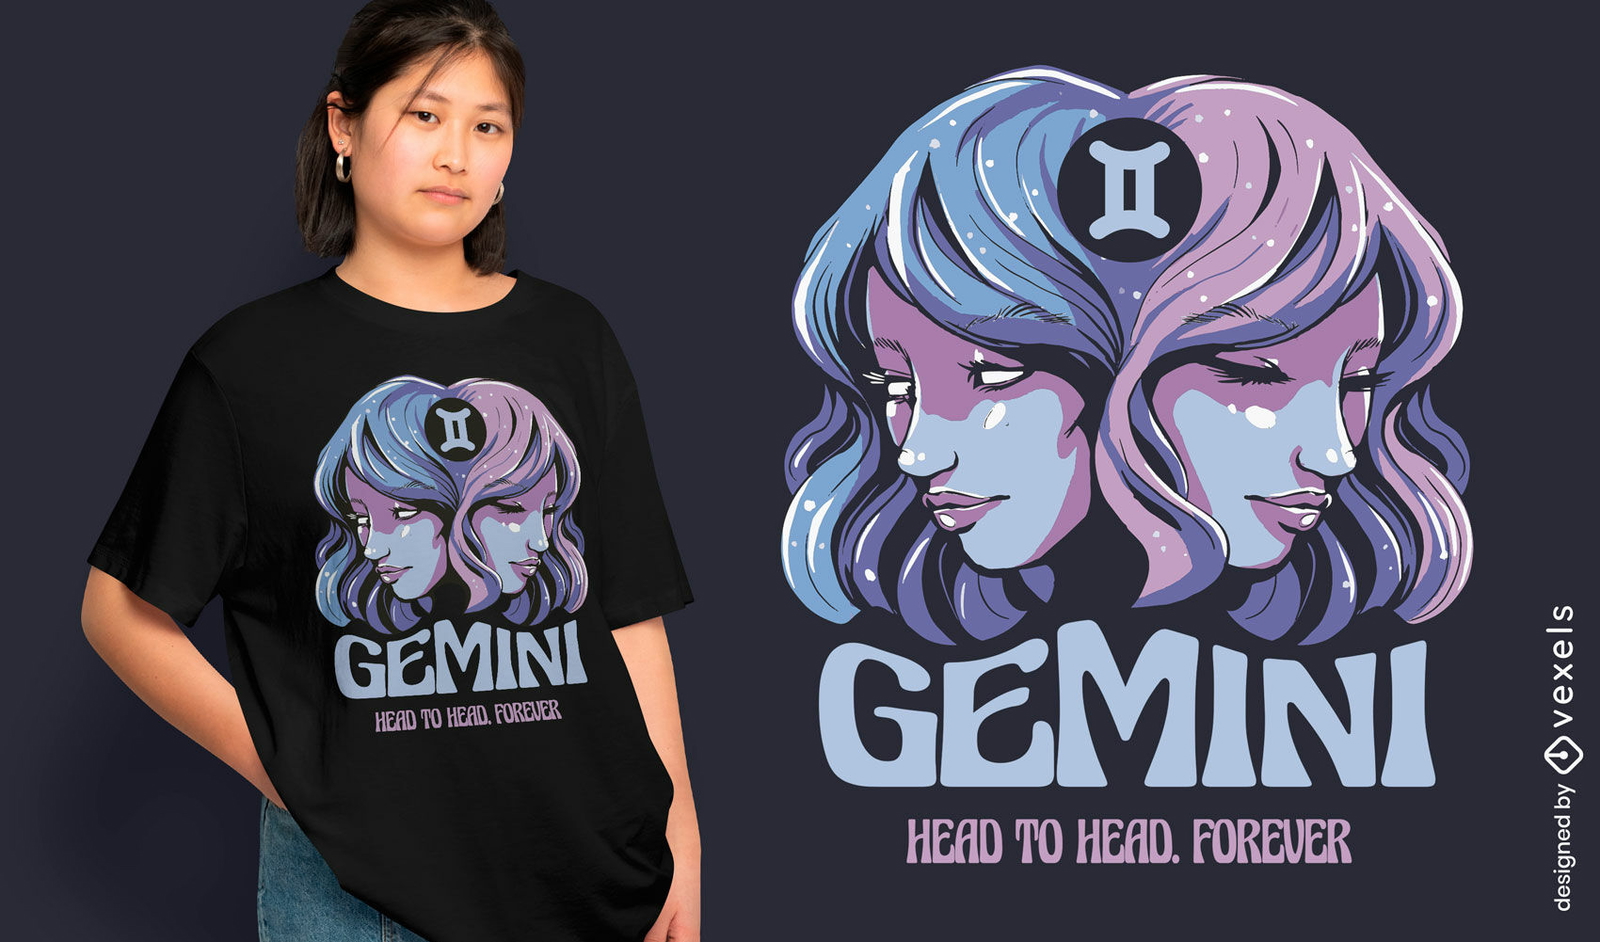
Design de camiseta com rostos gêmeos de Gêmeos
Escolha uma pasta
Todos os favoritos
Criar novo
Salvar
Design de camiseta com rostos gêmeos de Gêmeos
texto editável
Pronto para imprimir
para Merch
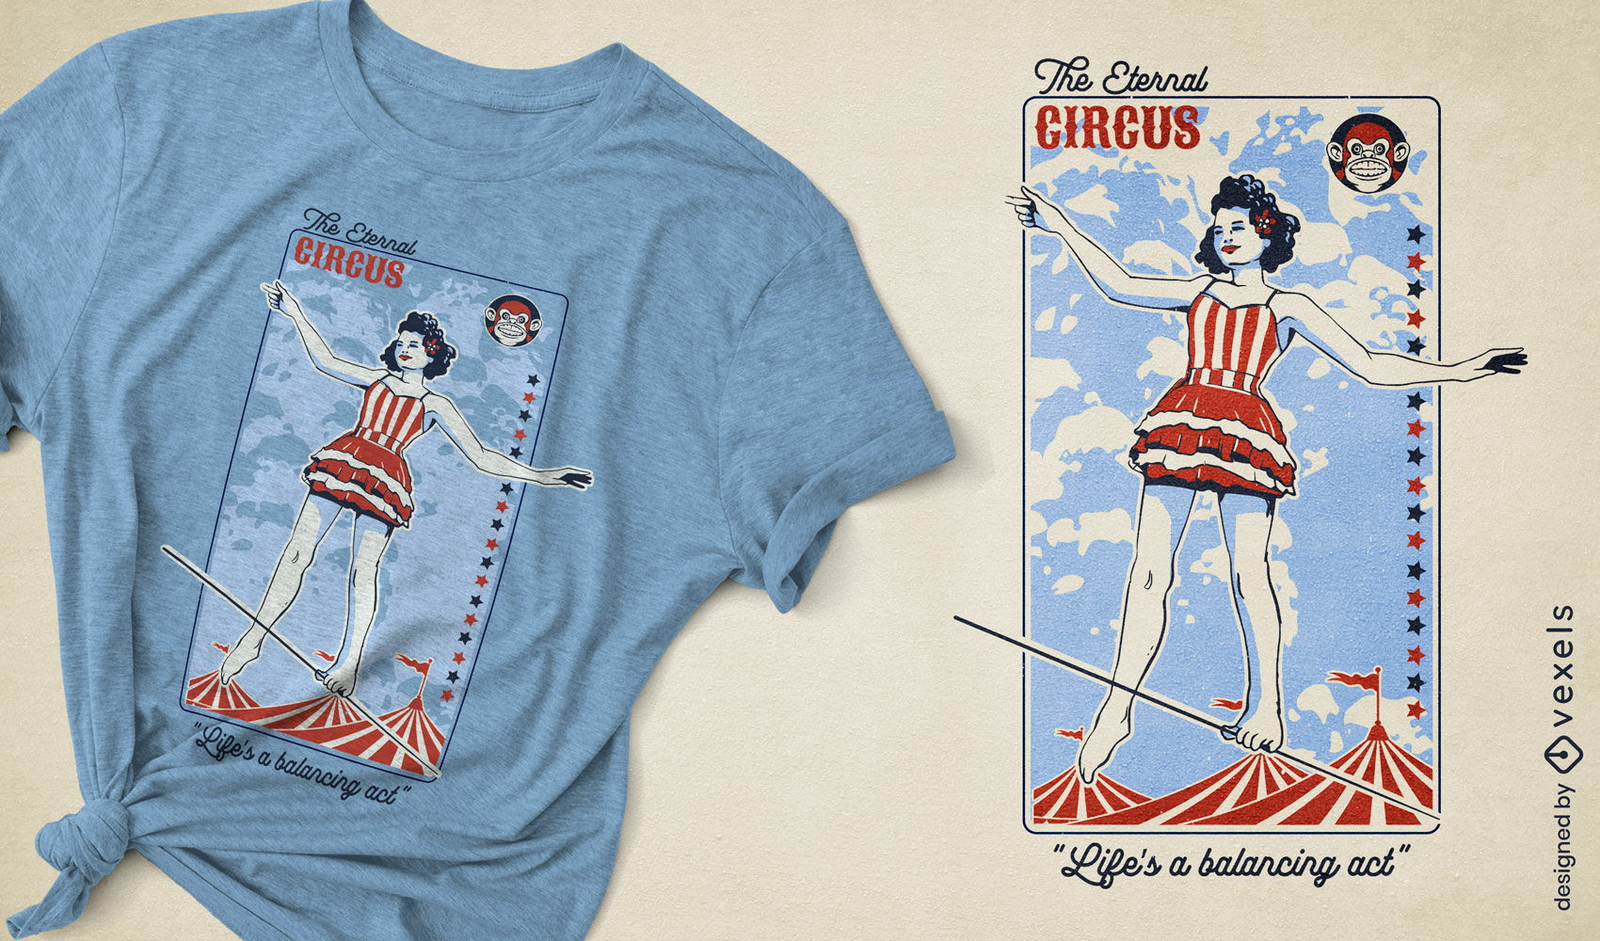
Design de camiseta vintage com figura de circo em equilíbrio
Escolha uma pasta
Todos os favoritos
Criar novo
Salvar
Design de camiseta vintage com figura de circo em equilíbrio
texto editável
Pronto para imprimir
para Merch
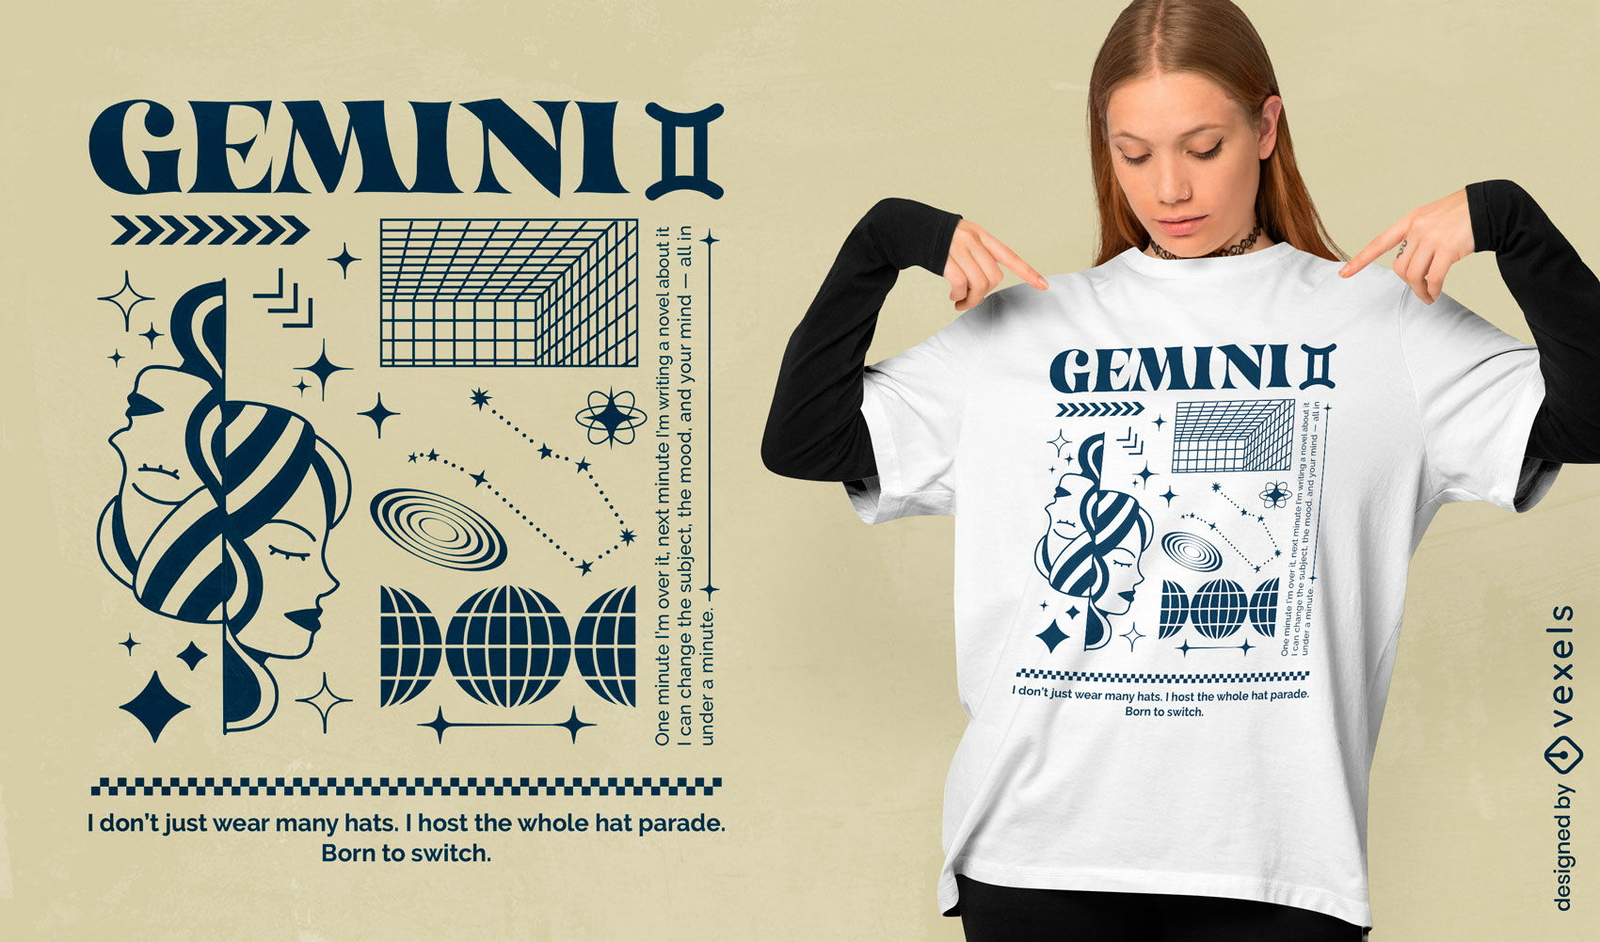
Design de camiseta streetwear com astrologia de Gêmeos
Escolha uma pasta
Todos os favoritos
Criar novo
Salvar
Design de camiseta streetwear com astrologia de Gêmeos
Gerado por IA, selecionado por nossos designers.
para Merch
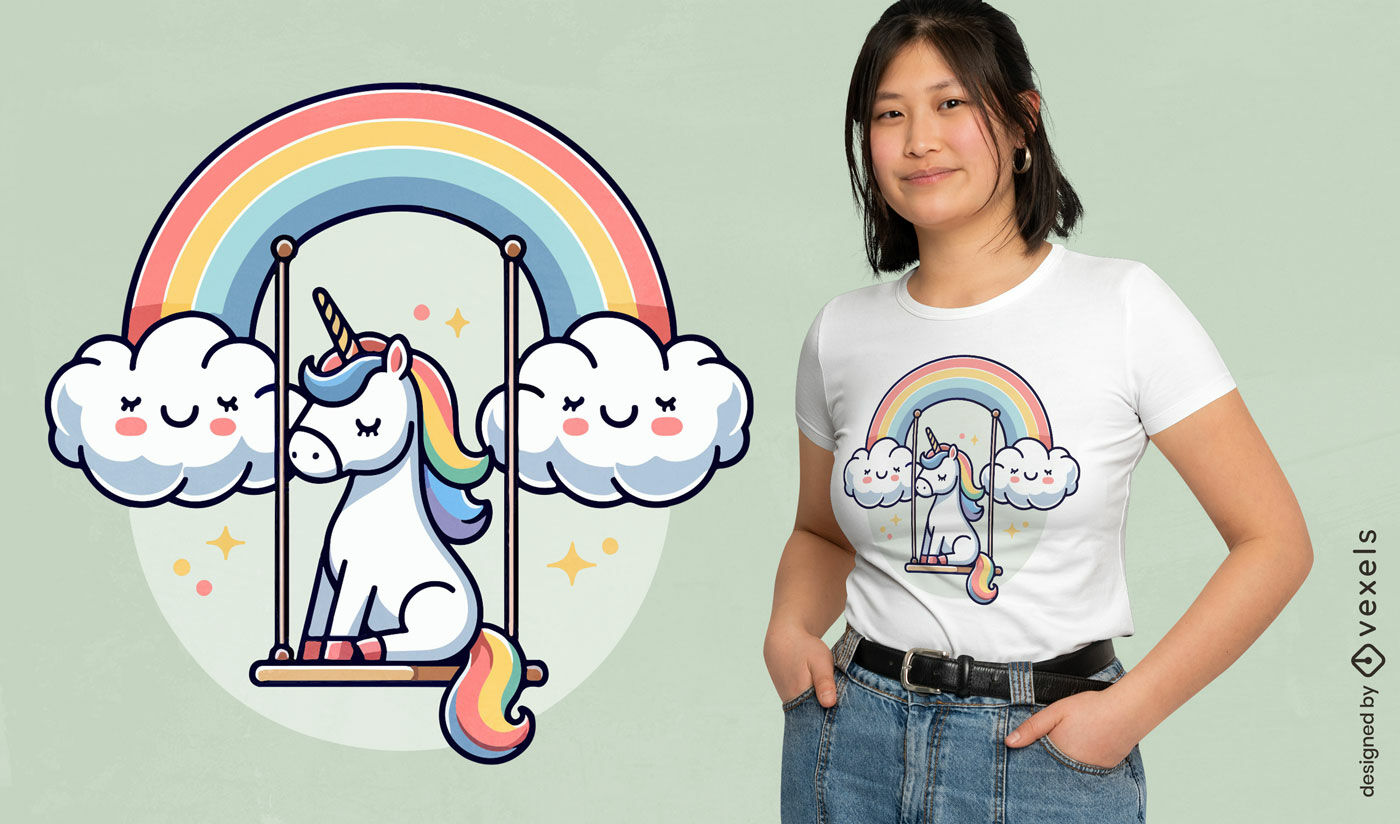
Design de camiseta mágica de balanço de unicórnio
Escolha uma pasta
Todos os favoritos
Criar novo
Salvar
Design de camiseta mágica de balanço de unicórnio
Gerado por IA, selecionado por nossos designers.
para Merch
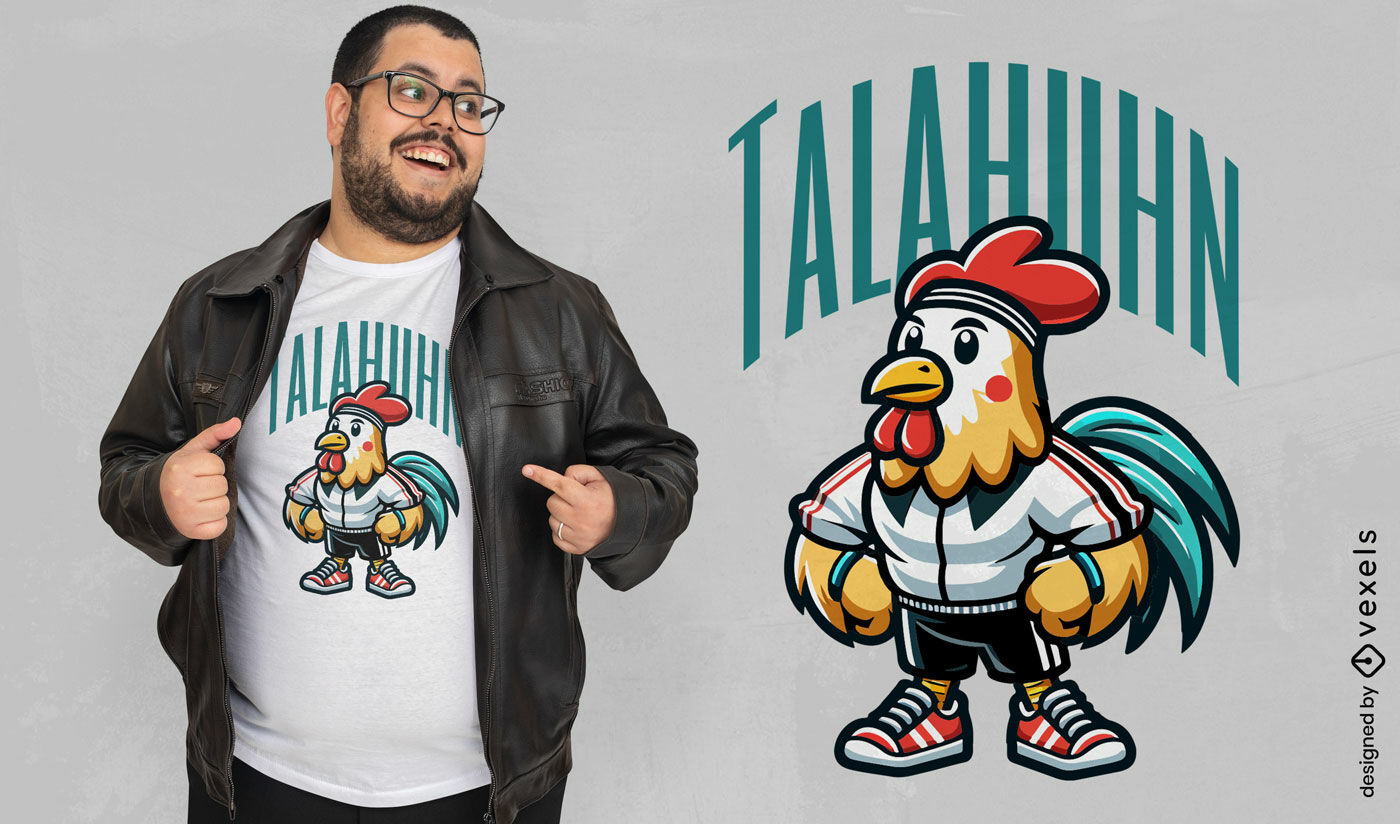
Design de camiseta com mascote do galo urbano
Escolha uma pasta
Todos os favoritos
Criar novo
Salvar
Design de camiseta com mascote do galo urbano
Pronto para imprimir
para Merch
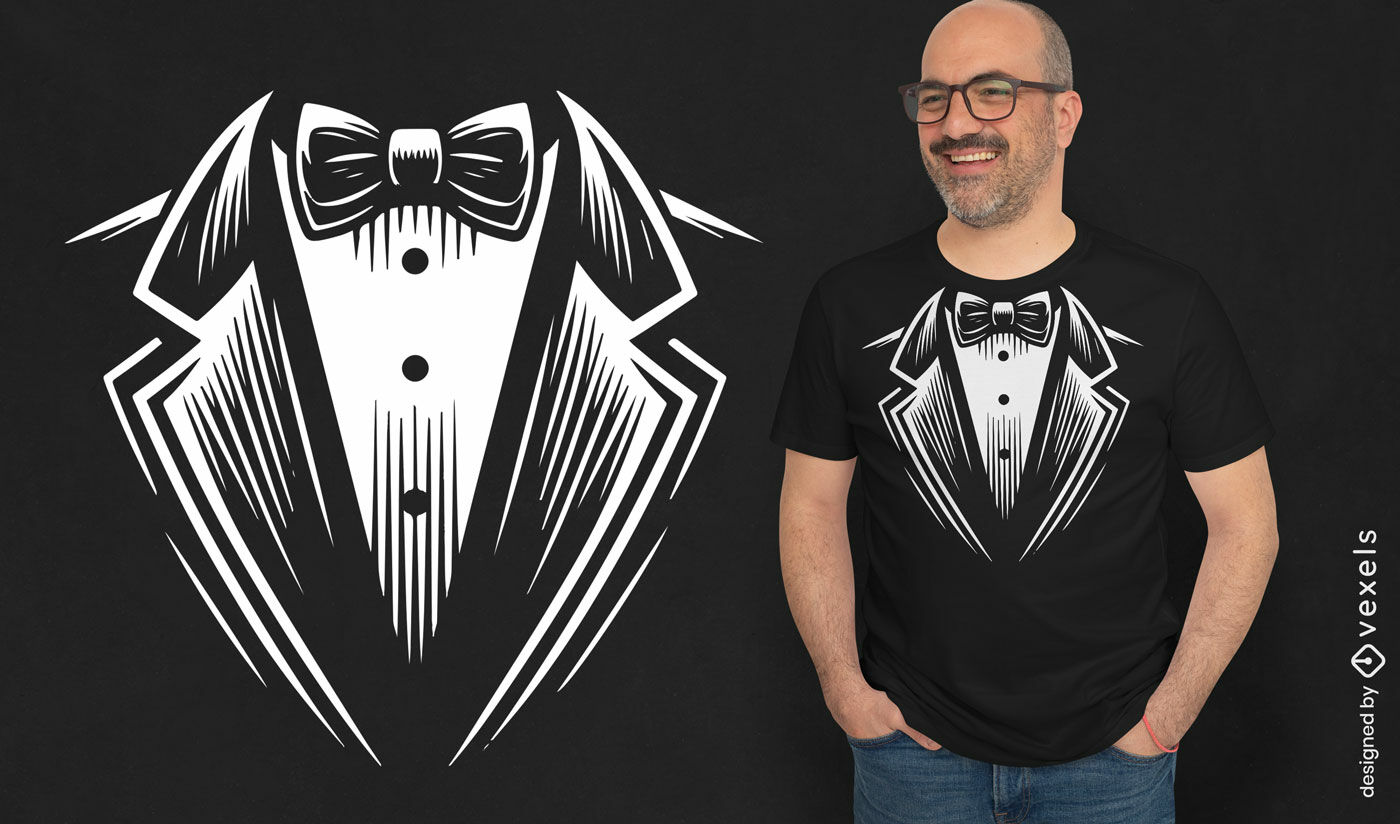
Design minimalista de camiseta smoking
Escolha uma pasta
Todos os favoritos
Criar novo
Salvar
Design minimalista de camiseta smoking
Pronto para imprimir
para Merch
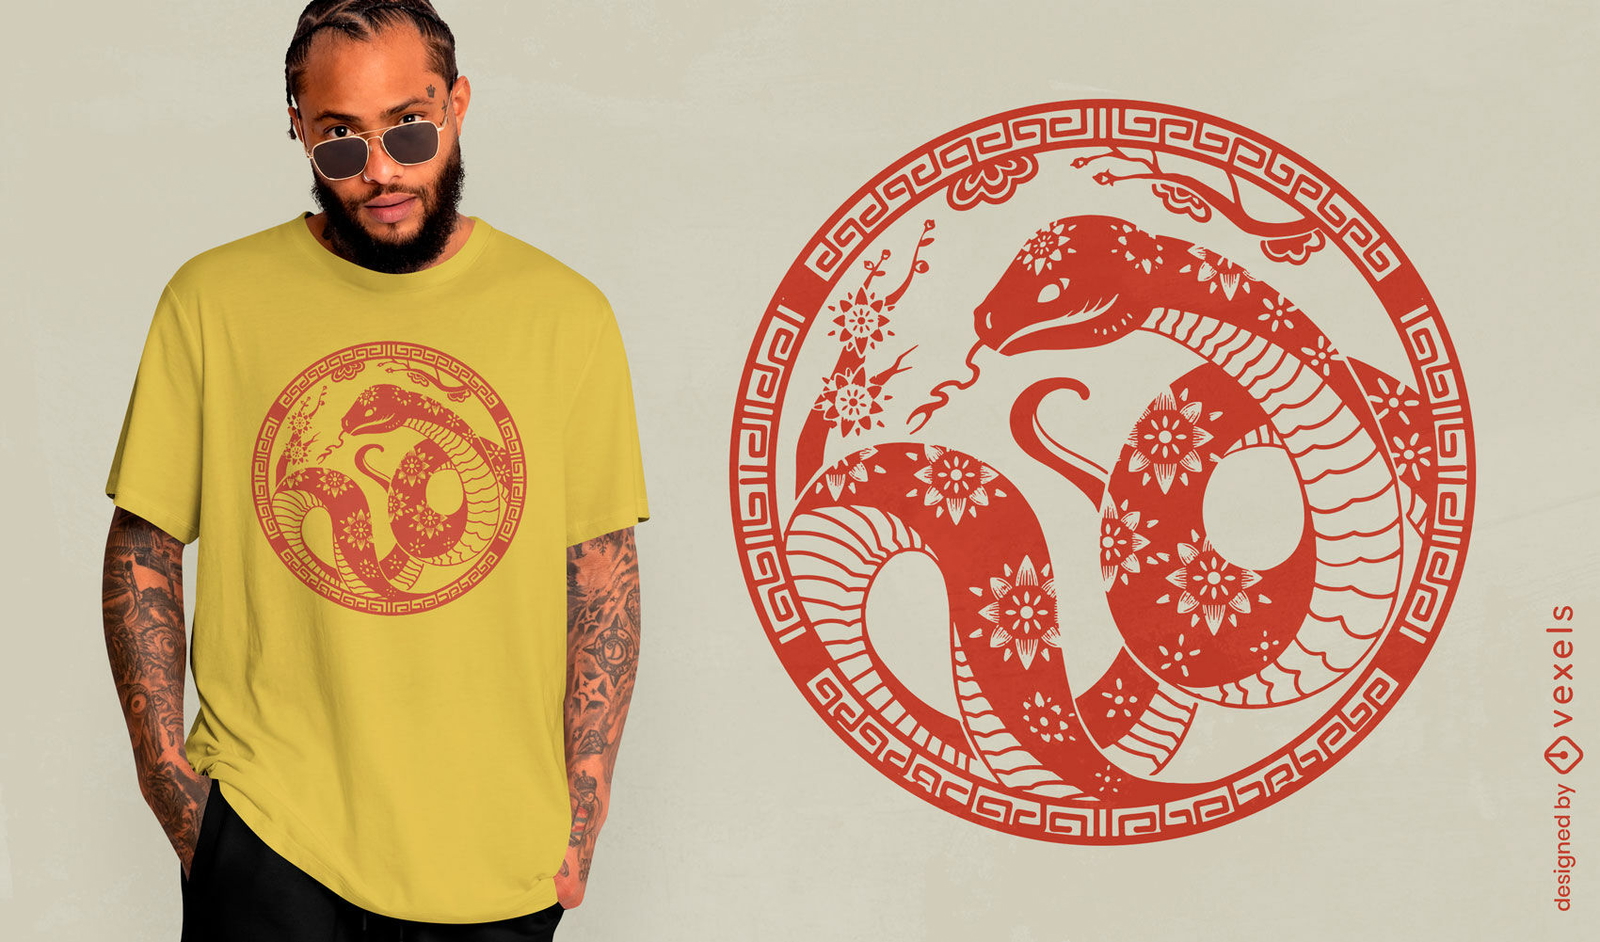
Design de camiseta de cobra tradicional chinesa
Escolha uma pasta
Todos os favoritos
Criar novo
Salvar
Design de camiseta de cobra tradicional chinesa
Gerado por IA, selecionado por nossos designers.
para Merch
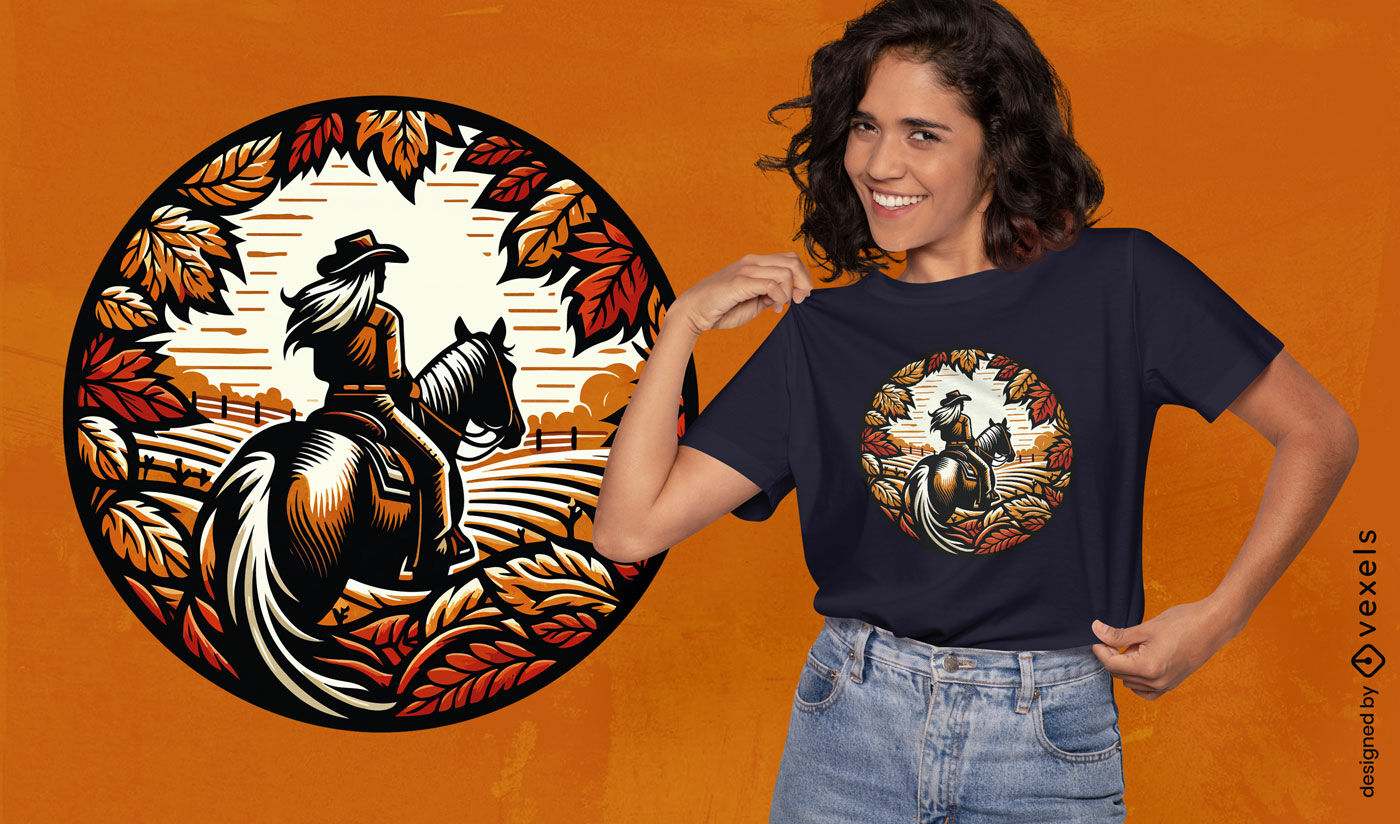
Design de camiseta cowgirl de outono
Escolha uma pasta
Todos os favoritos
Criar novo
Salvar
Design de camiseta cowgirl de outono
Gerado por IA, selecionado por nossos designers.
para Merch
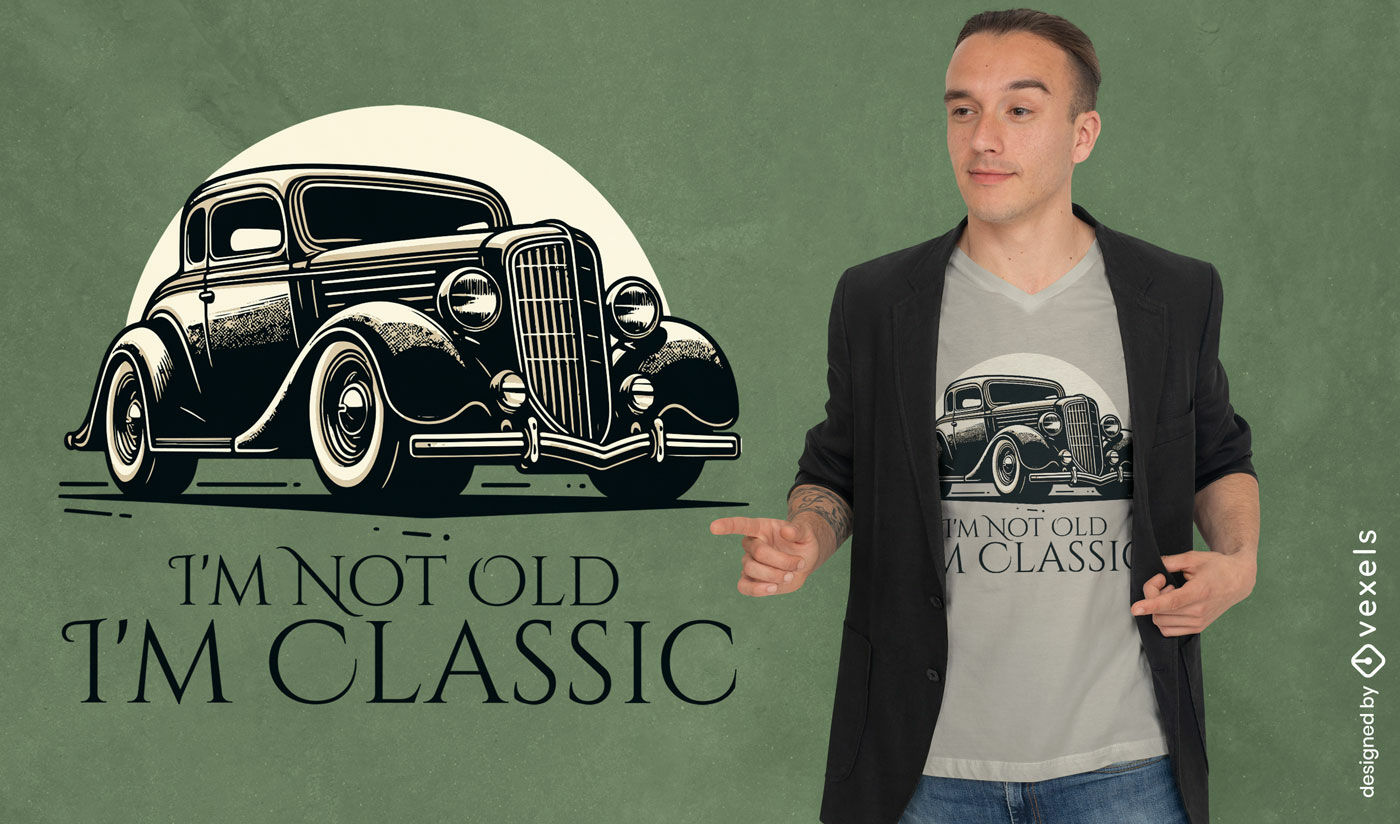
Design de camiseta vintage de carro clássico
Escolha uma pasta
Todos os favoritos
Criar novo
Salvar
Design de camiseta vintage de carro clássico
Pronto para imprimir
para Merch
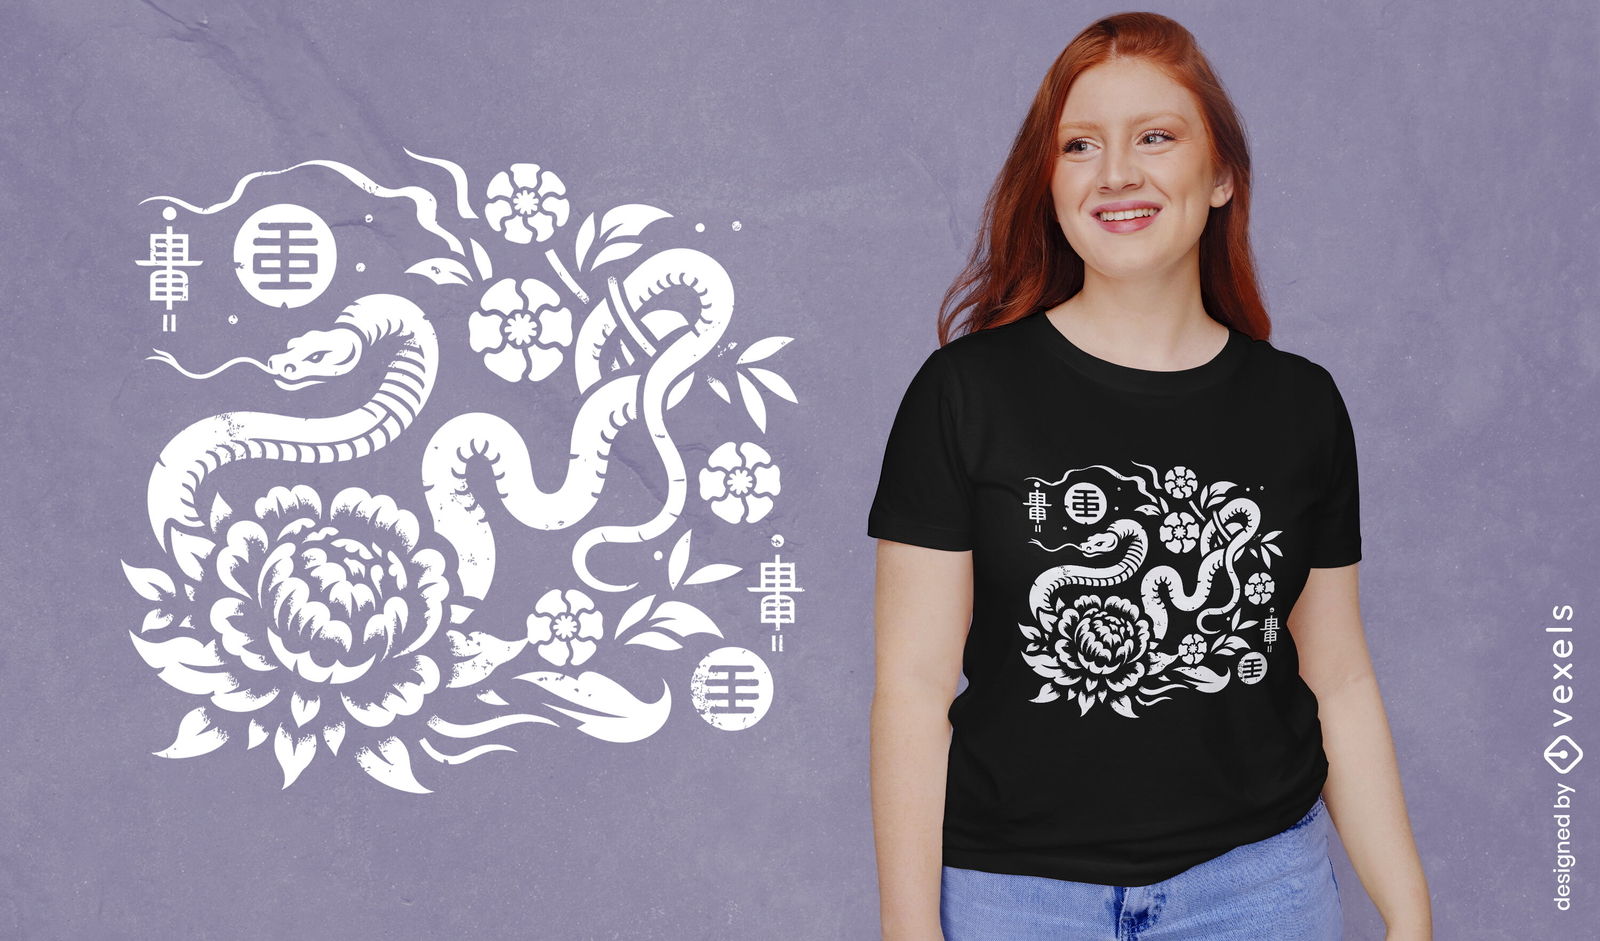
Design de camiseta com cobra do zodíaco chinês
Escolha uma pasta
Todos os favoritos
Criar novo
Salvar
Design de camiseta com cobra do zodíaco chinês
Gerado por IA, selecionado por nossos designers.
para Merch
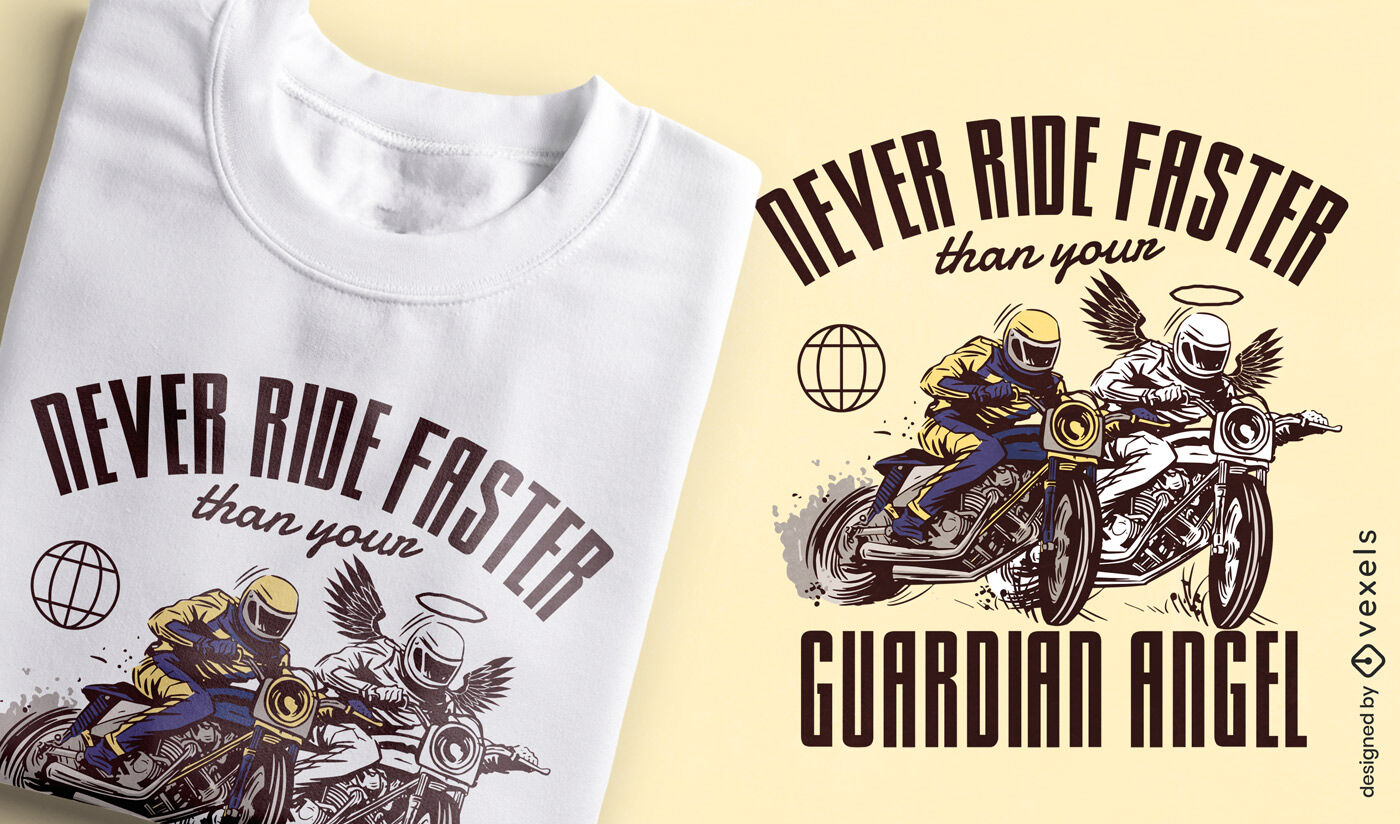
Design de camiseta com citação de motociclista anjo
Escolha uma pasta
Todos os favoritos
Criar novo
Salvar
Design de camiseta com citação de motociclista anjo
Gerado por IA, selecionado por nossos designers.
para Merch
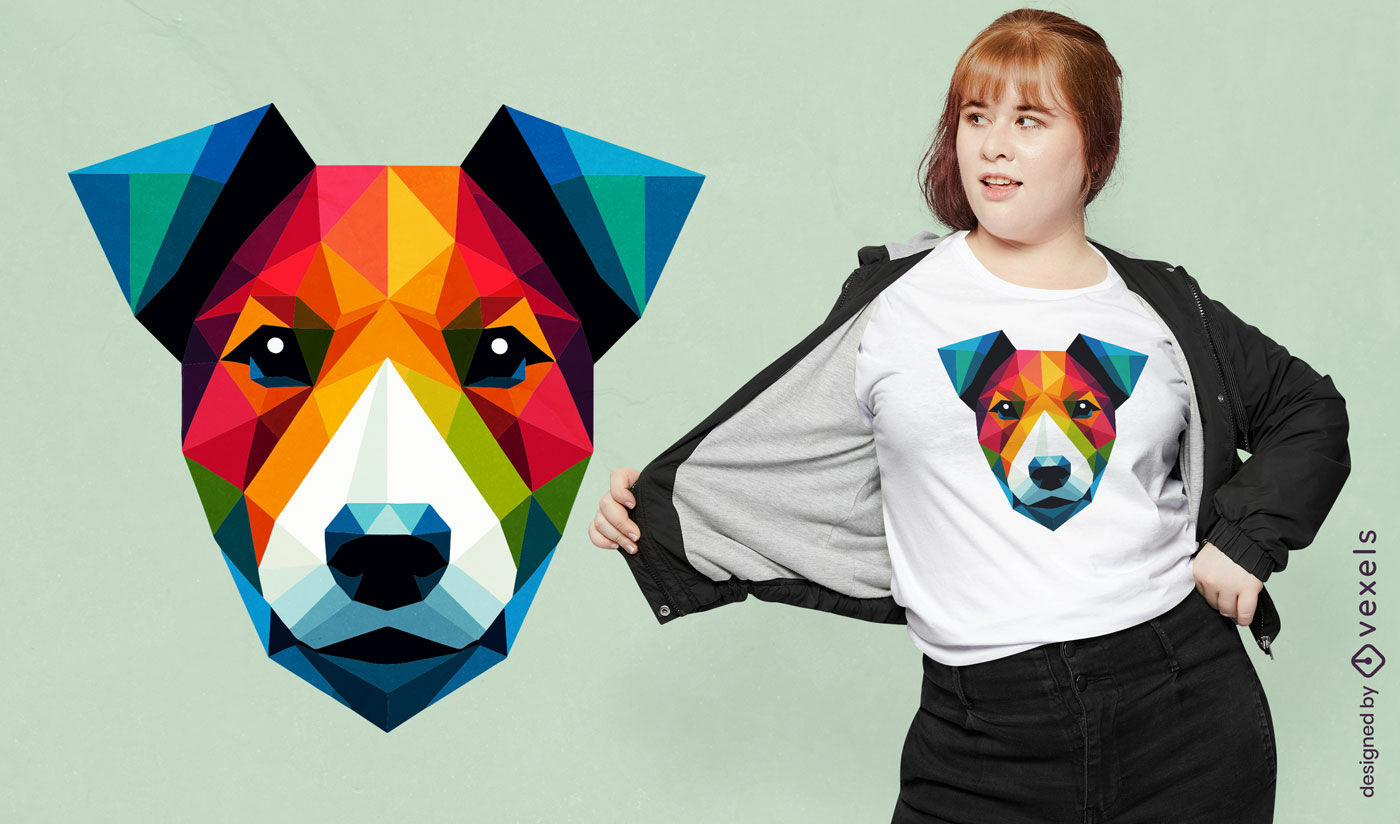
Design de camiseta de cachorro Jack Russell poligonal
Escolha uma pasta
Todos os favoritos
Criar novo
Salvar
Design de camiseta de cachorro Jack Russell poligonal
Gerado por IA, selecionado por nossos designers.
para Merch
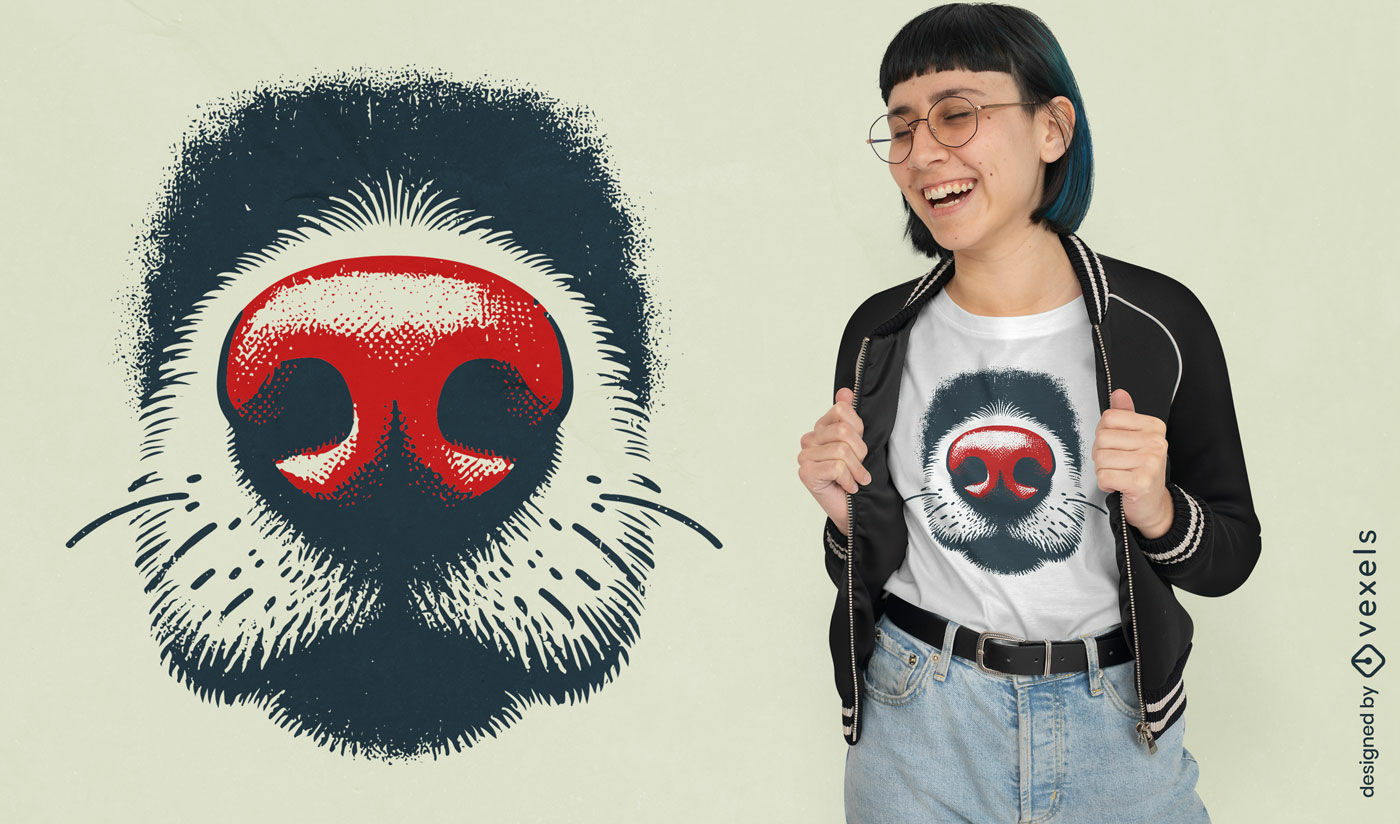
Design de camiseta com close do nariz de cachorro
Escolha uma pasta
Todos os favoritos
Criar novo
Salvar
Design de camiseta com close do nariz de cachorro
Gerado por IA, selecionado por nossos designers.
para Merch
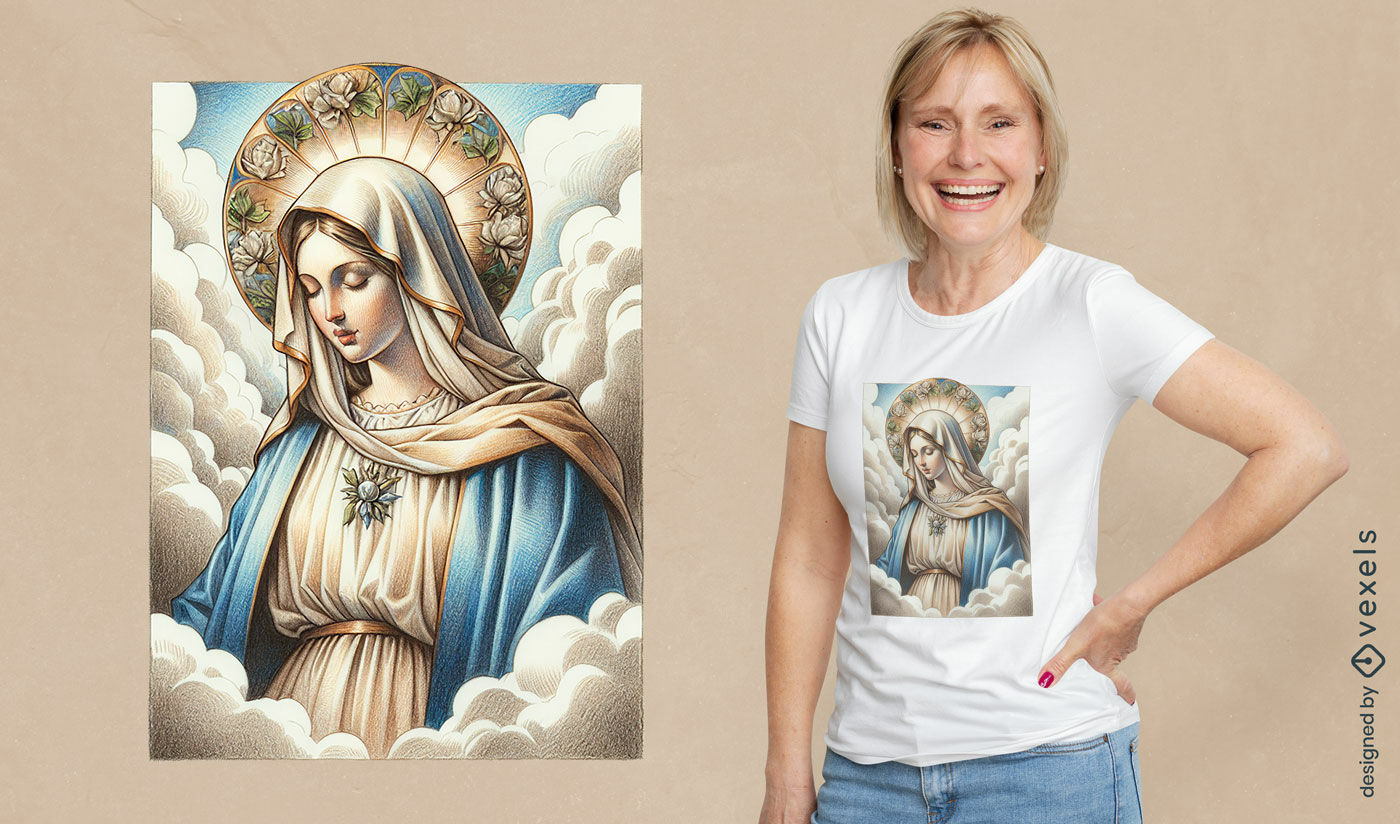
Arte da camiseta da Madonna Celestial
Escolha uma pasta
Todos os favoritos
Criar novo
Salvar
Arte da camiseta da Madonna Celestial
Gerado por IA, selecionado por nossos designers.
para Merch
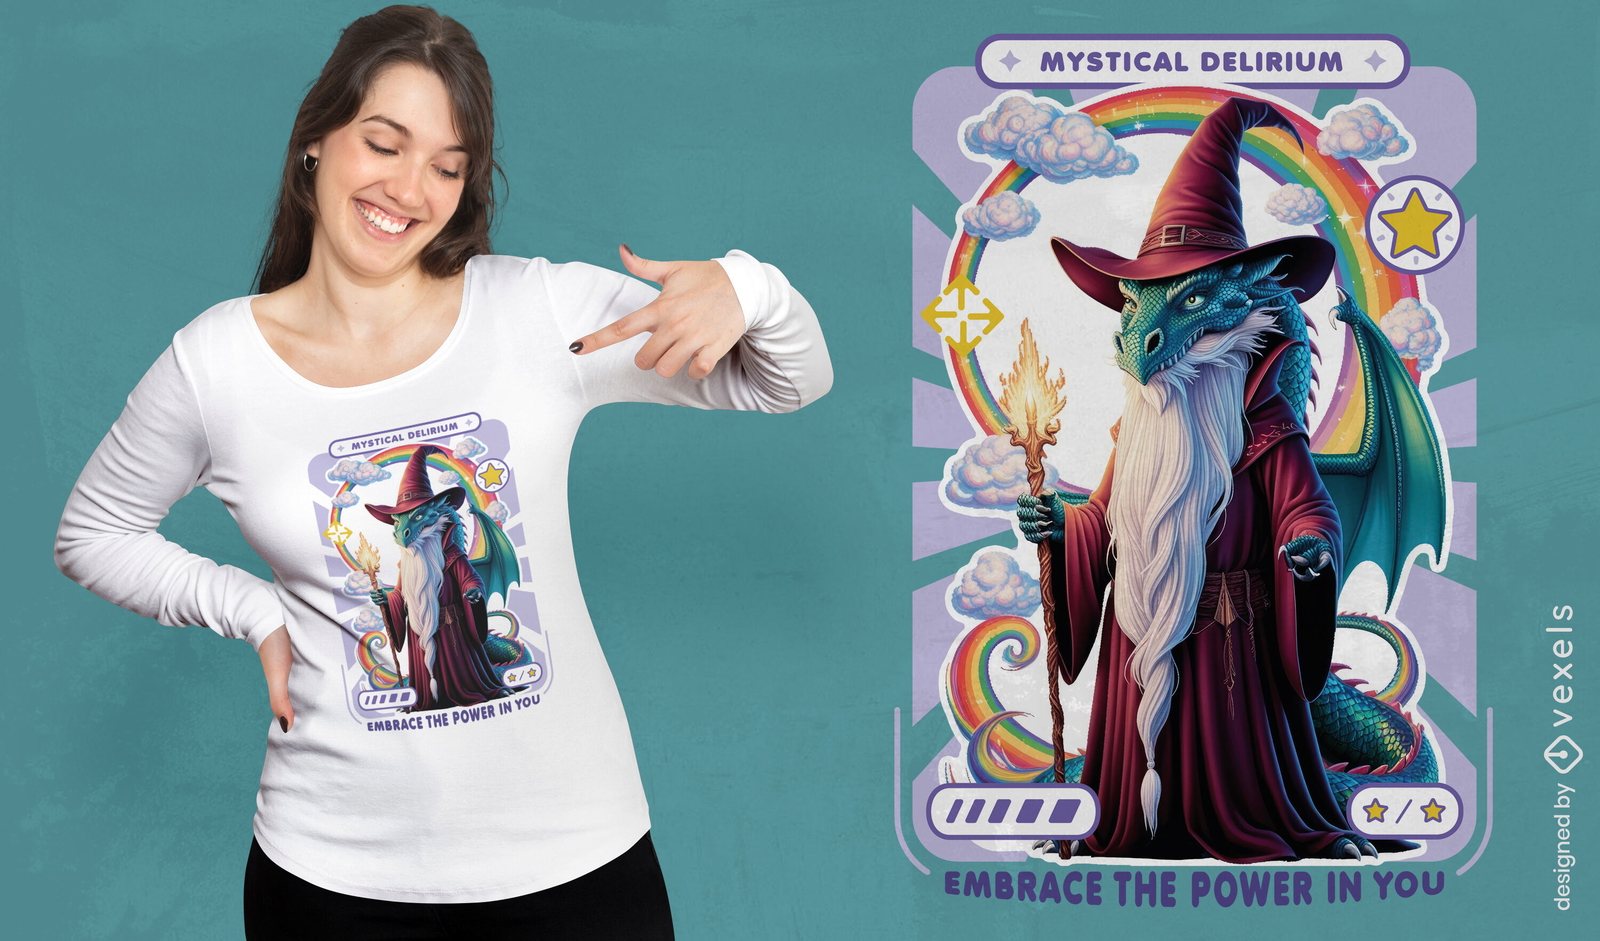
Design de camiseta do mago do delírio místico
Escolha uma pasta
Todos os favoritos
Criar novo
Salvar
Design de camiseta do mago do delírio místico
texto editável
Pronto para imprimir
para Merch
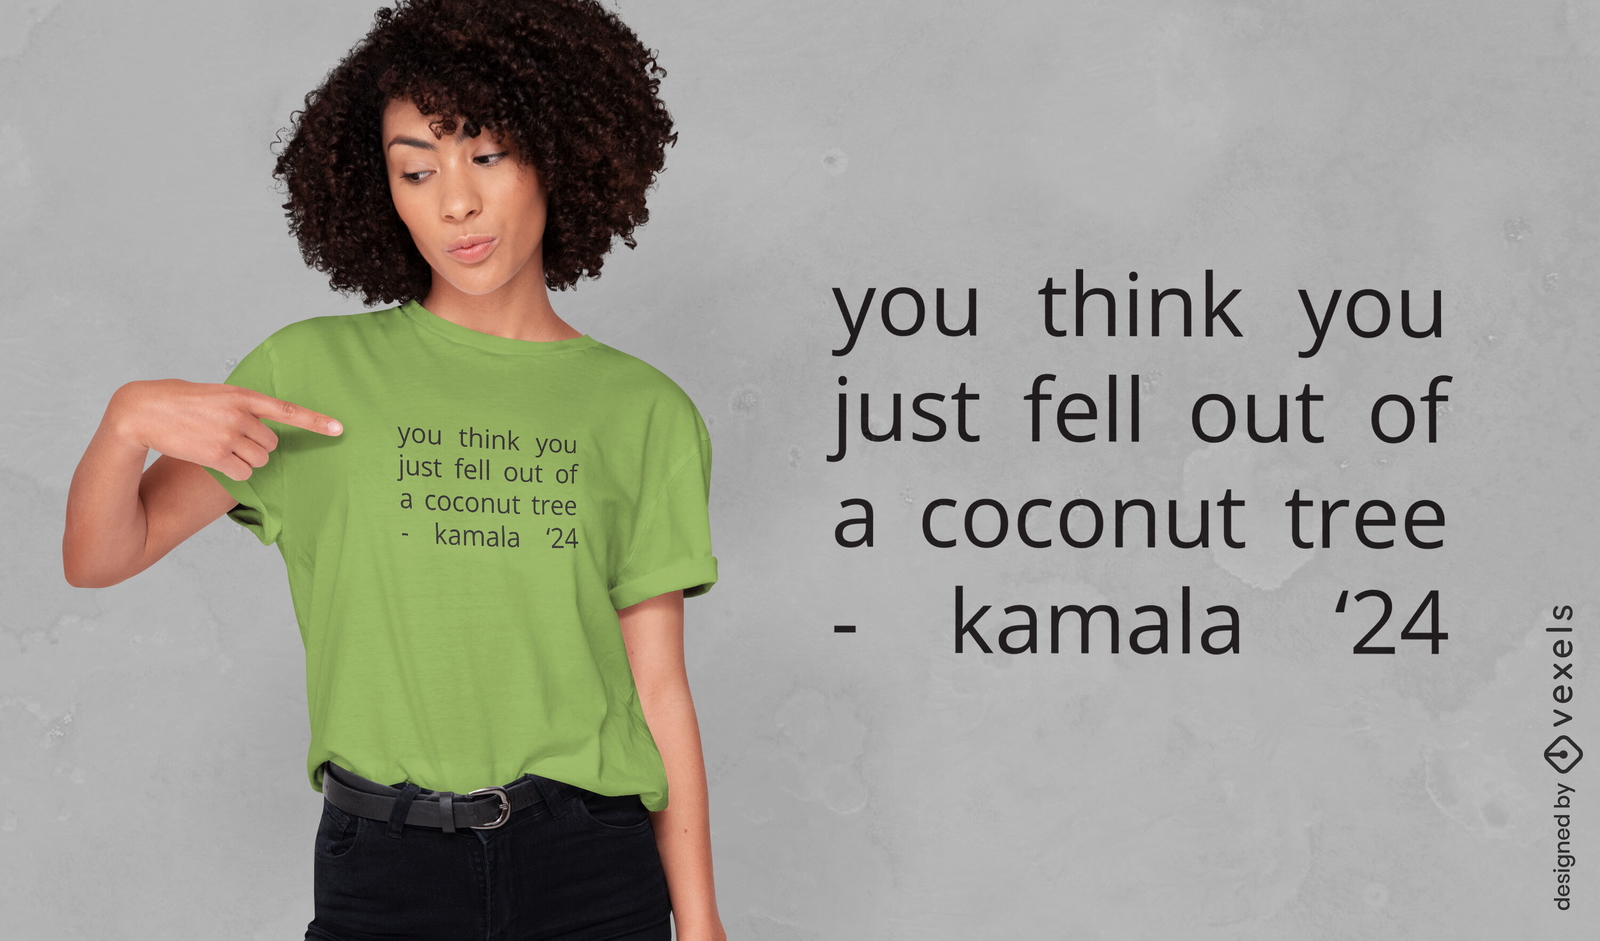
Design de camiseta com citação política de coqueiro
Escolha uma pasta
Todos os favoritos
Criar novo
Salvar
Design de camiseta com citação política de coqueiro
texto editável
Pronto para imprimir
para Merch
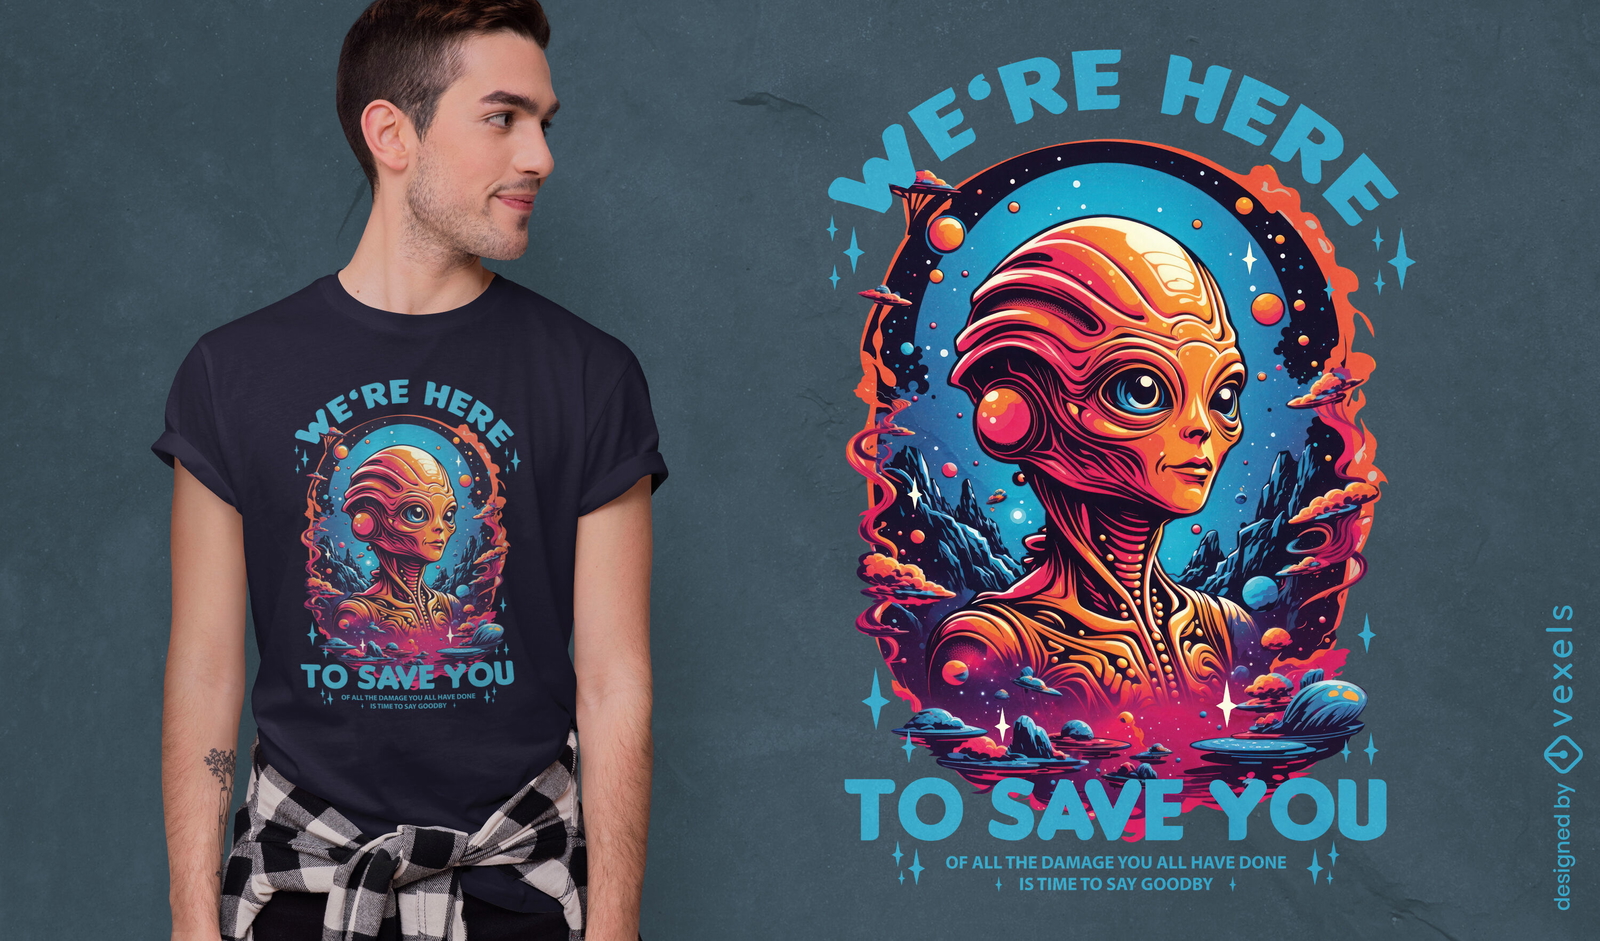
Design de camiseta de salvador alienígena
Escolha uma pasta
Todos os favoritos
Criar novo
Salvar
Design de camiseta de salvador alienígena
Gerado por IA, selecionado por nossos designers.
para Merch
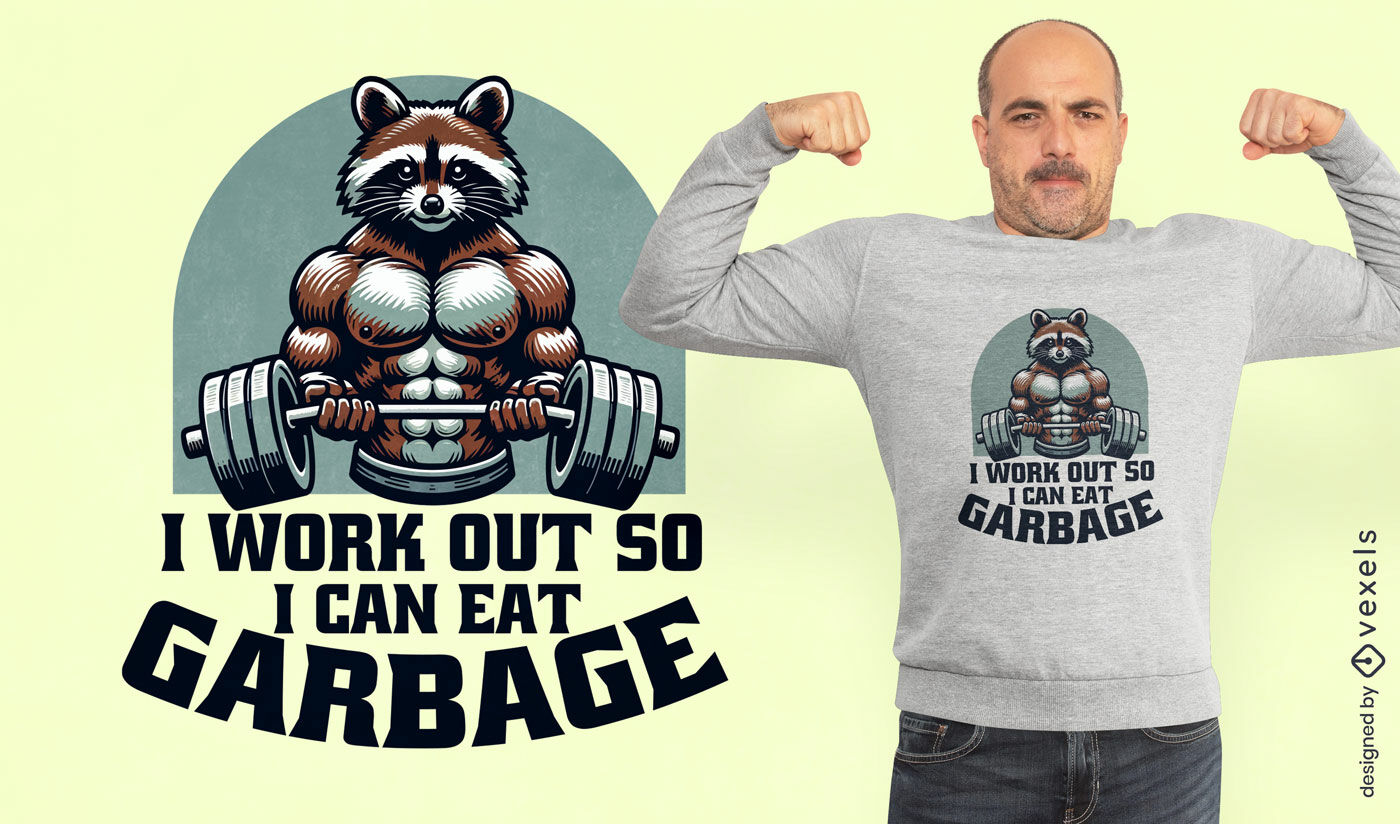
Design de camiseta com citação de treino de guaxinim Buff
Escolha uma pasta
Todos os favoritos
Criar novo
Salvar
Design de camiseta com citação de treino de guaxinim Buff
Pronto para imprimir
para Merch
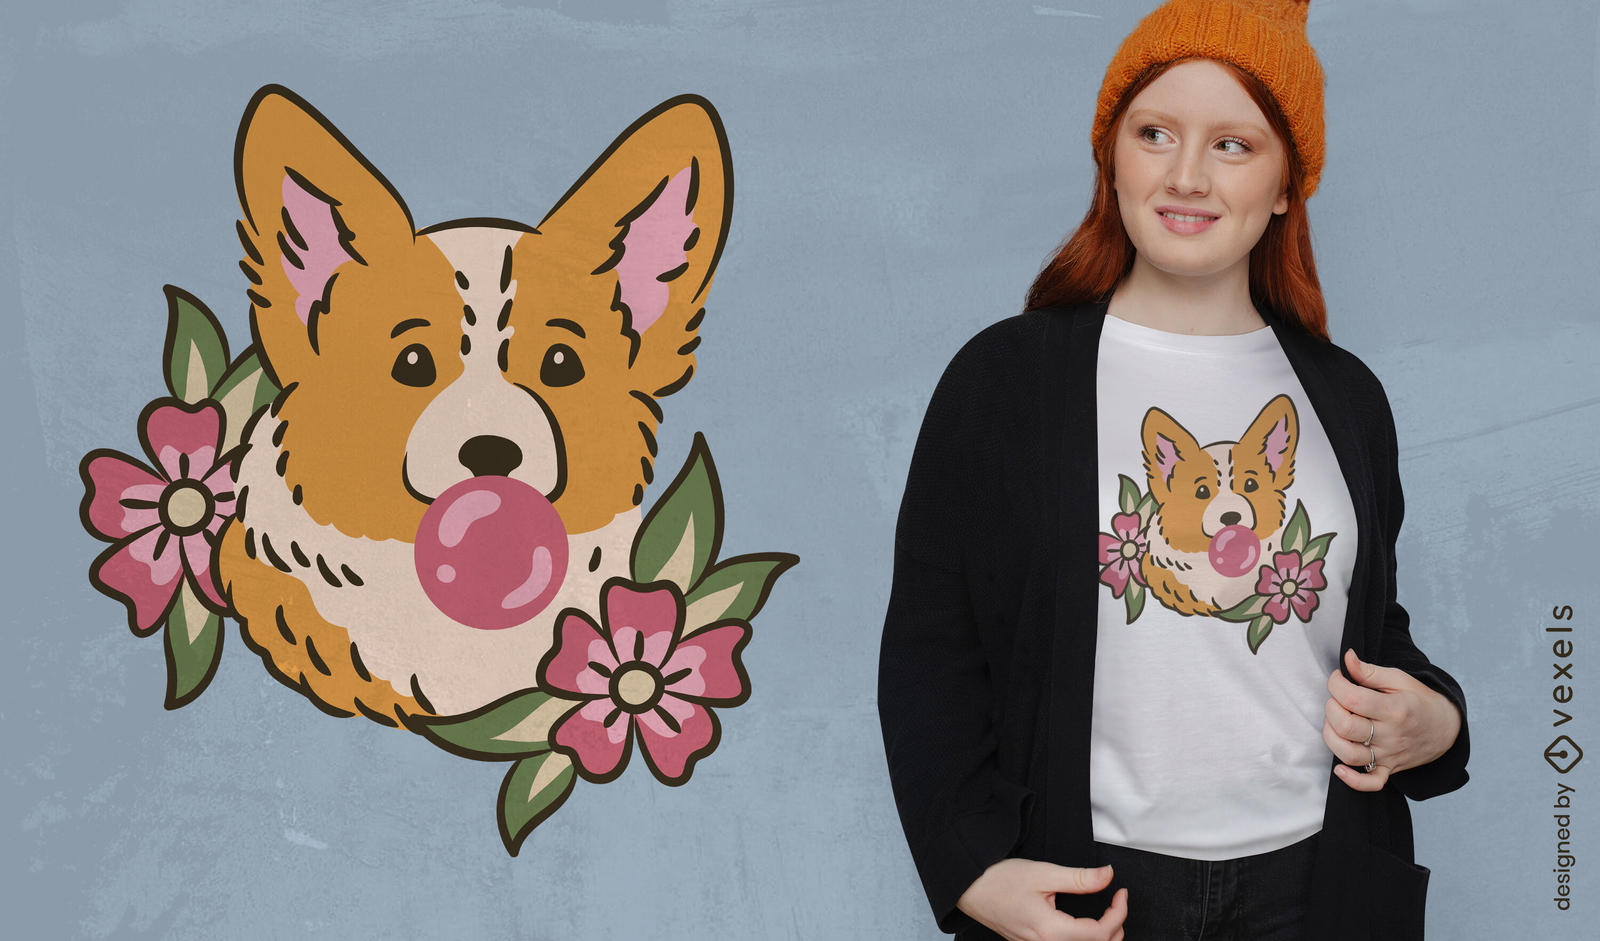
Design de camiseta Corgi bubblegum
Escolha uma pasta
Todos os favoritos
Criar novo
Salvar
Design de camiseta Corgi bubblegum
Pronto para imprimir
para Merch
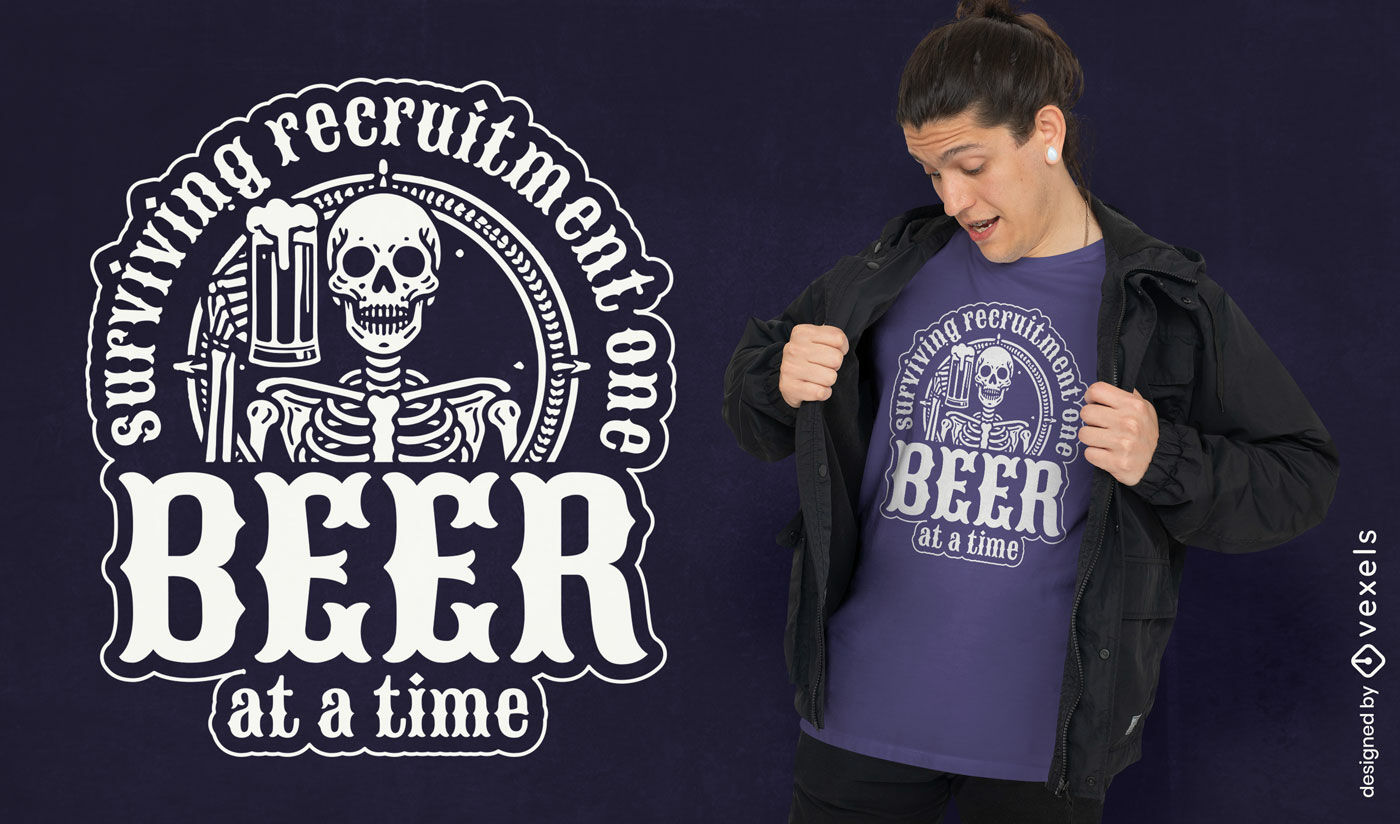
Design de camiseta com esqueleto de cerveja
Escolha uma pasta
Todos os favoritos
Criar novo
Salvar
Design de camiseta com esqueleto de cerveja
Pronto para imprimir
para Merch
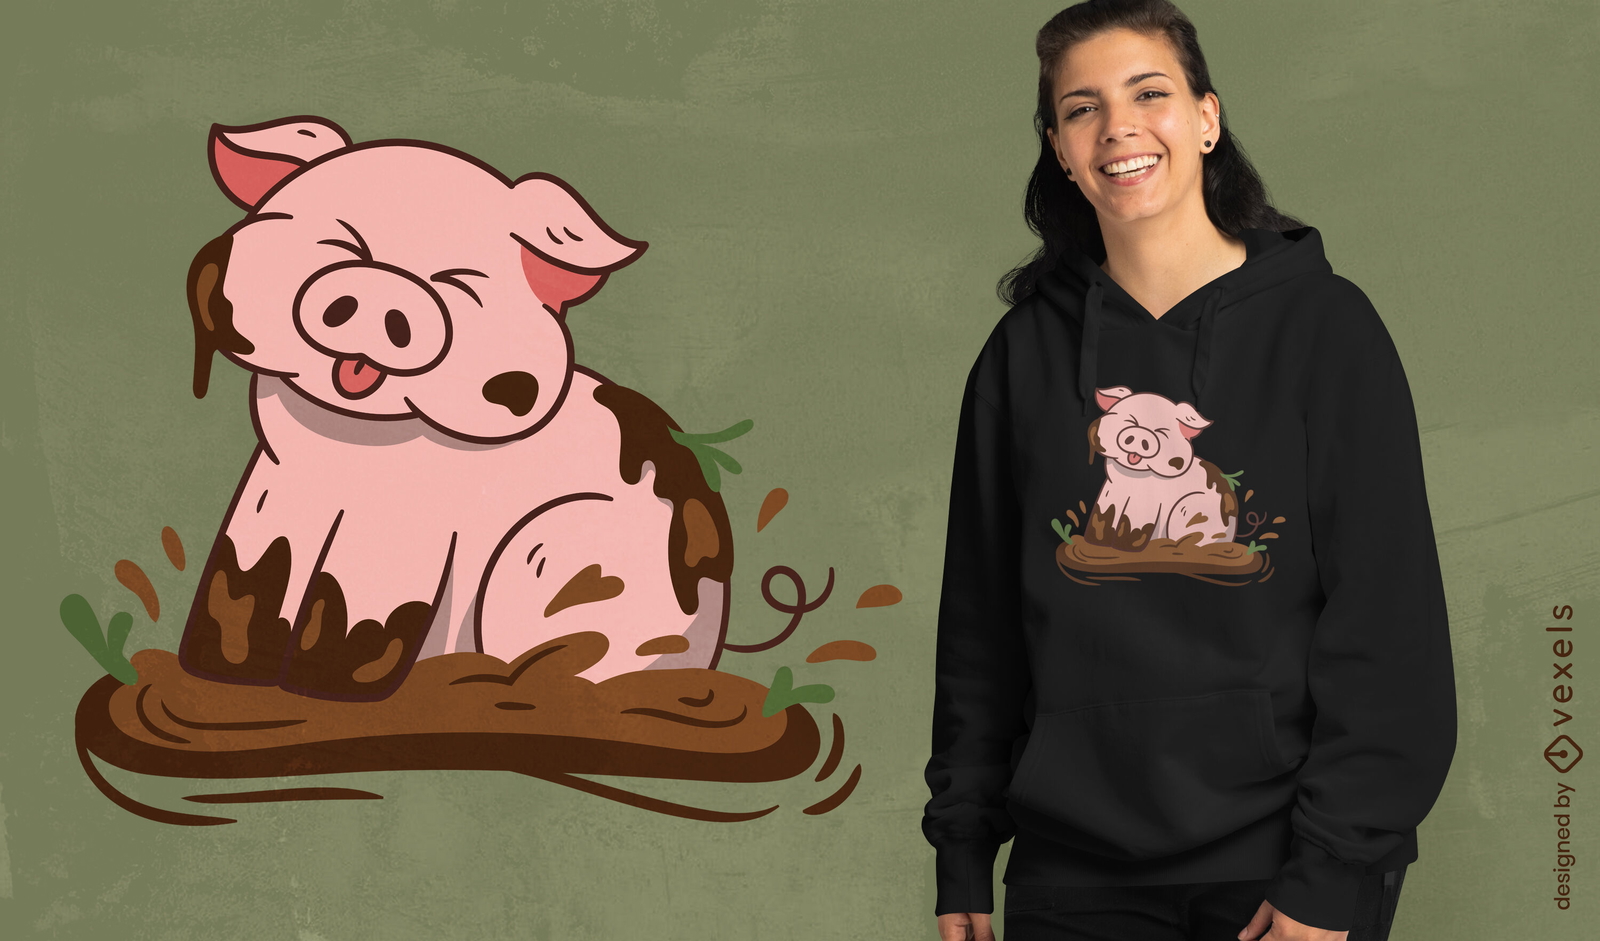
Design de camiseta de porco enlameado
Escolha uma pasta
Todos os favoritos
Criar novo
Salvar
Design de camiseta de porco enlameado
Gerado por IA, selecionado por nossos designers.
para Merch
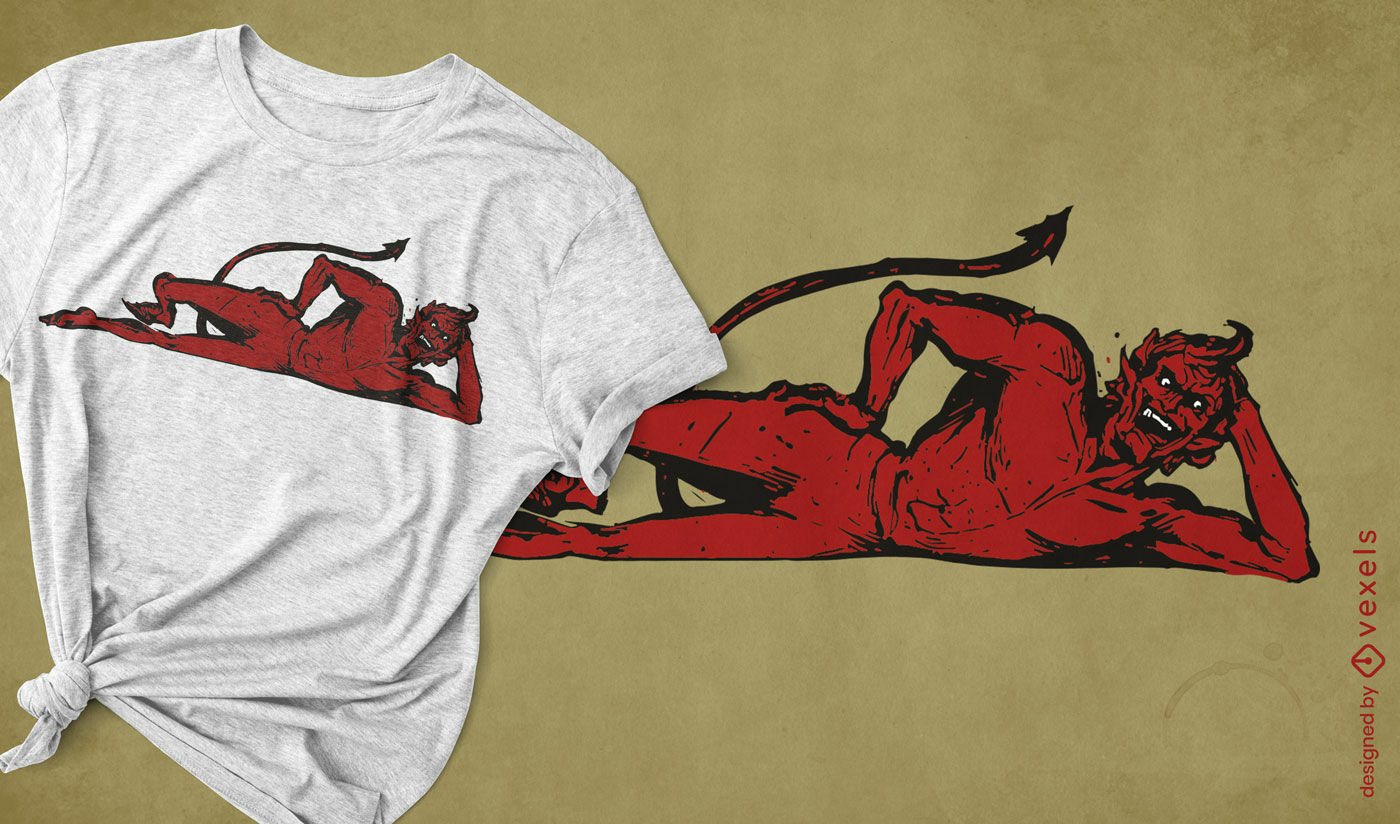
Design diabólico de camiseta do diabo vermelho
Escolha uma pasta
Todos os favoritos
Criar novo
Salvar
Design diabólico de camiseta do diabo vermelho
Pronto para imprimir
para Merch
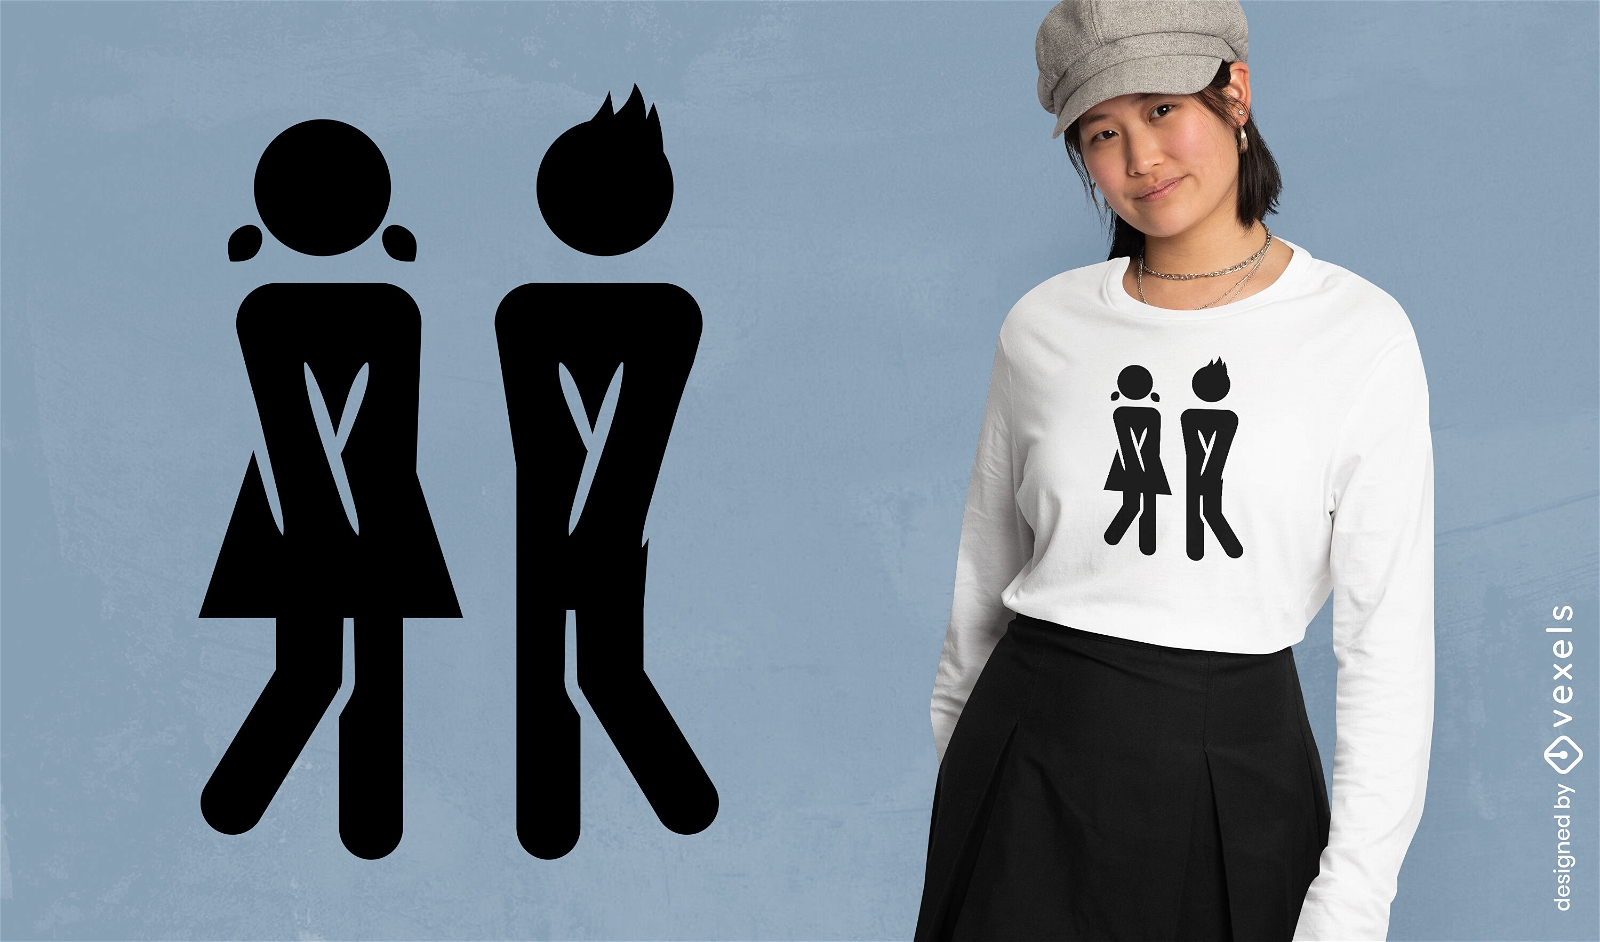
Design de camisetas com ?cones de banheiro
Escolha uma pasta
Todos os favoritos
Criar novo
Salvar
Design de camisetas com ?cones de banheiro
texto editável
Pronto para imprimir
para Merch
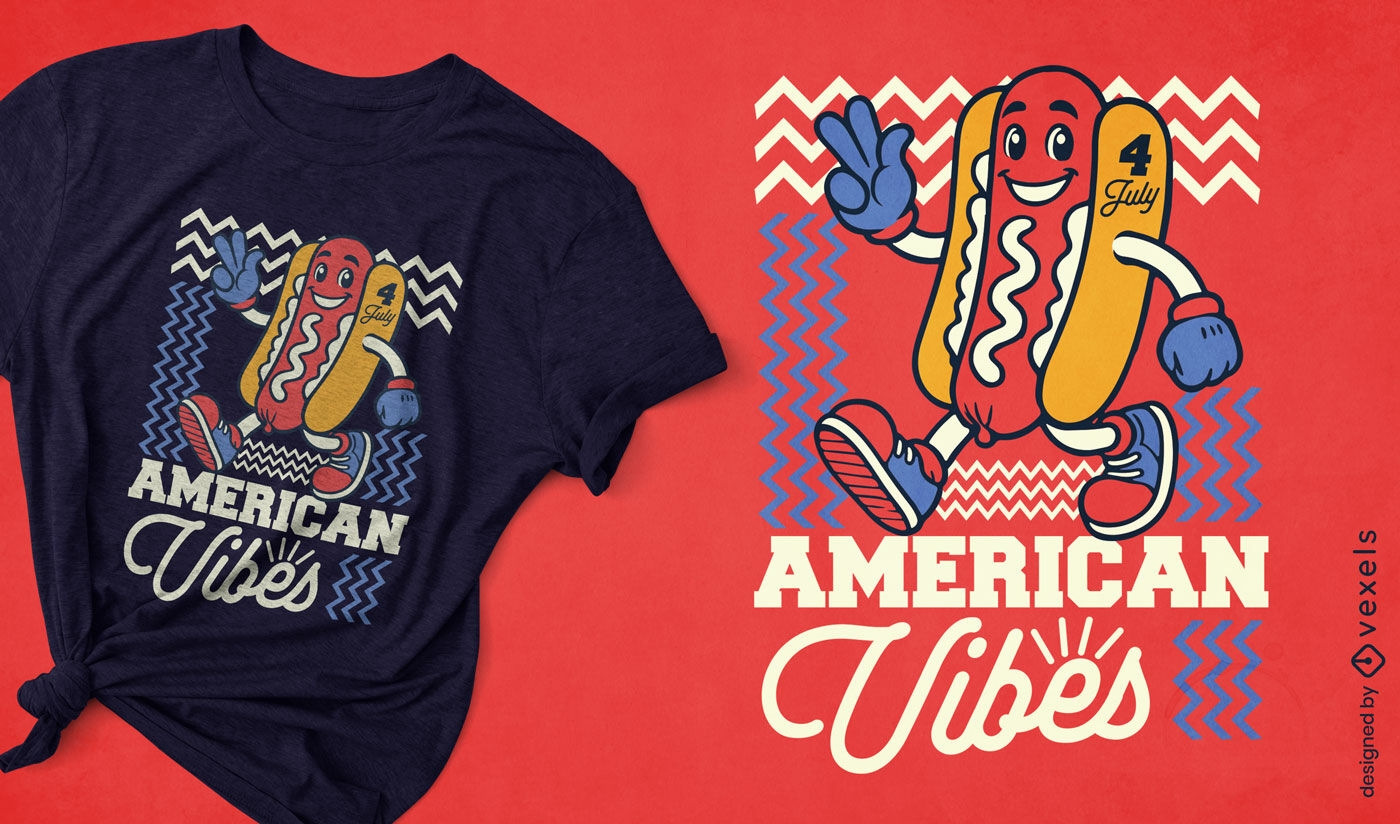
Design de camiseta de cachorro-quente com vibe americana
Escolha uma pasta
Todos os favoritos
Criar novo
Salvar
Design de camiseta de cachorro-quente com vibe americana
Gerado por IA, selecionado por nossos designers.
para Merch
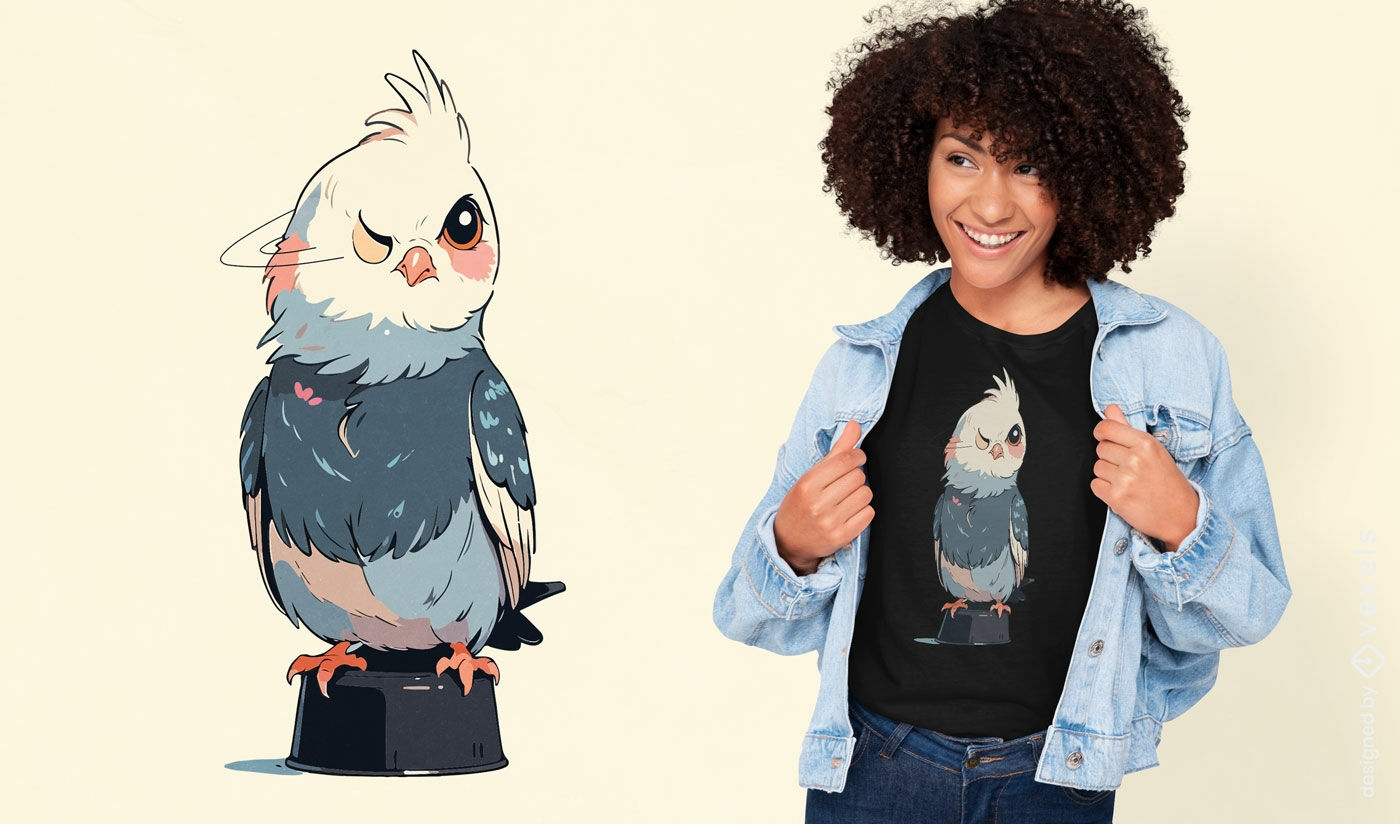
Desenho de camiseta de calopsita com desenho animado
Escolha uma pasta
Todos os favoritos
Criar novo
Salvar
Desenho de camiseta de calopsita com desenho animado
Gerado por IA, selecionado por nossos designers.
para Merch
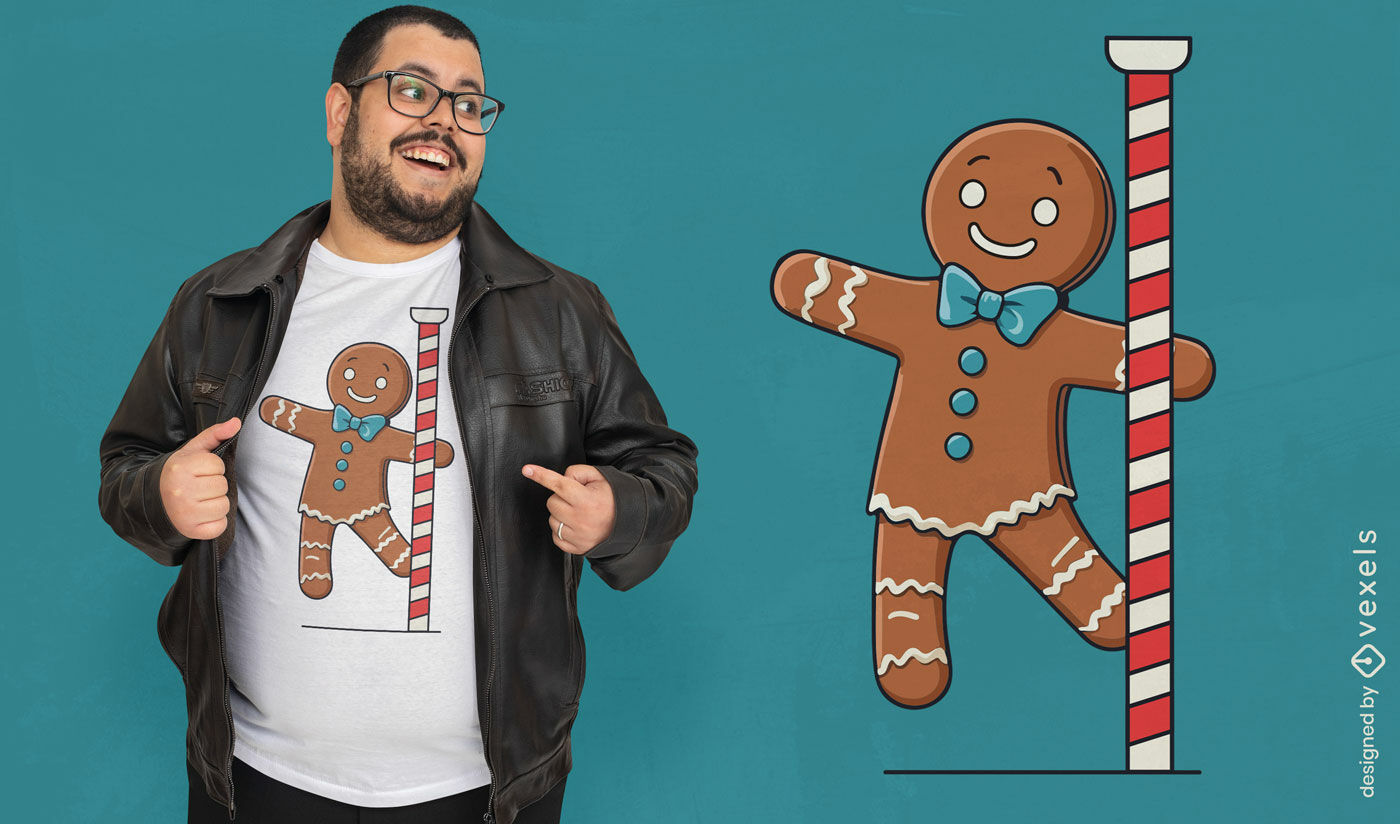
Design de camiseta do boneco de gengibre
Escolha uma pasta
Todos os favoritos
Criar novo
Salvar
Design de camiseta do boneco de gengibre
Gerado por IA, selecionado por nossos designers.
para Merch
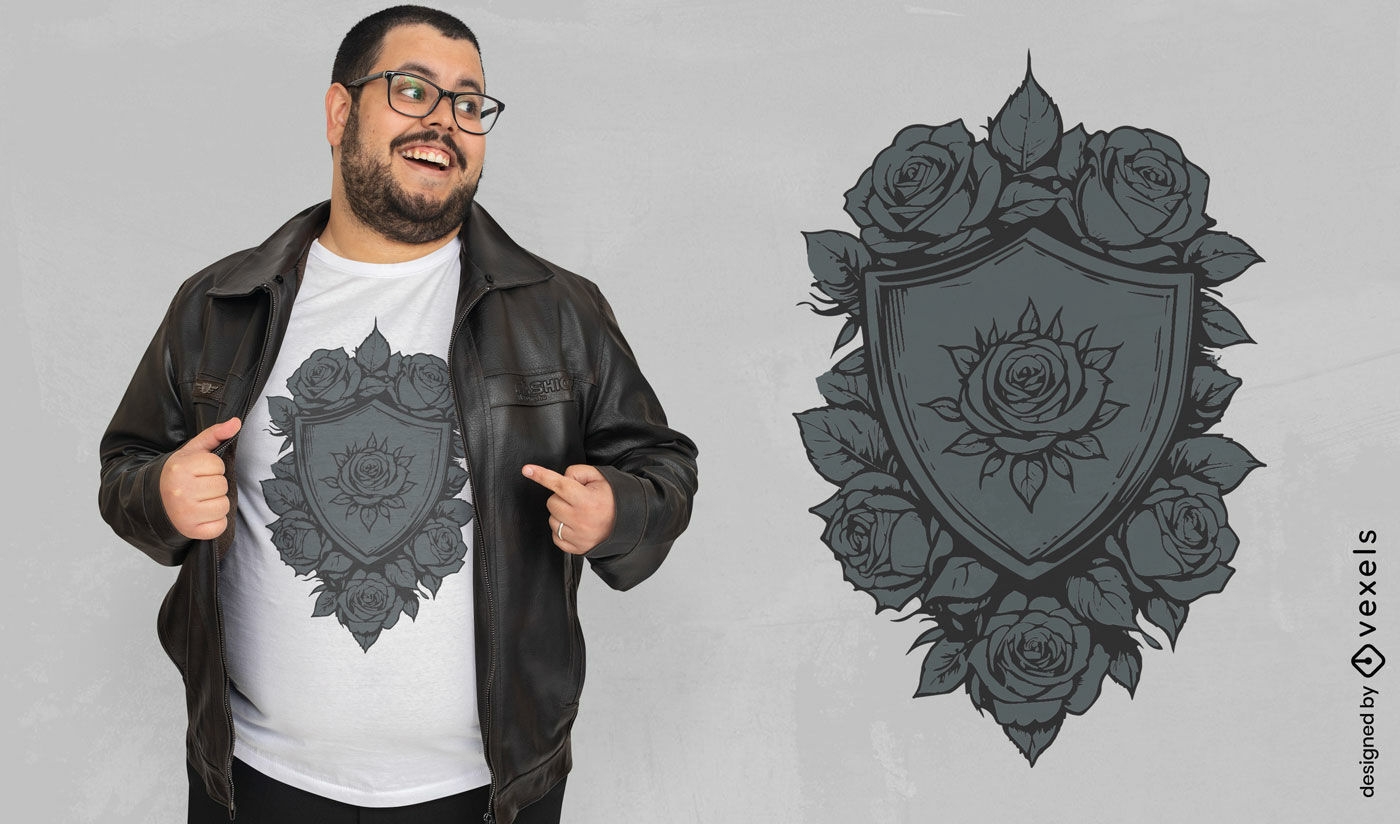
Design de camiseta com escudo de rosas
Escolha uma pasta
Todos os favoritos
Criar novo
Salvar
Design de camiseta com escudo de rosas
Pronto para imprimir
para Merch
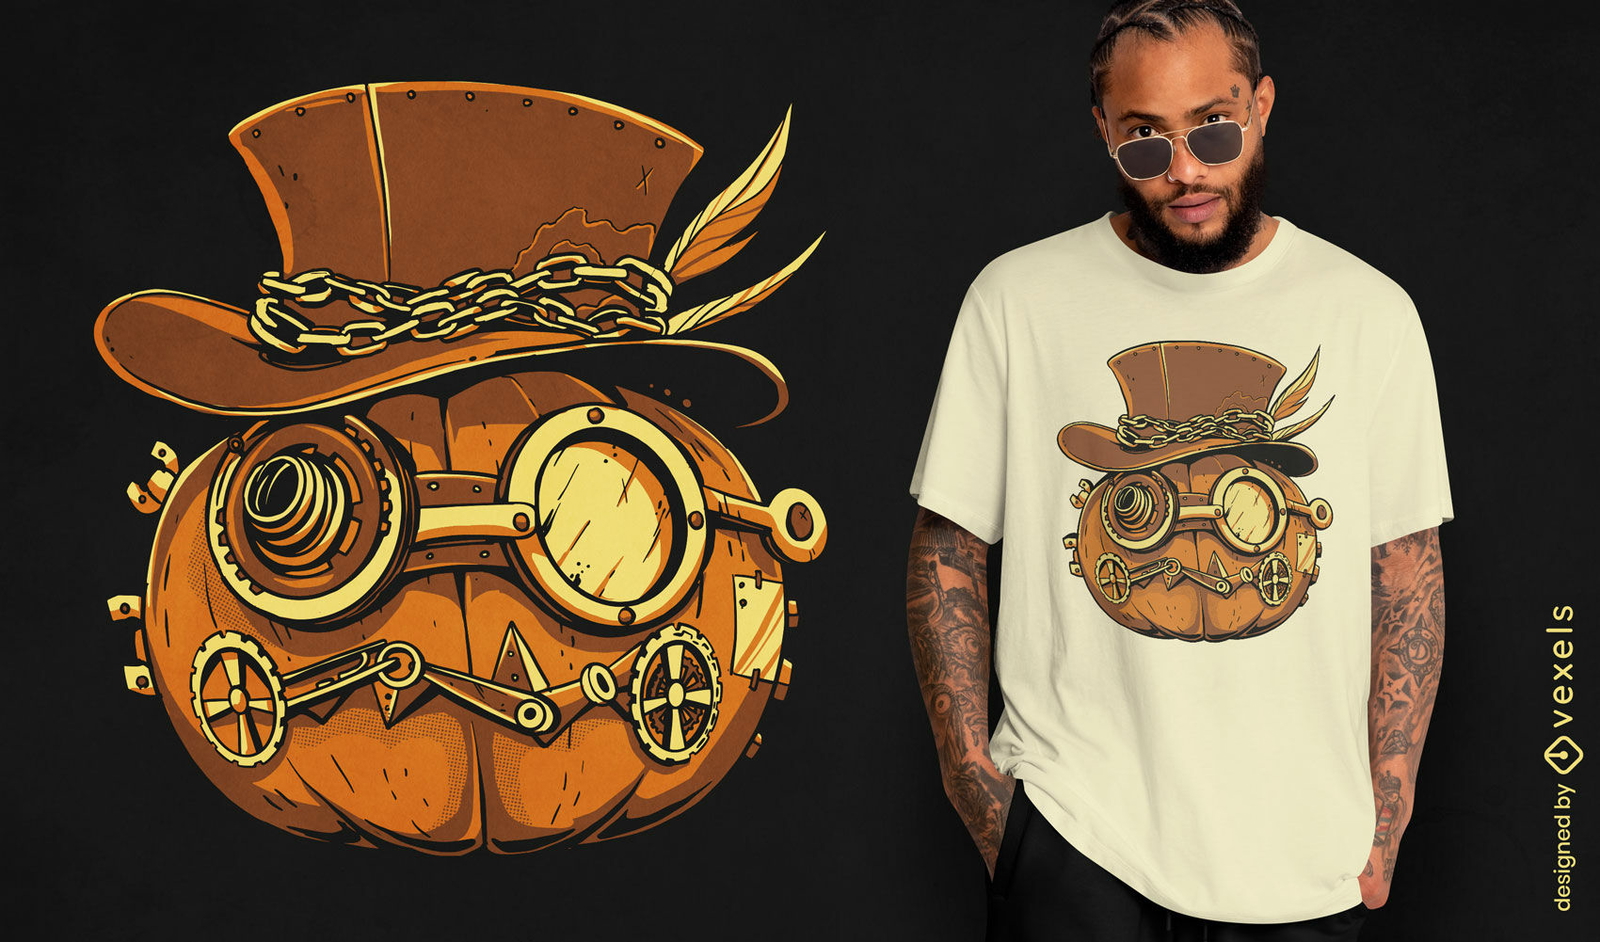
Design de camiseta de Halloween de abóbora Steampunk
Escolha uma pasta
Todos os favoritos
Criar novo
Salvar
Design de camiseta de Halloween de abóbora Steampunk
Pronto para imprimir
para Merch
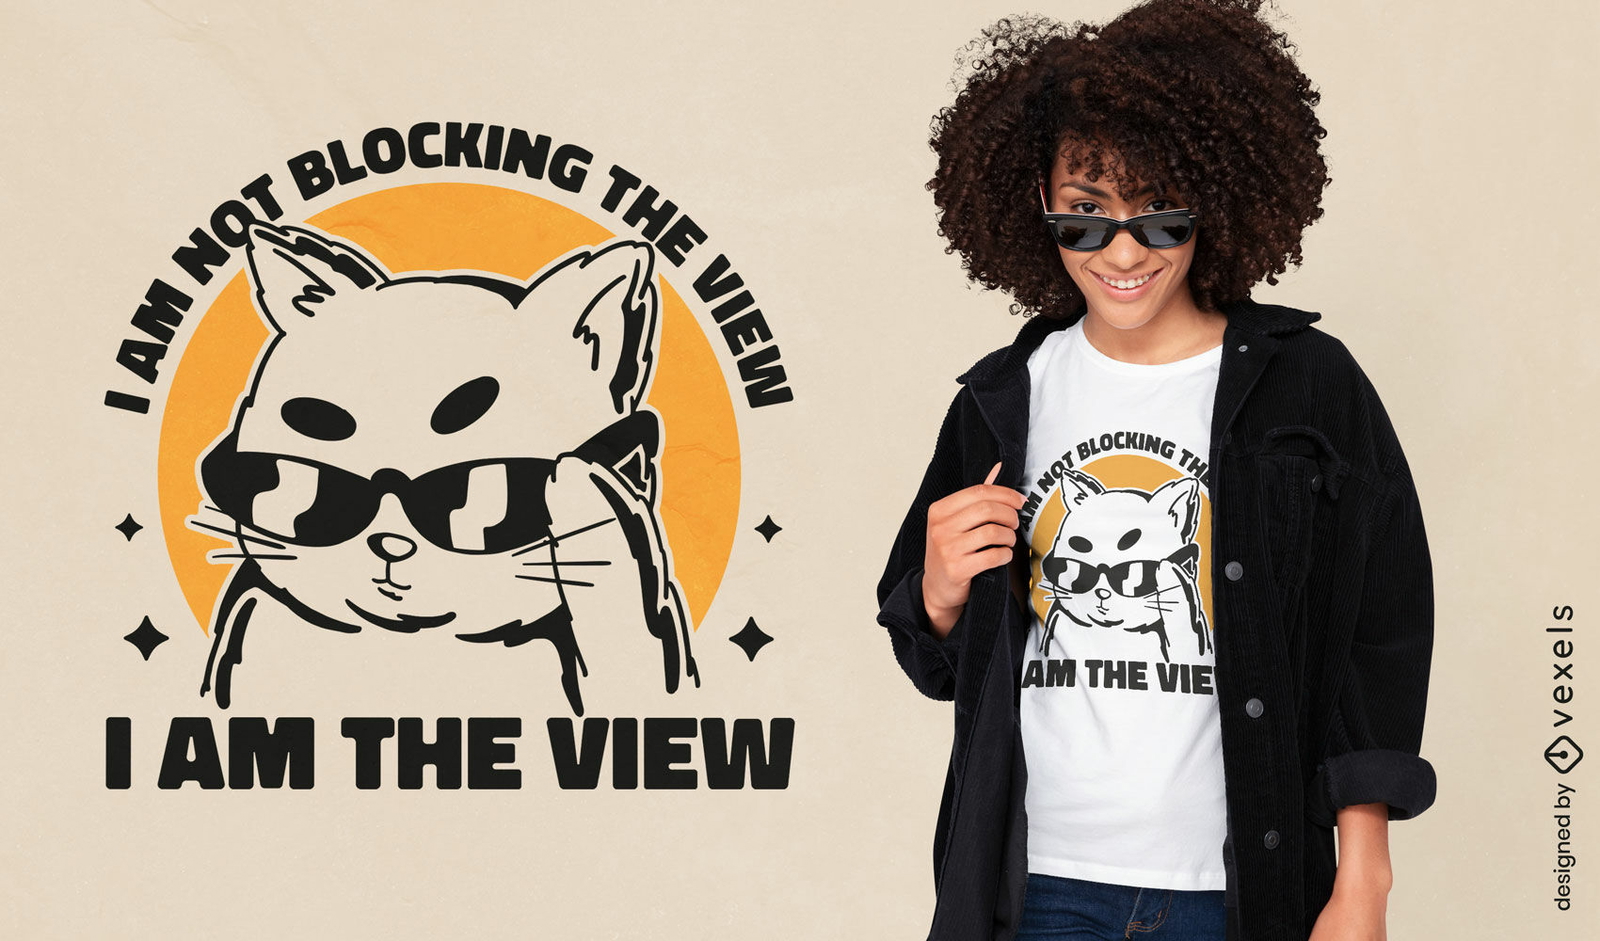
Animal de gato com design de t-shirt de óculos de sol
Escolha uma pasta
Todos os favoritos
Criar novo
Salvar
Animal de gato com design de t-shirt de óculos de sol
Pronto para imprimir
para Merch
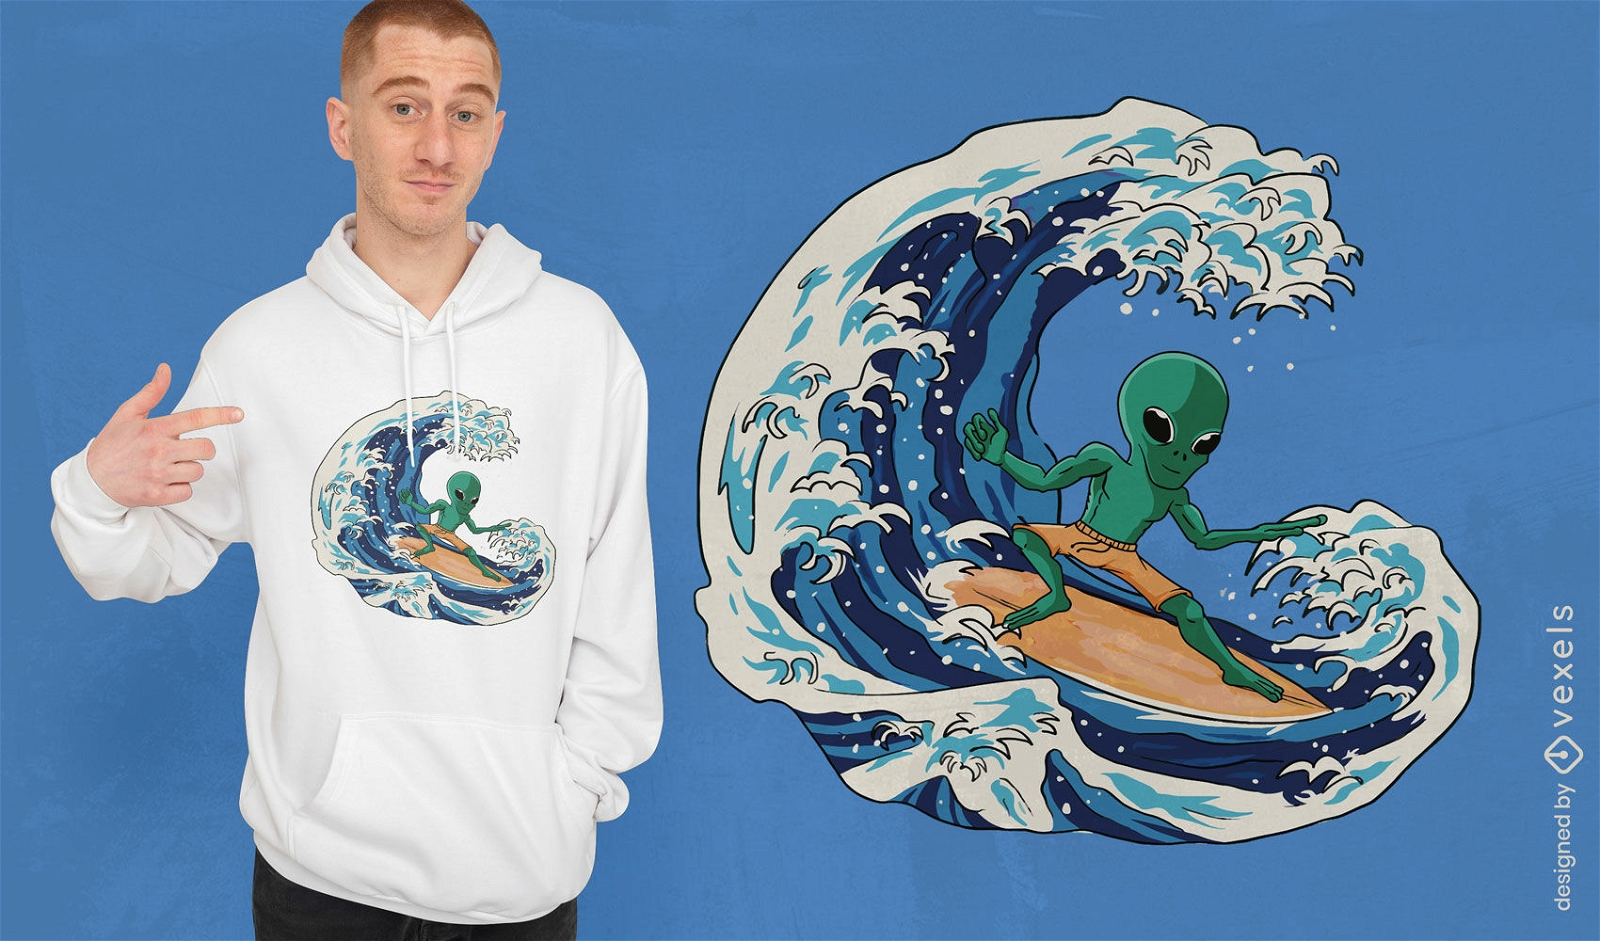
Alien surf no design de camiseta de onda
Escolha uma pasta
Todos os favoritos
Criar novo
Salvar
Alien surf no design de camiseta de onda
Pronto para imprimir
para Merch
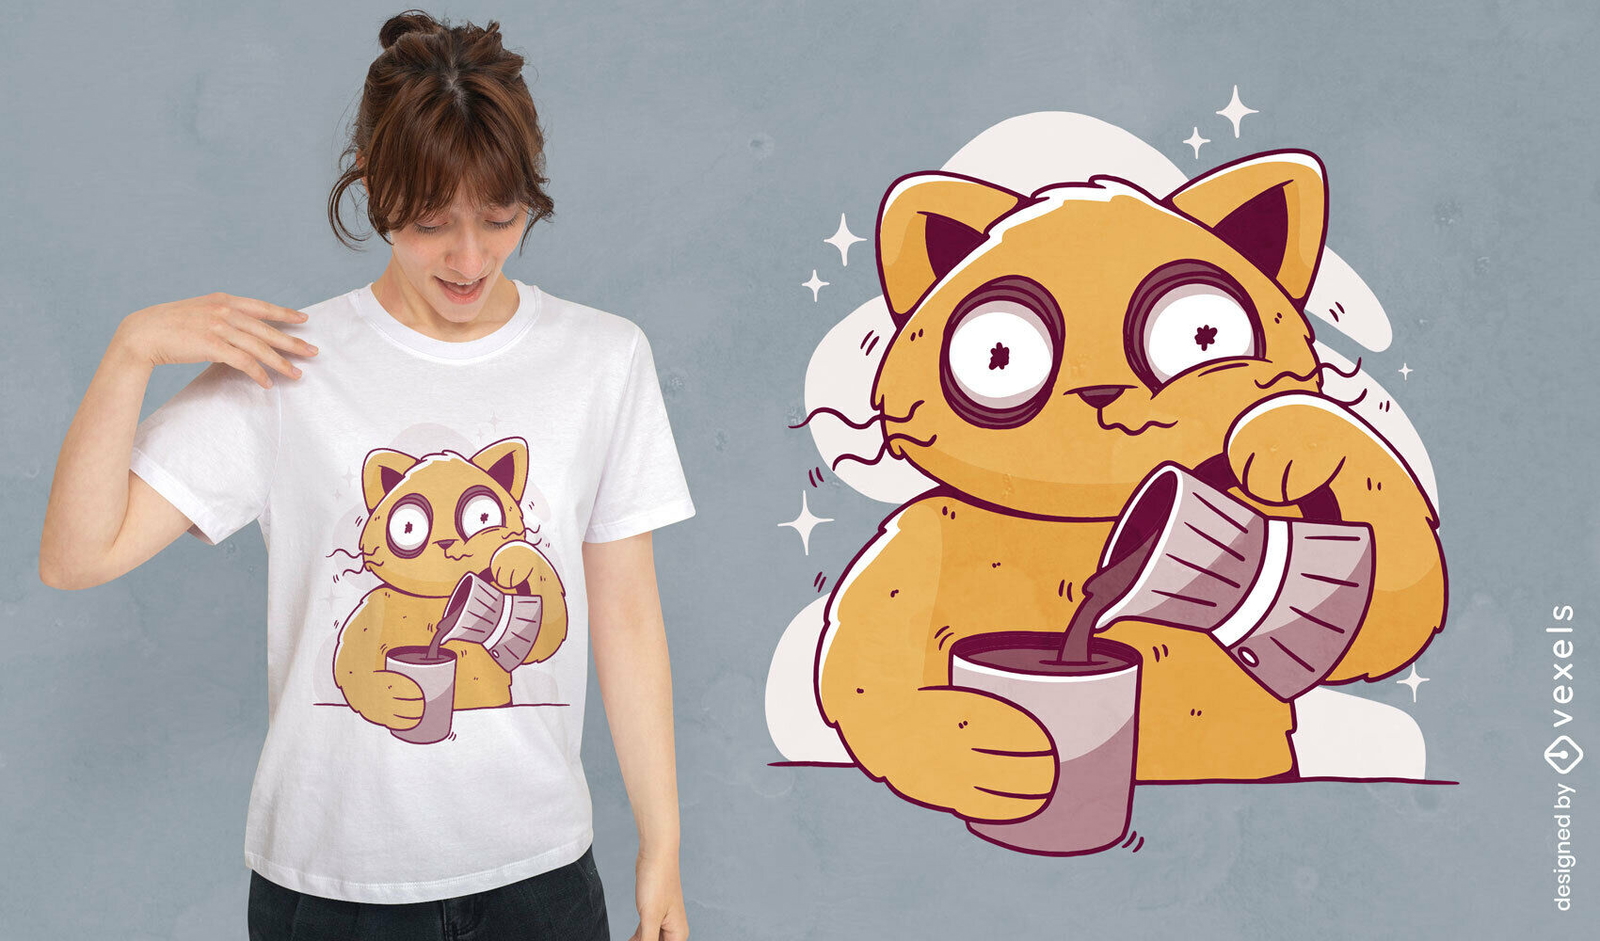
Design de camiseta de gato bebendo café com insônia
Escolha uma pasta
Todos os favoritos
Criar novo
Salvar
Design de camiseta de gato bebendo café com insônia
Pronto para imprimir
para Merch
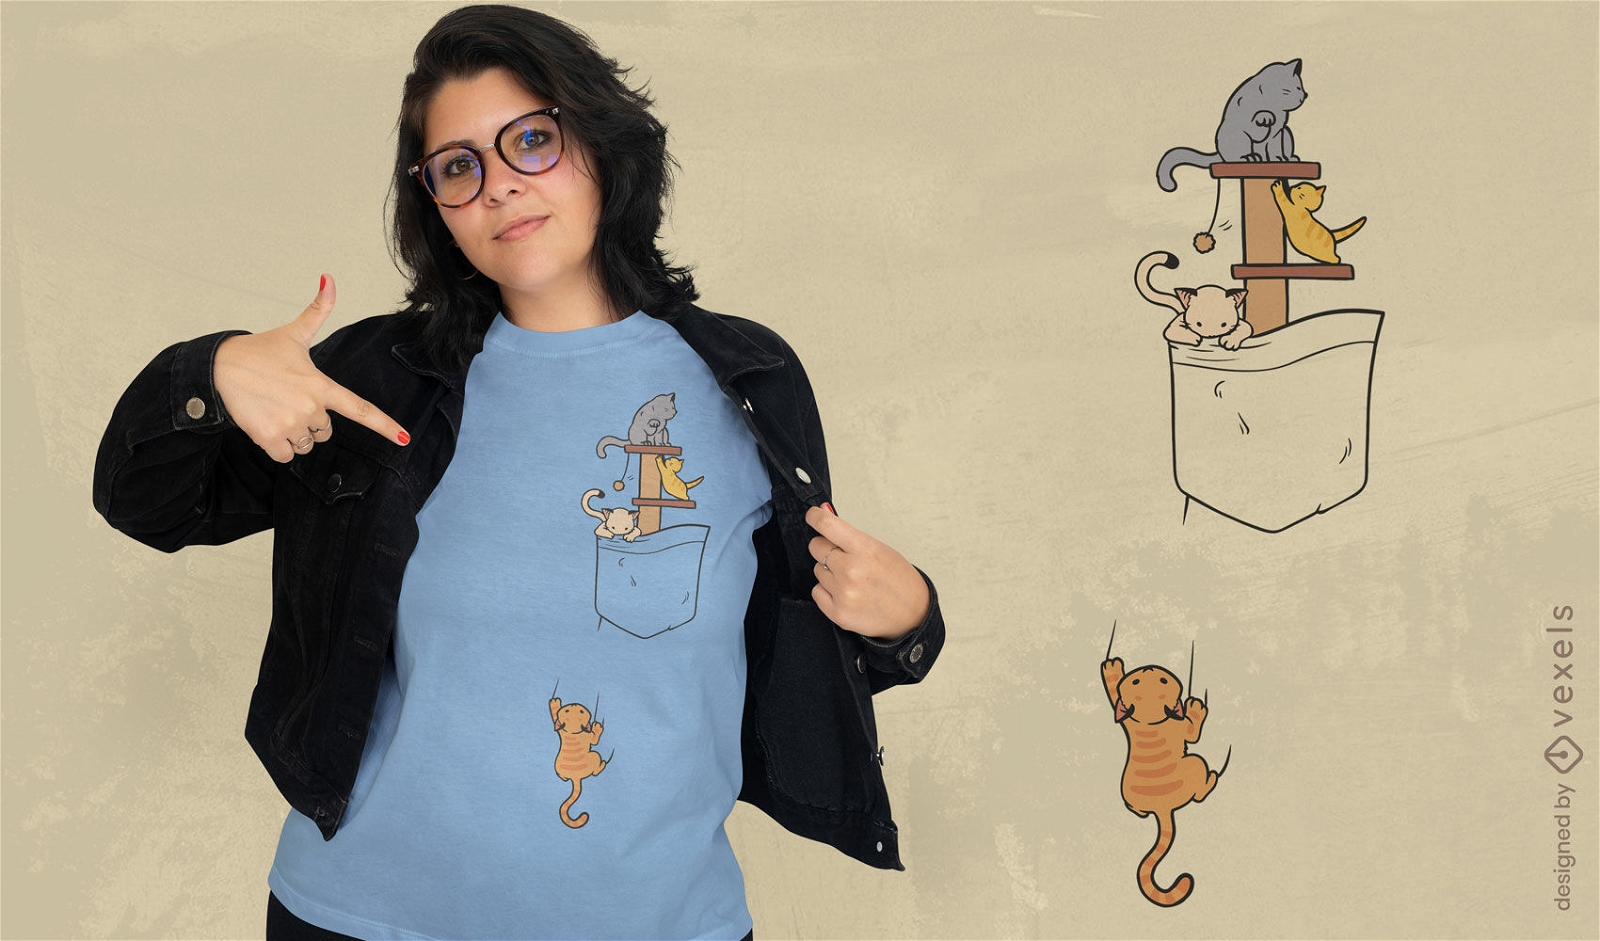
Gatos subindo no design de t-shirt de bolso
Escolha uma pasta
Todos os favoritos
Criar novo
Salvar
Gatos subindo no design de t-shirt de bolso
Pronto para imprimir
para Merch
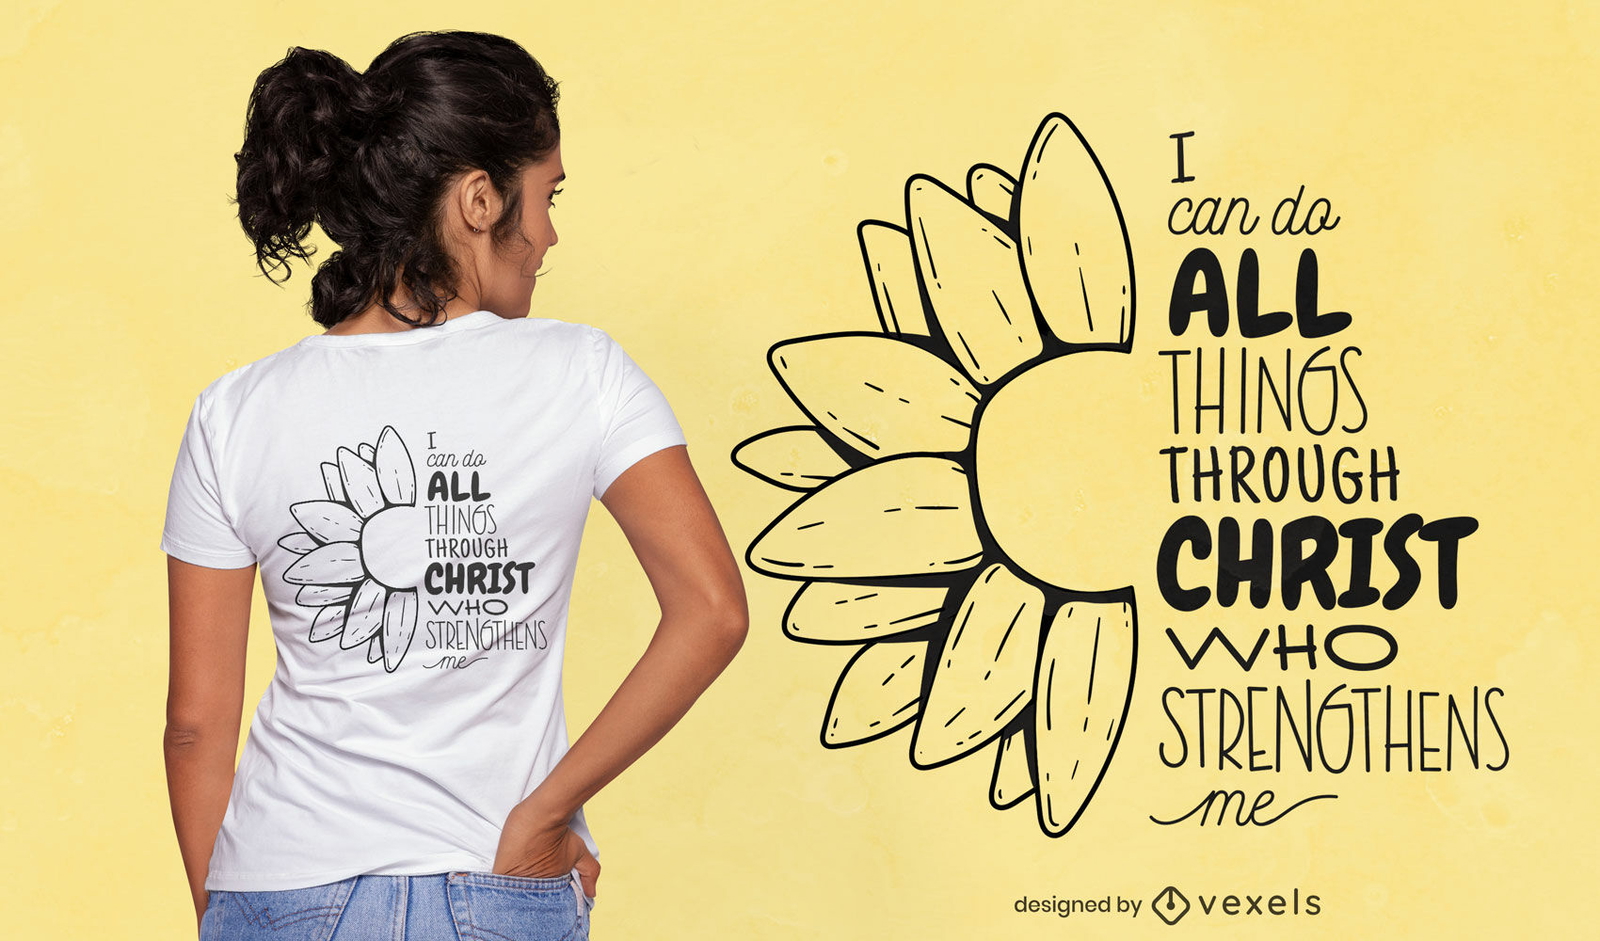
Design de t-shirt de citação religiosa cristã
Escolha uma pasta
Todos os favoritos
Criar novo
Salvar
Design de t-shirt de citação religiosa cristã
Pronto para imprimir
para Merch
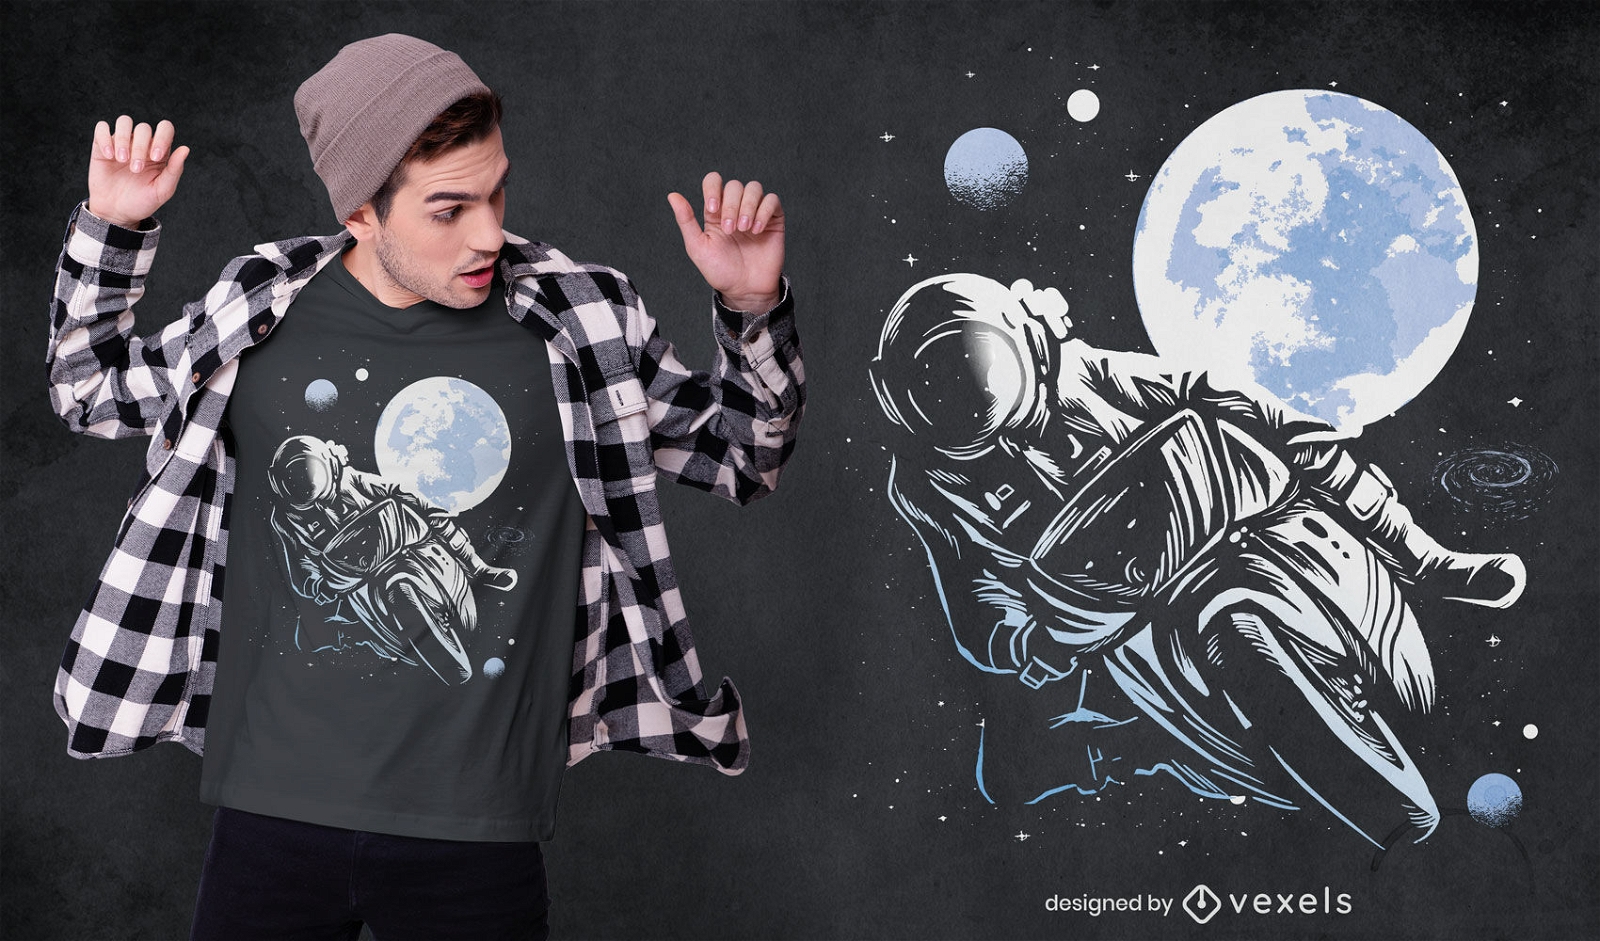
Design de camiseta de astronauta de motocicleta
Escolha uma pasta
Todos os favoritos
Criar novo
Salvar
Design de camiseta de astronauta de motocicleta
Pronto para imprimir
para Merch
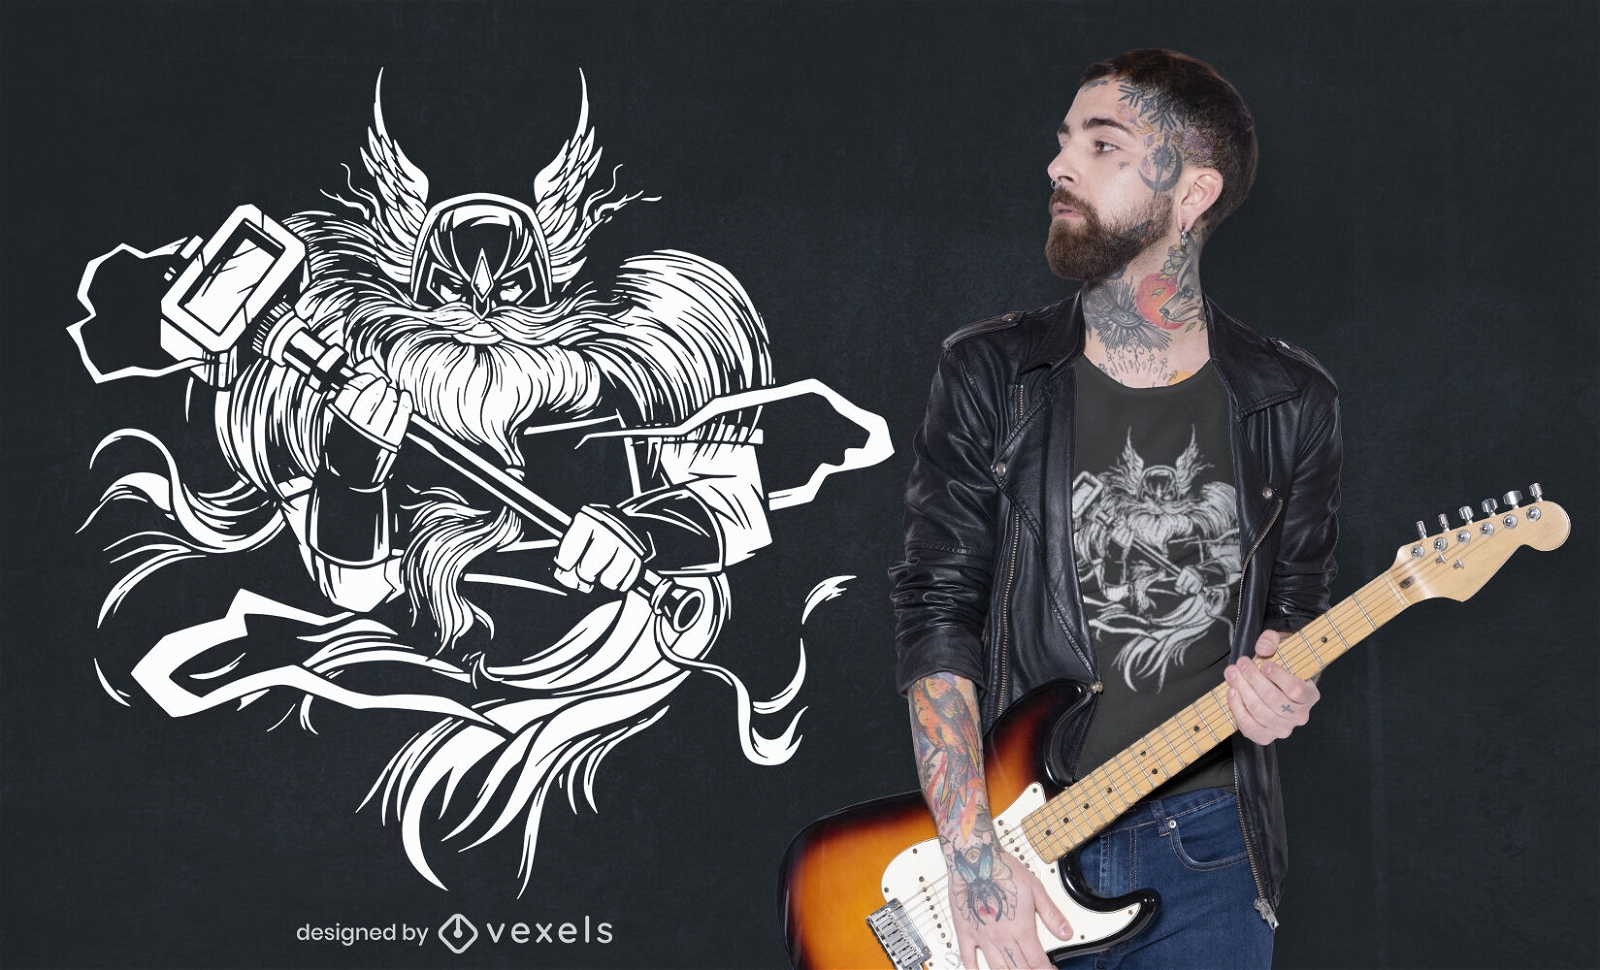
Viking com design de t-shirt de martelo
Escolha uma pasta
Todos os favoritos
Criar novo
Salvar
Viking com design de t-shirt de martelo
Impulsione seu negócio
Com a plataforma gráfica líder de mercado.
Ver planos
Próxima
do 546
prev page
next page