Biblioteca de design
Novos designs Merch
Camisetas
Vectores
Designs de Merch de Tendência
PNGs & SVGs
Mockups
Modelos de T-Shirt PSD
Explorar Desenhos
Designs KDP
Pôsteres
Canecas
Capas para celular
Sacos de compras
Almofadas
Ferramentas de desenho
Merch Designer
Novo!
Mockup Generator
Gerador de Design de AI
Vetorizador
Quote Generator
T-Shirt Maker (Antigo)
Ajuda
Merch Digest
Blog
Centro de Ajuda
Saiba mais sobre o Merch
Feedback
Soluções Corporativas
Empresa
Acesso à API
Estúdio de Design
Design em Lote
Preços
Carregando...
Inscrever-se
Conecte-se
All
graph
Biblioteca de design
Novos designs Merch
Camisetas
Vectores
Designs de Merch de Tendência
PNGs & SVGs
Mockups
Modelos de T-Shirt PSD
Explorar Desenhos
Designs KDP
Pôsteres
Canecas
Capas para celular
Sacos de compras
Almofadas
Ferramentas de desenho
Merch Designer
Novo!
Mockup Generator
Gerador de Design de AI
Vetorizador
Quote Generator
T-Shirt Maker (Antigo)
Ajuda
Merch Digest
Blog
Centro de Ajuda
Saiba mais sobre o Merch
Feedback
Soluções Corporativas
Empresa
Acesso à API
Estúdio de Design
Design em Lote
PLANOS
All
graph
364 Gráficos e Designs de graph para Camisetas e Merch print on demand
Baixar designs de camisetas e para merch, como capas de livro, capas de celular, tote bags e mais de graph
Relacionado:
graphixshare
,
este design graphic tee pode ser usado em camisas
,
historia em quadrinhos
Ordenar por
Mais relevante
Resultados patrocinados da
Ganhe 15% de desconto com o código: VEXELS15
veja mais detalhes
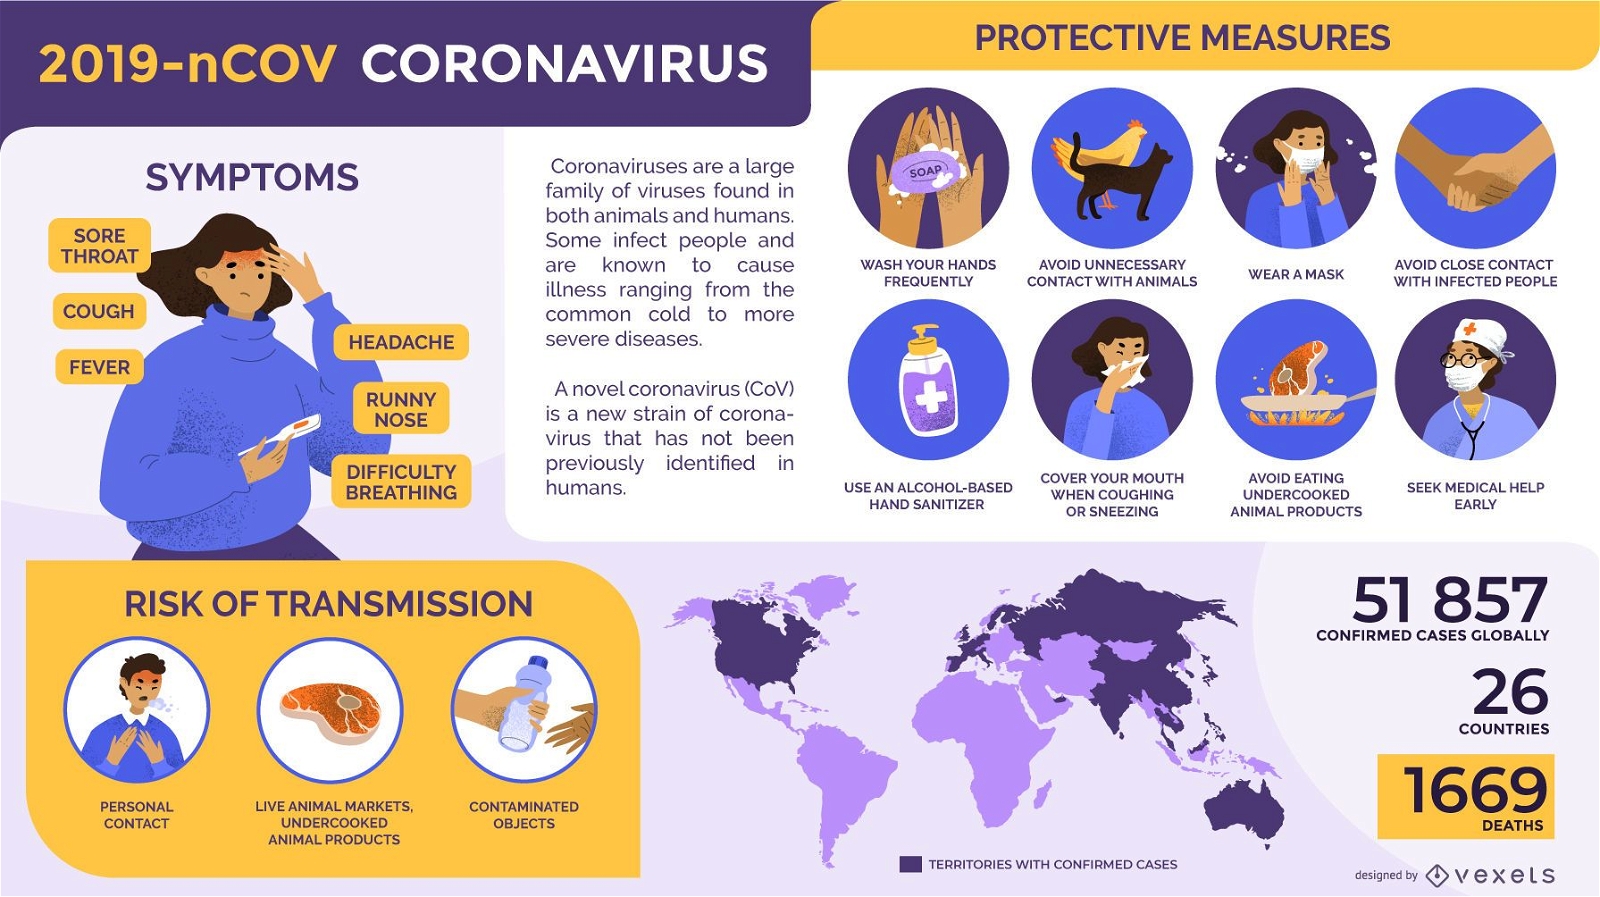
Premium
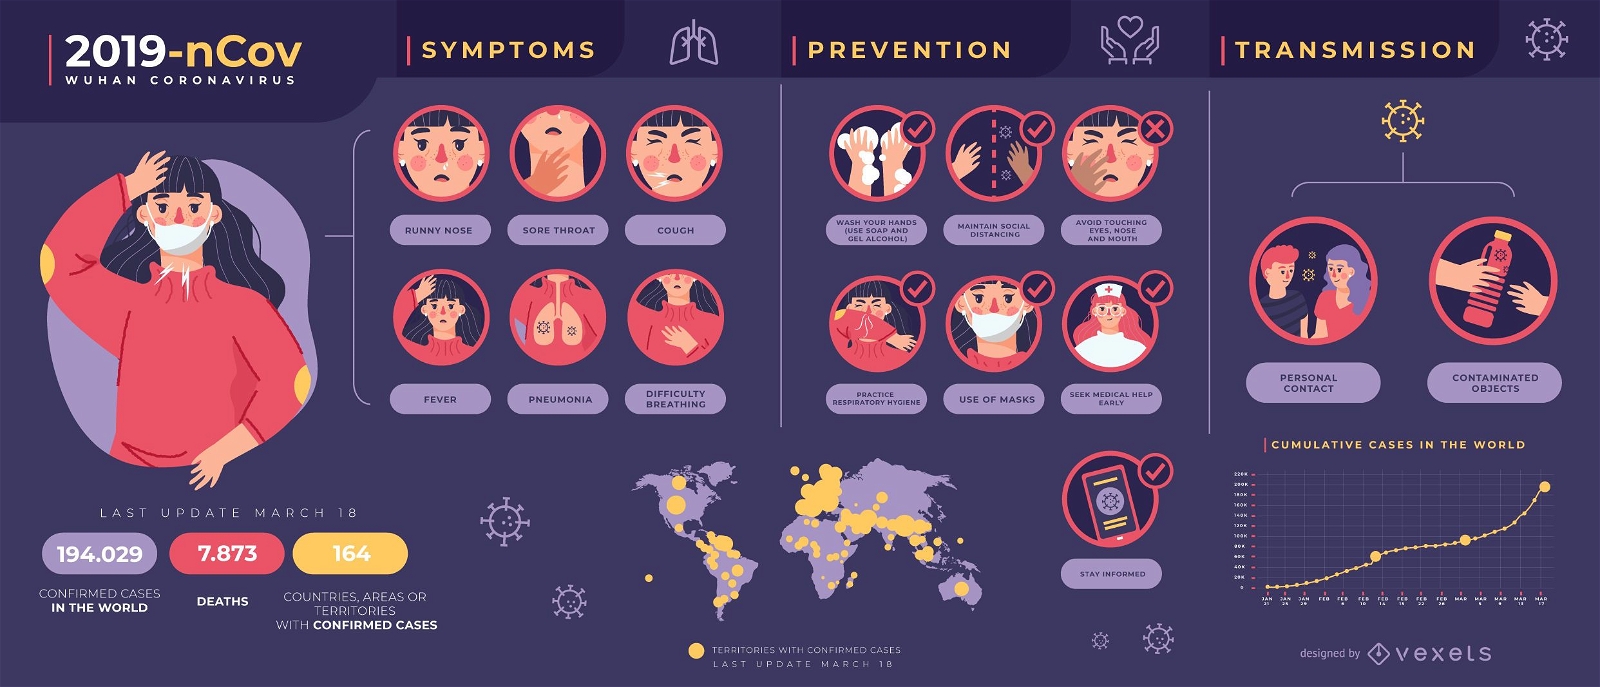
Modelo de infográfico de Covid-19 para coronavírus
Escolha uma pasta
Todos os favoritos
Criar novo
Salvar
Modelo de infográfico de Covid-19 para coronavírus
Desenho de empresário apresentando quadro Desenho PNG
Escolha uma pasta
Todos os favoritos
Criar novo
Salvar
Desenho de empresário apresentando quadro Desenho PNG
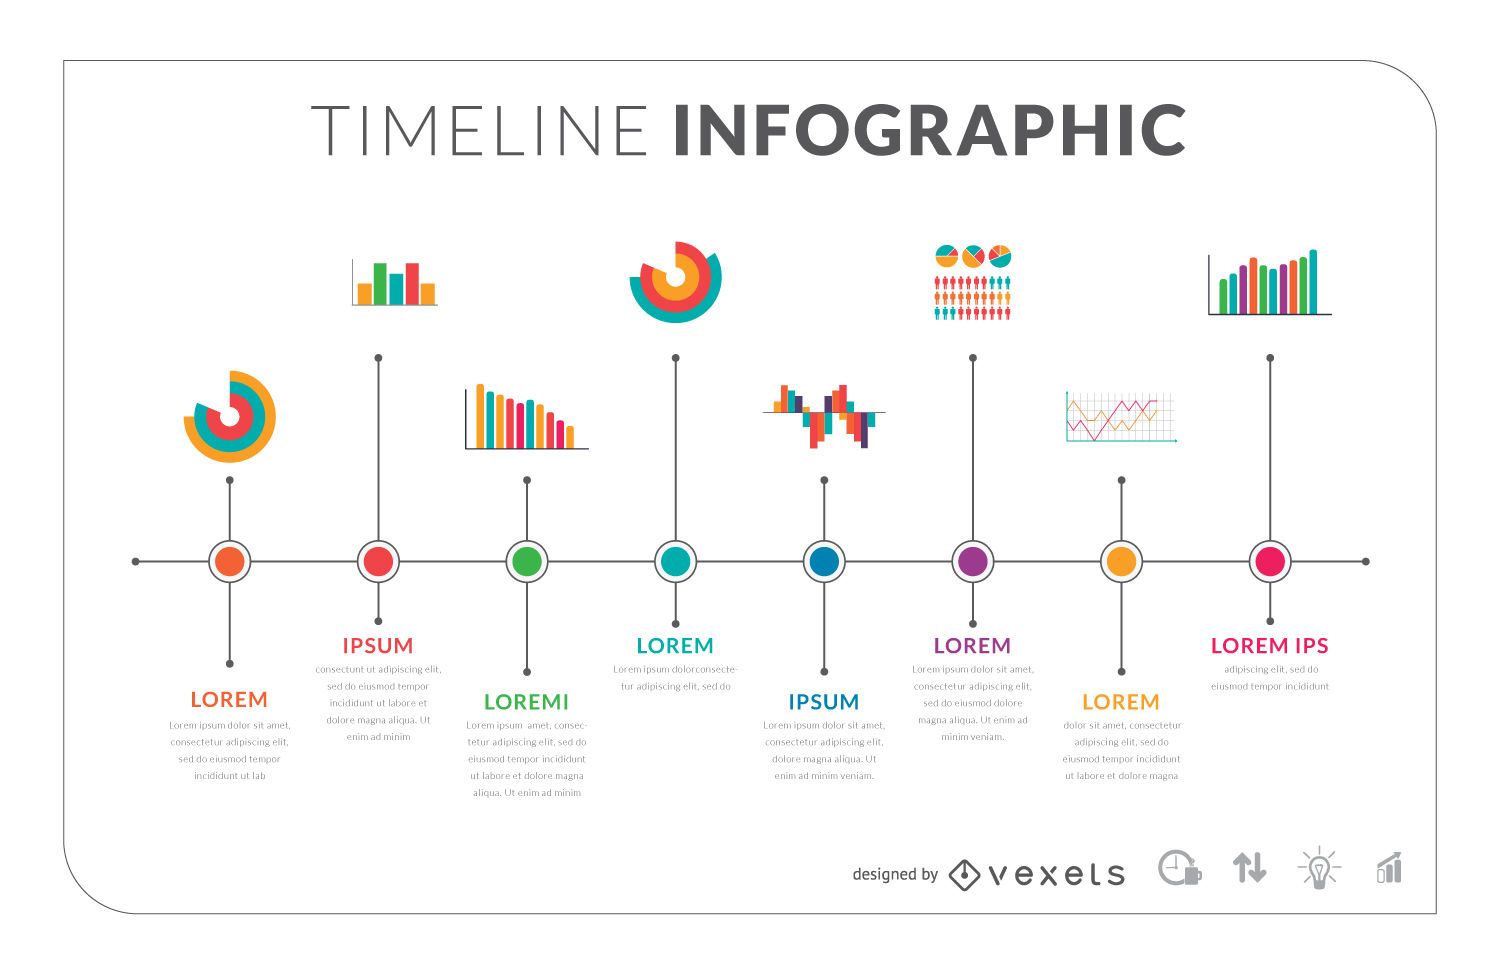
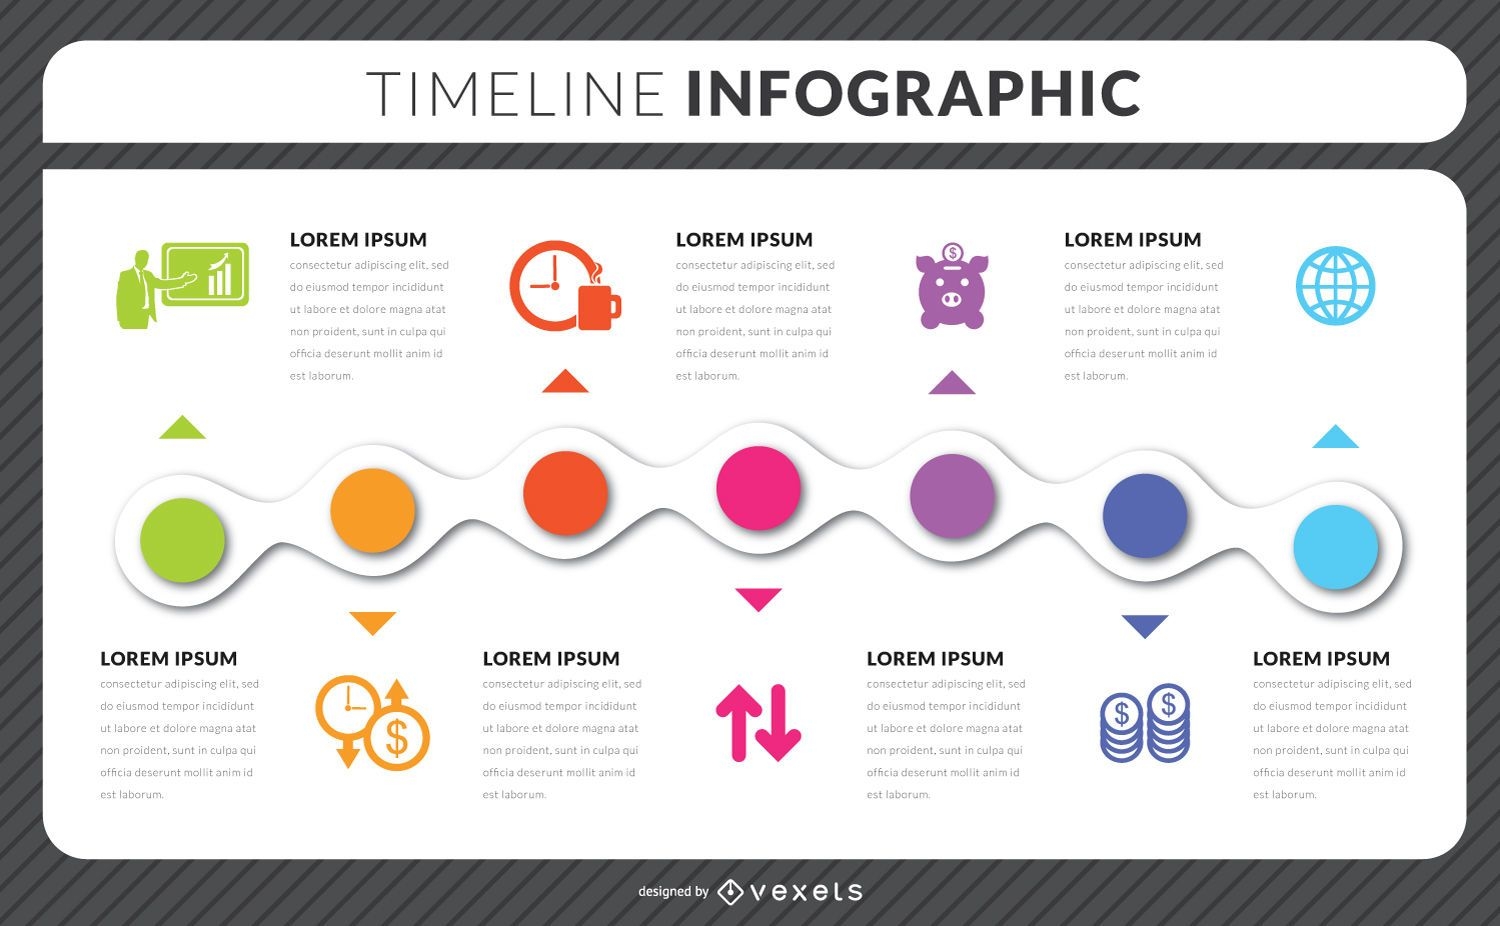
Infográfico de linha do tempo plana
Escolha uma pasta
Todos os favoritos
Criar novo
Salvar
Infográfico de linha do tempo plana
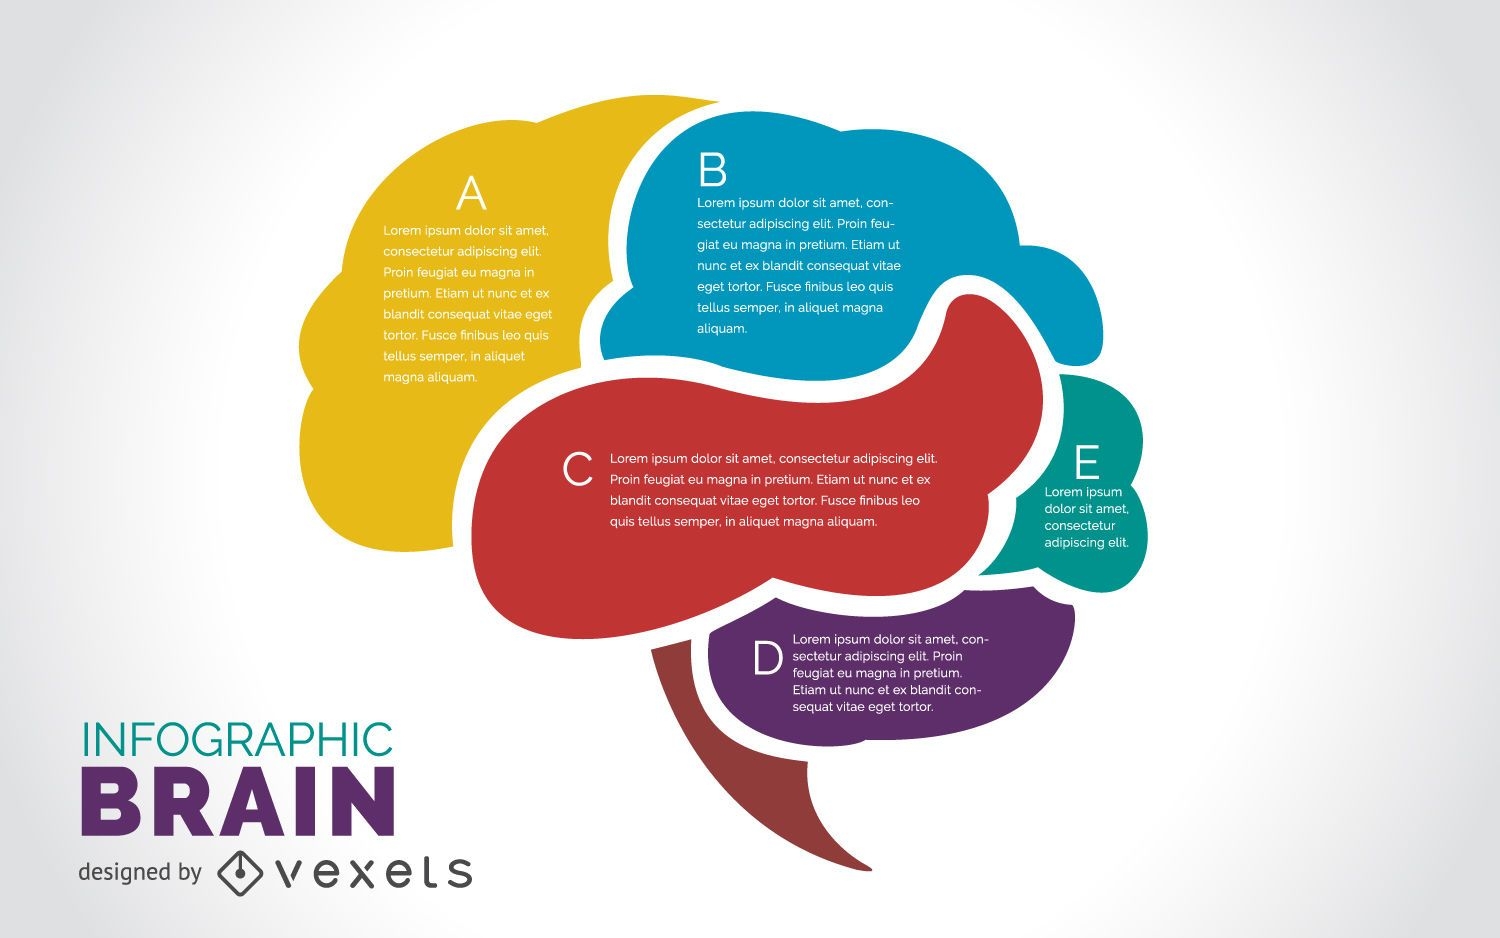
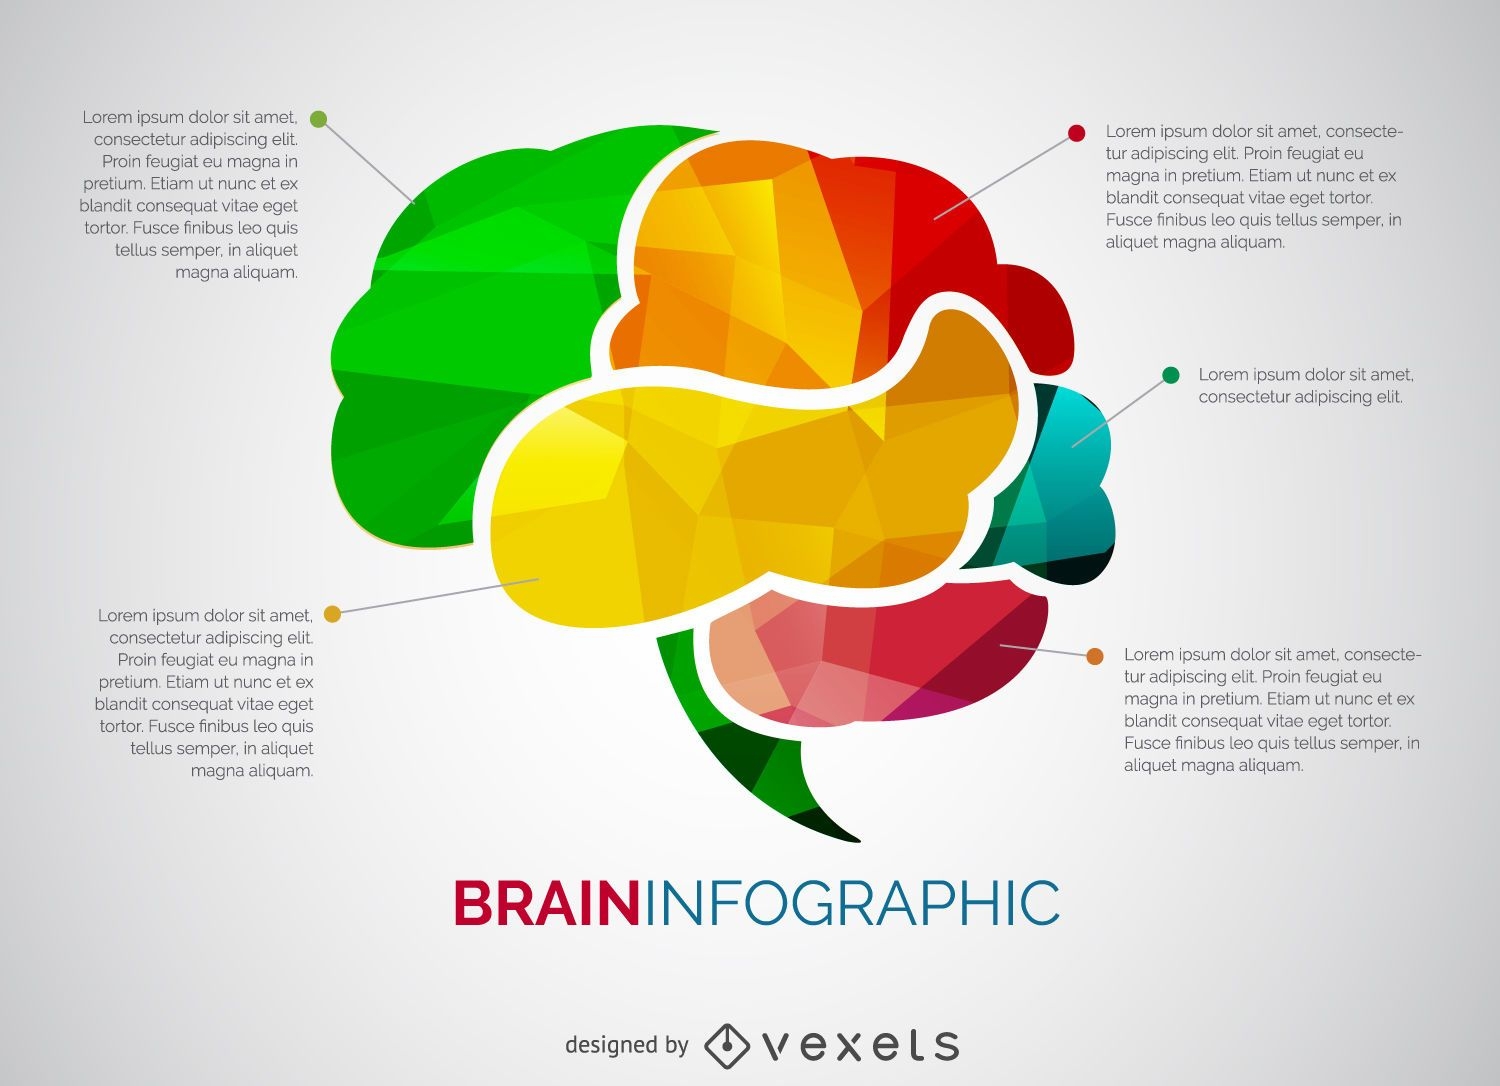
Infográfico de cérebro plano
Escolha uma pasta
Todos os favoritos
Criar novo
Salvar
Infográfico de cérebro plano
104 Conjunto de ícones de negócios simples
Escolha uma pasta
Todos os favoritos
Criar novo
Salvar
104 Conjunto de ícones de negócios simples
Círculo de progresso de 50 por cento Desenho PNG
Escolha uma pasta
Todos os favoritos
Criar novo
Salvar
Círculo de progresso de 50 por cento Desenho PNG
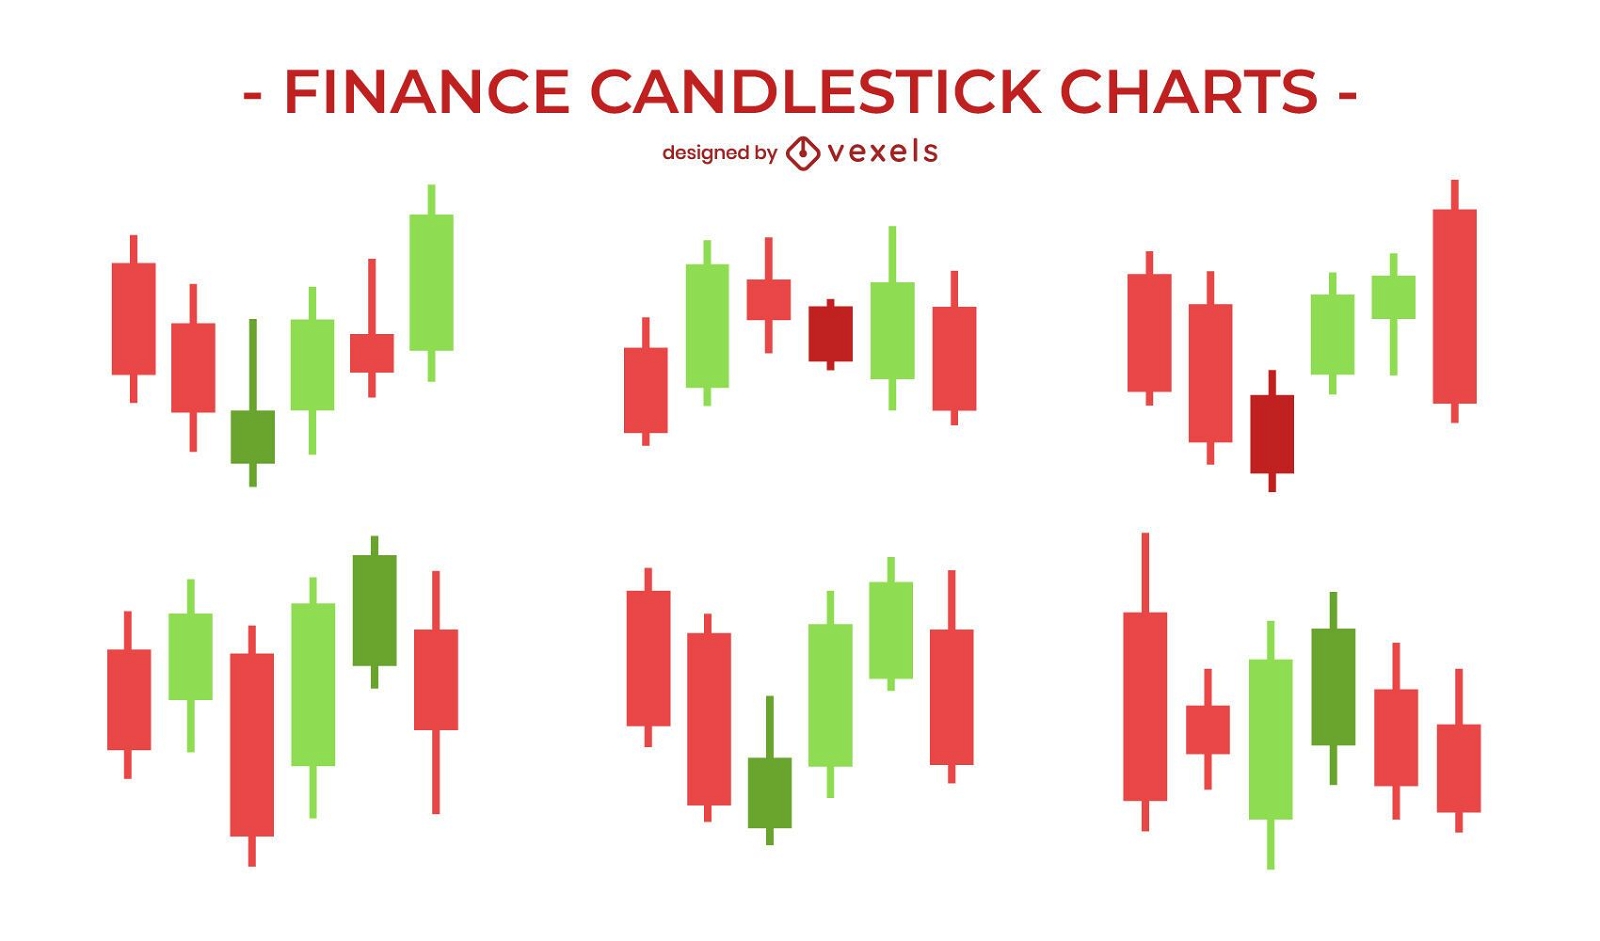
Conjunto de gráfico candlestick de finanças
Escolha uma pasta
Todos os favoritos
Criar novo
Salvar
Conjunto de gráfico candlestick de finanças
Coração com linha de vida
Escolha uma pasta
Todos os favoritos
Criar novo
Salvar
Coração com linha de vida
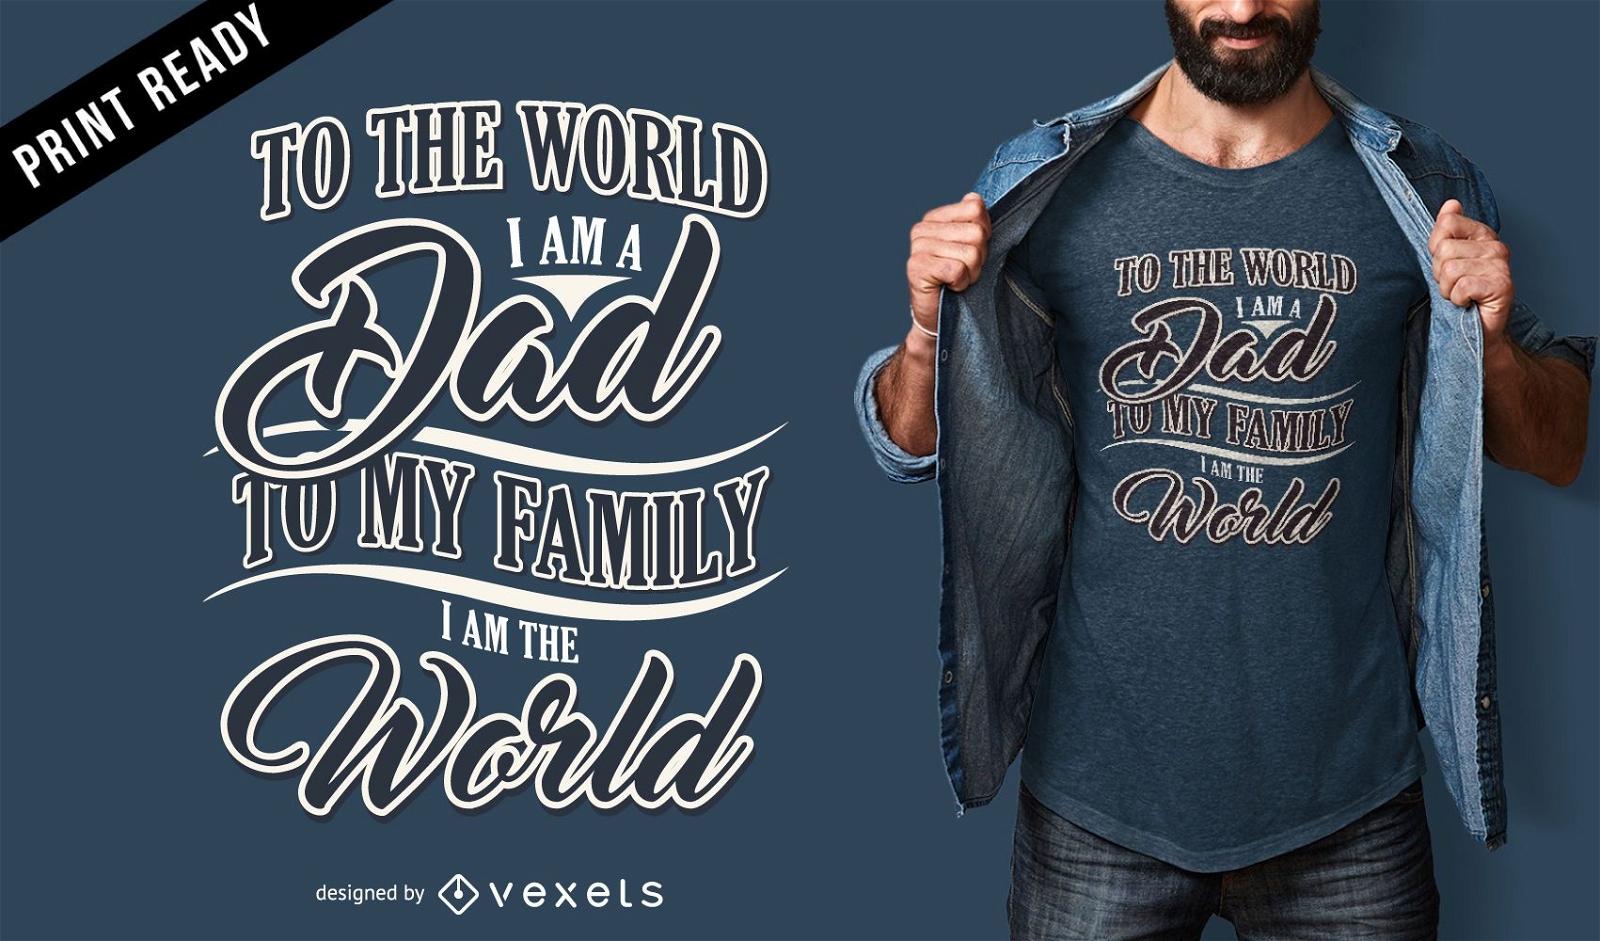
Pronto para imprimir
para Merch
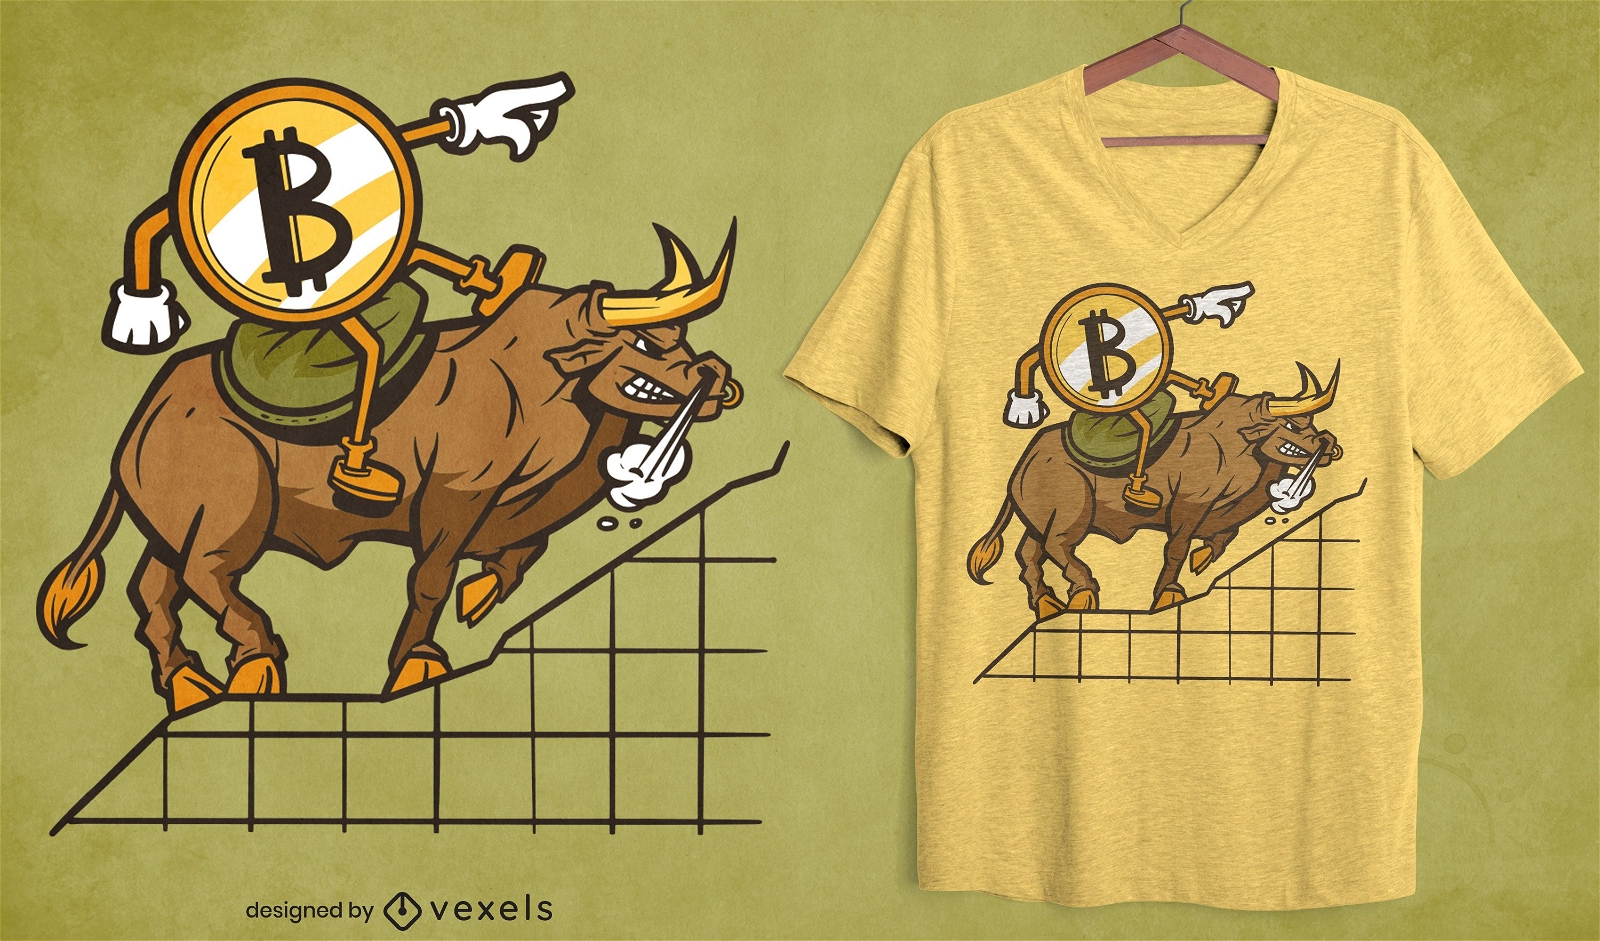
Design de t-shirt de desenho animado cripto montando touro
Escolha uma pasta
Todos os favoritos
Criar novo
Salvar
Design de t-shirt de desenho animado cripto montando touro
Empresário mostrando desenho animado do tablet Desenho PNG
Escolha uma pasta
Todos os favoritos
Criar novo
Salvar
Empresário mostrando desenho animado do tablet Desenho PNG
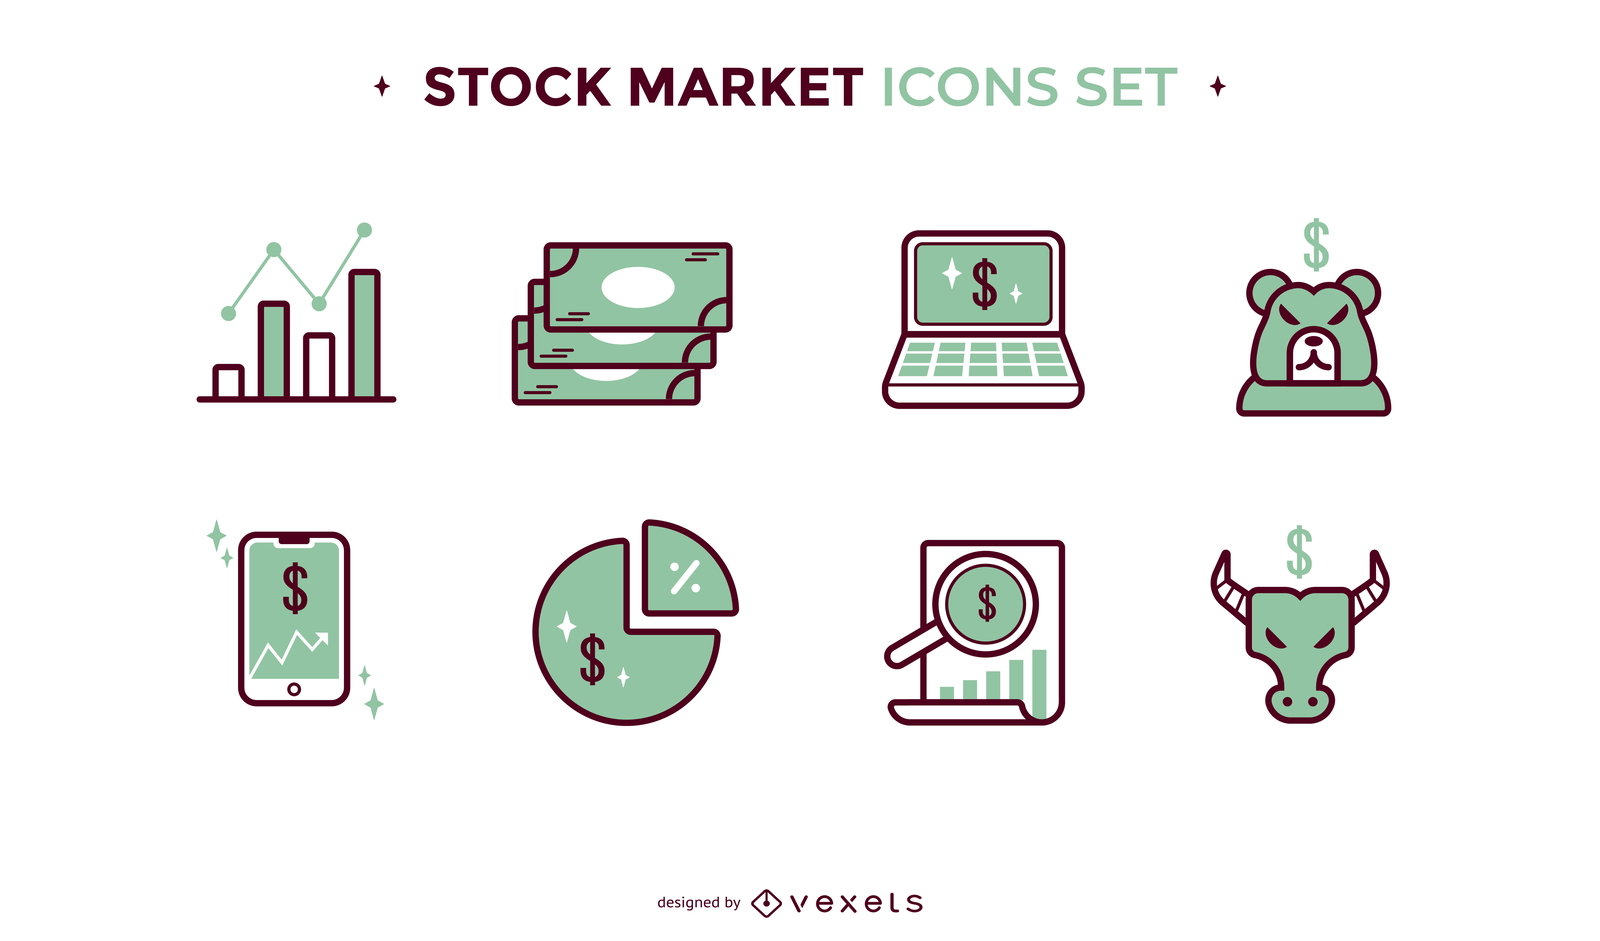
Conjunto de design de ícones de negócios e finanças
Escolha uma pasta
Todos os favoritos
Criar novo
Salvar
Conjunto de design de ícones de negócios e finanças
Ícones de negócios em 3D e em forma de crachá
Escolha uma pasta
Todos os favoritos
Criar novo
Salvar
Ícones de negócios em 3D e em forma de crachá
Infográfico do cérebro
Escolha uma pasta
Todos os favoritos
Criar novo
Salvar
Infográfico do cérebro
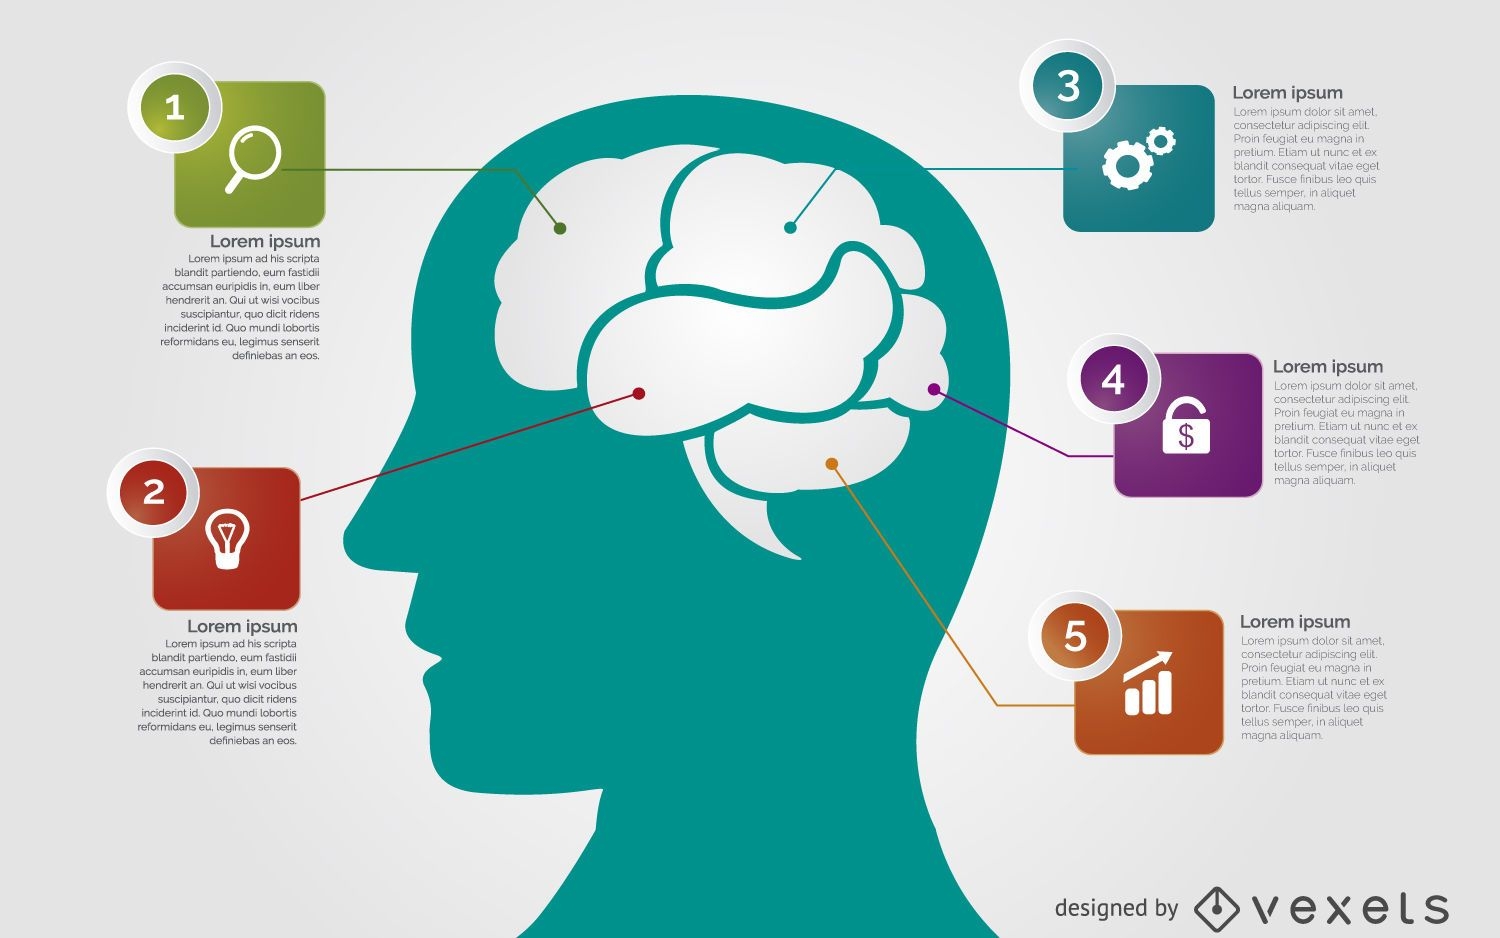
Infográfico ilustrado de cabeça
Escolha uma pasta
Todos os favoritos
Criar novo
Salvar
Infográfico ilustrado de cabeça
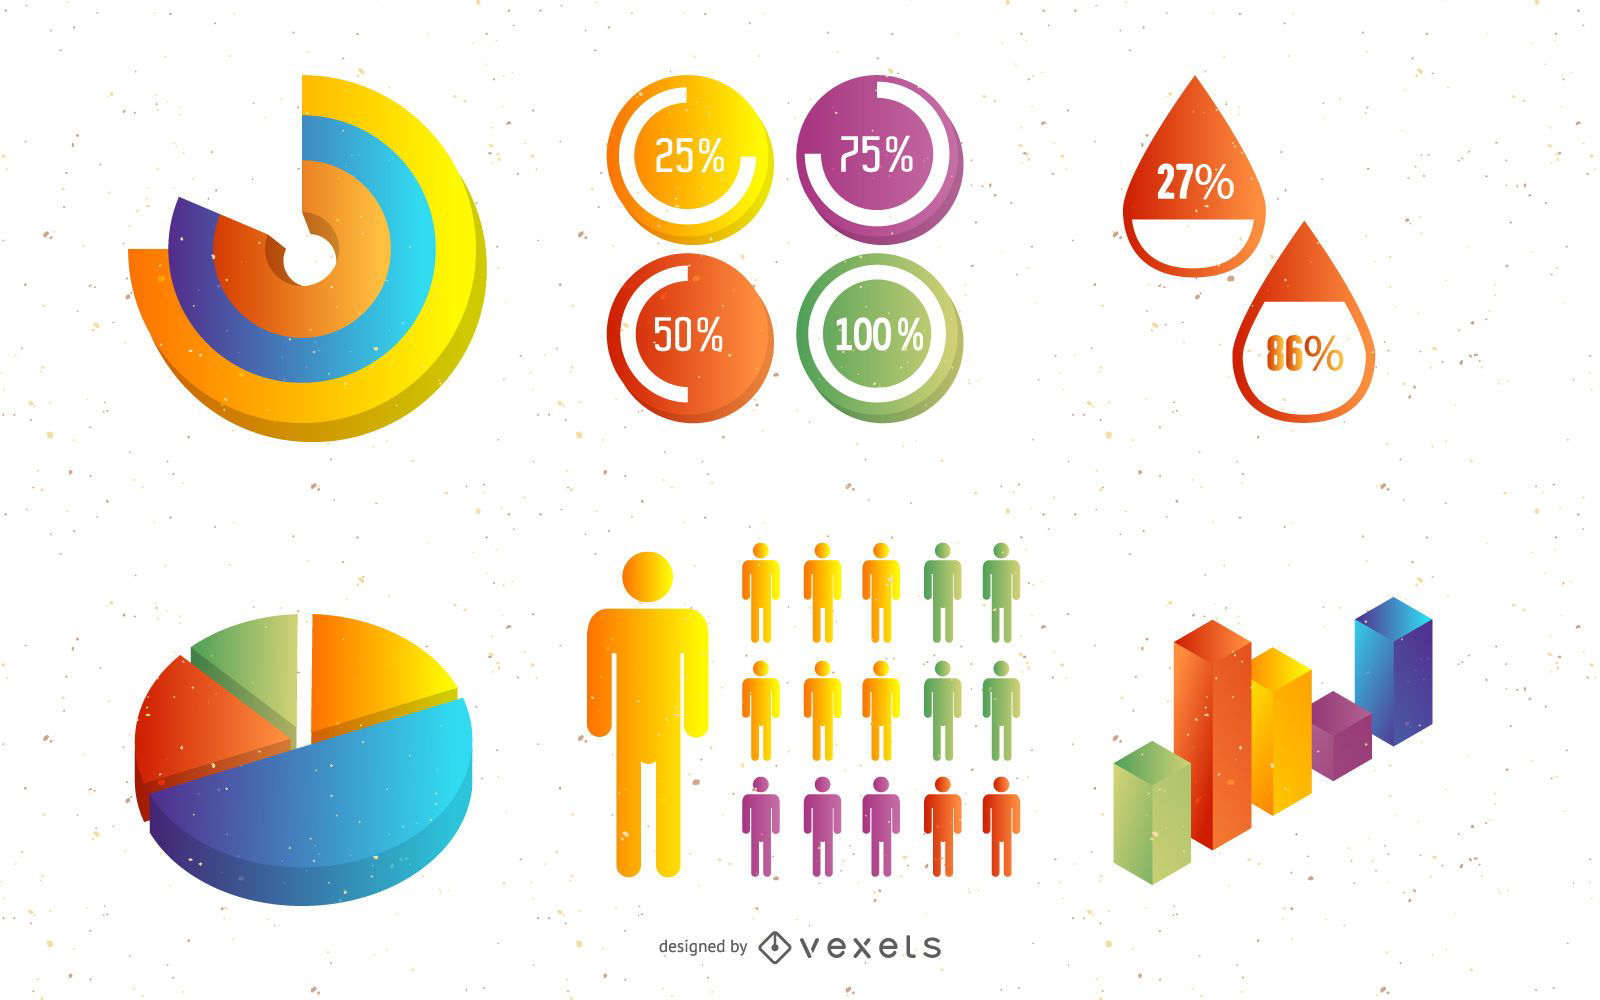
Modelo de pacote de infográfico criativo 3D brilhante
Escolha uma pasta
Todos os favoritos
Criar novo
Salvar
Modelo de pacote de infográfico criativo 3D brilhante
Premium
Gráfico de linhas coloridas em crescimento Desenho PNG
Escolha uma pasta
Todos os favoritos
Criar novo
Salvar
Gráfico de linhas coloridas em crescimento Desenho PNG
Premium
Ícones de traçado de cor de ações e finanças
Escolha uma pasta
Todos os favoritos
Criar novo
Salvar
Ícones de traçado de cor de ações e finanças
Premium
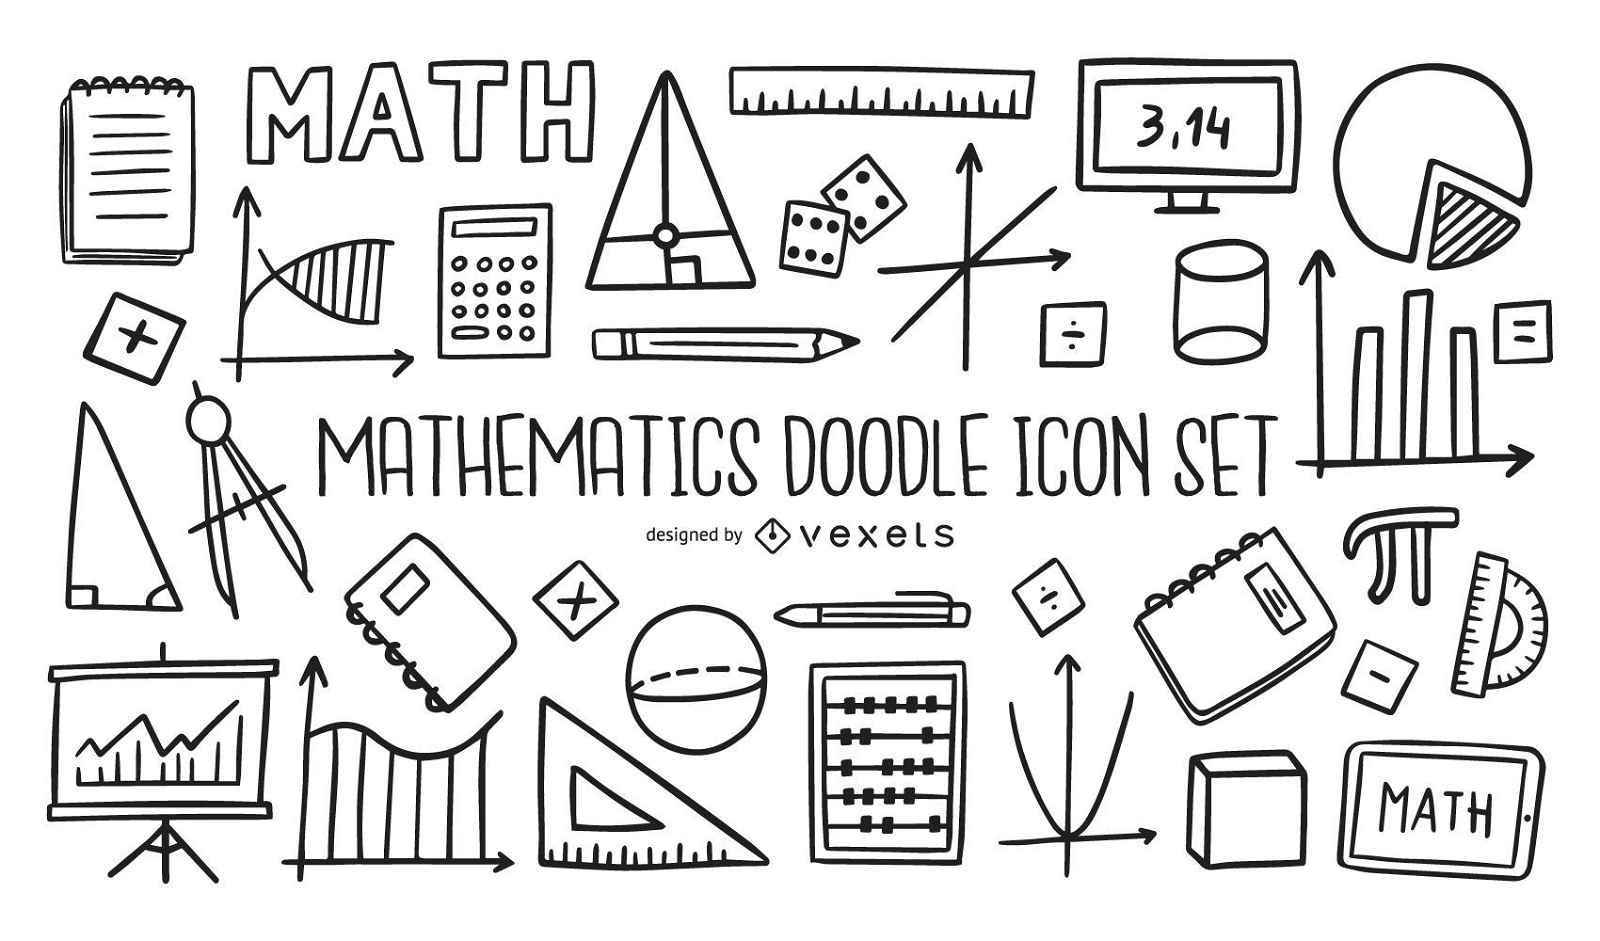
Coleção de conjunto de ícones de doodle de matemática
Escolha uma pasta
Todos os favoritos
Criar novo
Salvar
Coleção de conjunto de ícones de doodle de matemática
Etiqueta de progresso circular de 25 por cento Desenho PNG
Escolha uma pasta
Todos os favoritos
Criar novo
Salvar
Etiqueta de progresso circular de 25 por cento Desenho PNG
Premium
Ilustração do gráfico de marketing Desenho PNG
Escolha uma pasta
Todos os favoritos
Criar novo
Salvar
Ilustração do gráfico de marketing Desenho PNG
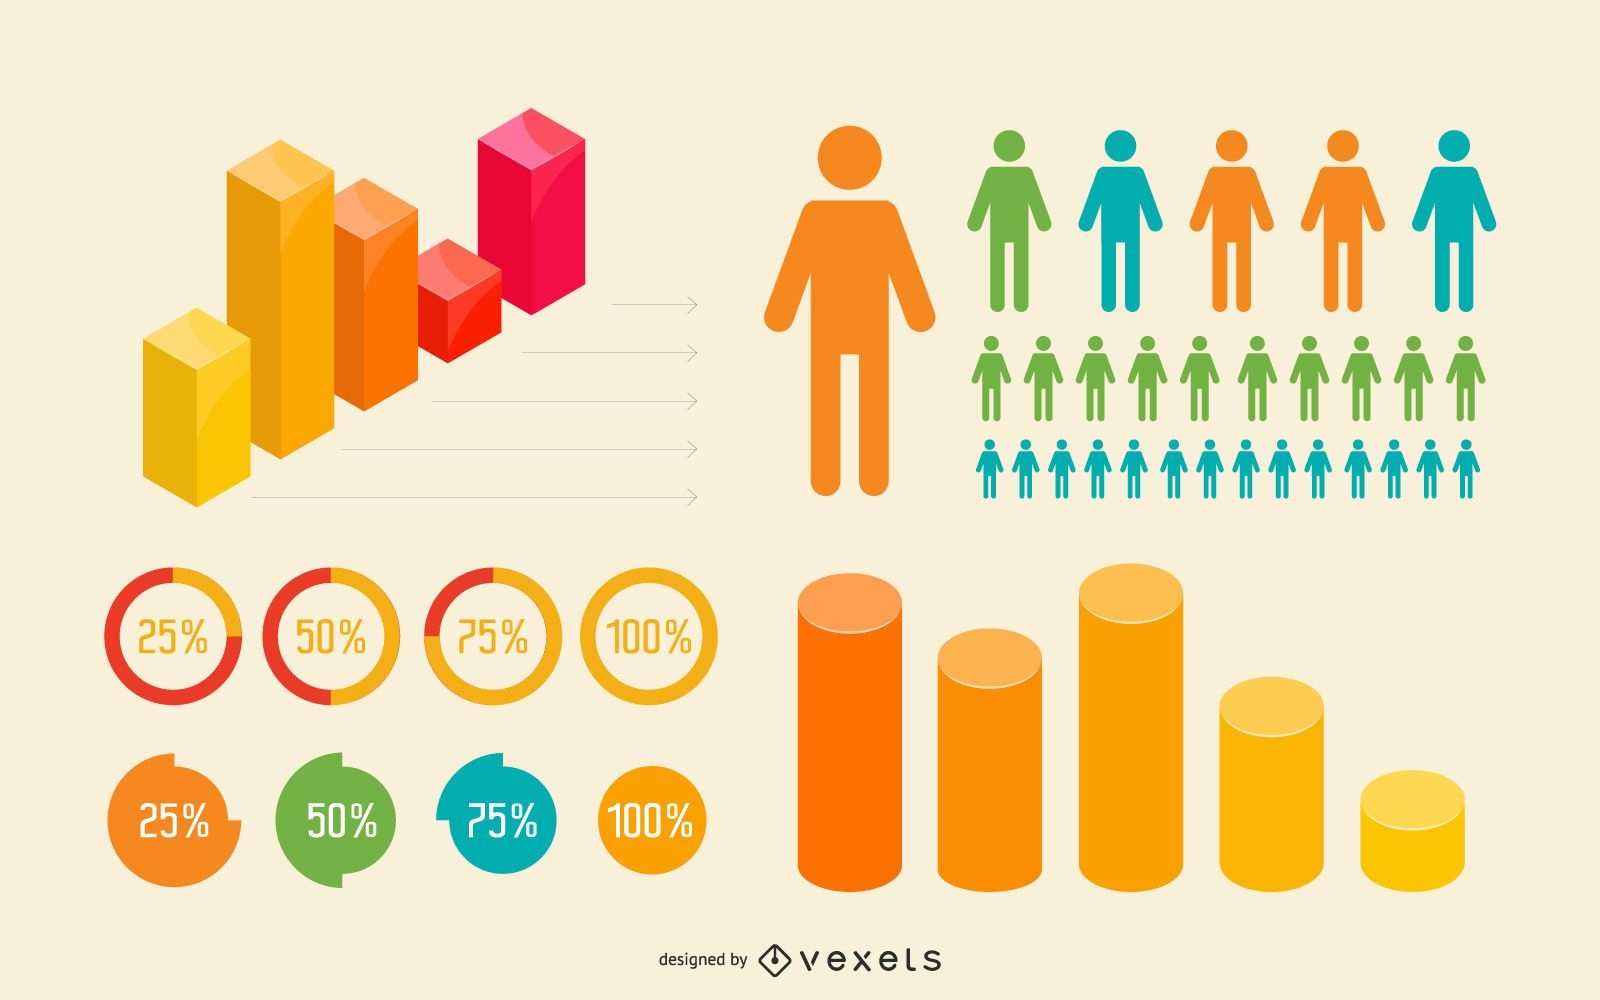
Elementos de infográfico coloridos brilhantes
Escolha uma pasta
Todos os favoritos
Criar novo
Salvar
Elementos de infográfico coloridos brilhantes
texto editável
Modelo de infográfico de Coronavirus
Escolha uma pasta
Todos os favoritos
Criar novo
Salvar
Modelo de infográfico de Coronavirus
Conjunto de vetores de fundo colorido abstrato
Escolha uma pasta
Todos os favoritos
Criar novo
Salvar
Conjunto de vetores de fundo colorido abstrato
4 banners de adesivos de trabalho
Escolha uma pasta
Todos os favoritos
Criar novo
Salvar
4 banners de adesivos de trabalho
Premium
Gráfico de setas Desenho PNG
Escolha uma pasta
Todos os favoritos
Criar novo
Salvar
Gráfico de setas Desenho PNG
Premium
Gráfico infográfico de 50 por cento do doodle Desenho PNG
Escolha uma pasta
Todos os favoritos
Criar novo
Salvar
Gráfico infográfico de 50 por cento do doodle Desenho PNG
Grande ideia design desenhado à mão
Escolha uma pasta
Todos os favoritos
Criar novo
Salvar
Grande ideia design desenhado à mão
Pacote de ícones de negócios analíticos e gráficos
Escolha uma pasta
Todos os favoritos
Criar novo
Salvar
Pacote de ícones de negócios analíticos e gráficos
Premium
Infográfico de prevenção do Coronavirus
Escolha uma pasta
Todos os favoritos
Criar novo
Salvar
Infográfico de prevenção do Coronavirus
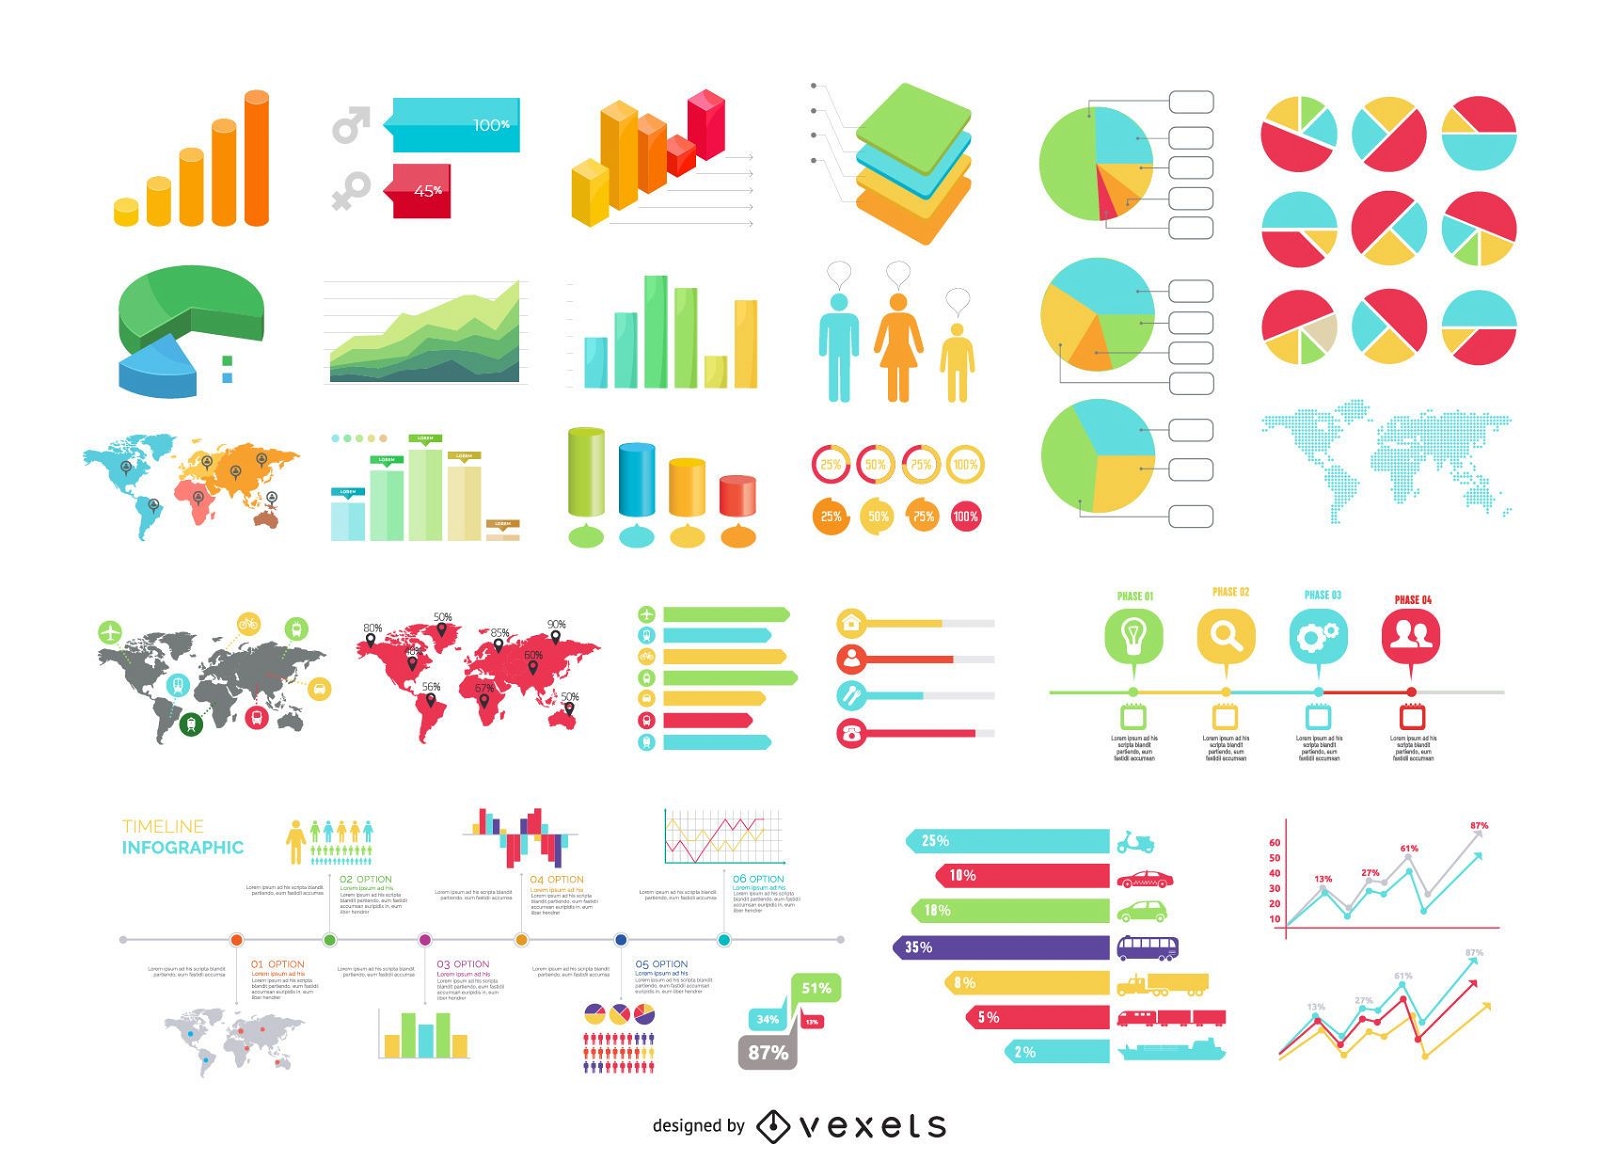
Conjunto de gráficos de informações 30 Plus com mapas e estatísticas
Escolha uma pasta
Todos os favoritos
Criar novo
Salvar
Conjunto de gráficos de informações 30 Plus com mapas e estatísticas
Elementos desenhados à mão de doodle de negócios
Escolha uma pasta
Todos os favoritos
Criar novo
Salvar
Elementos desenhados à mão de doodle de negócios
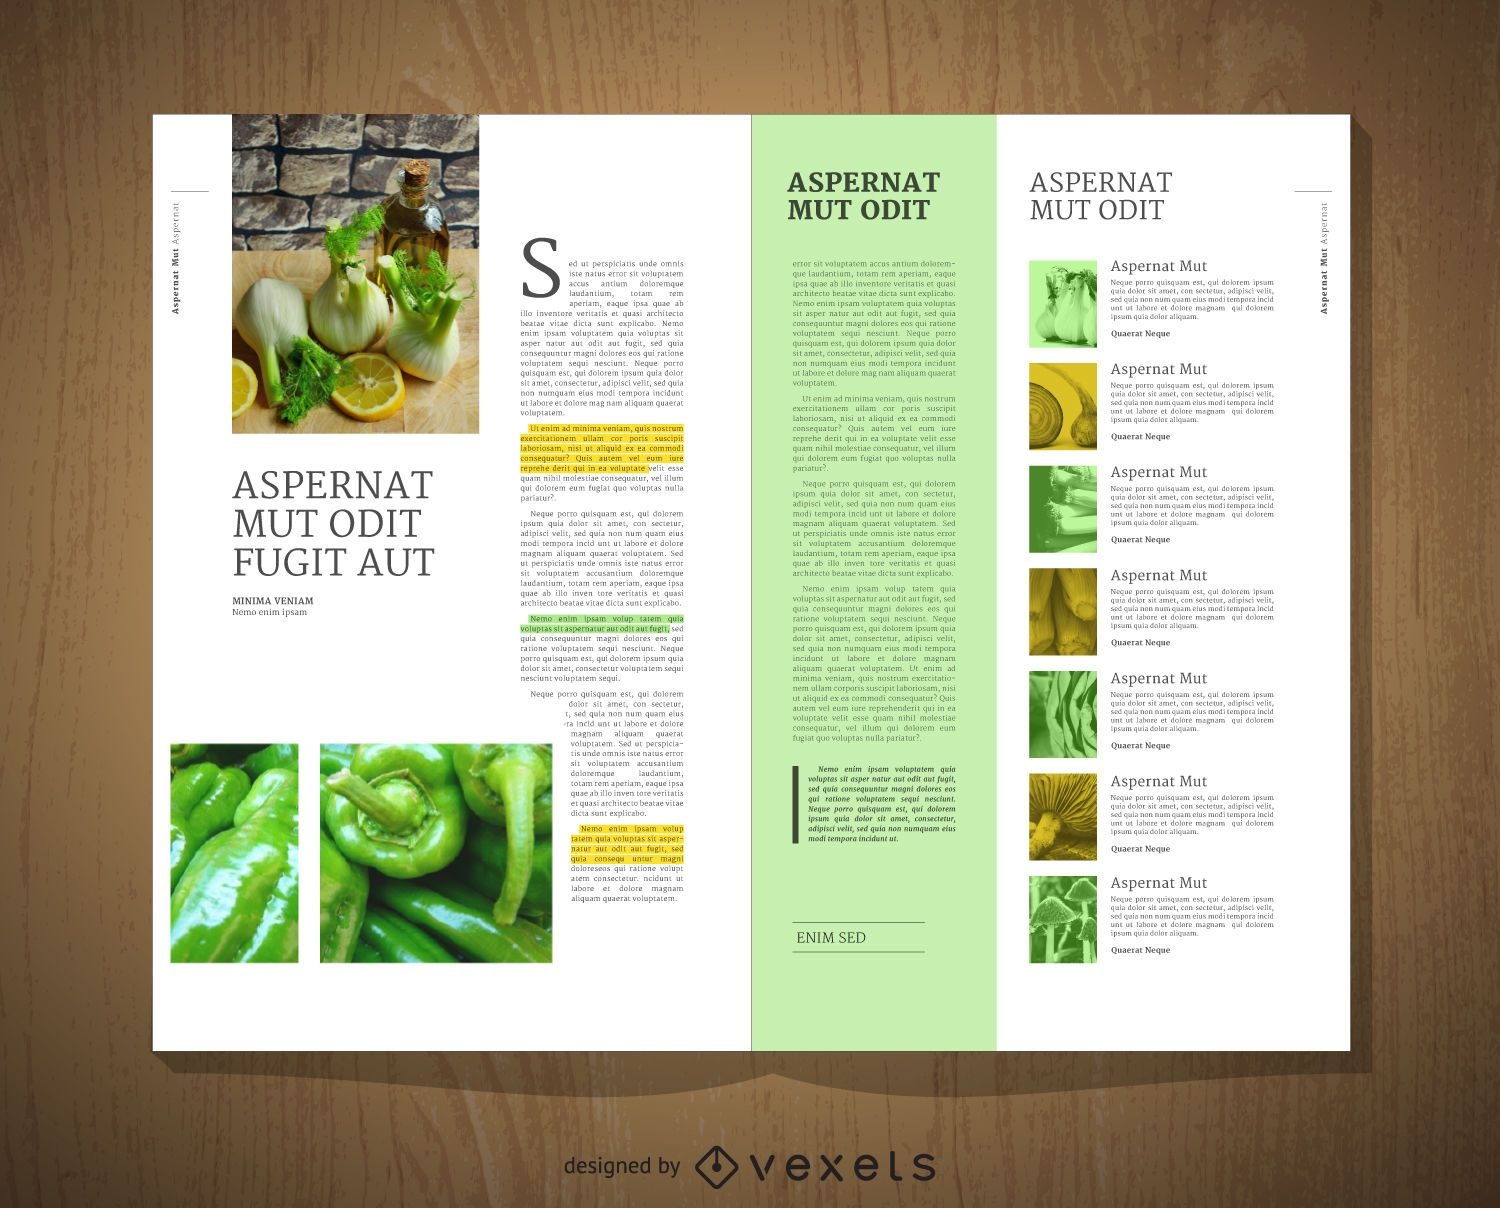
Design de modelo editorial
Escolha uma pasta
Todos os favoritos
Criar novo
Salvar
Design de modelo editorial
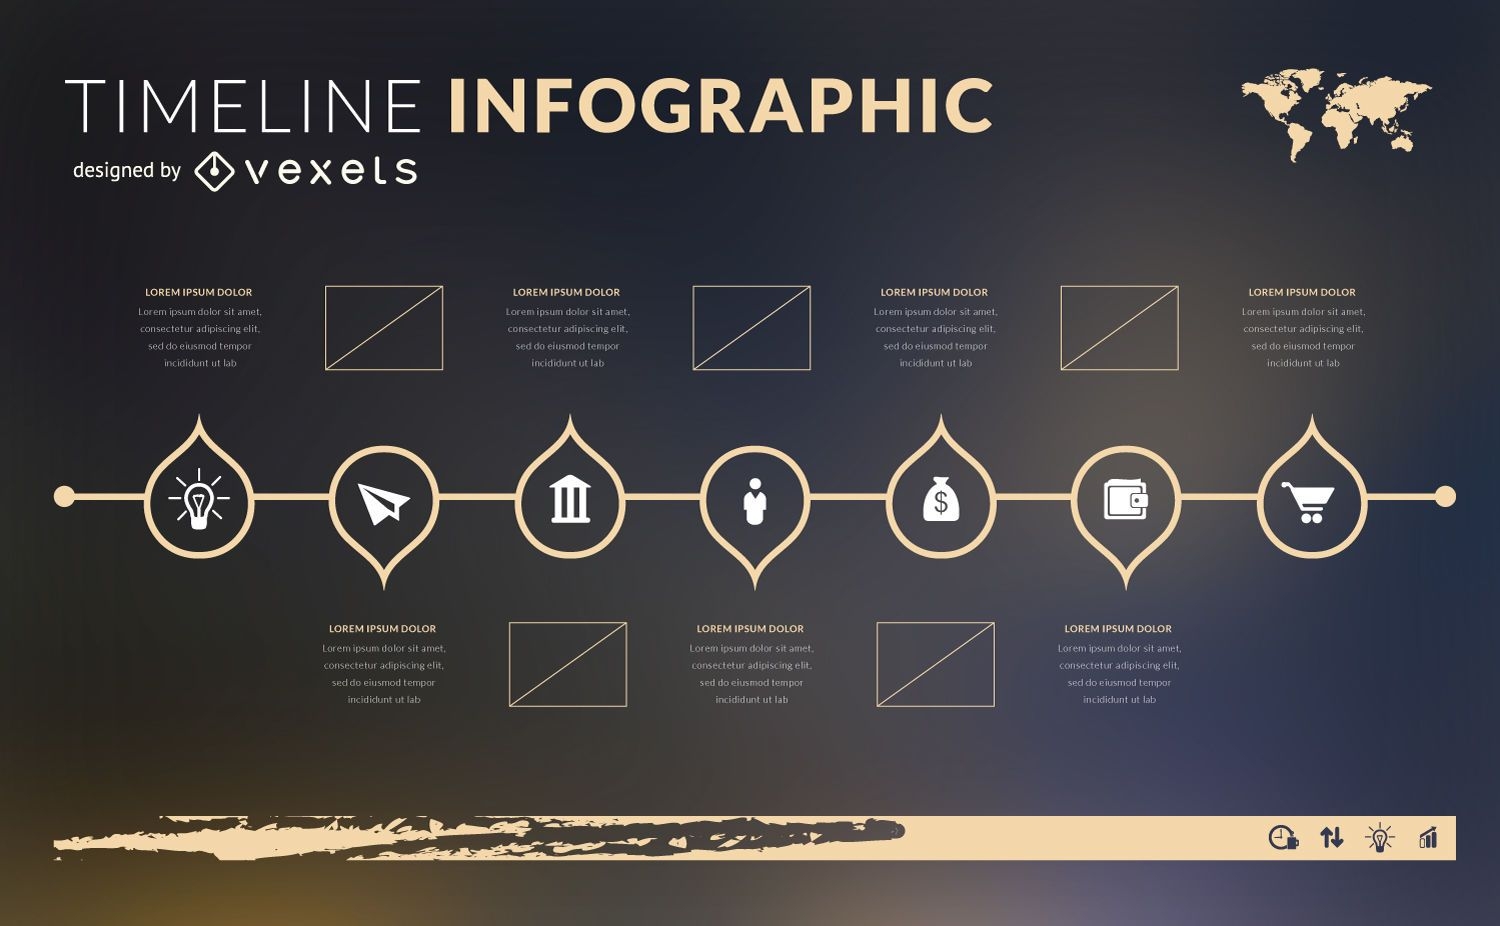
Modelo de infográfico de cronograma de design plano
Escolha uma pasta
Todos os favoritos
Criar novo
Salvar
Modelo de infográfico de cronograma de design plano
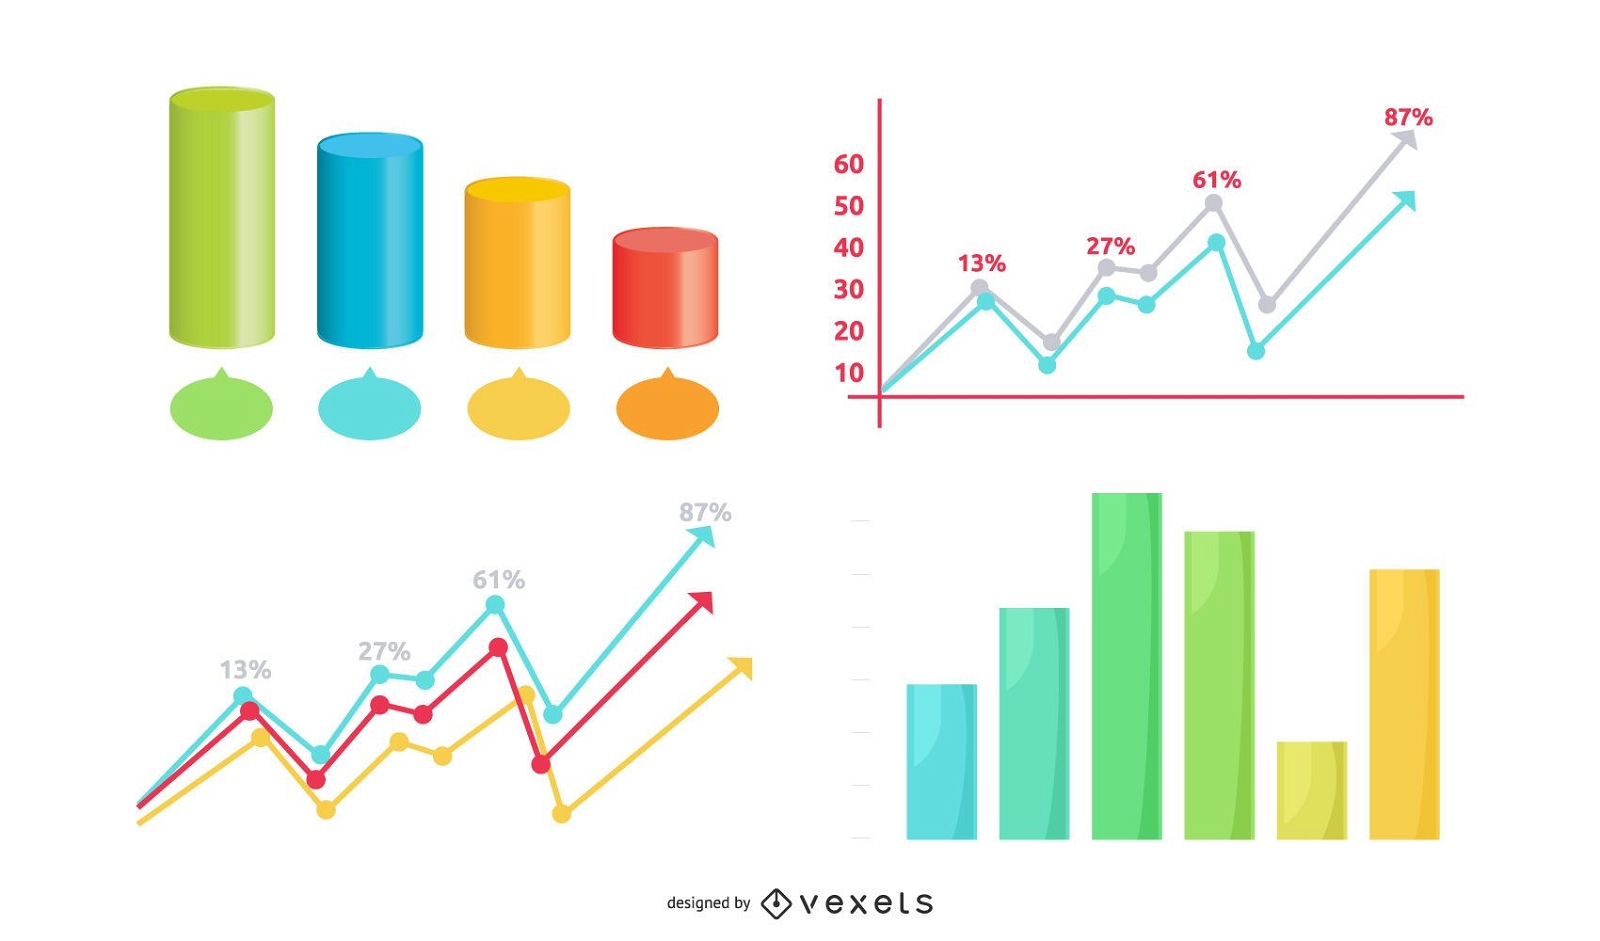
Conjunto de gráficos de estatísticas de criativos
Escolha uma pasta
Todos os favoritos
Criar novo
Salvar
Conjunto de gráficos de estatísticas de criativos
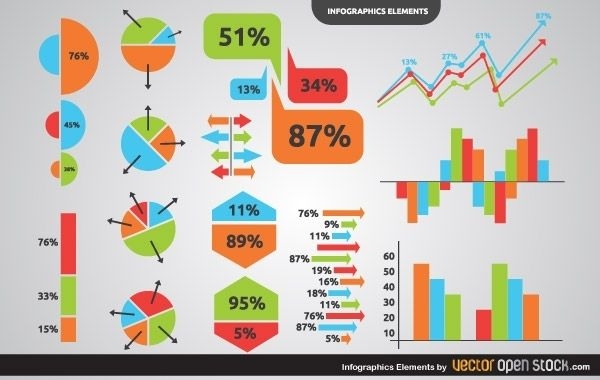
Elementos infográficos
Escolha uma pasta
Todos os favoritos
Criar novo
Salvar
Elementos infográficos
Modelo de infográfico de cronograma
Escolha uma pasta
Todos os favoritos
Criar novo
Salvar
Modelo de infográfico de cronograma
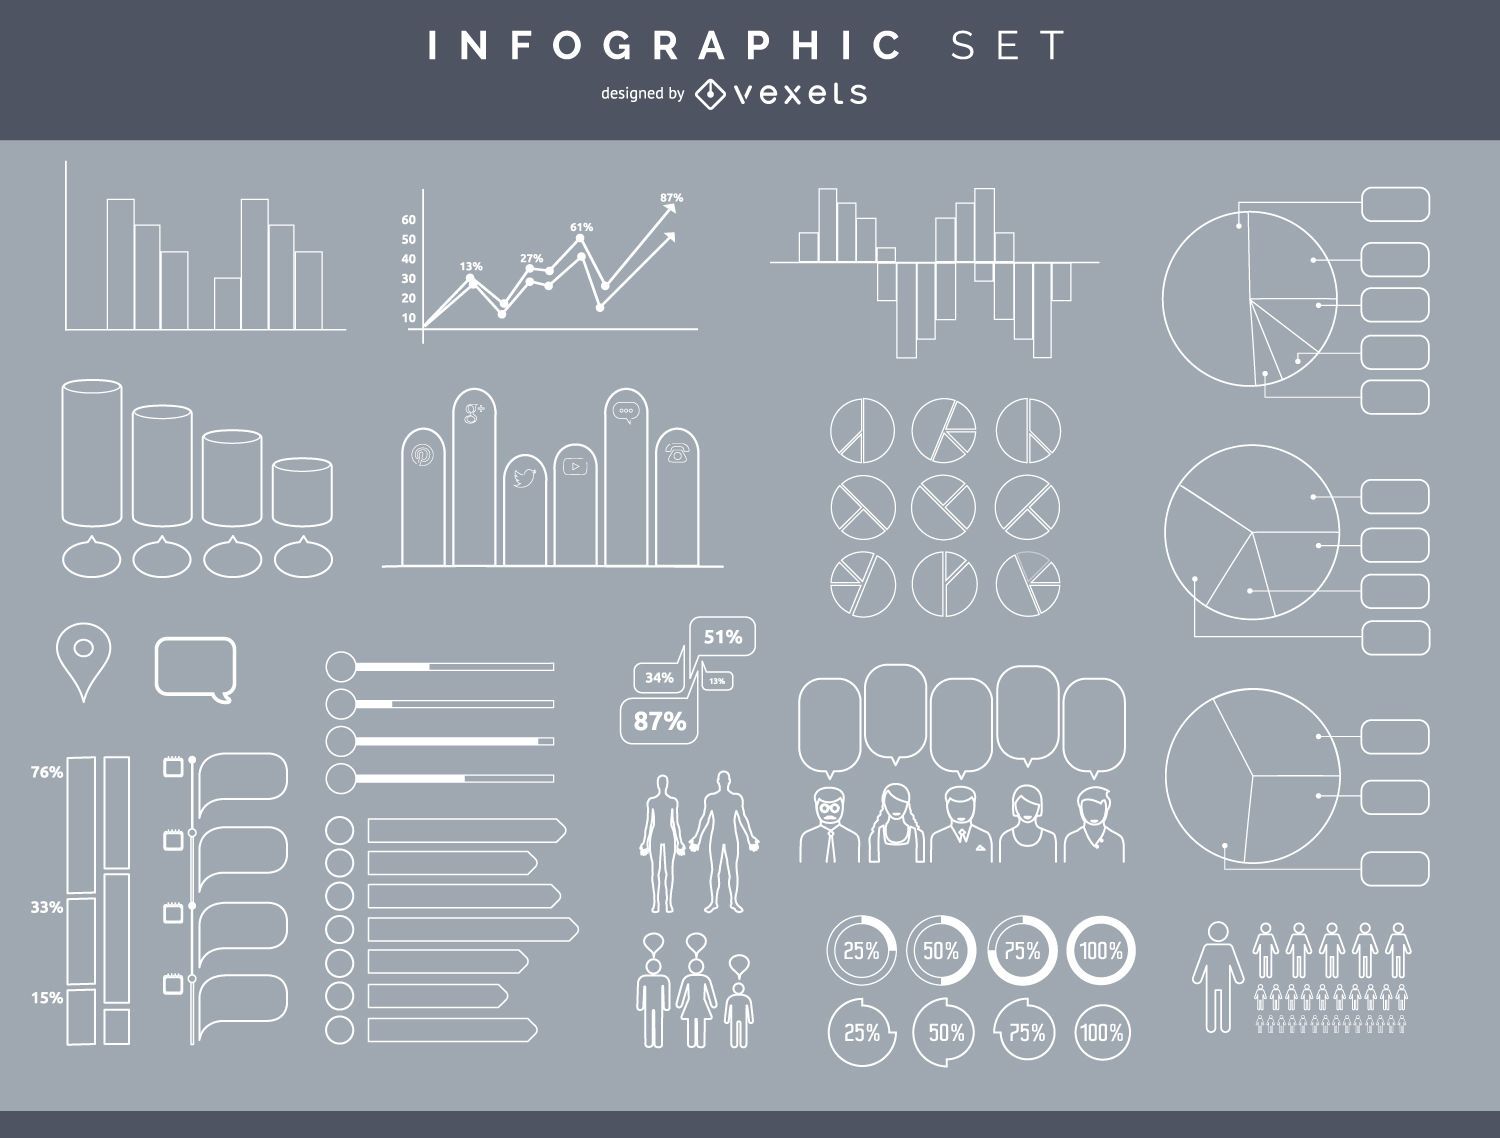
Conjunto de elementos infográfico
Escolha uma pasta
Todos os favoritos
Criar novo
Salvar
Conjunto de elementos infográfico
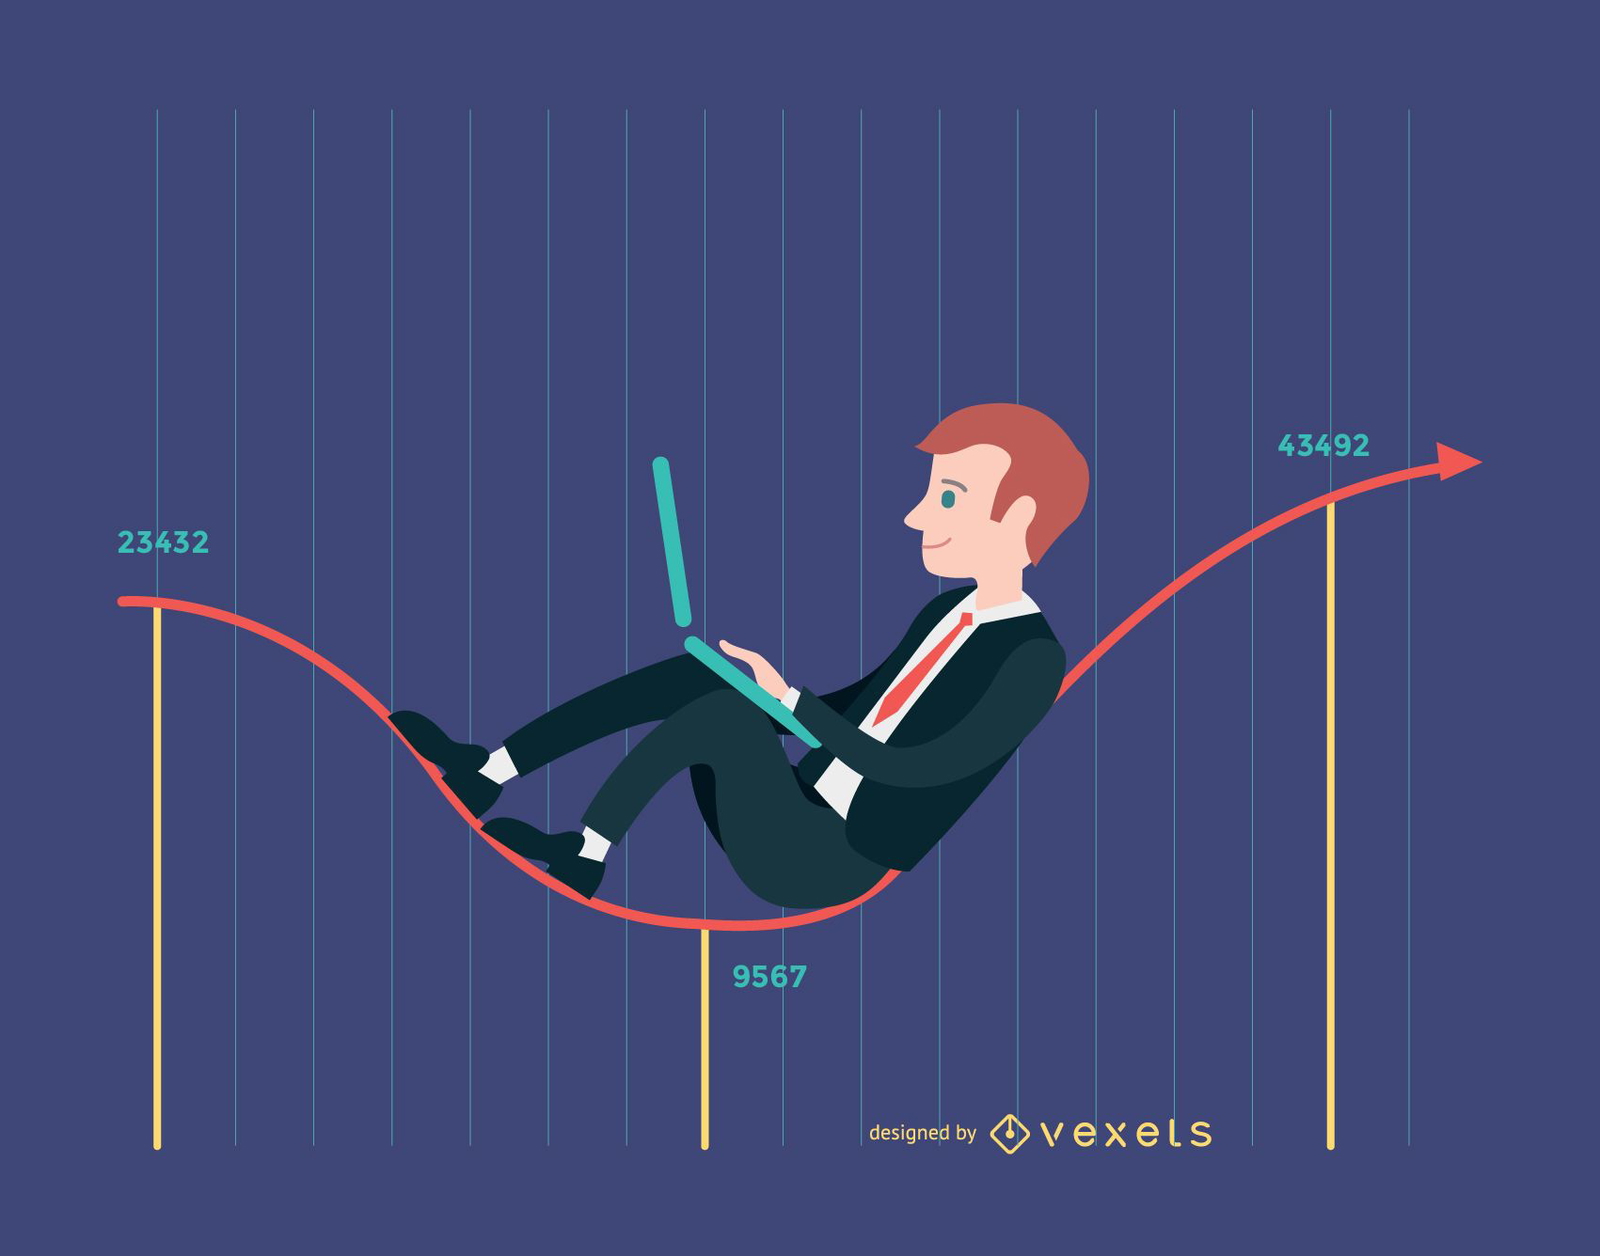
Empresário trabalhando na linha do gráfico de moeda
Escolha uma pasta
Todos os favoritos
Criar novo
Salvar
Empresário trabalhando na linha do gráfico de moeda
Premium
Doodle de infográfico 100 por cento Desenho PNG
Escolha uma pasta
Todos os favoritos
Criar novo
Salvar
Doodle de infográfico 100 por cento Desenho PNG
Conjunto de infográfico colorido plano e 3D
Escolha uma pasta
Todos os favoritos
Criar novo
Salvar
Conjunto de infográfico colorido plano e 3D
Premium
Gráfico infográfico de 75 por cento do doodle Desenho PNG
Escolha uma pasta
Todos os favoritos
Criar novo
Salvar
Gráfico infográfico de 75 por cento do doodle Desenho PNG
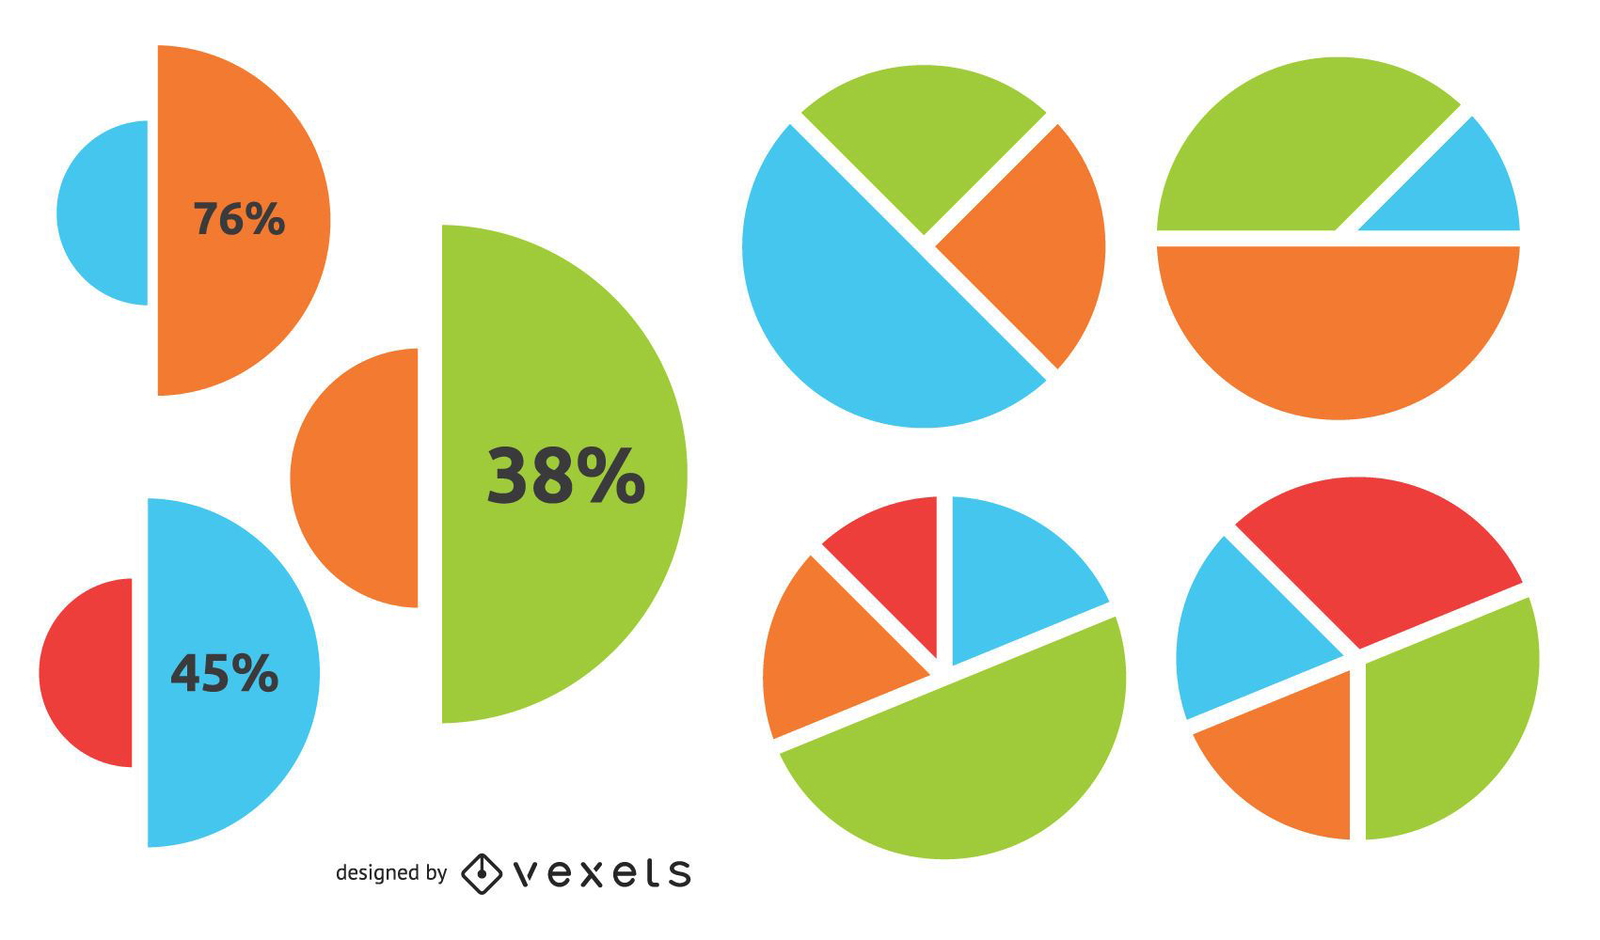
Infográfico de negócios de gráfico circular criativo
Escolha uma pasta
Todos os favoritos
Criar novo
Salvar
Infográfico de negócios de gráfico circular criativo
Sucesso de salto de empresário
Escolha uma pasta
Todos os favoritos
Criar novo
Salvar
Sucesso de salto de empresário
Círculo de progresso de 75 por cento Desenho PNG
Escolha uma pasta
Todos os favoritos
Criar novo
Salvar
Círculo de progresso de 75 por cento Desenho PNG
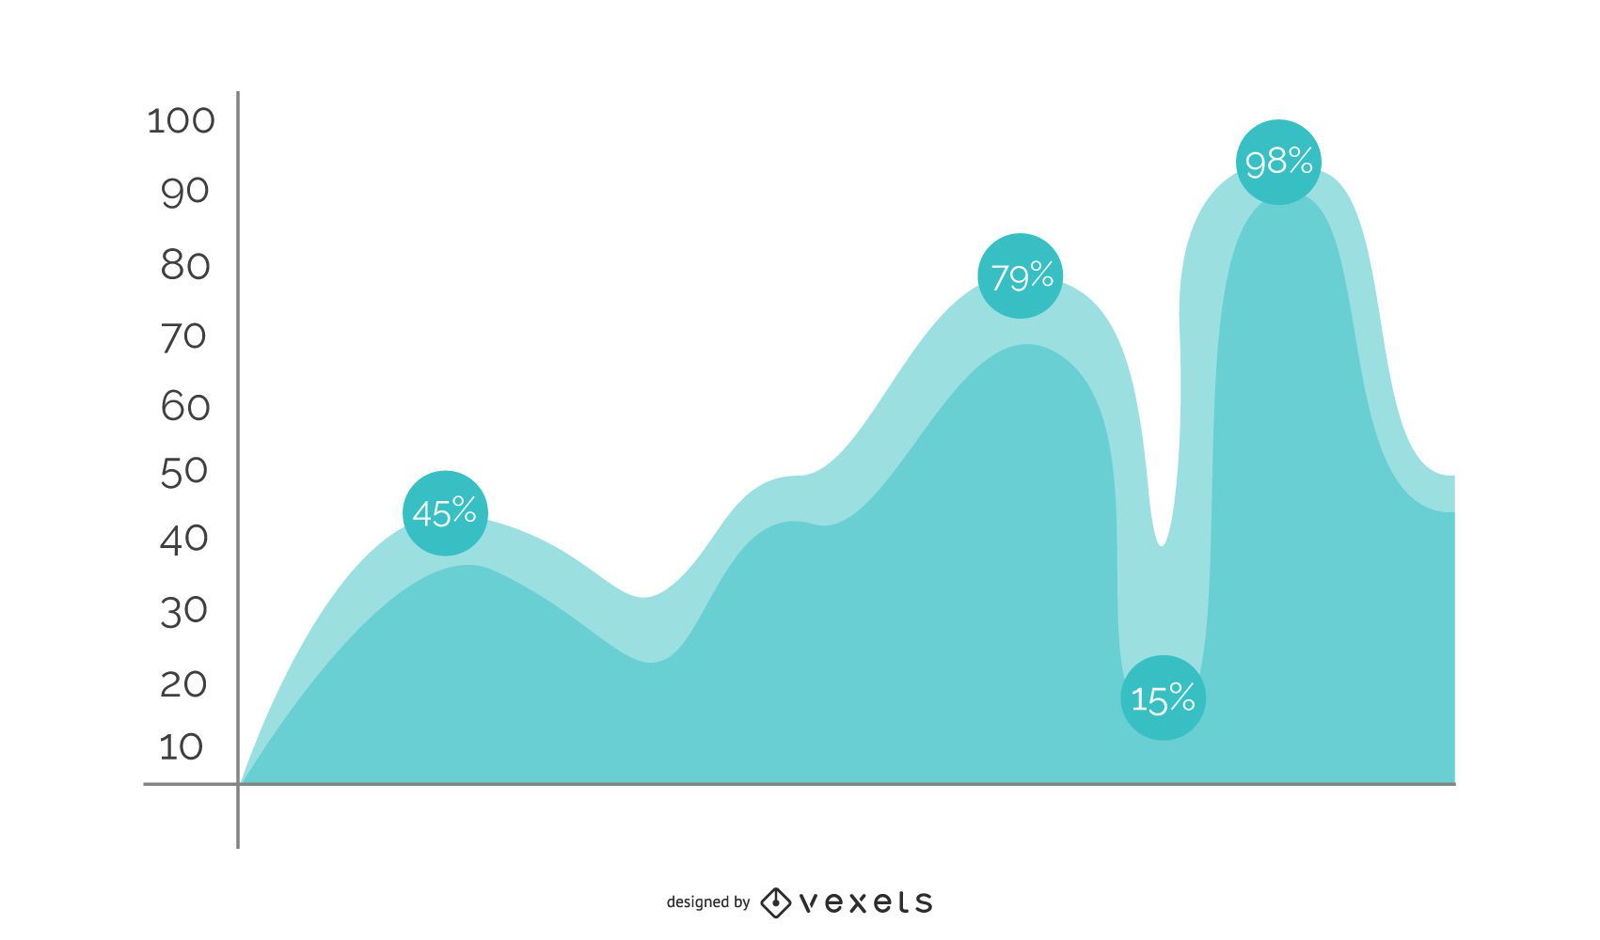
Design Gráfico de Ondas de Negócios
Escolha uma pasta
Todos os favoritos
Criar novo
Salvar
Design Gráfico de Ondas de Negócios
Gráfico de pólo colorido 3D Desenho PNG
Escolha uma pasta
Todos os favoritos
Criar novo
Salvar
Gráfico de pólo colorido 3D Desenho PNG
Premium
Gráfico de doodle de 25 por cento Desenho PNG
Escolha uma pasta
Todos os favoritos
Criar novo
Salvar
Gráfico de doodle de 25 por cento Desenho PNG
Design de fundo moderno da Terra
Escolha uma pasta
Todos os favoritos
Criar novo
Salvar
Design de fundo moderno da Terra
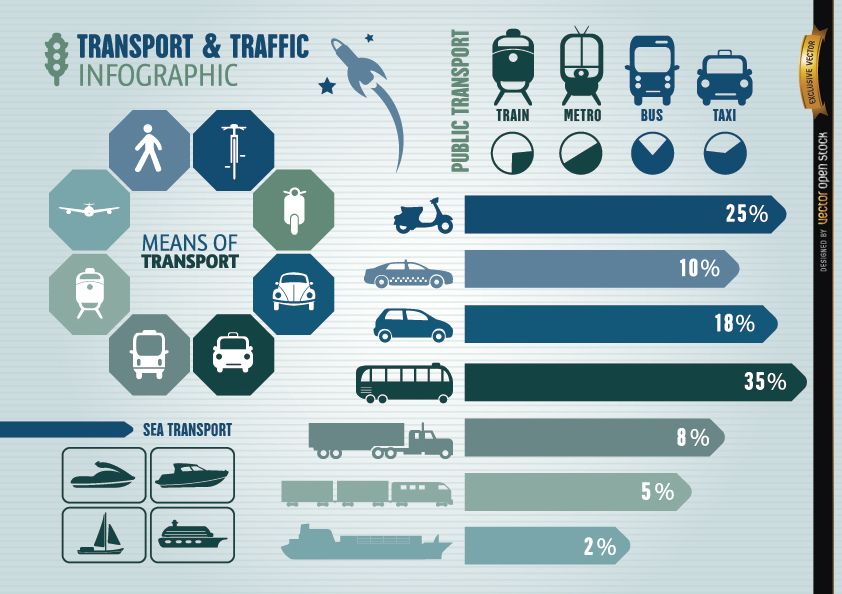
Infográfico de transporte e tráfego
Escolha uma pasta
Todos os favoritos
Criar novo
Salvar
Infográfico de transporte e tráfego
Premium
Gráfico de pizza de duas seções Desenho PNG
Escolha uma pasta
Todos os favoritos
Criar novo
Salvar
Gráfico de pizza de duas seções Desenho PNG
Impulsione seu negócio
Com a plataforma gráfica líder de mercado.
Ver planos
Próxima
do 8
prev page
next page