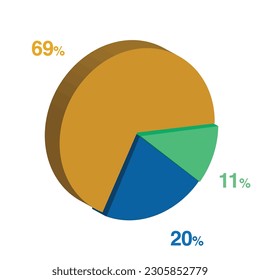
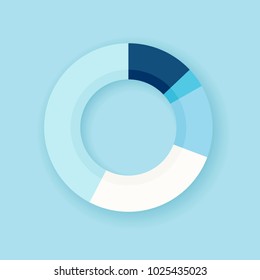
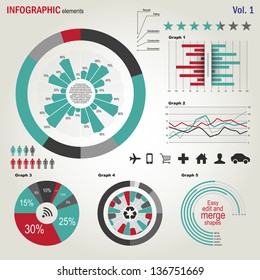
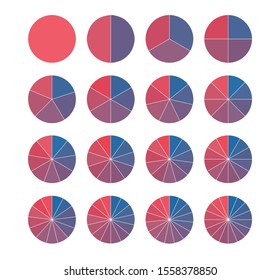
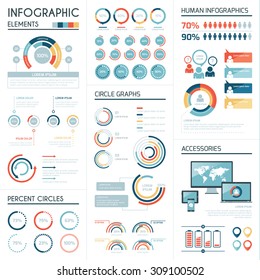
102 Gráficos de designs PNG e SVG de pie chart

Baixar Gráficos PNG e SVG de Design com Fundo Transparente Para T-Shirts, Capas do Celular, Capas do Livros e outros Produtos Merch

Ordenar por

Mais relevante
Business Infographics and charts. Vector illustration
4 steps half-cycle chart infographics elements for data presentation. EPS 10.
Modelo de slide vetorial de apresentação de negócios plano com gráfico de pizza
Circle Pie Chart from 1 to 100 percent. Percentage diagram set for infographic, UI, web design. Progress bar template. Vector illustration.
Infographic isometric 3d process chart. Cycle diagram with 3 stages, options, parts. Can be used for report, business analytics, data visualization and presentation.
Five sectors pie chart slide template. Business data. Review, assessment, design. Creative concept for infographic, presentation, report. For topics like research, finance, analysis.
Conjunto de elementos vetoriais de infográficos corporativos em cores planas
Set of circle percentage diagrams from 0 to 100 ready-to-use for web design, user interface (UI) or infographic - indicator with yellow
Growing bar graph icon set. Business graphs and charts icons. Statistics and analytics  Outline icon. Statistic and data, charts diagrams, money, down or up arrow.
Pie Chart Vector Circle Diagram Infographic 3d Color Set
Chart, business graph, infographic element.
Graphs and charts web line icons. data elements, bar and pie, diagrams for business infographics. visualization of data statistic and analytics. vector illustration
Comparison business infographics set design
Design vetorial colorido para layout de fluxo de trabalho, diagrama, opções de número, web design, infográficos
Isometric cycle diagram for infographics. Vector chart can be used for graph, report, presentation, brochure, web design. 3d pie.
Circular chart, diagram, pie chart icon. Vector illustration, flat design.
vector circle for infographic template, pie charts blue with 2, 3, 4, 5, 6, 7, 8, 9, 10 steps
Set of circle percentage diagrams (meters) from 0 to 100 ready-to-use for web design, user interface (UI) or infographic - indicator with blue
Conjunto de diagramas percentuais de círculo de 0 a 100 prontos para uso para web design, interface de usuário (UI) ou infográfico - indicador com vermelho
Set of simple blue gradient info piecharts / segment of circle element icons for 1 2 3 4 5 6 7 8. Modern flat design infographics template for app ui ux web button vector isolated on white background
Pareto principle . 20 80 rule chart .  Circle 3d pie diagram .
Set of infographic isometric pie chart templates. Share of 10, 20, 30, 40, 50, 60, 70, 80 and 90 percent. Vector illustration.
Analysis Line Editable Icons set. Vector illustration in modern thin line style of analytics related icons: balance, charts, report, and other. Pictograms and infographics for mobile apps.
Isometric cycle diagram for infographics. Vector chart with 10 parts, options. Can be used for graph, report, presentation, brochure, web design.
Pie chart. Share of 10% and 90%. Circle diagram for infographics. Vector banner. Can be used for chart, graph, data visualization, web design
Set of colorful info piecharts / segment of circle element icons, Modern flat design infographics template
Vector circle element for infographic. Template for cycling diagram, graph, presentation. Business concept with 3 options, parts, steps or processes. Abstract background
Set of semicircle arc percentage diagrams from 0 to 100 ready-to-use for web design, user interface (UI) or infographic - indicator with yellow
Modelo de design infográfico exclusivo, diagrama circular ou gráfico de pizza com 8 setores. Oito elementos da estratégia de negócios de desenvolvimento bem-sucedido. Ilustração vetorial para apresentação, brochura, site.
Infográficos - Conjunto de gráficos de pizza coloridos - vector eps10
Gráfico de pizza 3D colorido vetor criativo para seus relatórios de negócios e apresentação de dados financeiros.
Set of circle percentage diagrams (meters) from 0 to 100 ready-to-use for web design, user interface (UI) or infographic - indicator with gradient from cyan (blue) to yellow
Esta imagem é um arquivo vetorial que representa um conceito de roda colorida./Roda colorida
Minimalistic colorful infographic with element icons. Flat design pie charts, graph bars for ads app logo web banner ui ux, isometric graphic illustration concept vector isolated on white background
Set of circle percentage diagrams meters from 0 to 100 ready-to-use for web design, user interface UI or infographic - indicator with yellow
Infographics - Pie Chart Design vector eps10
Set of simple blue gradient info piecharts / segment of circle element icons for 2, 3, 4, 5, 6, 8. Flat design infographics template for app ui ux web button banner vector isolated on white background
Set of circle percentage diagrams (meters) from 0 to 100 ready-to-use for web design, user interface (UI) or infographic - indicator with purple
Percentage diagram set. Progress or loading circle symbols. Pie Chat from 1 to 100 percent for infographic design. Vector illustration.
Set of circle percentage diagrams (meters) from 0 to 100 ready-to-use for web design, user interface (UI) or infographic - indicator with gray
Colorful pie chart template, background for your documents, web sites, reports, presentations and infographic
Set of semicircle arc percentage diagrams from 0 to 100 ready-to-use for web design, user interface (UI) or infographic - indicator with gradient from yellow to cyan (blue)
Pie Chart Vector Circle Diagram Infographic Flat Color Set
Ícone Vector do Gráfico de Pizza
Infographic template with icons and 3 options or steps. Semicircle. Can be used for workflow layout, diagram, banner, webdesign. Vector illustration
Ícone do Gráfico de Pizza
Four infographic themes with pie charts consisting of five sections along with descriptions for each color in each section of the chart.
Infográficos passo a passo com seções coloridas. Gráfico de pizza plano com 7 etapas, opções, peças, processos com setas finas. Modelo de negócio vetorial.
2-part blue and white circle image chart with%
Set of four gradient pie charts in different colors representing data visualization, statistics, and analytics. Ideal for reports, presentations, business, and financial analysis. Vector illustration.
Resultados patrocinados da Shutterstock Logo
Ganhe 15% de desconto com o código: VEXELS15

do 3