Biblioteca de design
Novos designs Merch
Camisetas
Vectores
Designs de Merch de Tendência
PNGs & SVGs
Mockups
Modelos de T-Shirt PSD
Explorar Desenhos
Designs KDP
Pôsteres
Canecas
Capas para celular
Sacos de compras
Almofadas
Ferramentas de desenho
Merch Designer
Novo!
Mockup Generator
Gerador de Design de AI
Vetorizador
Quote Generator
T-Shirt Maker (Antigo)
Ajuda
Merch Digest
Blog
Centro de Ajuda
Saiba mais sobre o Merch
Feedback
Soluções Corporativas
Empresa
Acesso à API
Estúdio de Design
Design em Lote
Preços
Carregando...
Inscrever-se
Conecte-se
PSD Templates
graficos
Biblioteca de design
Novos designs Merch
Camisetas
Vectores
Designs de Merch de Tendência
PNGs & SVGs
Mockups
Modelos de T-Shirt PSD
Explorar Desenhos
Designs KDP
Pôsteres
Canecas
Capas para celular
Sacos de compras
Almofadas
Ferramentas de desenho
Merch Designer
Novo!
Mockup Generator
Gerador de Design de AI
Vetorizador
Quote Generator
T-Shirt Maker (Antigo)
Ajuda
Merch Digest
Blog
Centro de Ajuda
Saiba mais sobre o Merch
Feedback
Soluções Corporativas
Empresa
Acesso à API
Estúdio de Design
Design em Lote
PLANOS
PSD Templates
graficos
3308 Designs de Camisetas e Mockups PSD de graficos
Baixar designs de camisetas ou mockups PSD editáveis de graficos
Relacionado:
graficos vetoriais
,
desenhos graficos de ações
,
graficos tridimensionais
Ordenar por
Mais relevante
Resultados patrocinados da
Ganhe 15% de desconto com o código: VEXELS15
veja mais detalhes
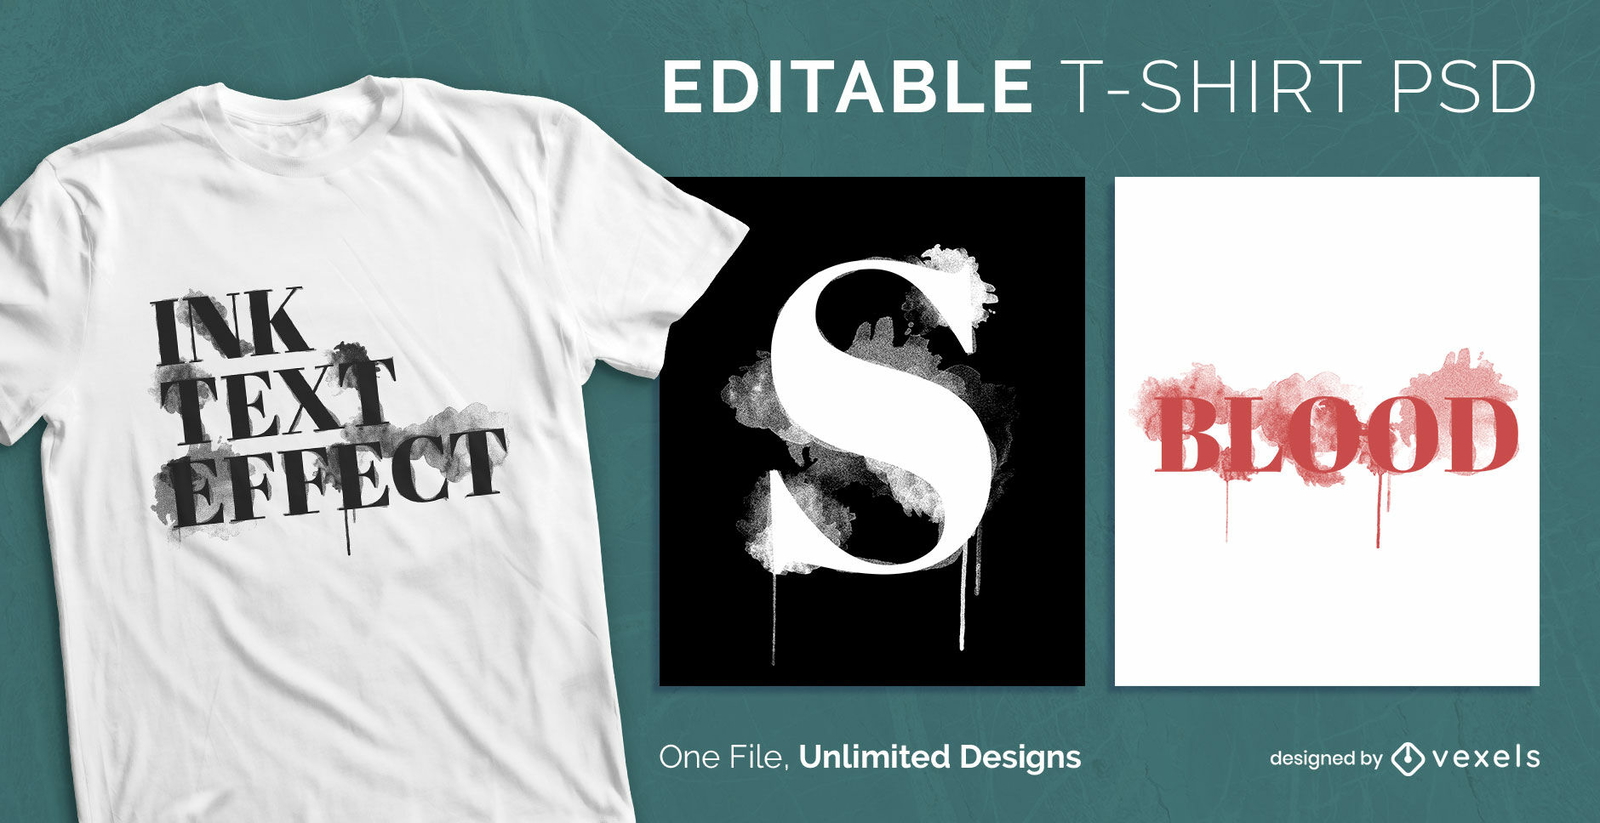
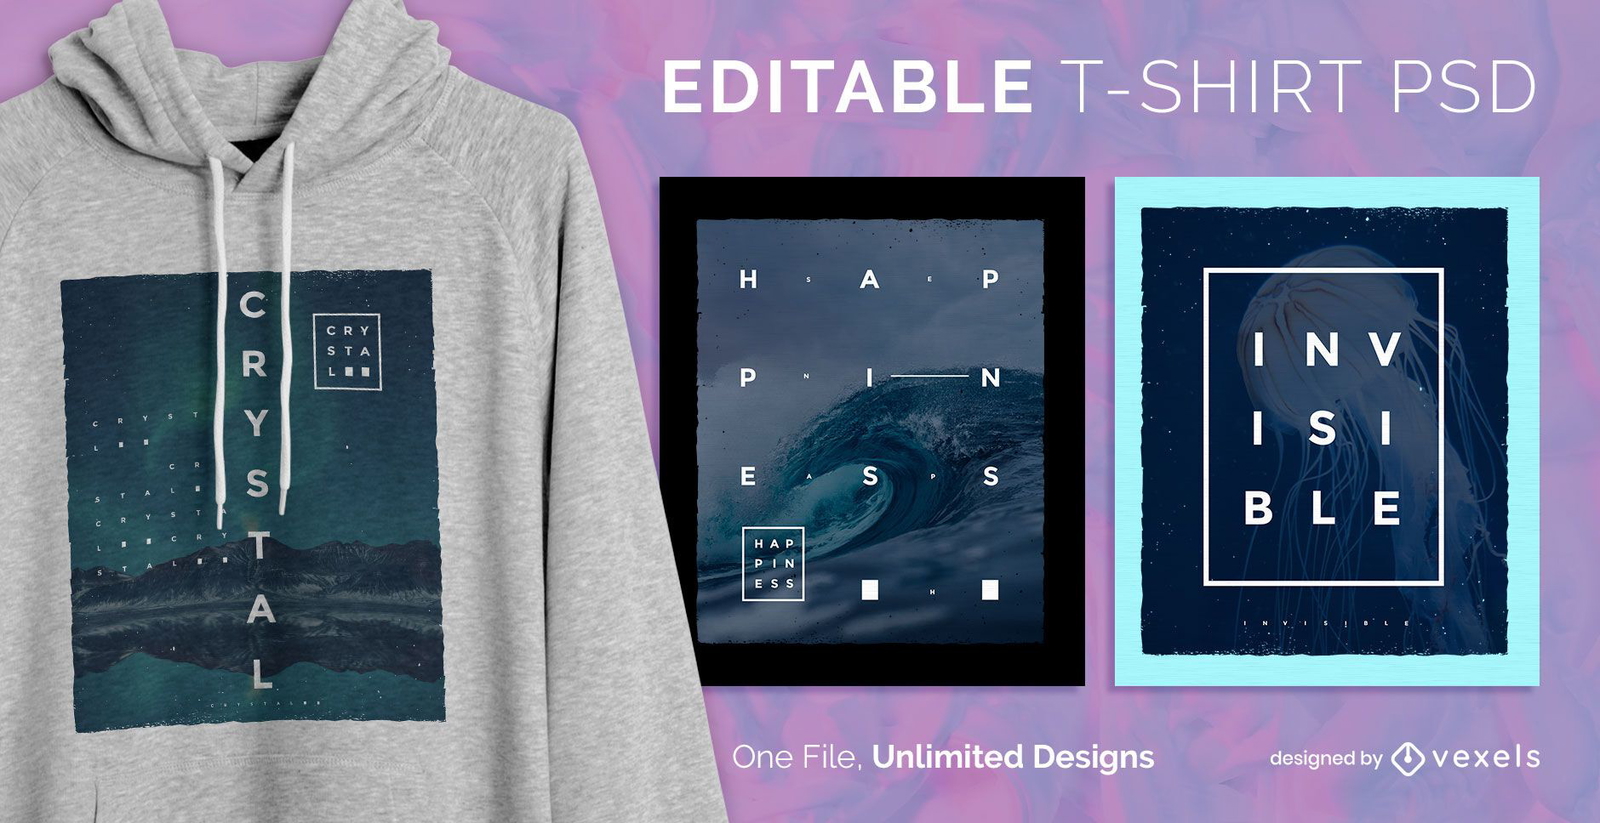
texto editável
para Merch
T-shirt escalável de textos de tinta aquarela psd
Escolha uma pasta
Todos os favoritos
Criar novo
Salvar
T-shirt escalável de textos de tinta aquarela psd
Pronto para imprimir
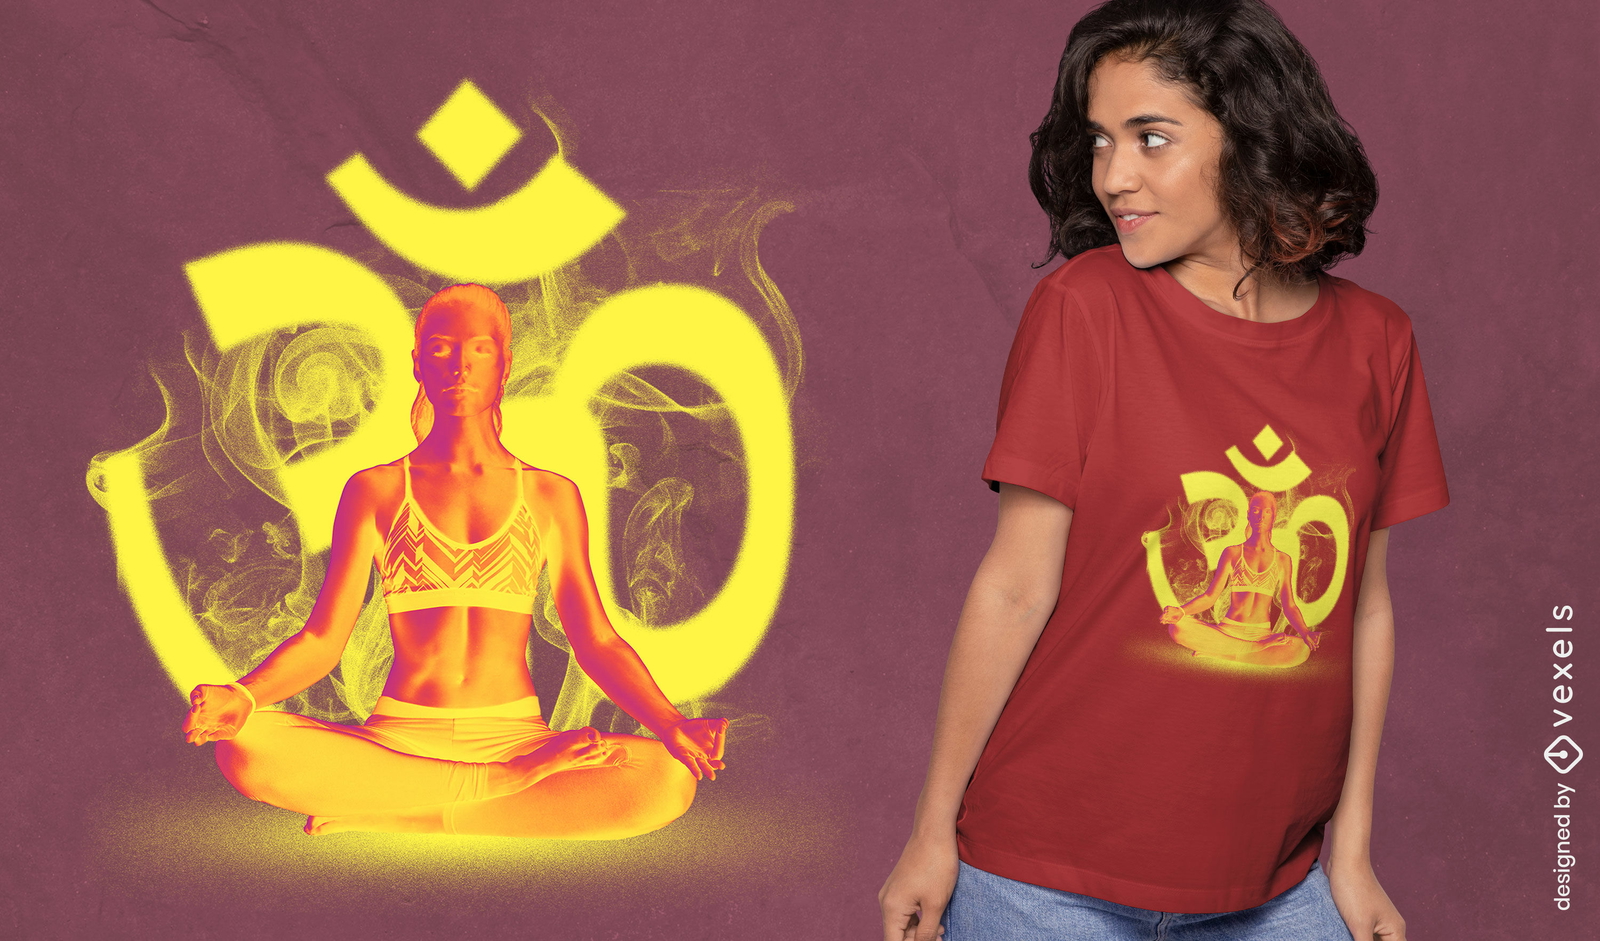
para Merch
Mulher fazendo design de camiseta psd de meditação de ioga
Escolha uma pasta
Todos os favoritos
Criar novo
Salvar
Mulher fazendo design de camiseta psd de meditação de ioga
Pronto para imprimir
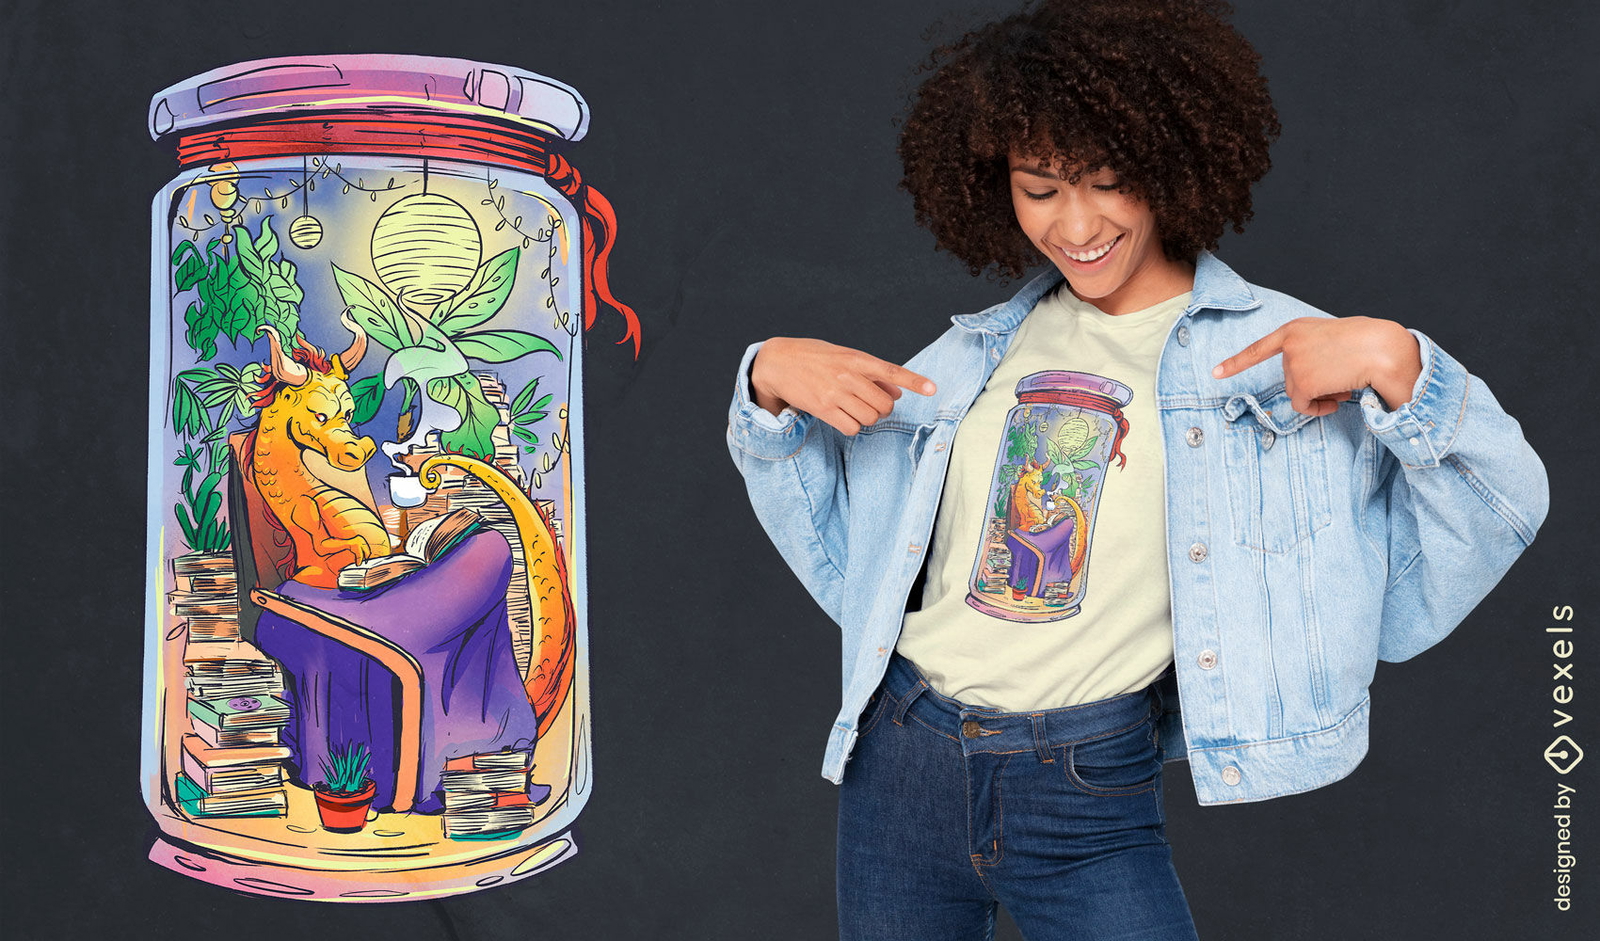
para Merch
Design de camiseta de livros de leitura de dragão aconchegante
Escolha uma pasta
Todos os favoritos
Criar novo
Salvar
Design de camiseta de livros de leitura de dragão aconchegante
Pronto para imprimir
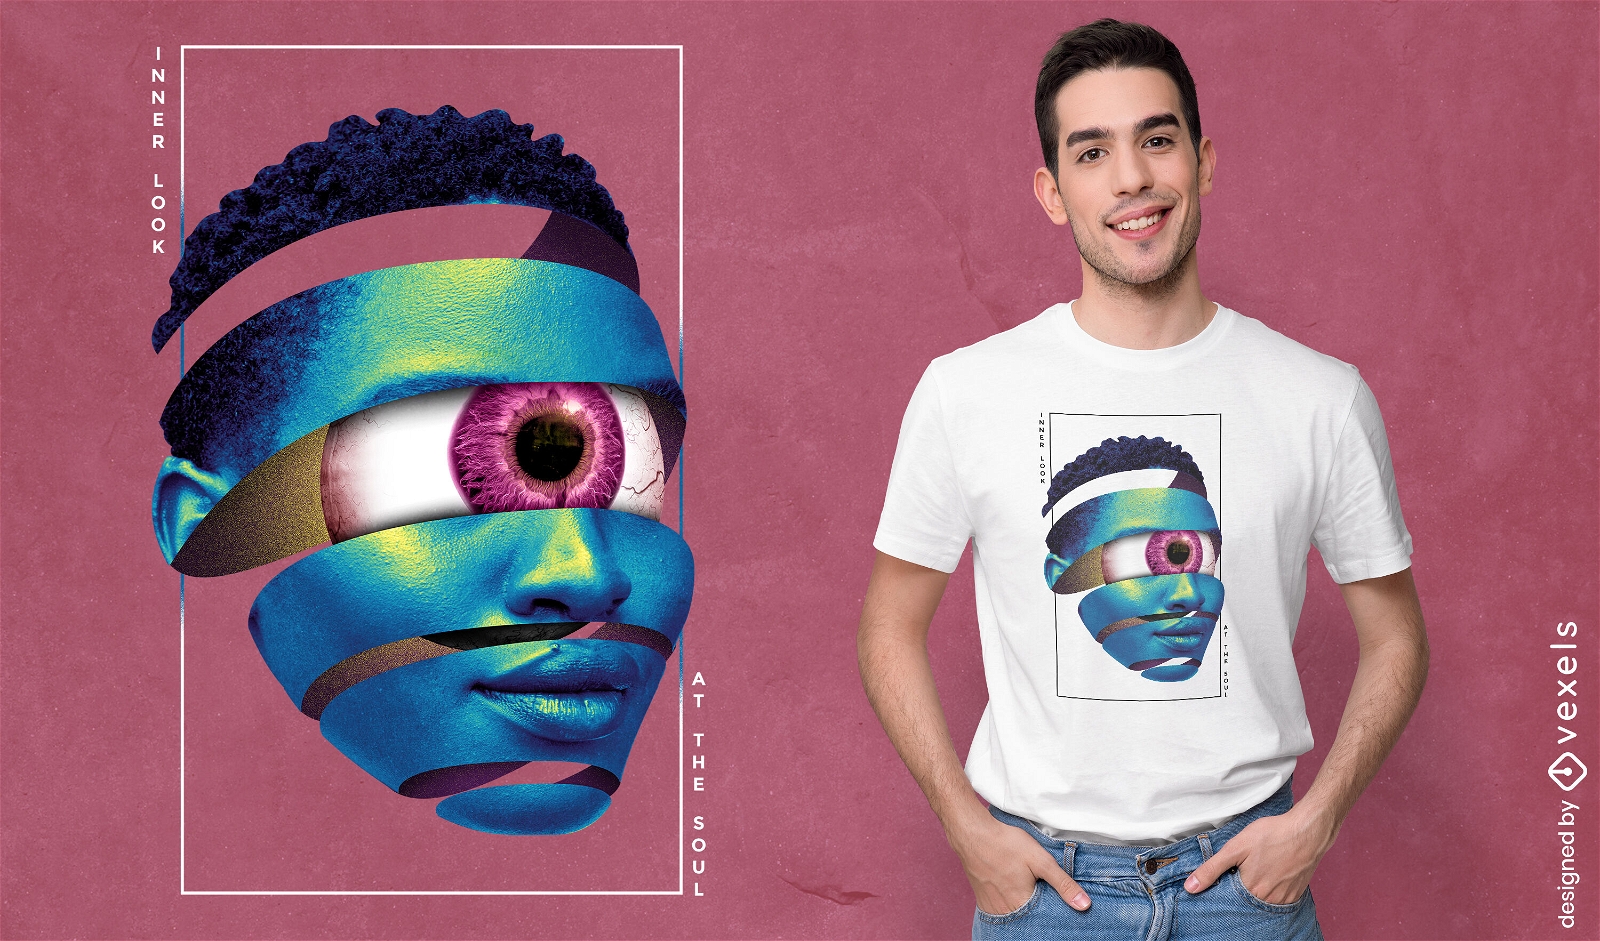
para Merch
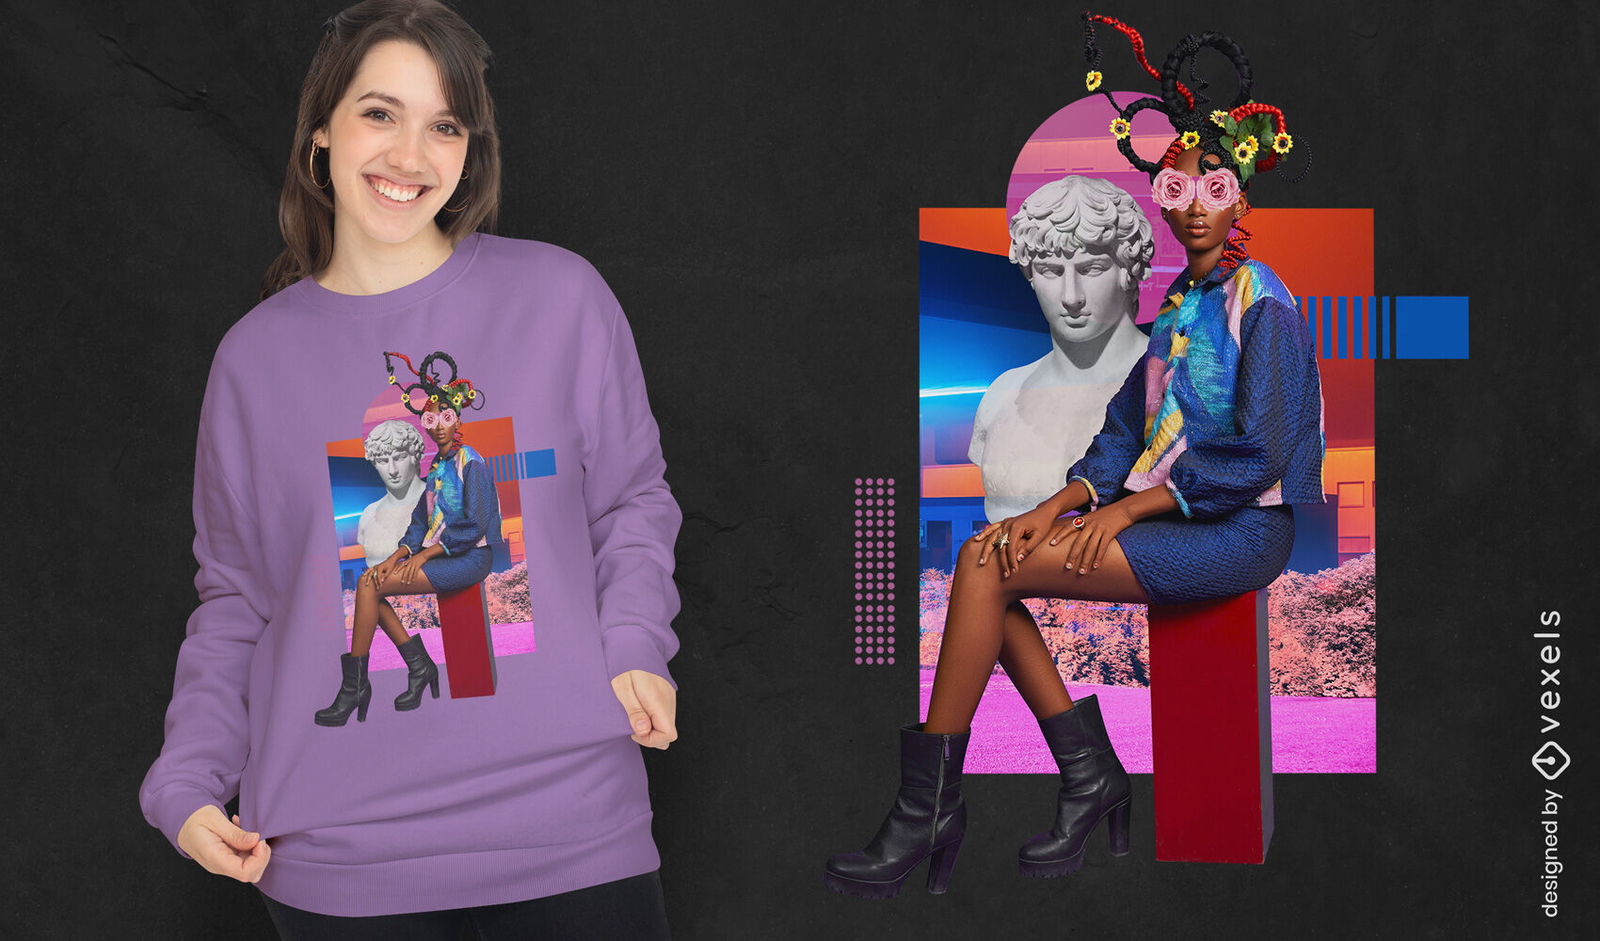
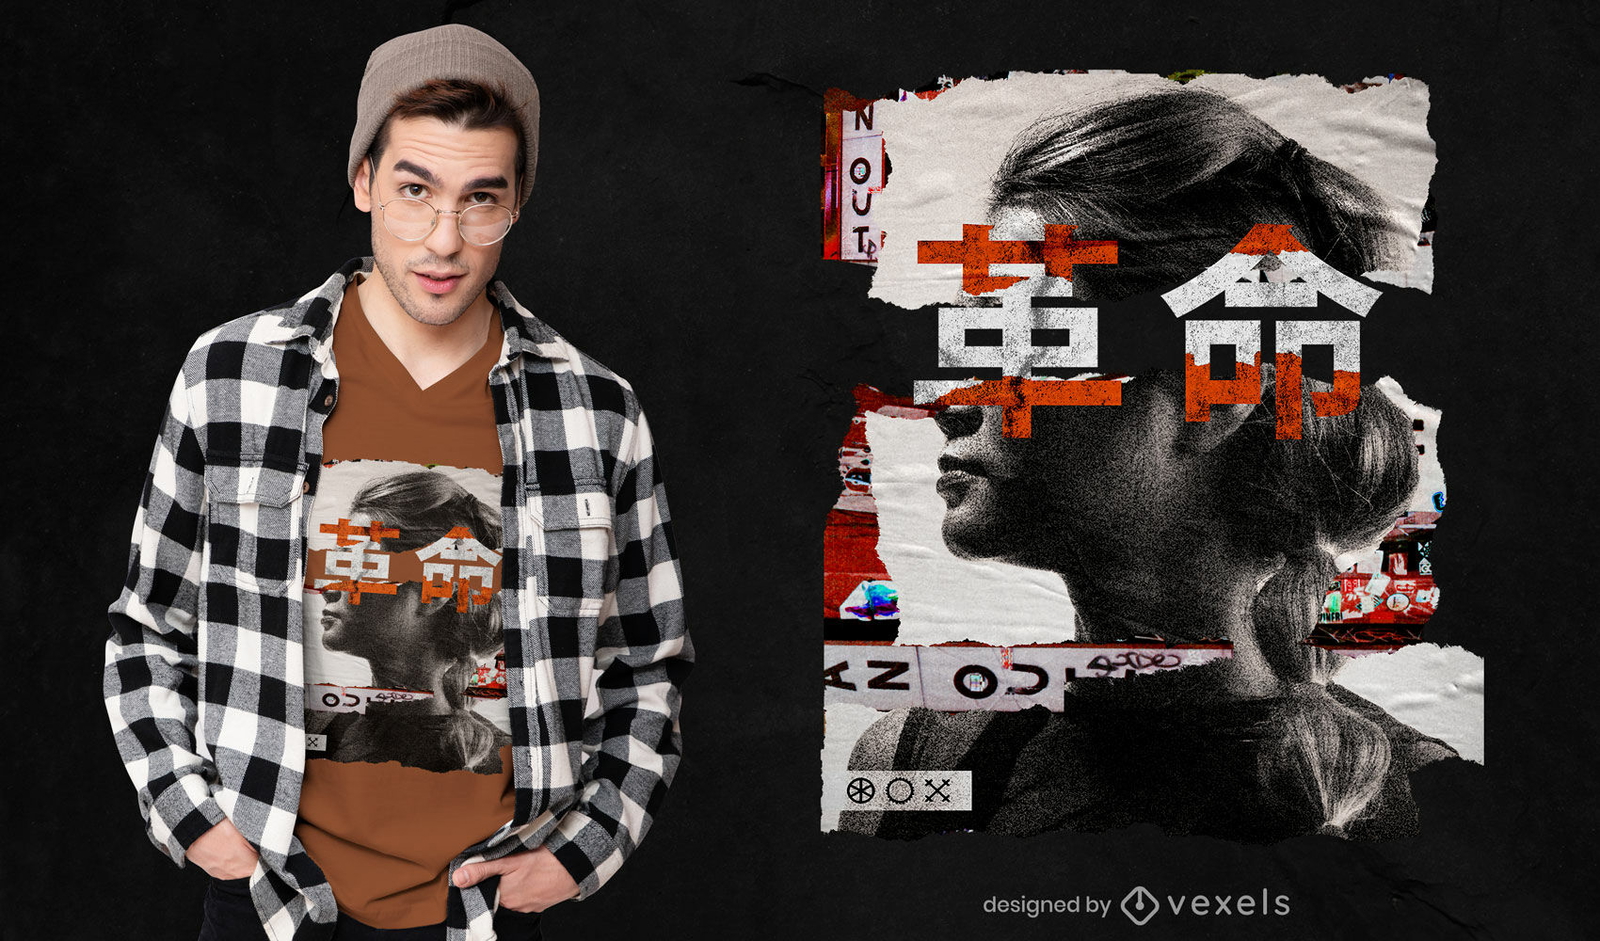
Rosto de mulher em espiral com camiseta gigante psd
Escolha uma pasta
Todos os favoritos
Criar novo
Salvar
Rosto de mulher em espiral com camiseta gigante psd
Pronto para imprimir
para Merch
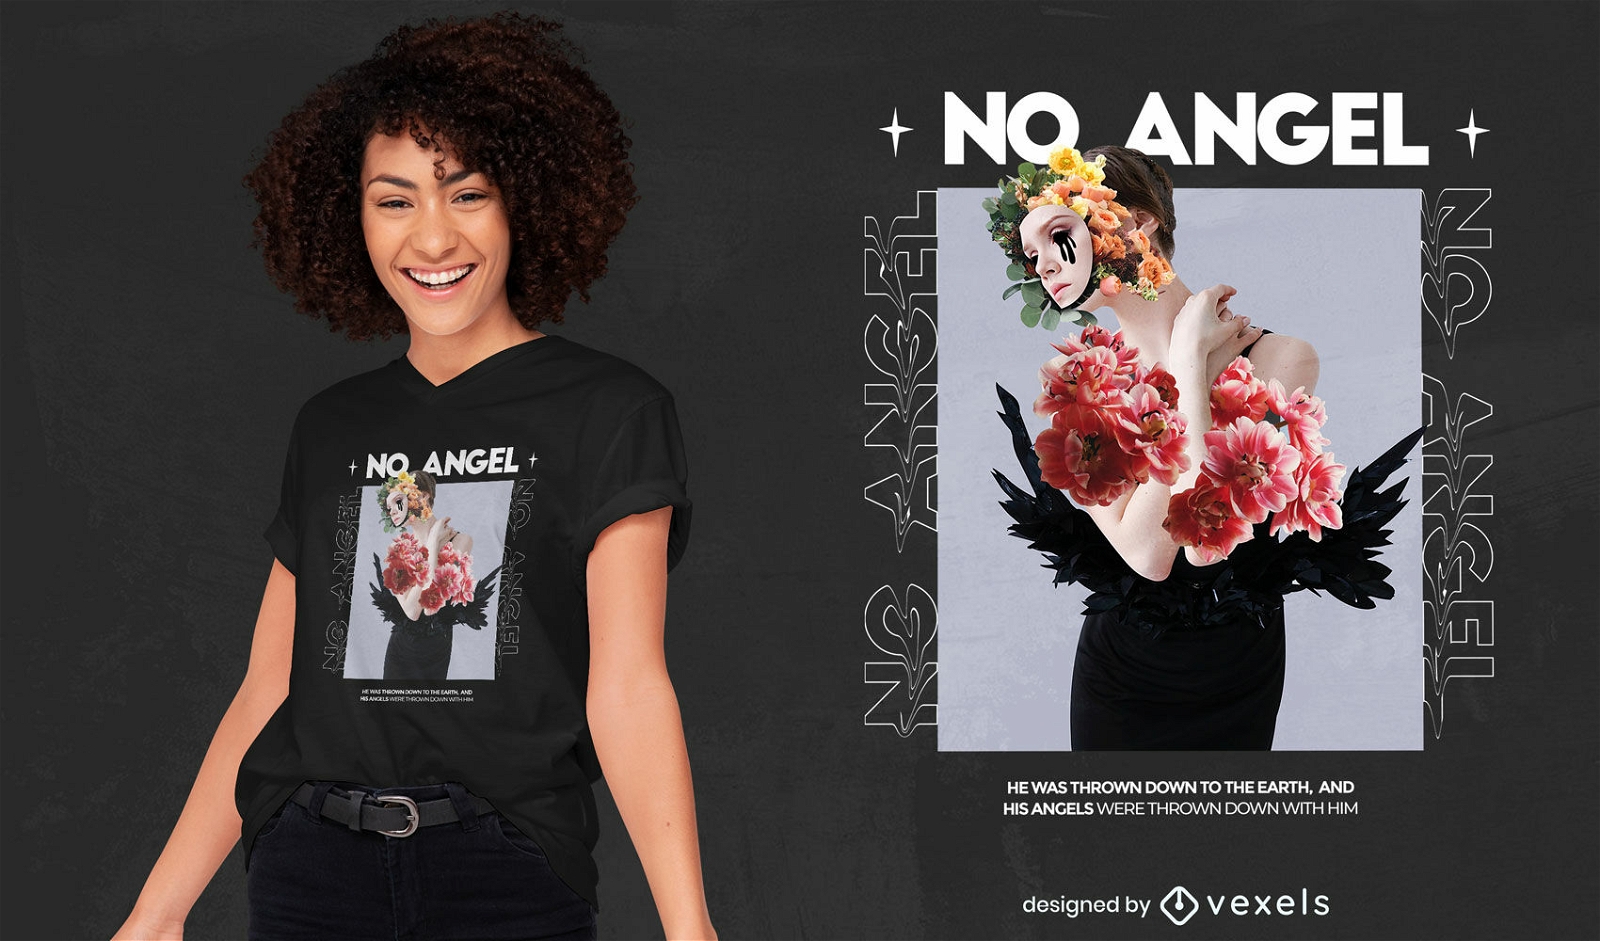
Design de t-shirt PSD com colagem floral mascarada
Escolha uma pasta
Todos os favoritos
Criar novo
Salvar
Design de t-shirt PSD com colagem floral mascarada
Pronto para imprimir
para Merch
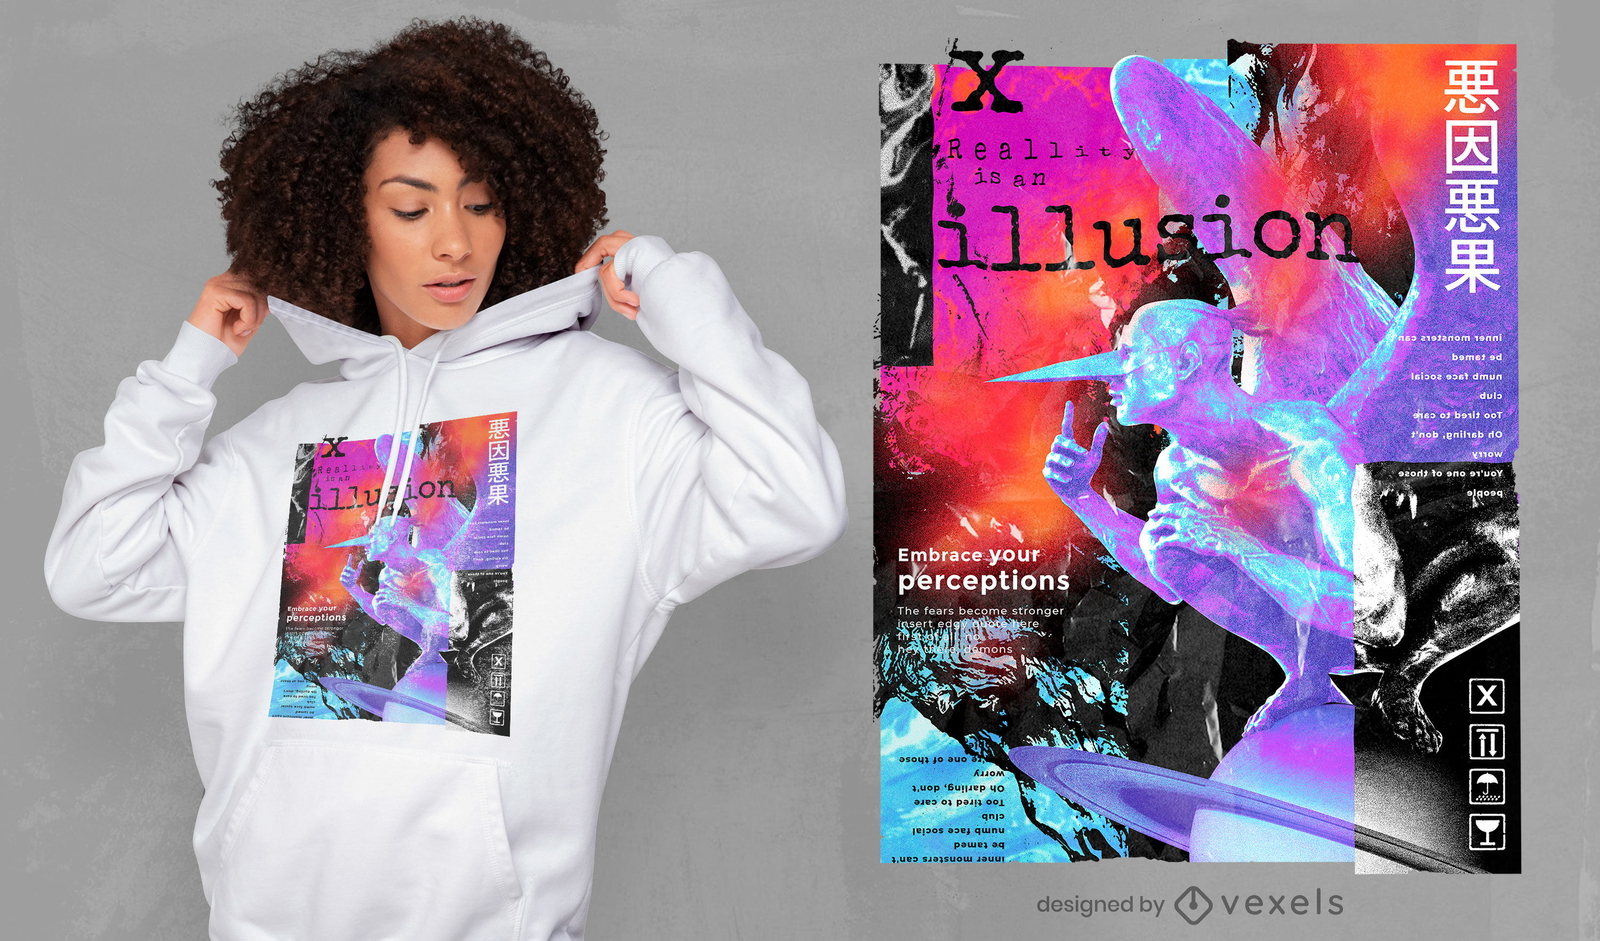
Design de t-shirt psd de colagem de estátua de ilusão de realidade
Escolha uma pasta
Todos os favoritos
Criar novo
Salvar
Design de t-shirt psd de colagem de estátua de ilusão de realidade
texto editável
para Merch
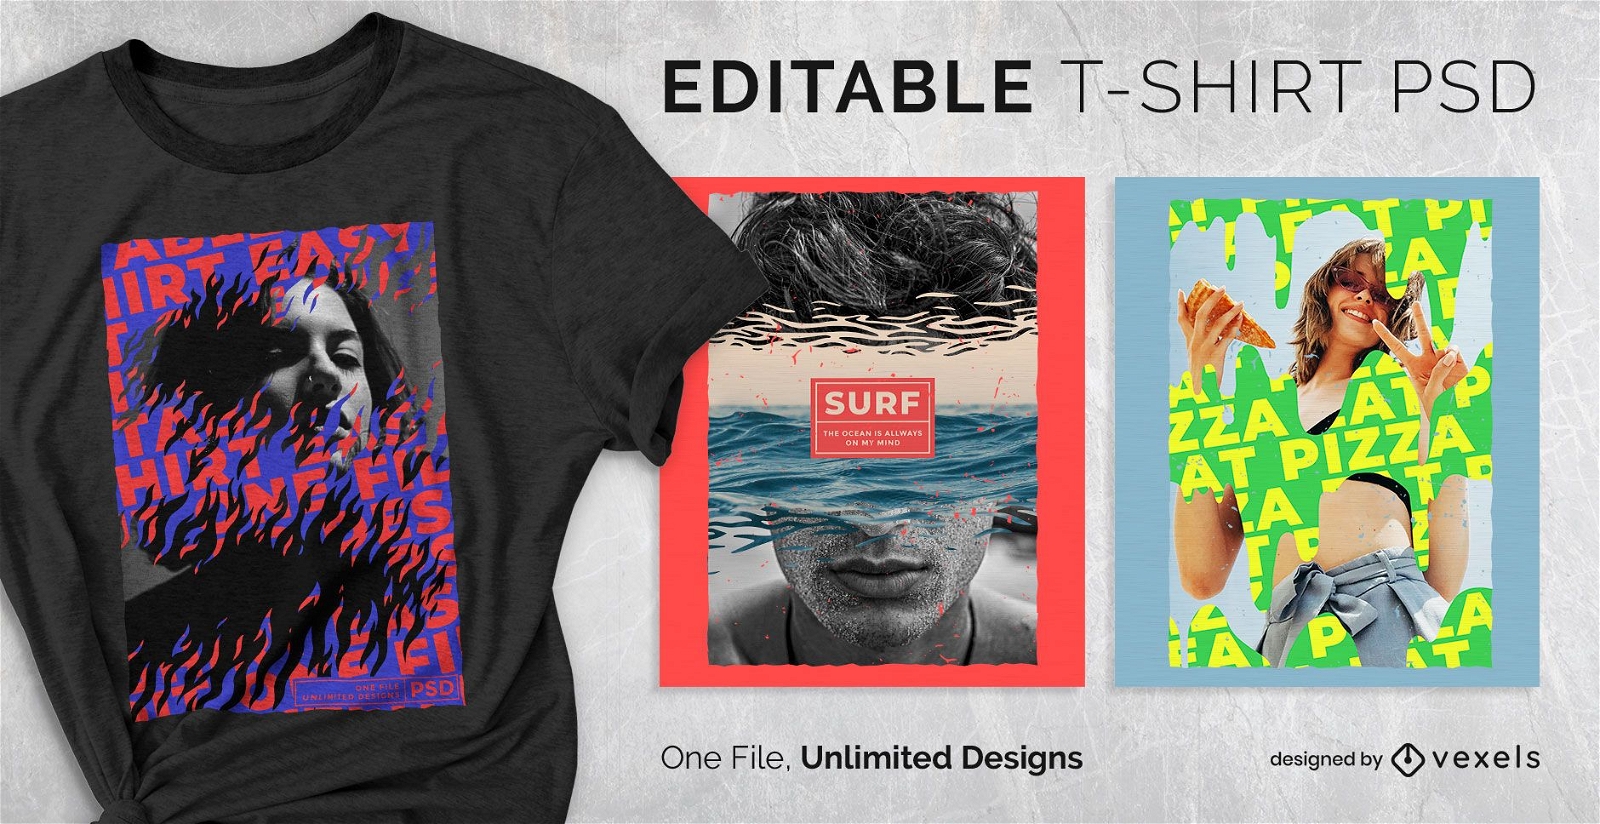
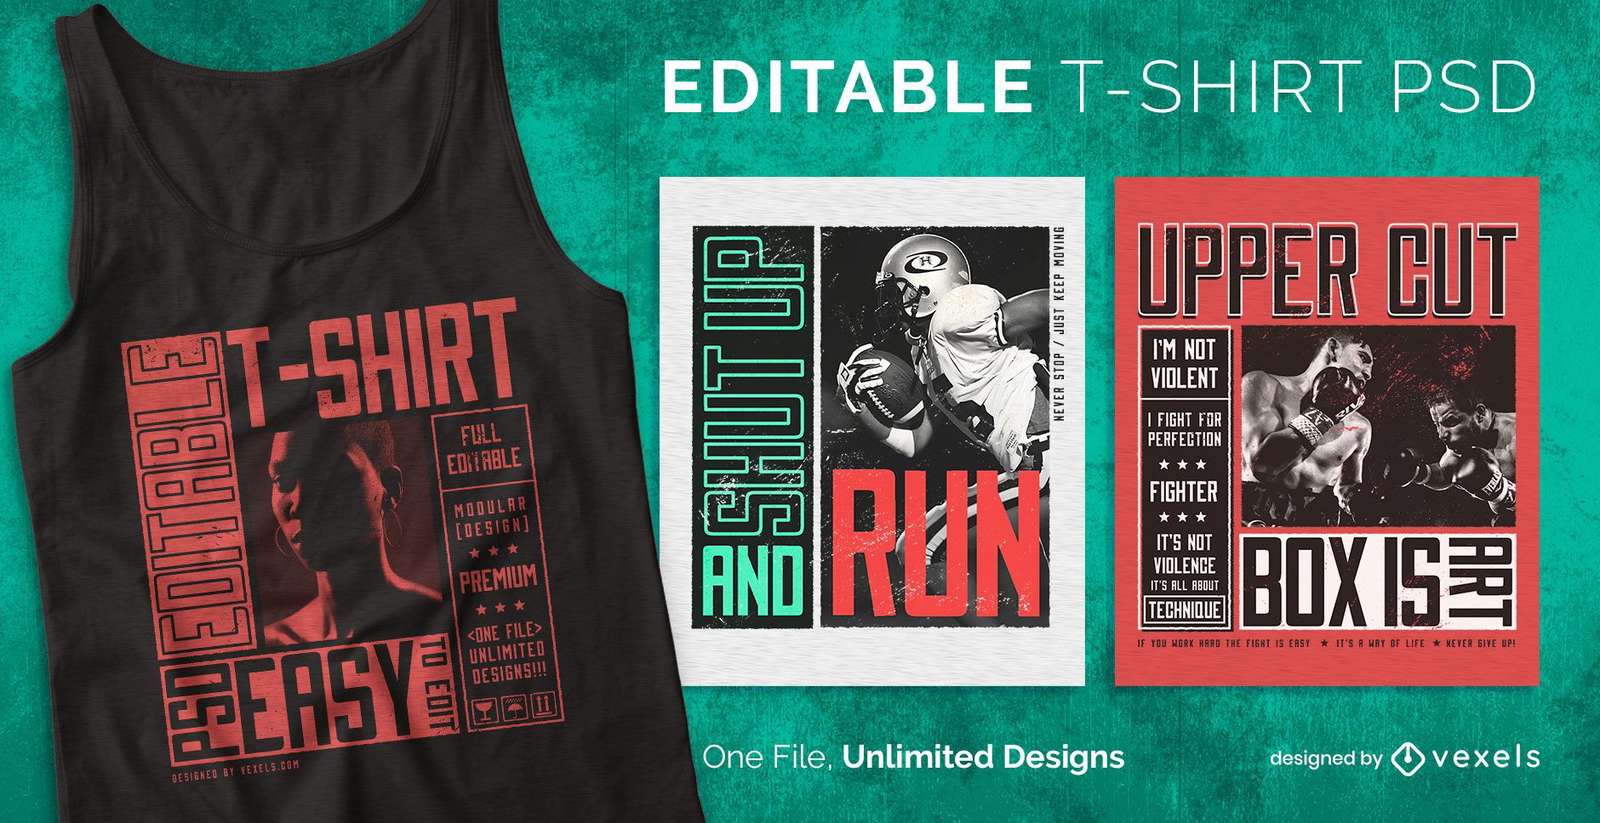
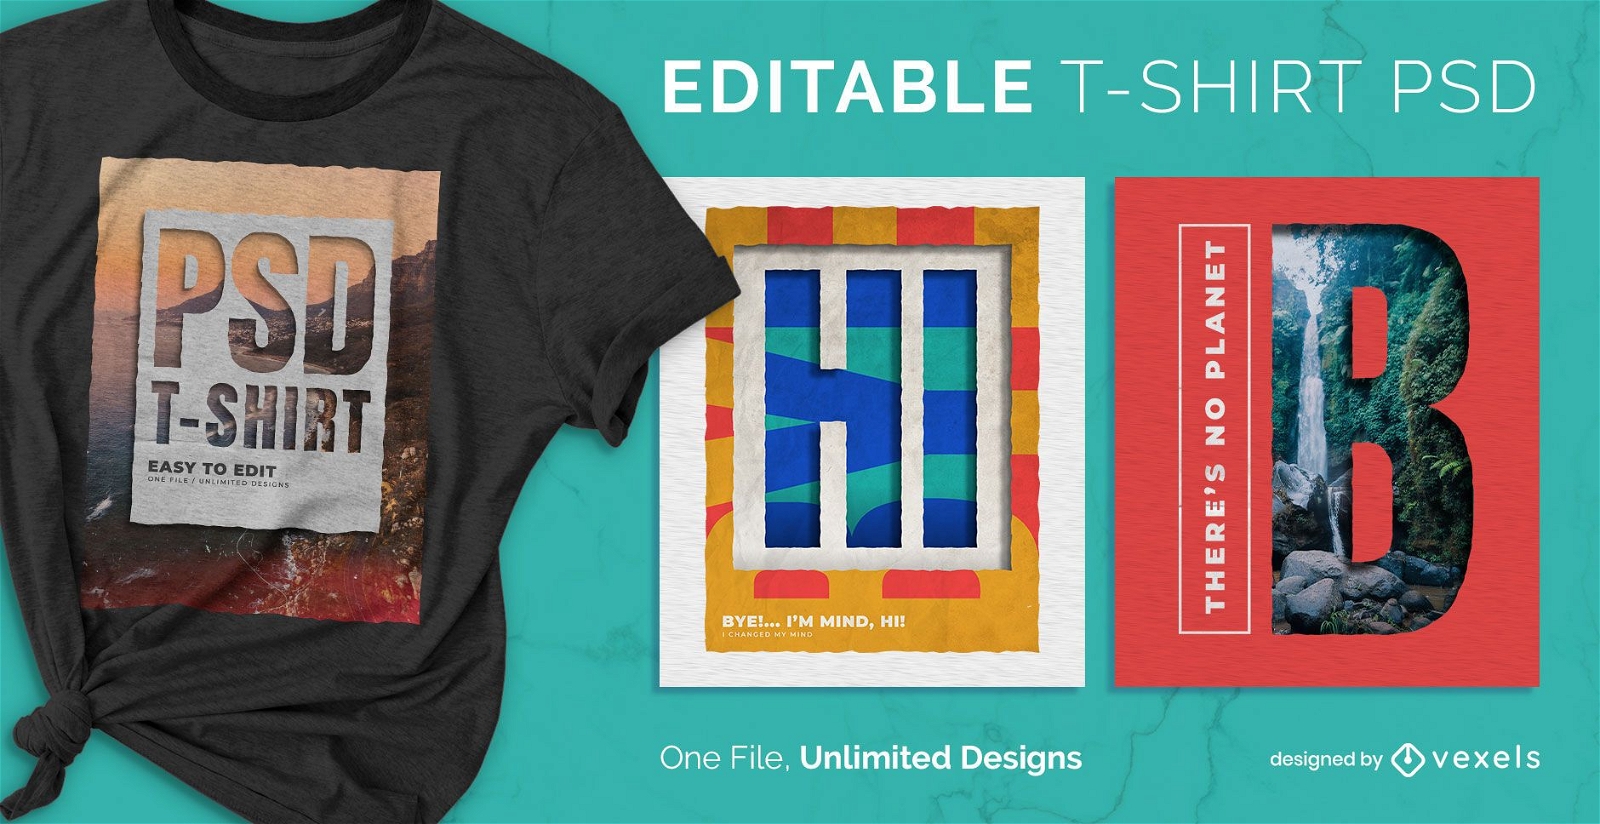
Ripped photographs scalable t-shirt psd
Escolha uma pasta
Todos os favoritos
Criar novo
Salvar
Ripped photographs scalable t-shirt psd
Pronto para imprimir
para Merch
Floral seek out psd t-shirt design
Escolha uma pasta
Todos os favoritos
Criar novo
Salvar
Floral seek out psd t-shirt design
Camiseta PSD escalável
para Merch
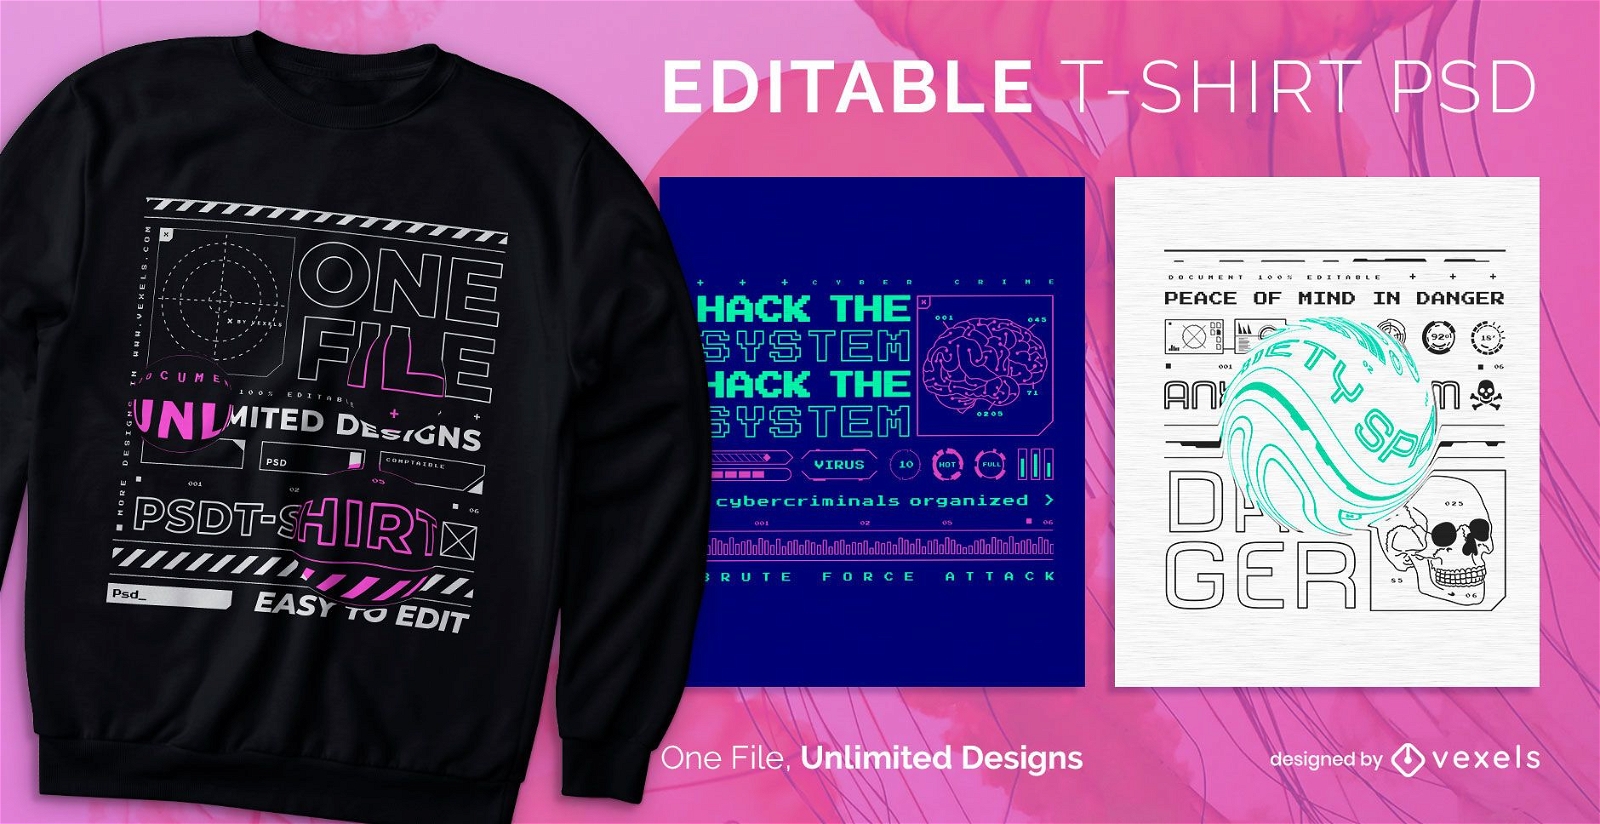
Hacker tech escalável t-shirt psd
Escolha uma pasta
Todos os favoritos
Criar novo
Salvar
Hacker tech escalável t-shirt psd
Camiseta PSD escalável
para Merch
T-shirt com texto mínimo escalonável psd
Escolha uma pasta
Todos os favoritos
Criar novo
Salvar
T-shirt com texto mínimo escalonável psd
texto editável
Pronto para imprimir
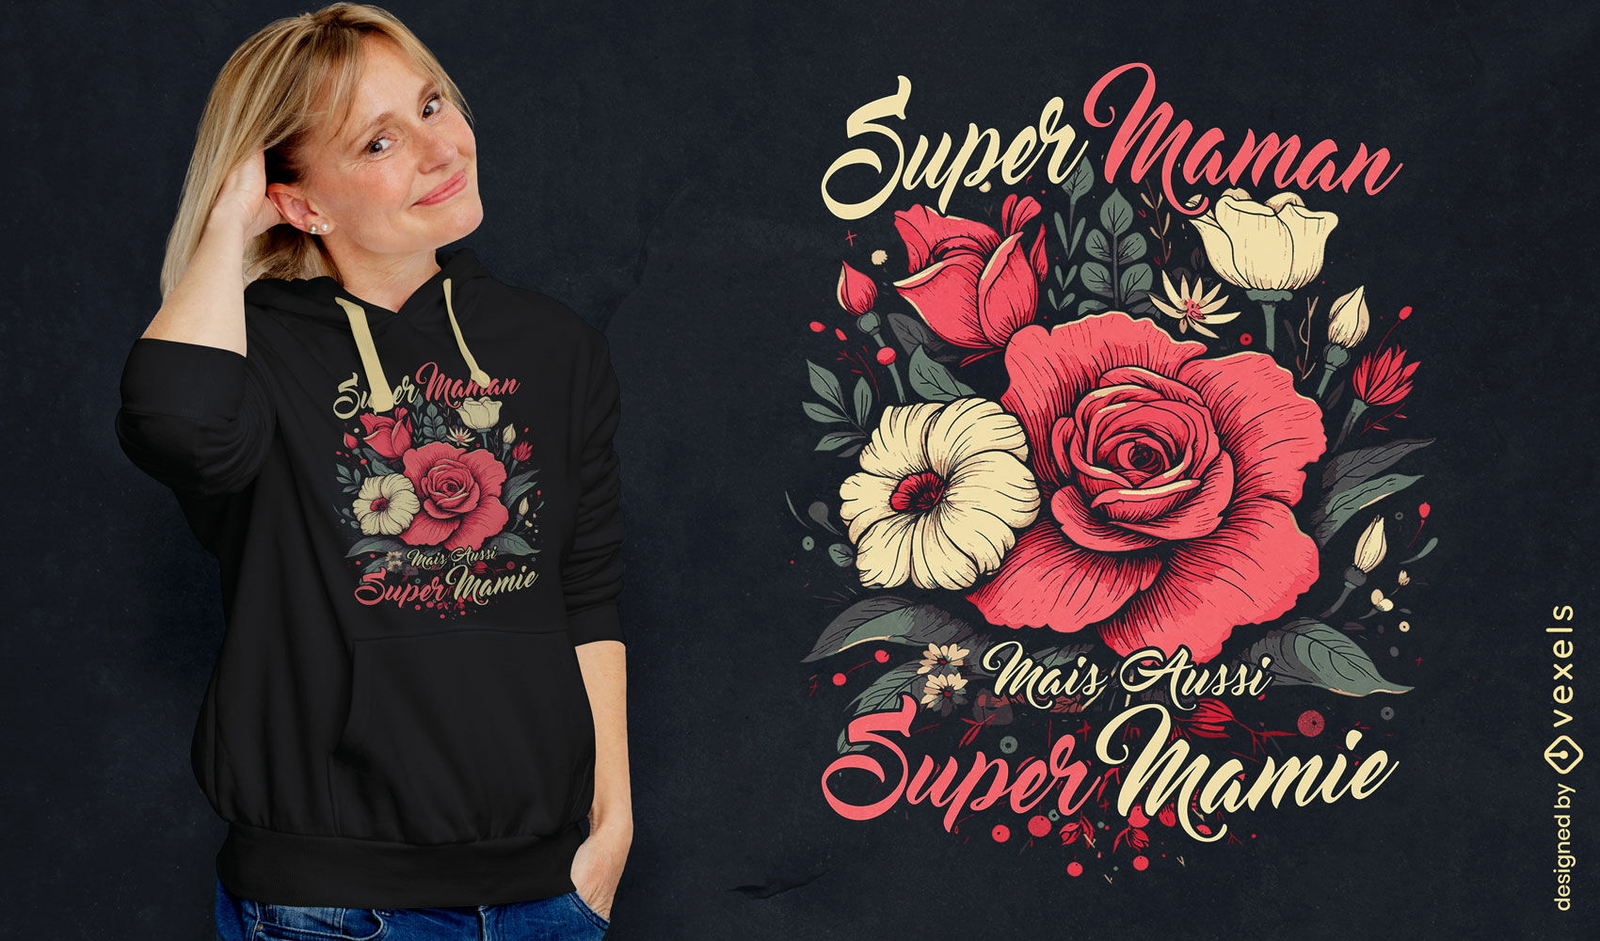
para Merch
Design de camiseta com rosas da vovó
Escolha uma pasta
Todos os favoritos
Criar novo
Salvar
Design de camiseta com rosas da vovó
Pronto para imprimir
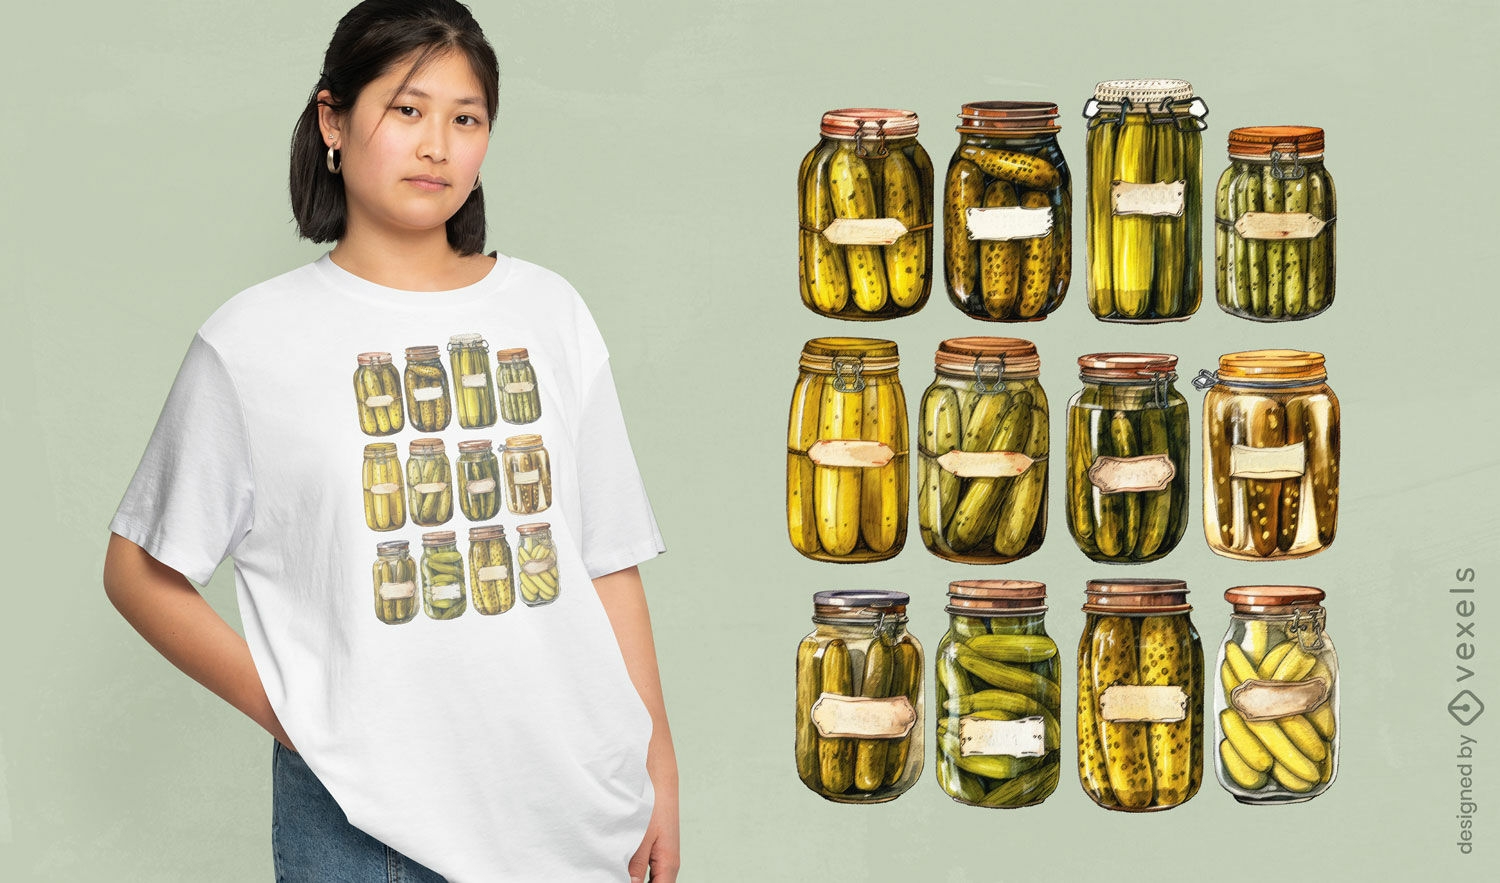
para Merch
Design de camisetas com picles em potes
Escolha uma pasta
Todos os favoritos
Criar novo
Salvar
Design de camisetas com picles em potes
Pronto para imprimir
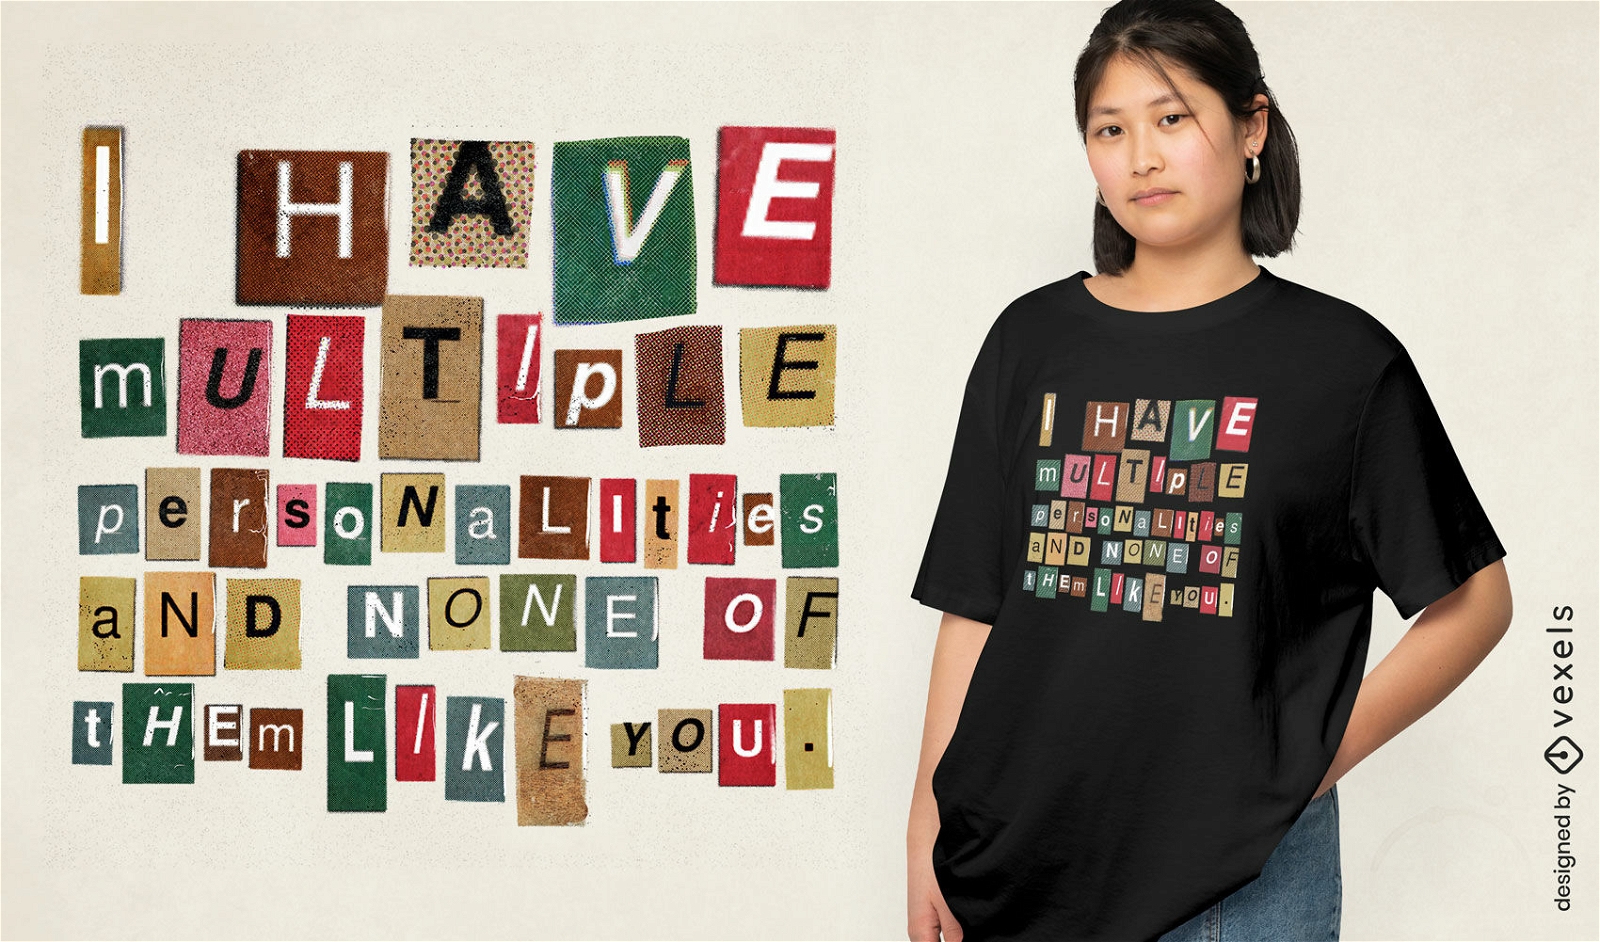
para Merch
Design de camiseta com letras recortadas de revista
Escolha uma pasta
Todos os favoritos
Criar novo
Salvar
Design de camiseta com letras recortadas de revista
Pronto para imprimir
para Merch
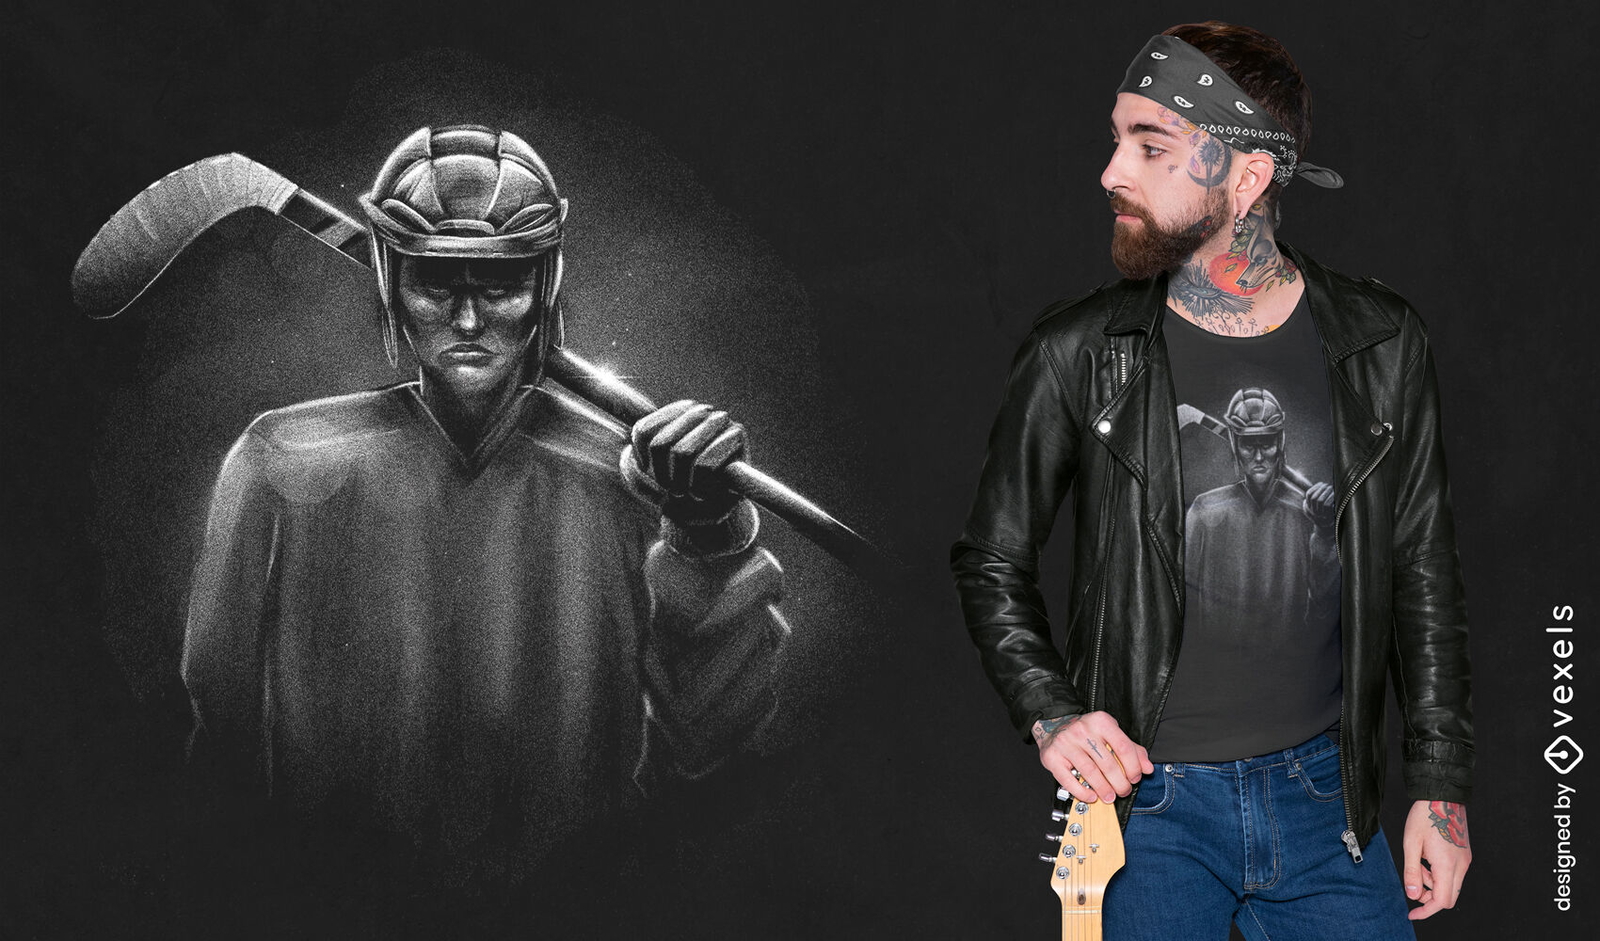
Design de camiseta de esporte de jogador de hóquei realista
Escolha uma pasta
Todos os favoritos
Criar novo
Salvar
Design de camiseta de esporte de jogador de hóquei realista
texto editável
Pronto para imprimir
para Merch
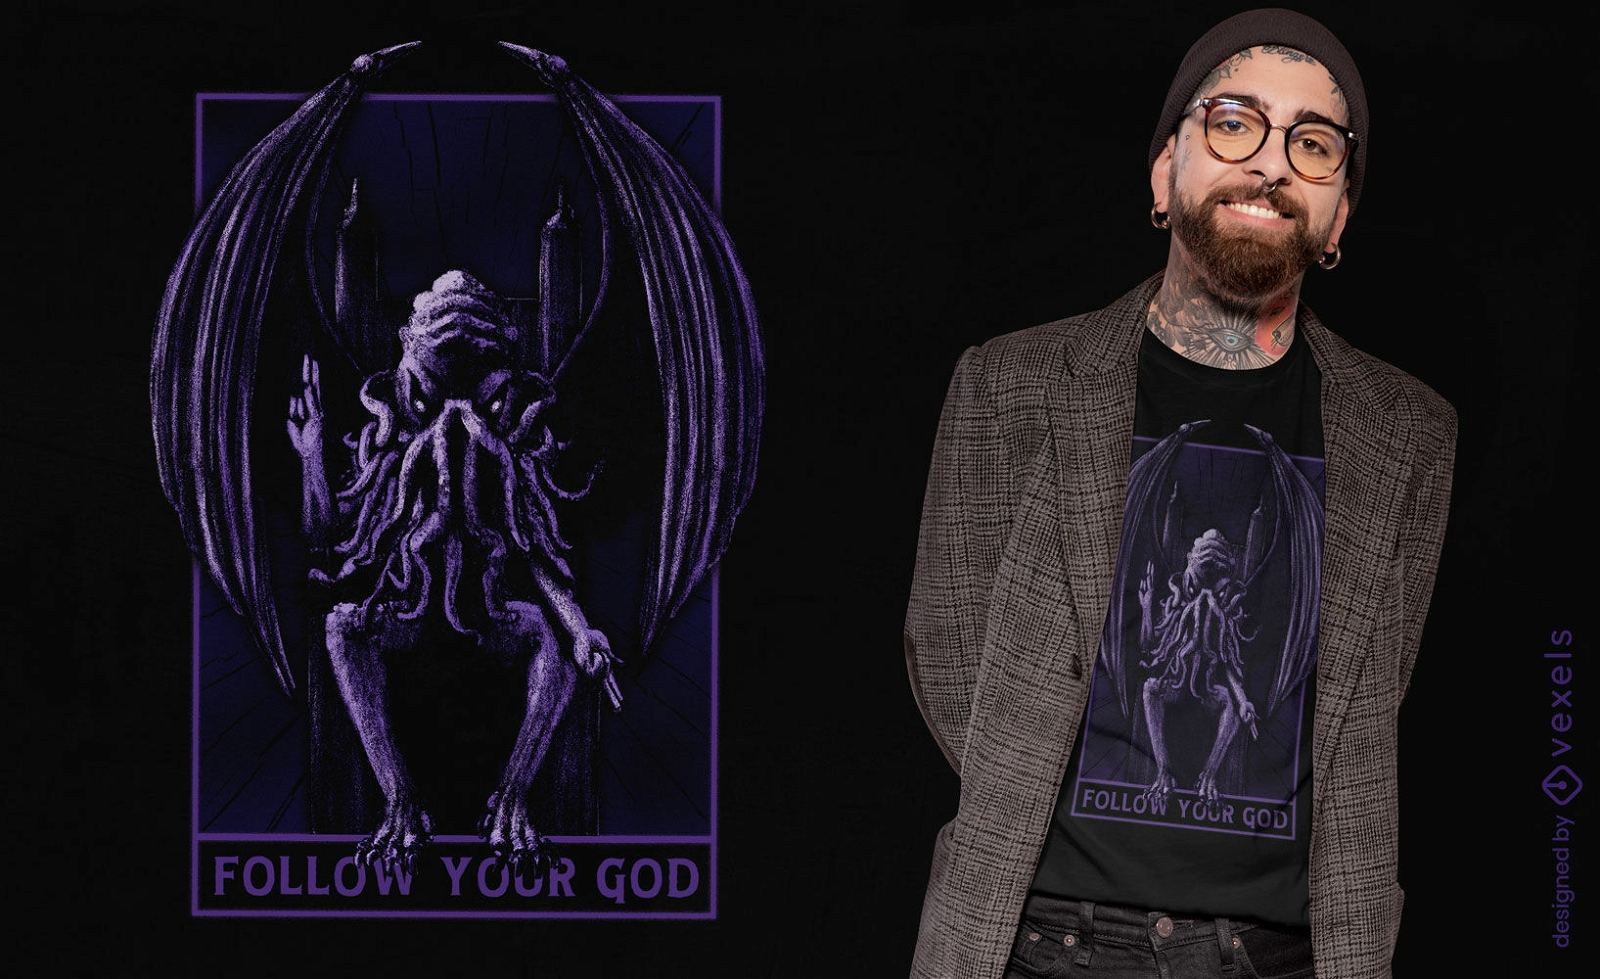
Design de camiseta do trono de Chtulu
Escolha uma pasta
Todos os favoritos
Criar novo
Salvar
Design de camiseta do trono de Chtulu
Pronto para imprimir
para Merch
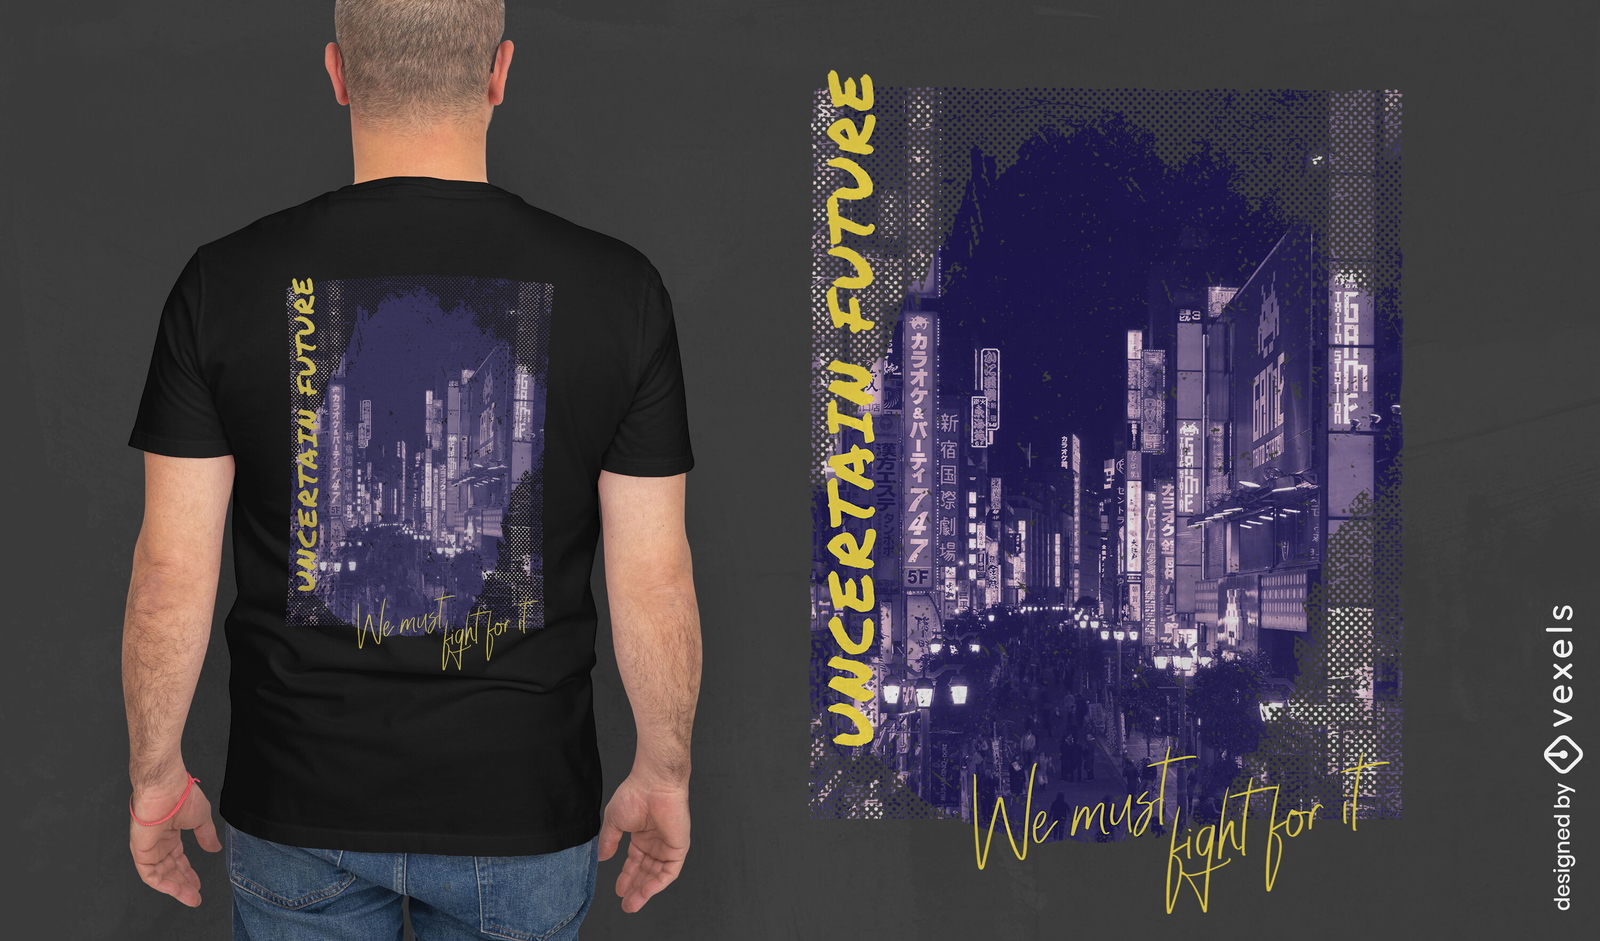
T-shirt de fotografia de cidade moderna à noite psd
Escolha uma pasta
Todos os favoritos
Criar novo
Salvar
T-shirt de fotografia de cidade moderna à noite psd
Pronto para imprimir
para Merch
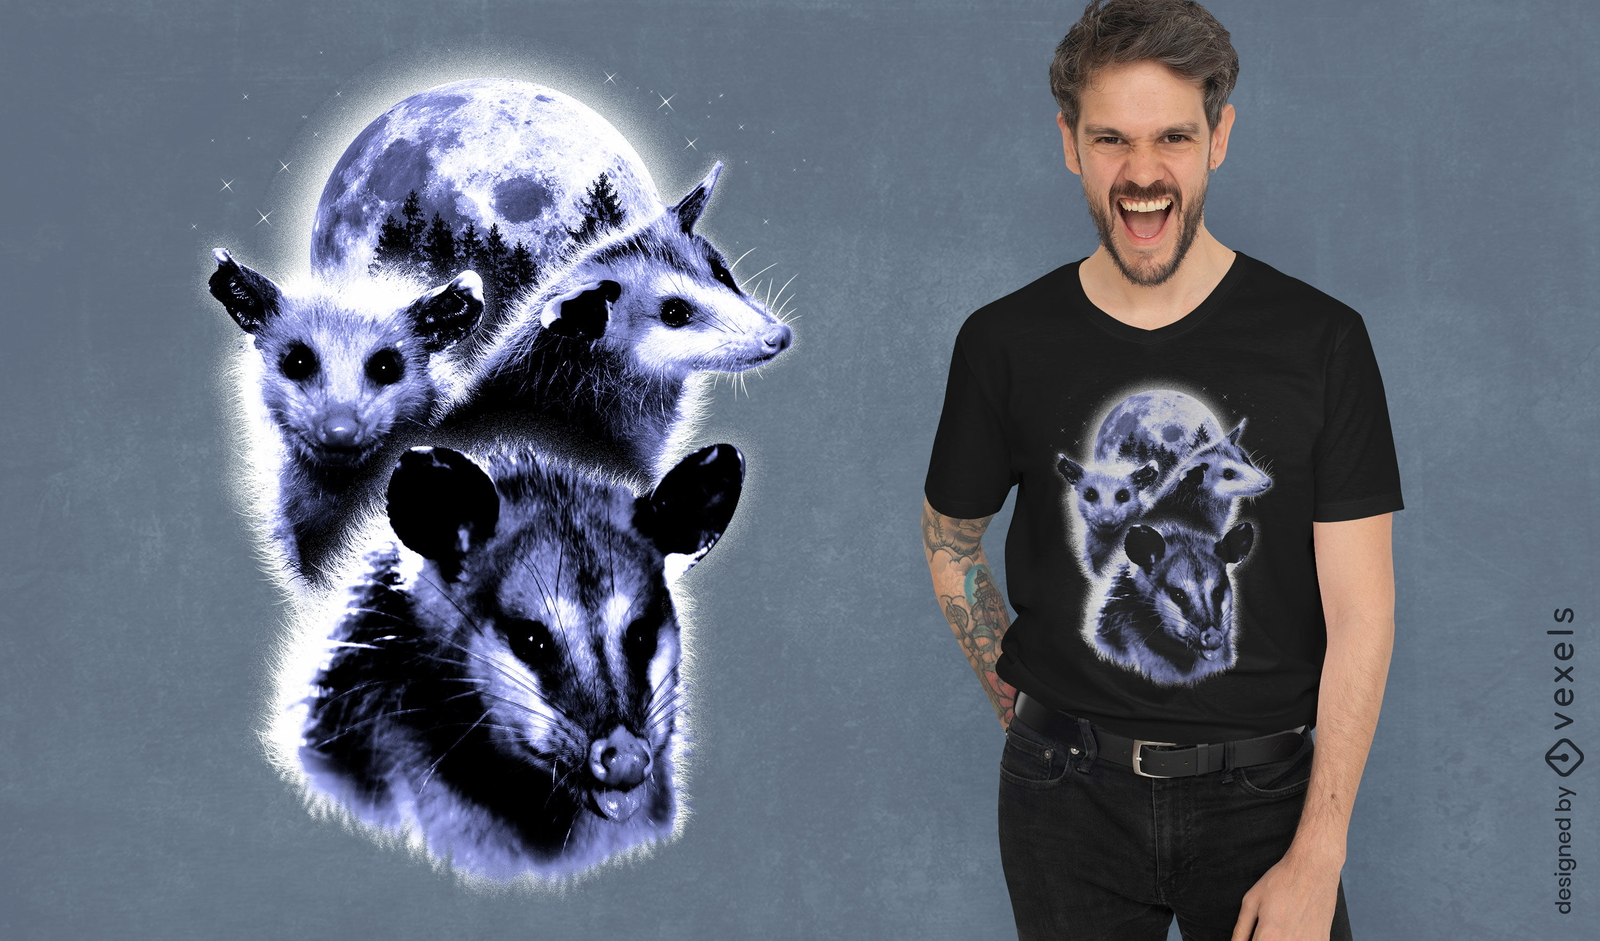
Design de camiseta de lua de gambás
Escolha uma pasta
Todos os favoritos
Criar novo
Salvar
Design de camiseta de lua de gambás
Pronto para imprimir
para Merch
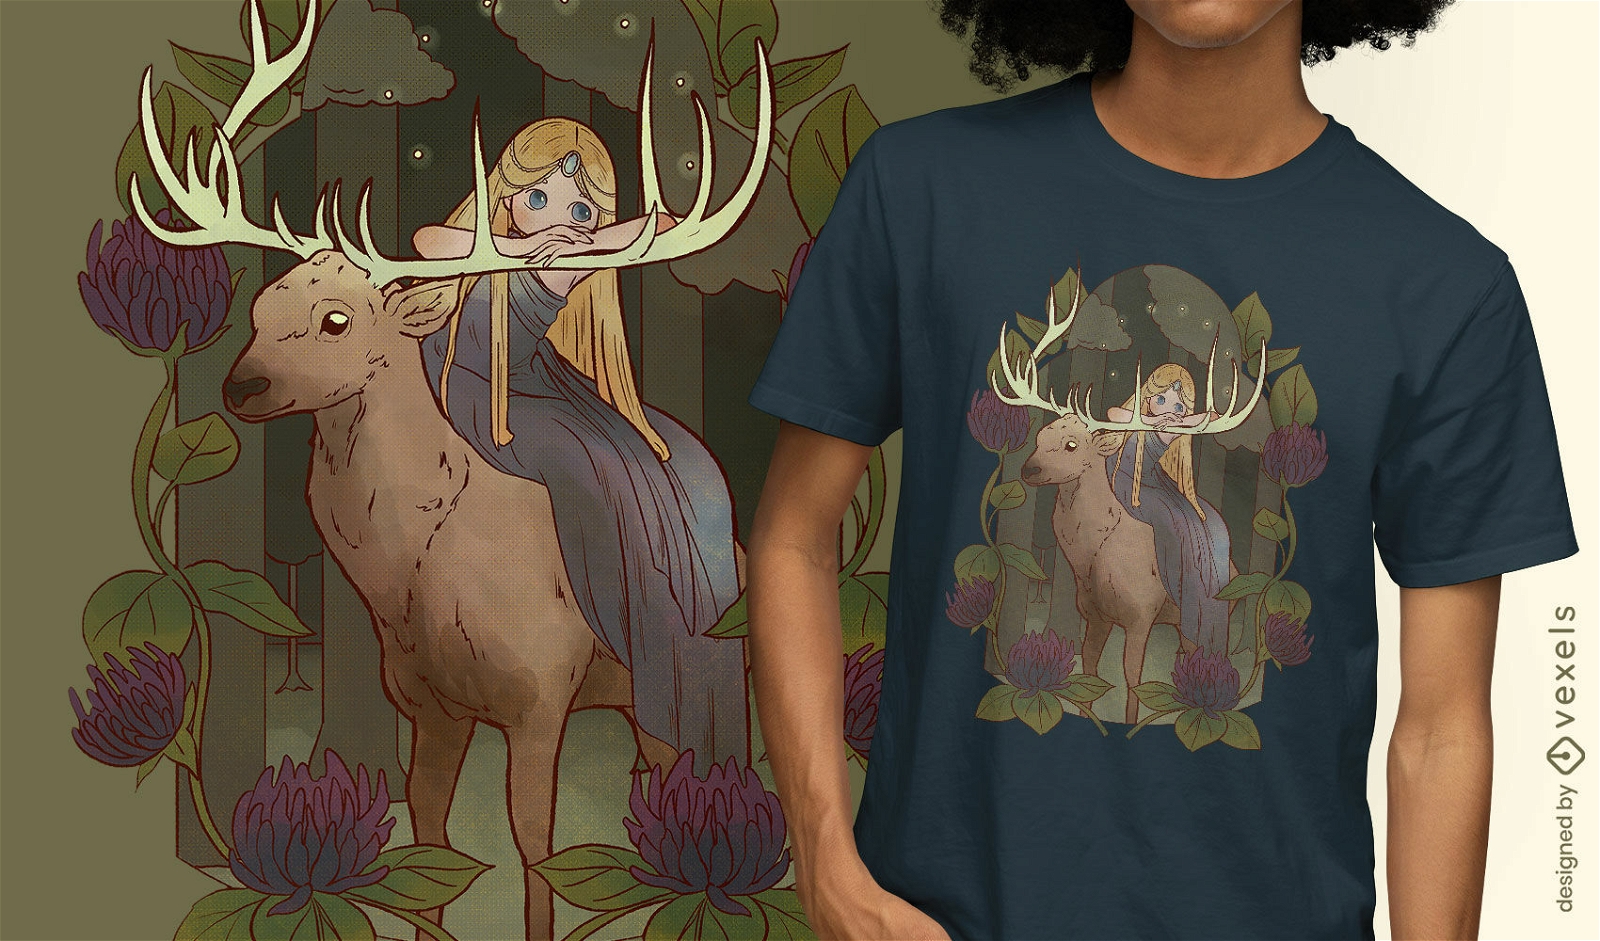
Design de camiseta de veado e fada
Escolha uma pasta
Todos os favoritos
Criar novo
Salvar
Design de camiseta de veado e fada
Pronto para imprimir
para Merch
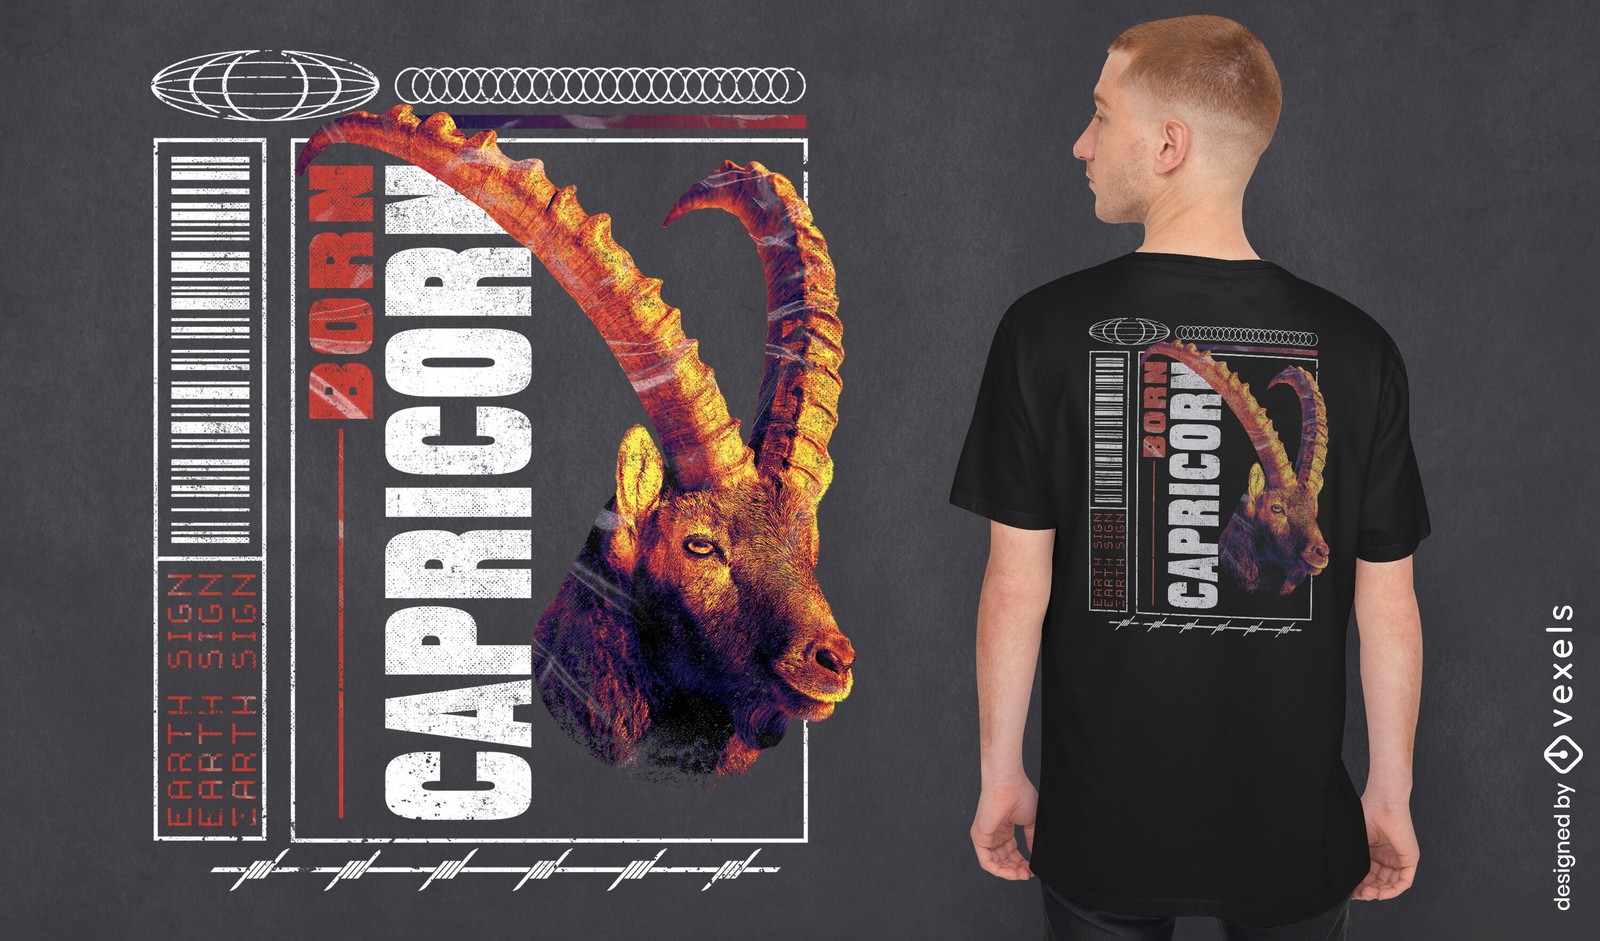
Design de camiseta de Capricórnio nascido
Escolha uma pasta
Todos os favoritos
Criar novo
Salvar
Design de camiseta de Capricórnio nascido
Pronto para imprimir
para Merch
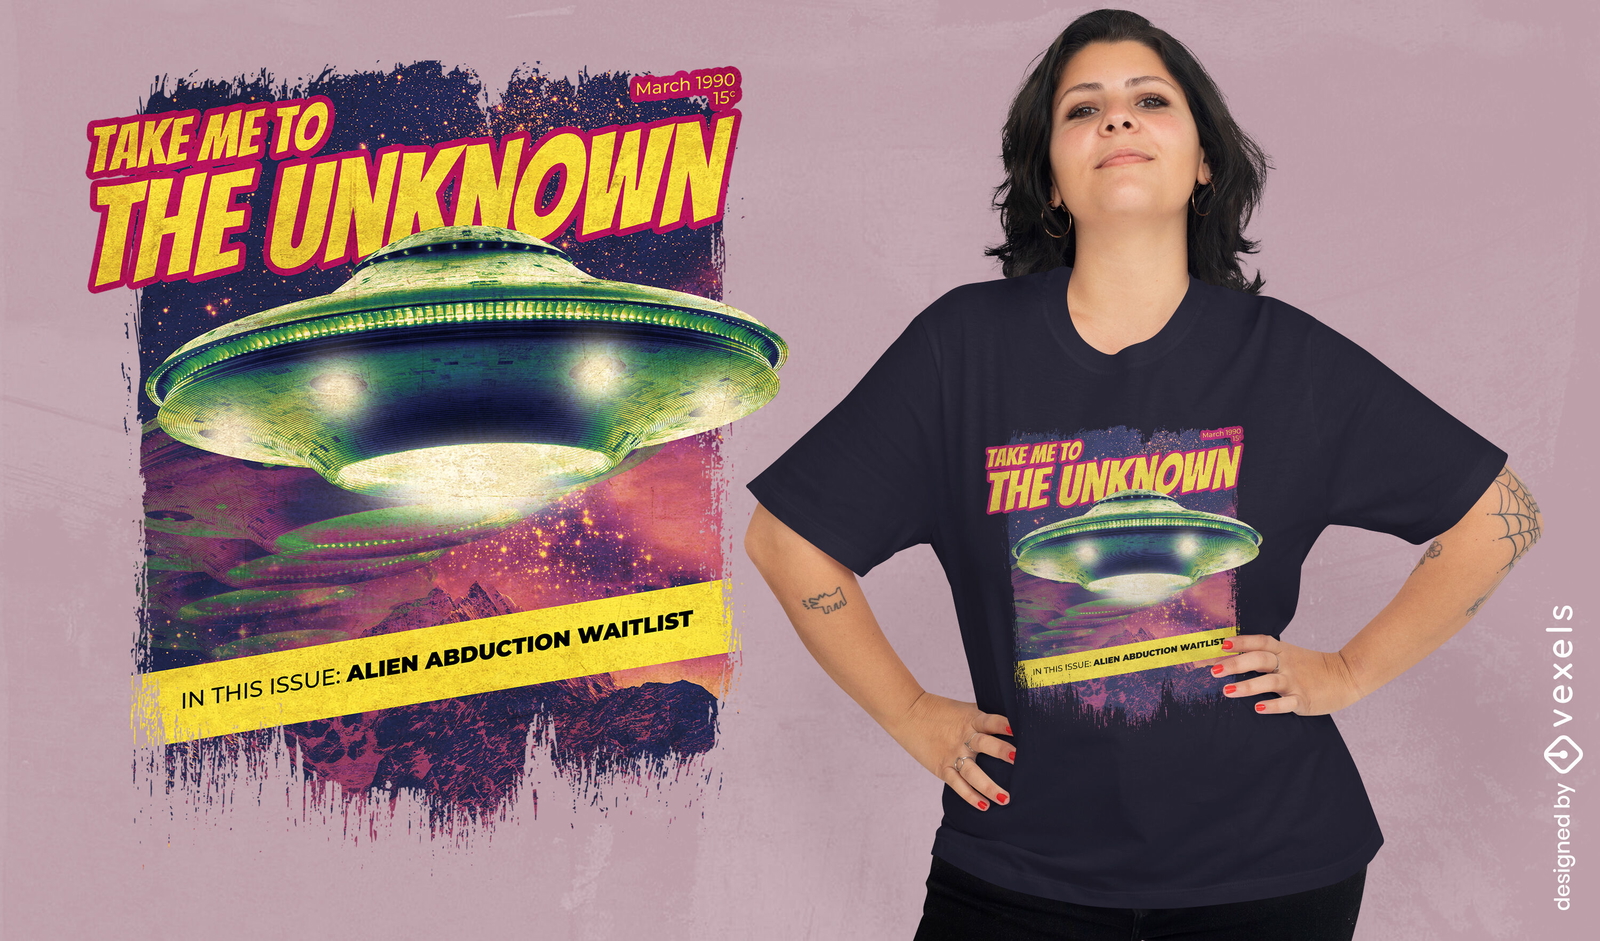
Design de camiseta psd de revista de abdução alienígena
Escolha uma pasta
Todos os favoritos
Criar novo
Salvar
Design de camiseta psd de revista de abdução alienígena
Camiseta PSD escalável
para Merch
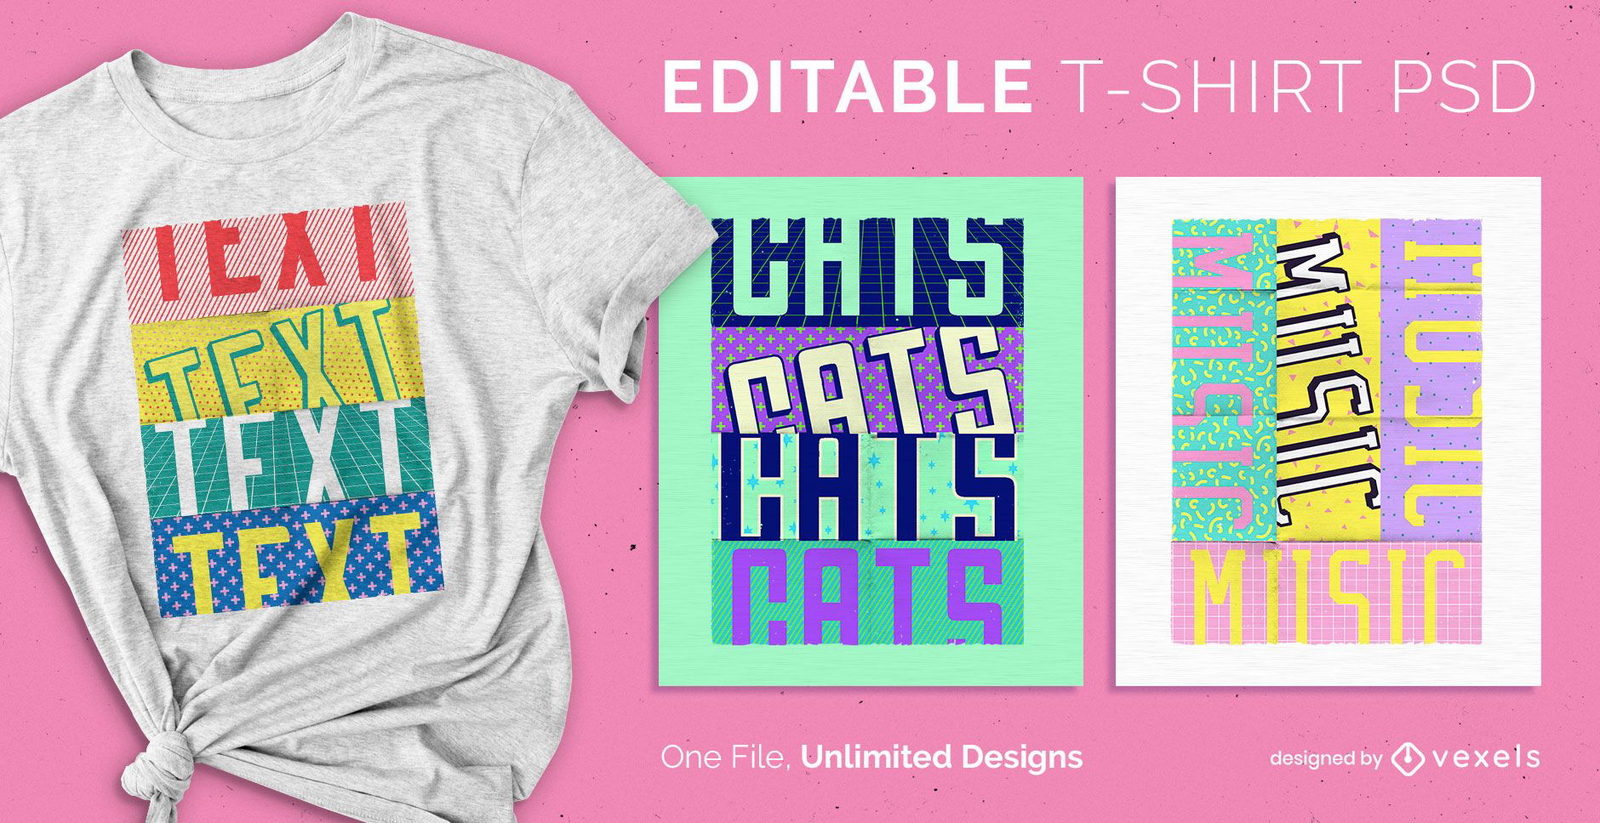
Camiseta escalonável com texto pop psd
Escolha uma pasta
Todos os favoritos
Criar novo
Salvar
Camiseta escalonável com texto pop psd
texto editável
Pronto para imprimir
para Merch
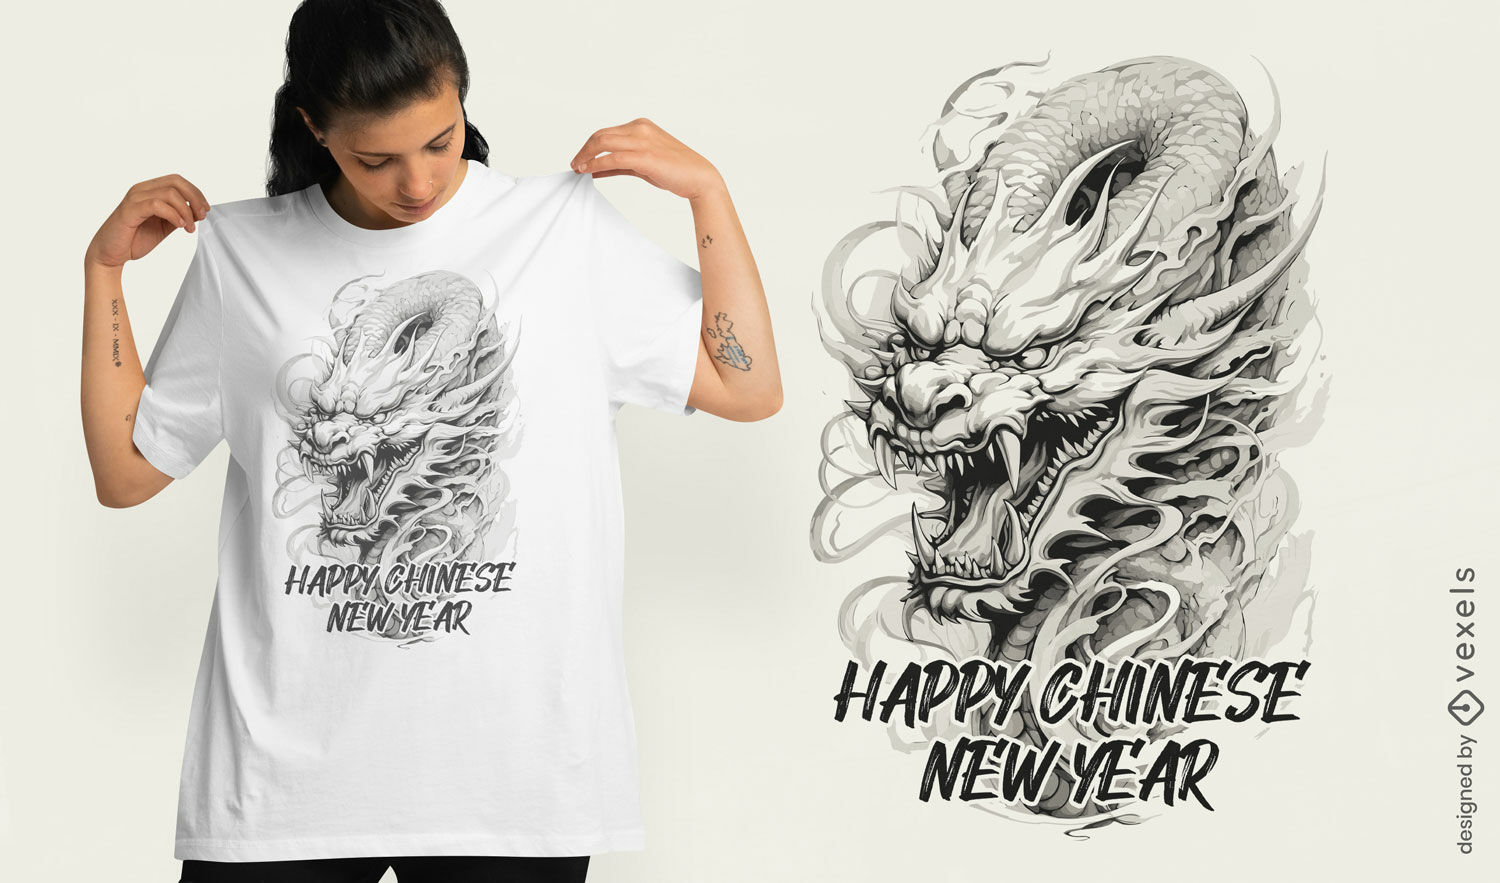
Design de camiseta com drag?o de feliz ano novo chin?s
Escolha uma pasta
Todos os favoritos
Criar novo
Salvar
Design de camiseta com drag?o de feliz ano novo chin?s
Pronto para imprimir
para Merch
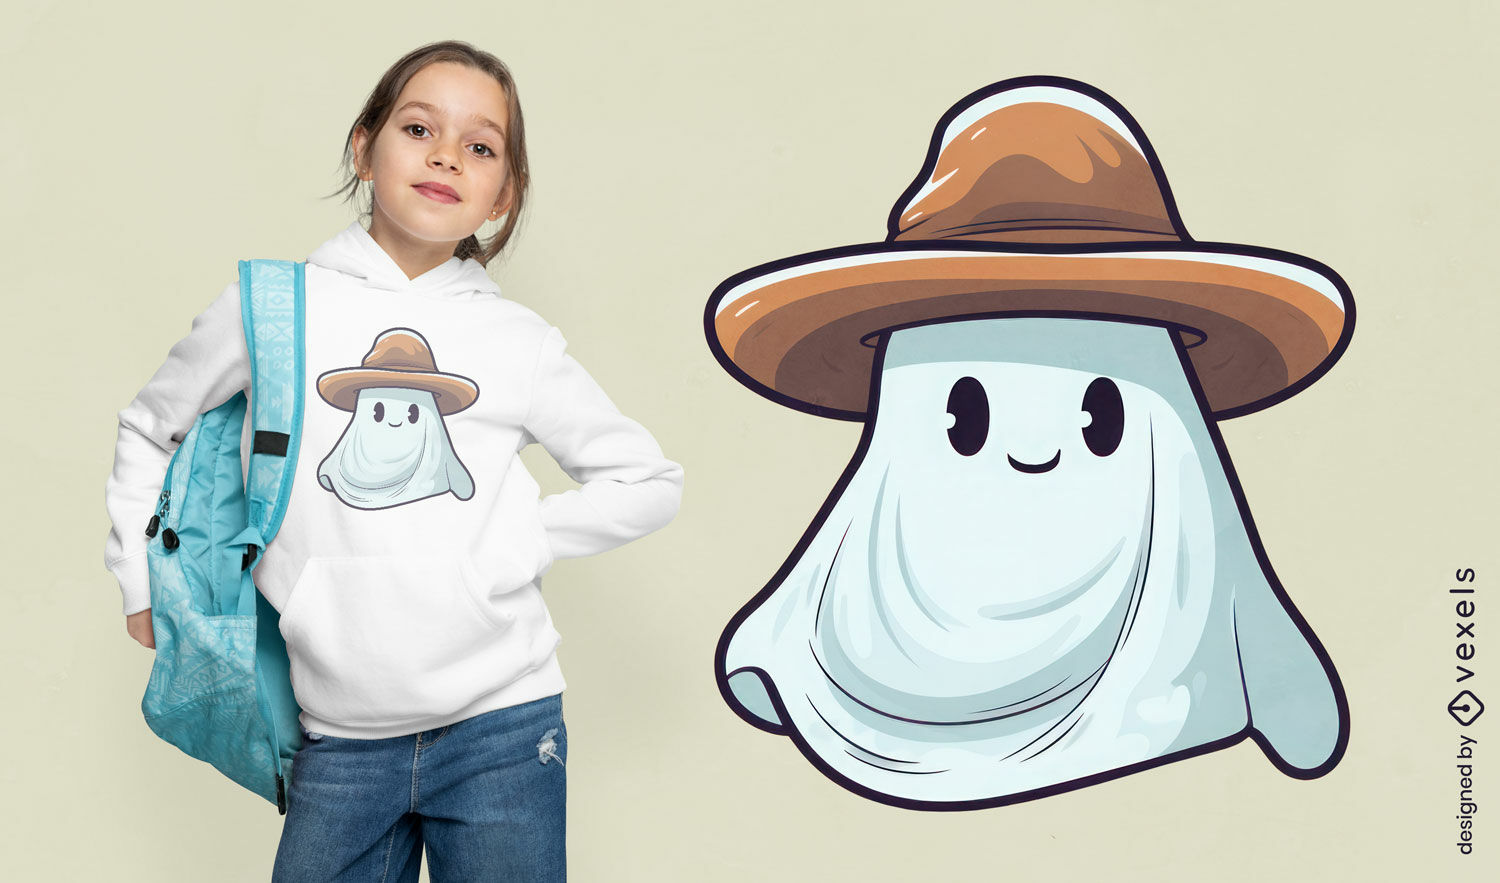
Design de camiseta fantasma com chap?u de cowboy
Escolha uma pasta
Todos os favoritos
Criar novo
Salvar
Design de camiseta fantasma com chap?u de cowboy
Pronto para imprimir
para Merch
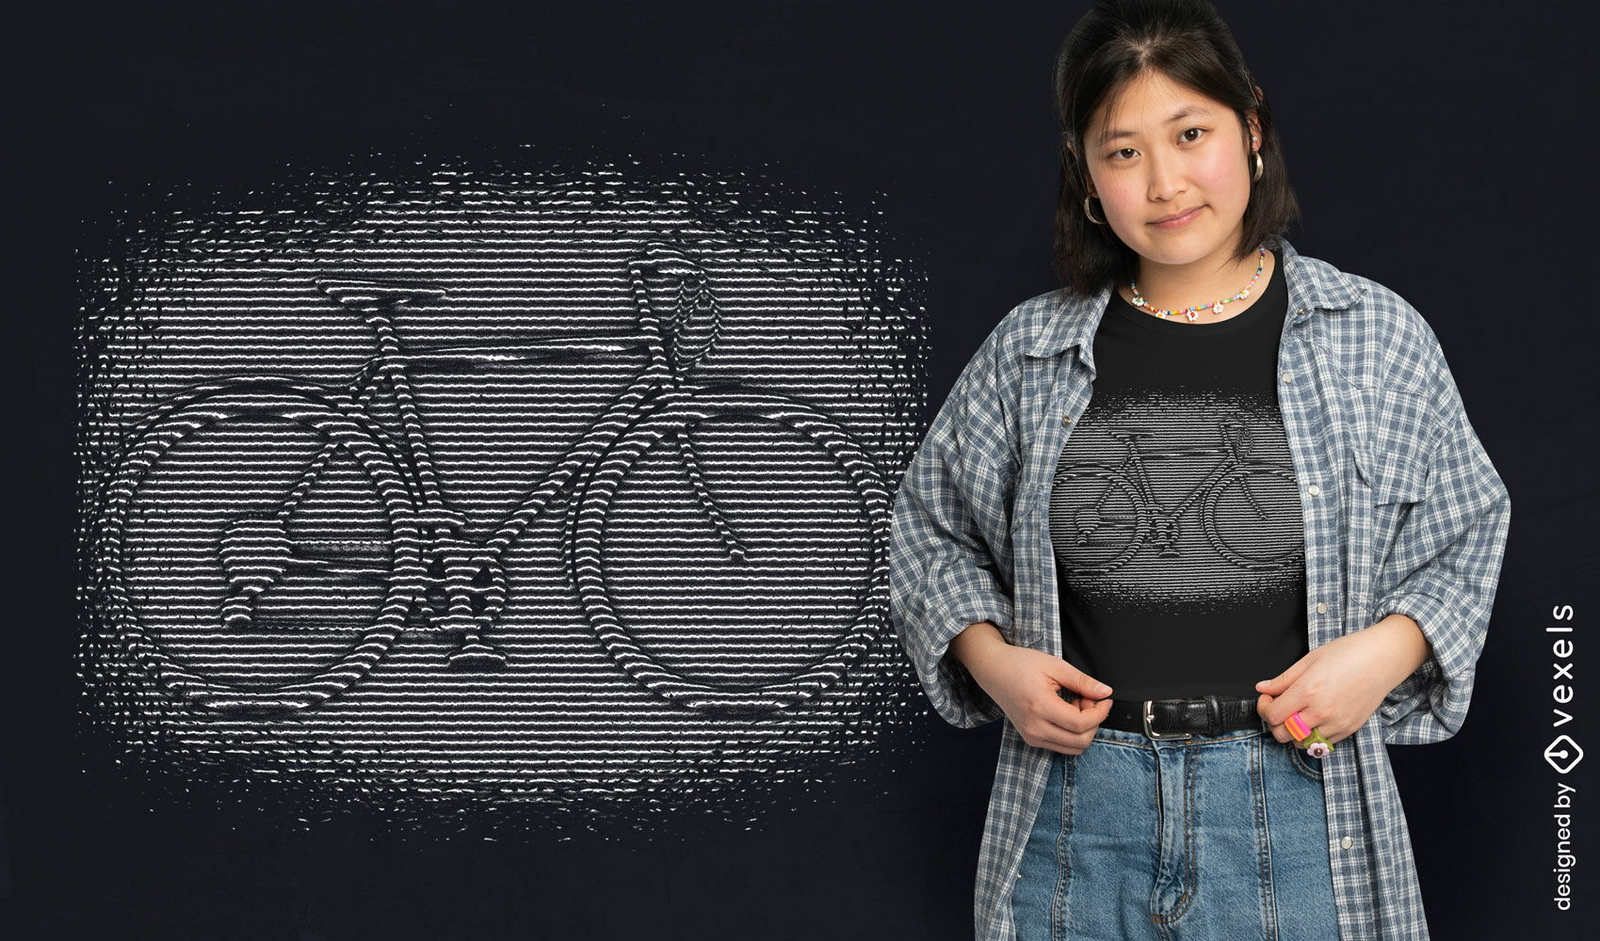
Design de camiseta de ilusão de ótica de bicicleta
Escolha uma pasta
Todos os favoritos
Criar novo
Salvar
Design de camiseta de ilusão de ótica de bicicleta
Pronto para imprimir
para Merch
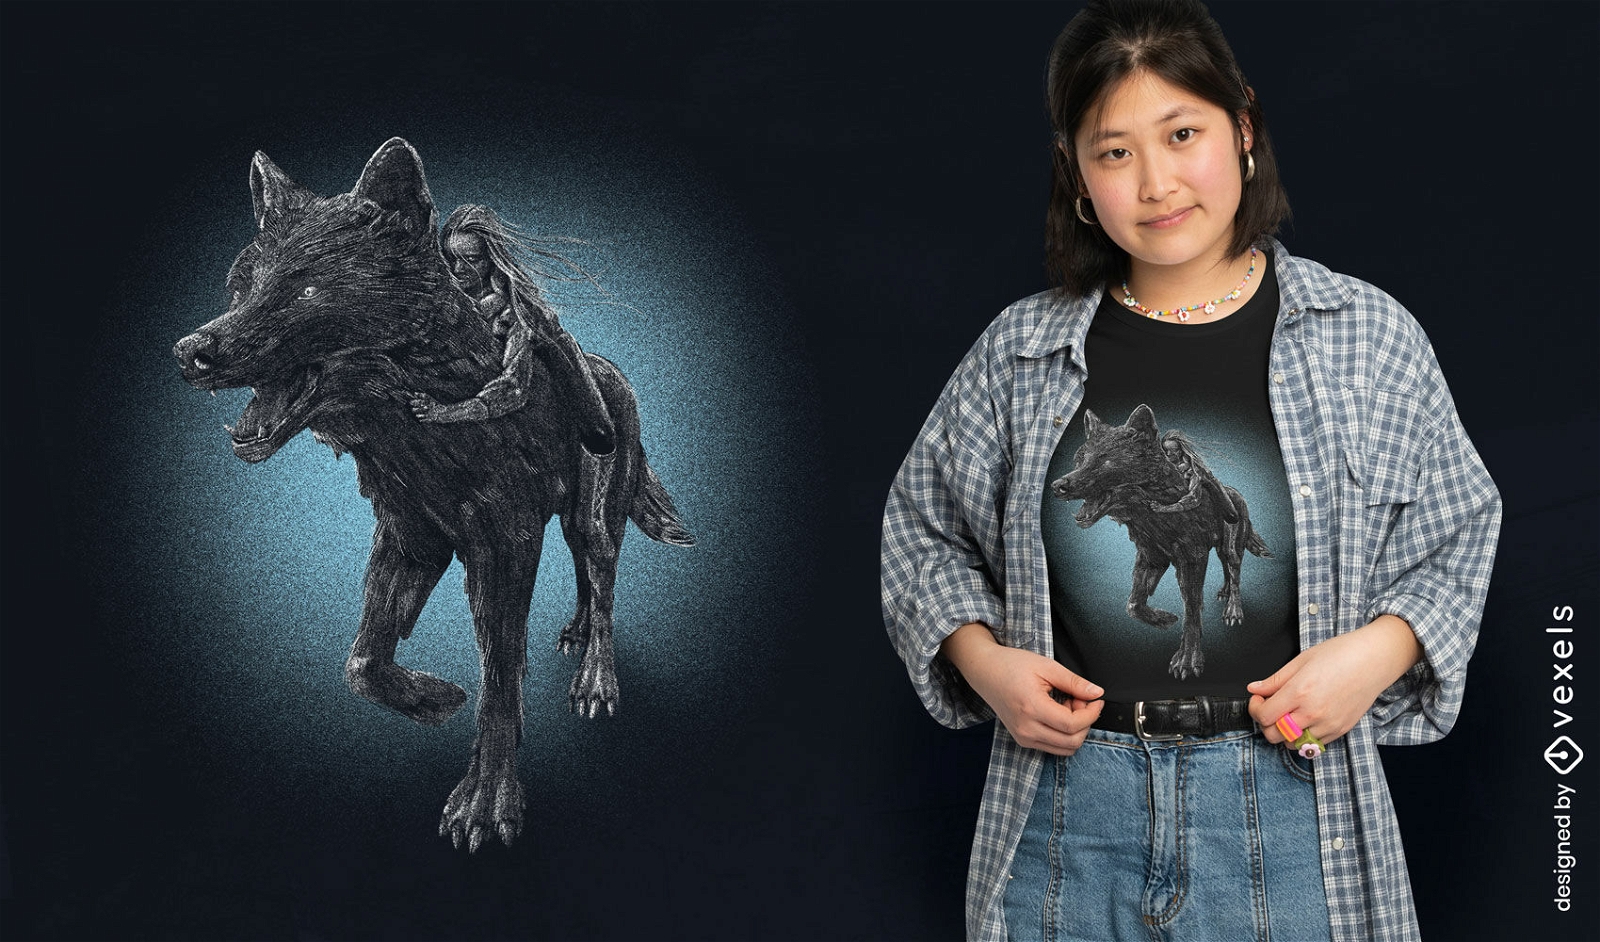
Design de camiseta animal menina e lobo
Escolha uma pasta
Todos os favoritos
Criar novo
Salvar
Design de camiseta animal menina e lobo
texto editável
Pronto para imprimir
para Merch
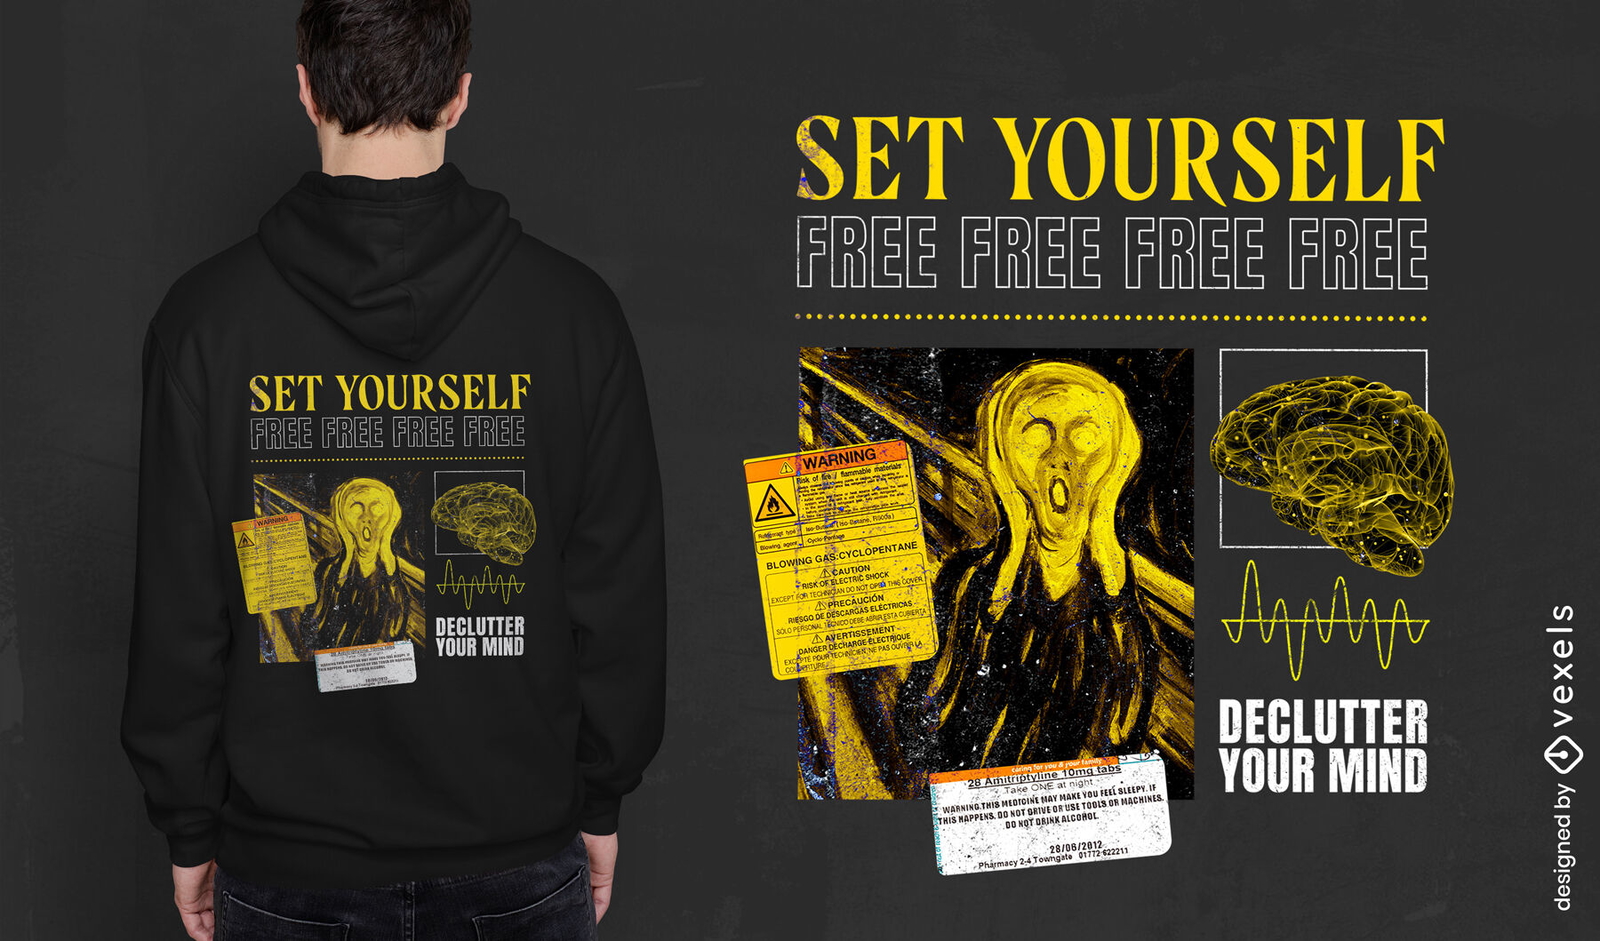
Defina-se design de t-shirt PSD grito grátis
Escolha uma pasta
Todos os favoritos
Criar novo
Salvar
Defina-se design de t-shirt PSD grito grátis
Pronto para imprimir
para Merch
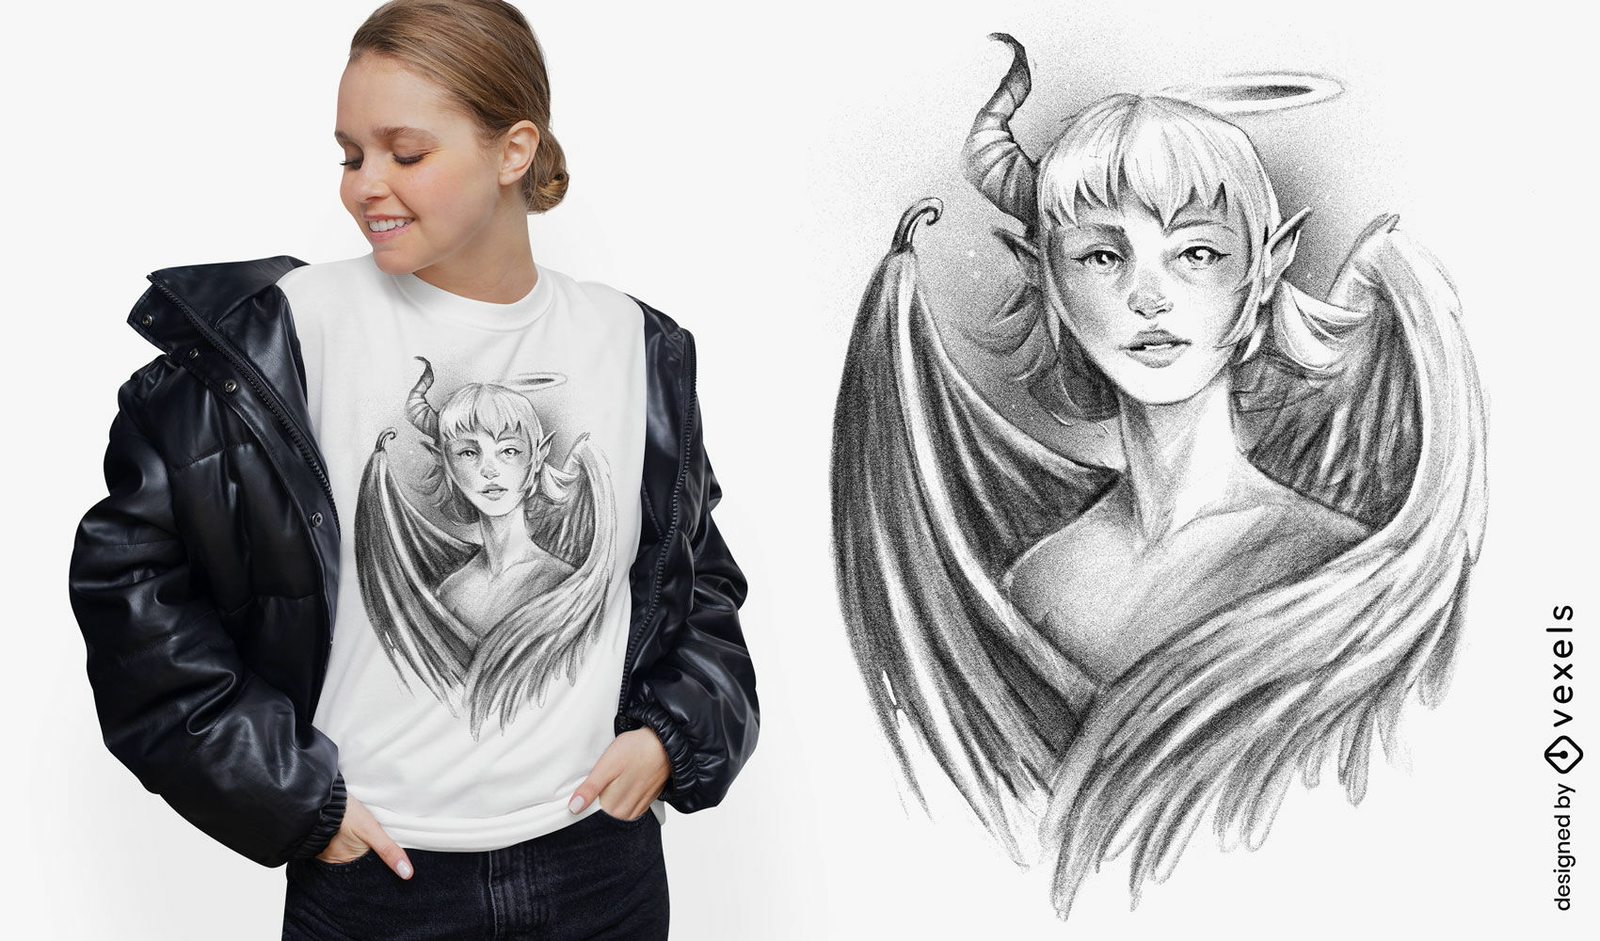
Design de camiseta de anjo e demônio
Escolha uma pasta
Todos os favoritos
Criar novo
Salvar
Design de camiseta de anjo e demônio
Pronto para imprimir
para Merch
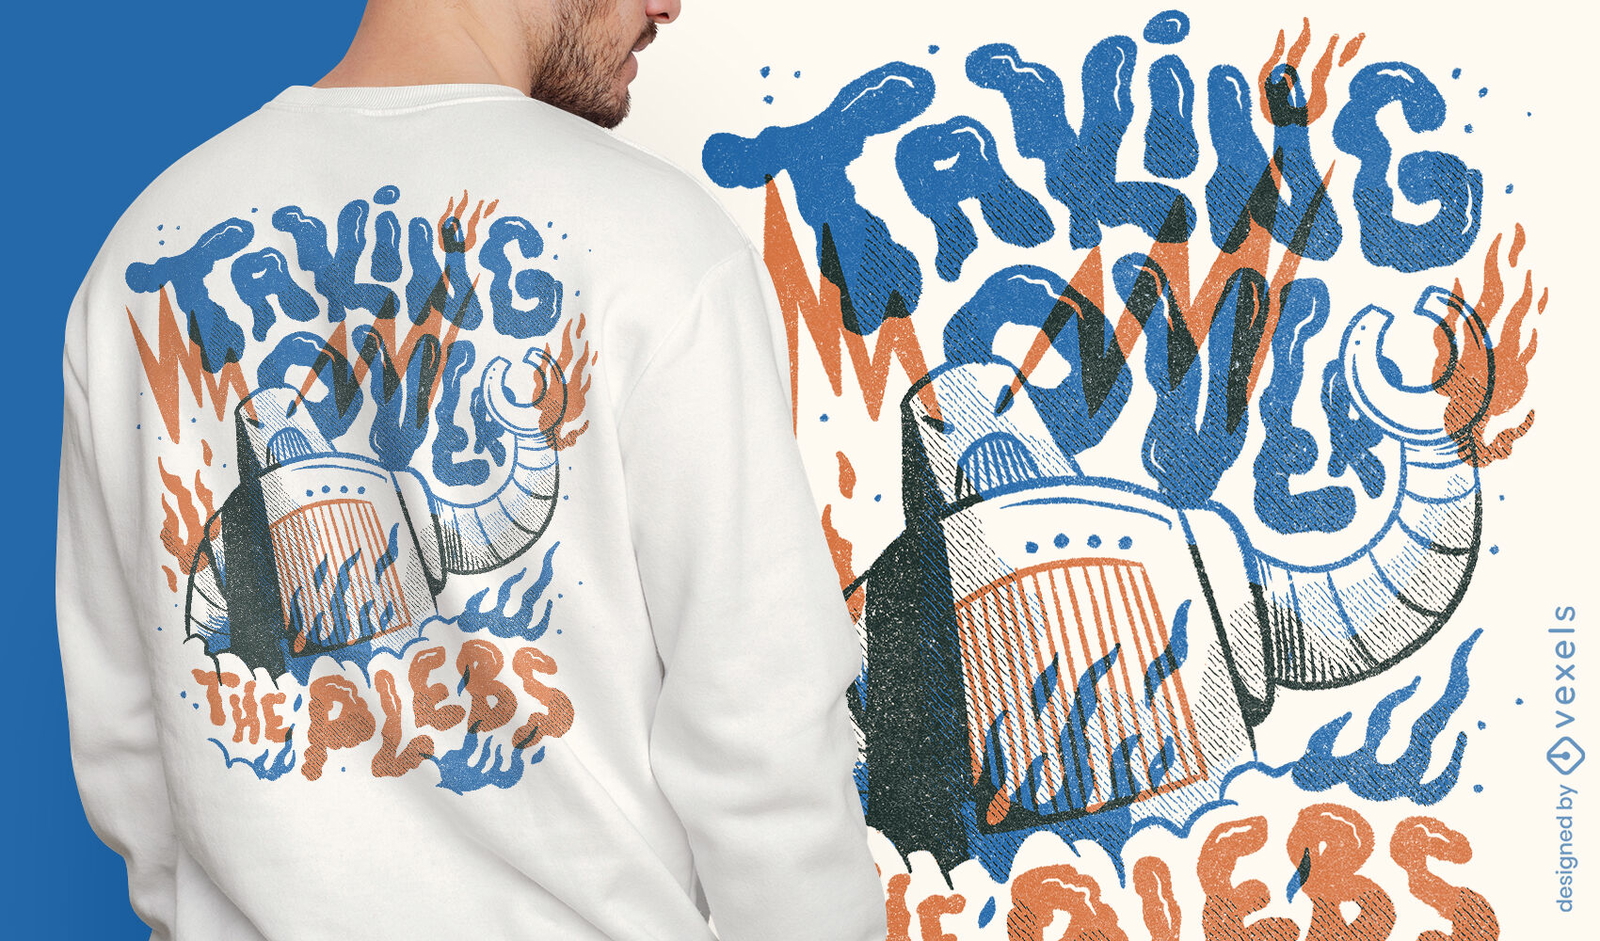
Design de camiseta da plebe de invasão de robôs
Escolha uma pasta
Todos os favoritos
Criar novo
Salvar
Design de camiseta da plebe de invasão de robôs
Pronto para imprimir
para Merch
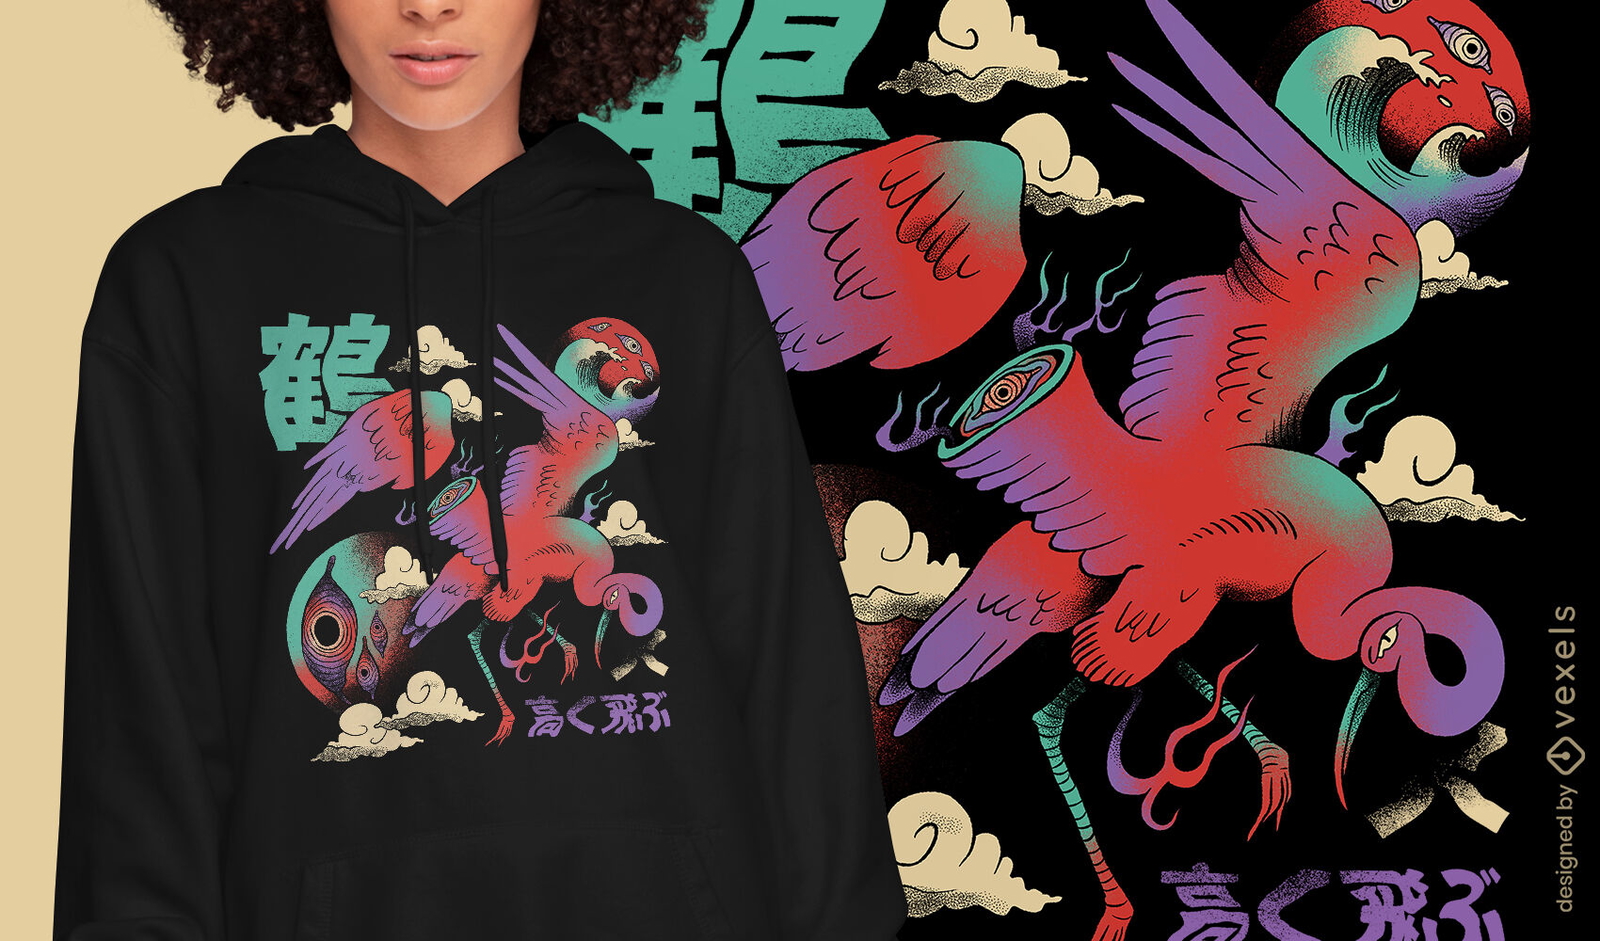
Pássaro em design de camiseta psicodélica japonesa
Escolha uma pasta
Todos os favoritos
Criar novo
Salvar
Pássaro em design de camiseta psicodélica japonesa
Pronto para imprimir
para Merch
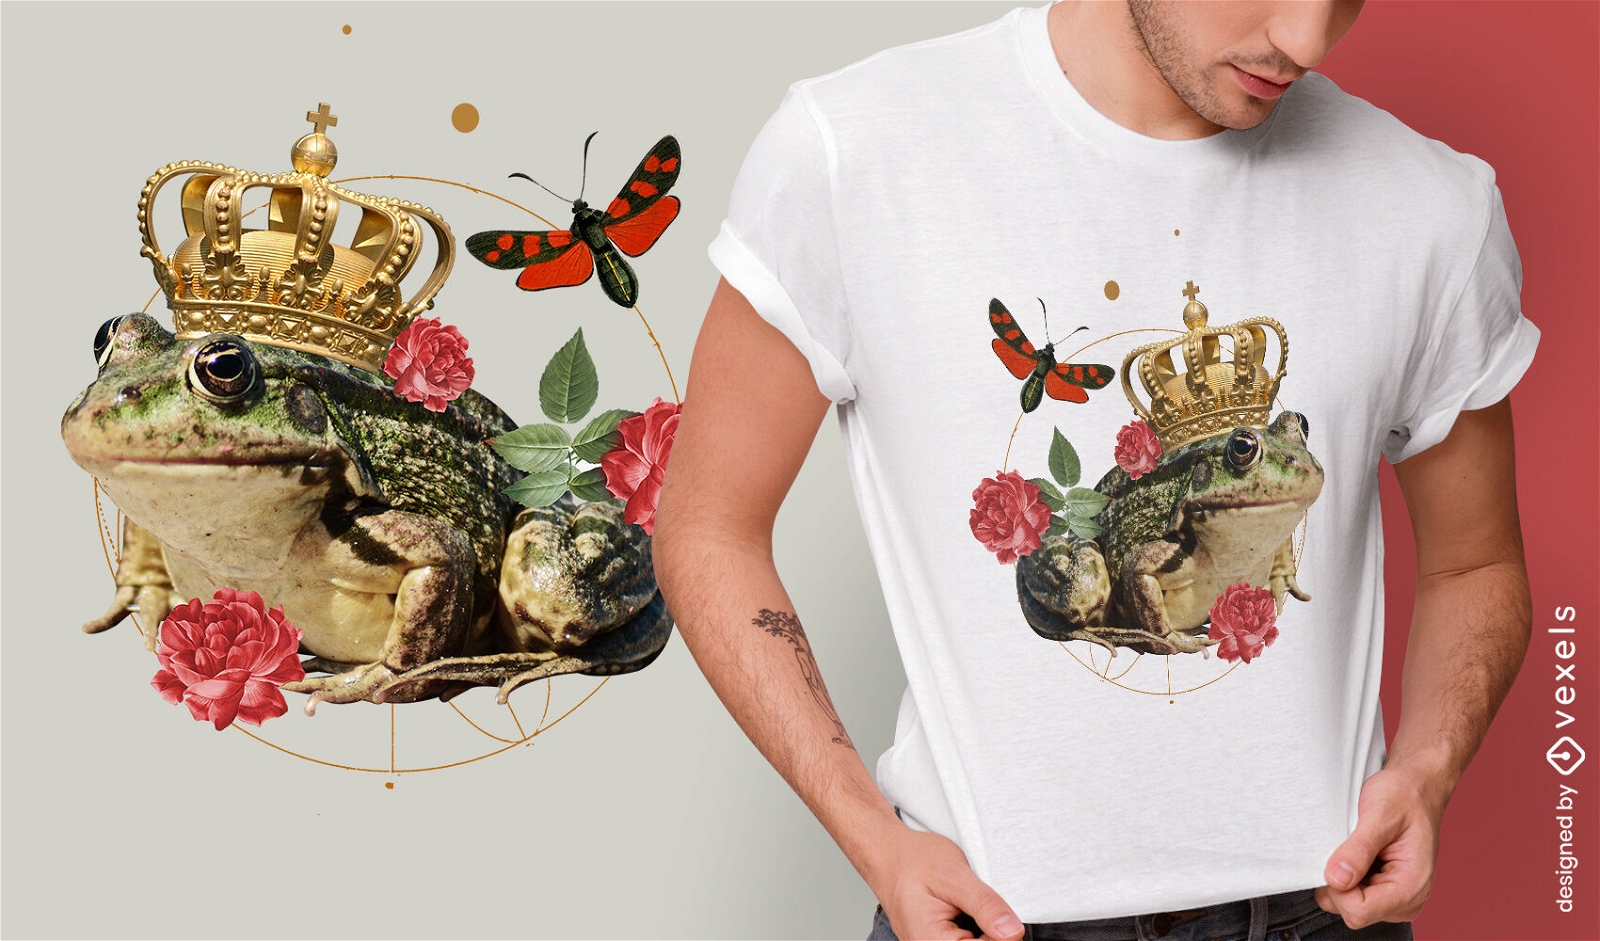
Design de camiseta psd do rei sapo natureza absurda
Escolha uma pasta
Todos os favoritos
Criar novo
Salvar
Design de camiseta psd do rei sapo natureza absurda
Pronto para imprimir
para Merch
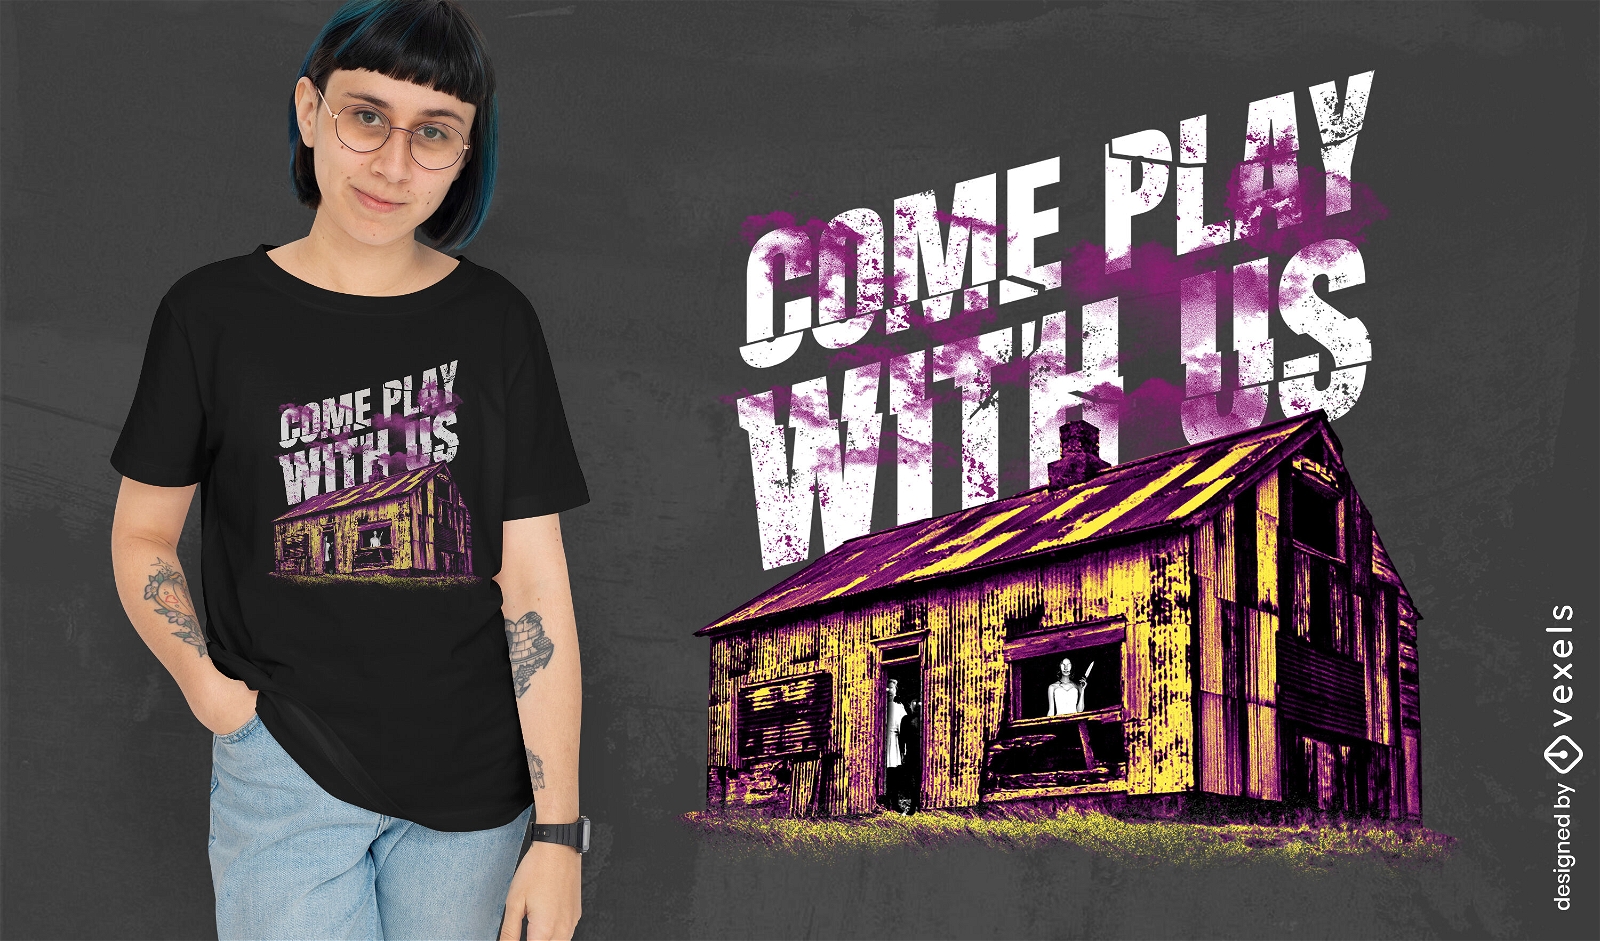
Design de camiseta de casa assombrada de terror
Escolha uma pasta
Todos os favoritos
Criar novo
Salvar
Design de camiseta de casa assombrada de terror
Pronto para imprimir
para Merch
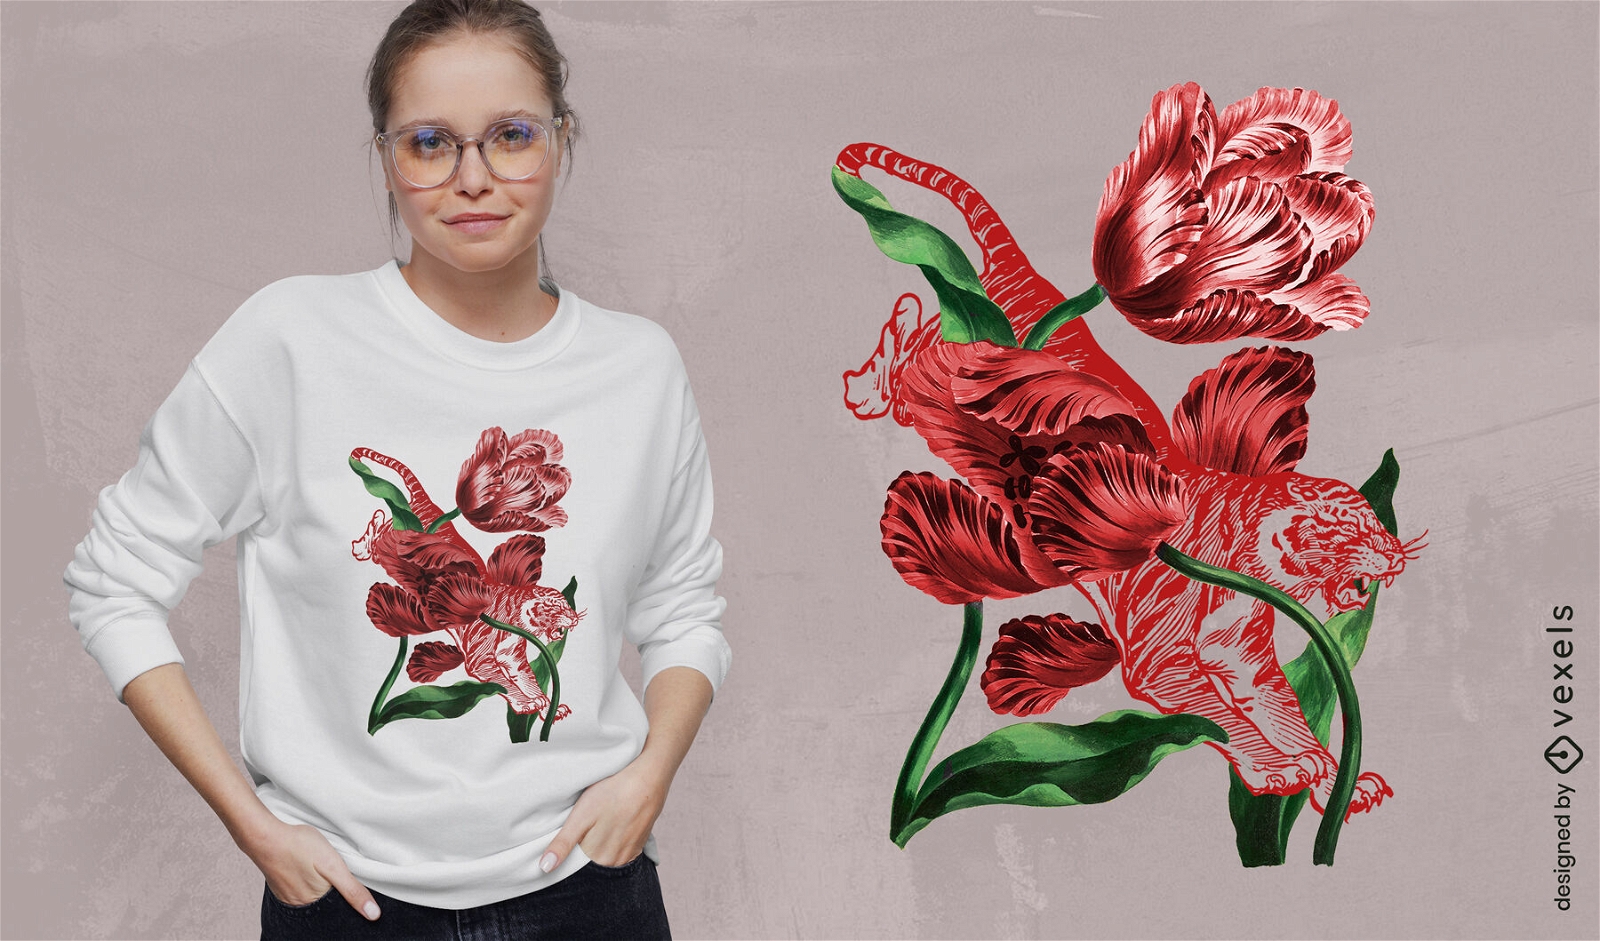
Design de camiseta de flores de tigre e rosa
Escolha uma pasta
Todos os favoritos
Criar novo
Salvar
Design de camiseta de flores de tigre e rosa
Pronto para imprimir
para Merch
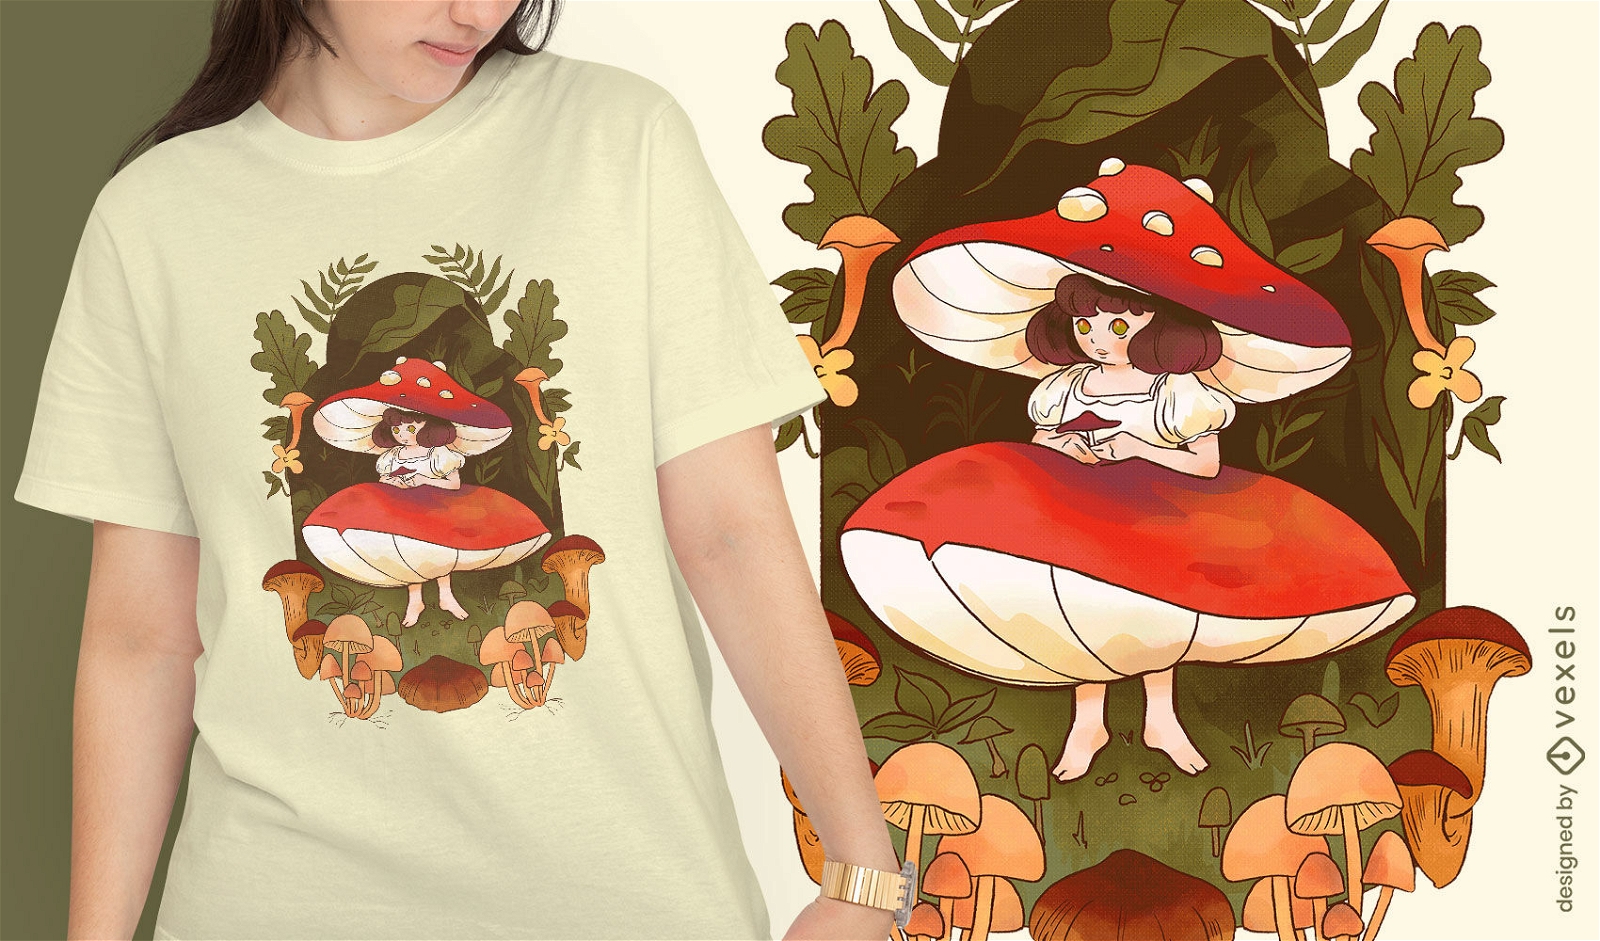
Design de camiseta de fantasia de garota de cogumelo
Escolha uma pasta
Todos os favoritos
Criar novo
Salvar
Design de camiseta de fantasia de garota de cogumelo
Pronto para imprimir
para Merch
Mulher com flores e t-shirt de estátua grega psd
Escolha uma pasta
Todos os favoritos
Criar novo
Salvar
Mulher com flores e t-shirt de estátua grega psd
Pronto para imprimir
para Merch
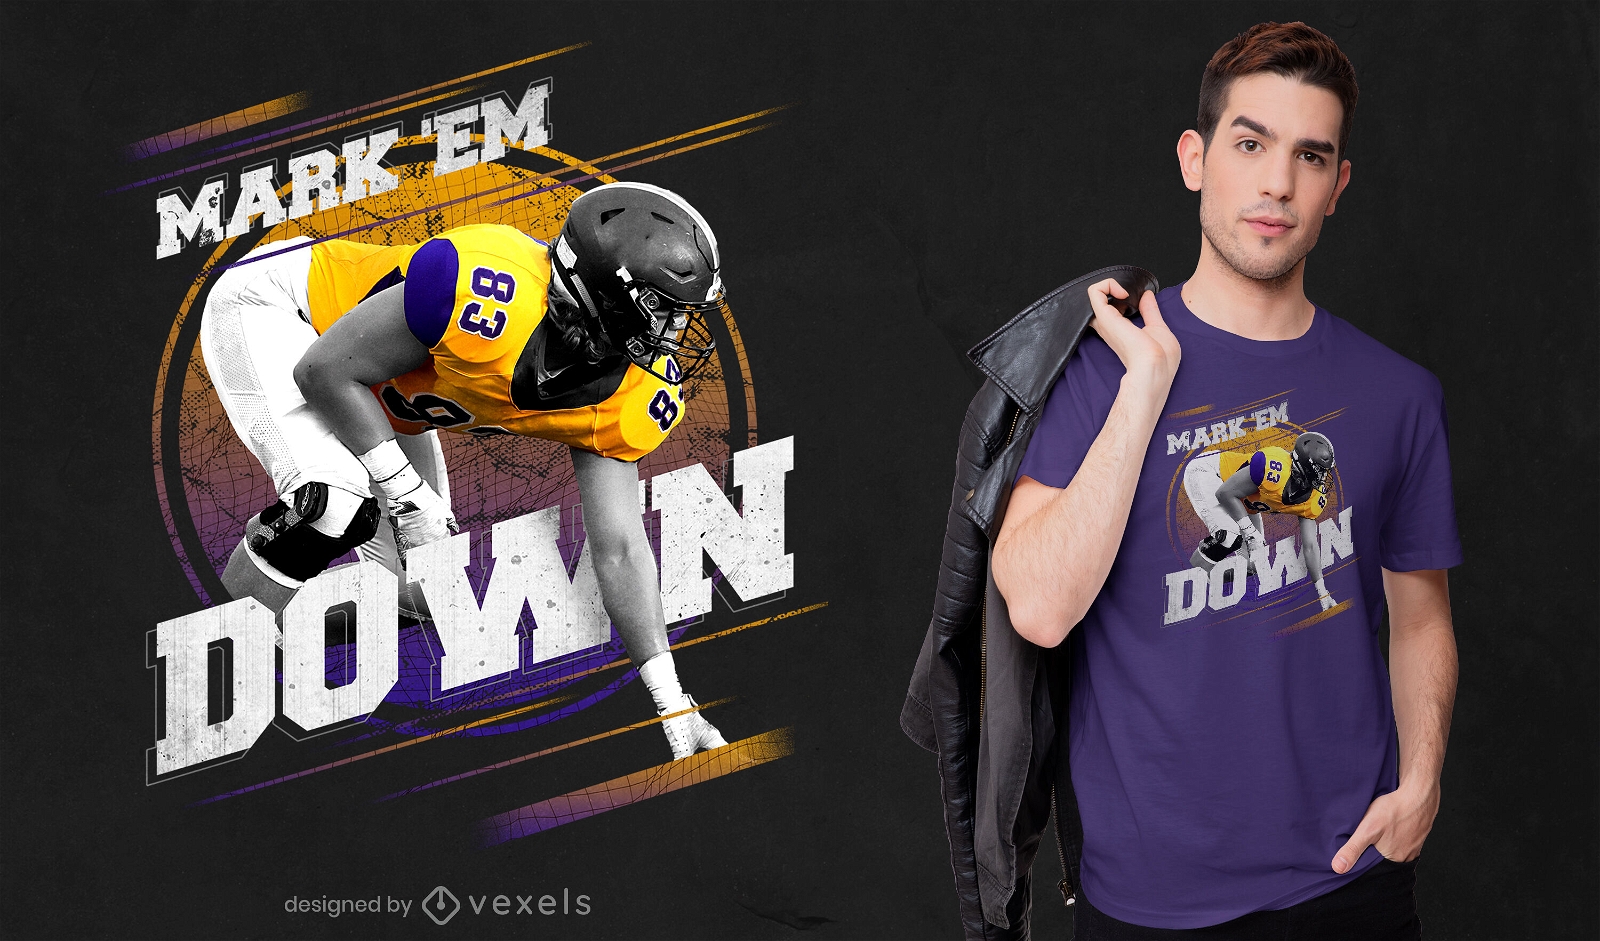
Design de t-shirt psd de futebol americano
Escolha uma pasta
Todos os favoritos
Criar novo
Salvar
Design de t-shirt psd de futebol americano
Pronto para imprimir
para Merch
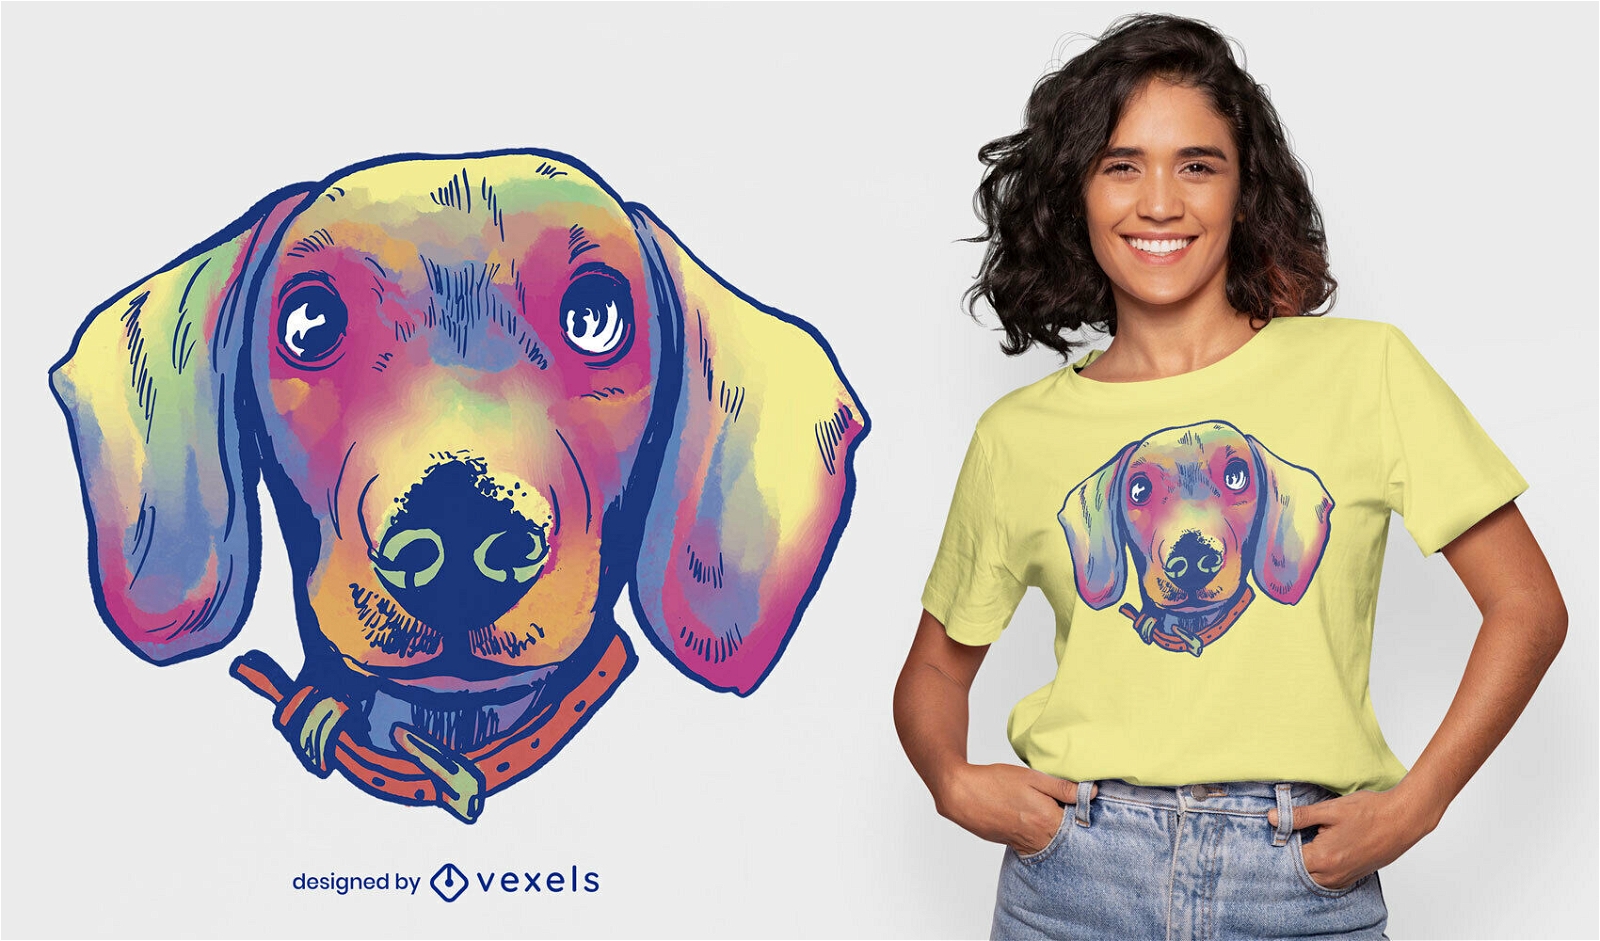
Desenho de camiseta em aquarela daschund com rosto de cachorro psd
Escolha uma pasta
Todos os favoritos
Criar novo
Salvar
Desenho de camiseta em aquarela daschund com rosto de cachorro psd
Pronto para imprimir
para Merch
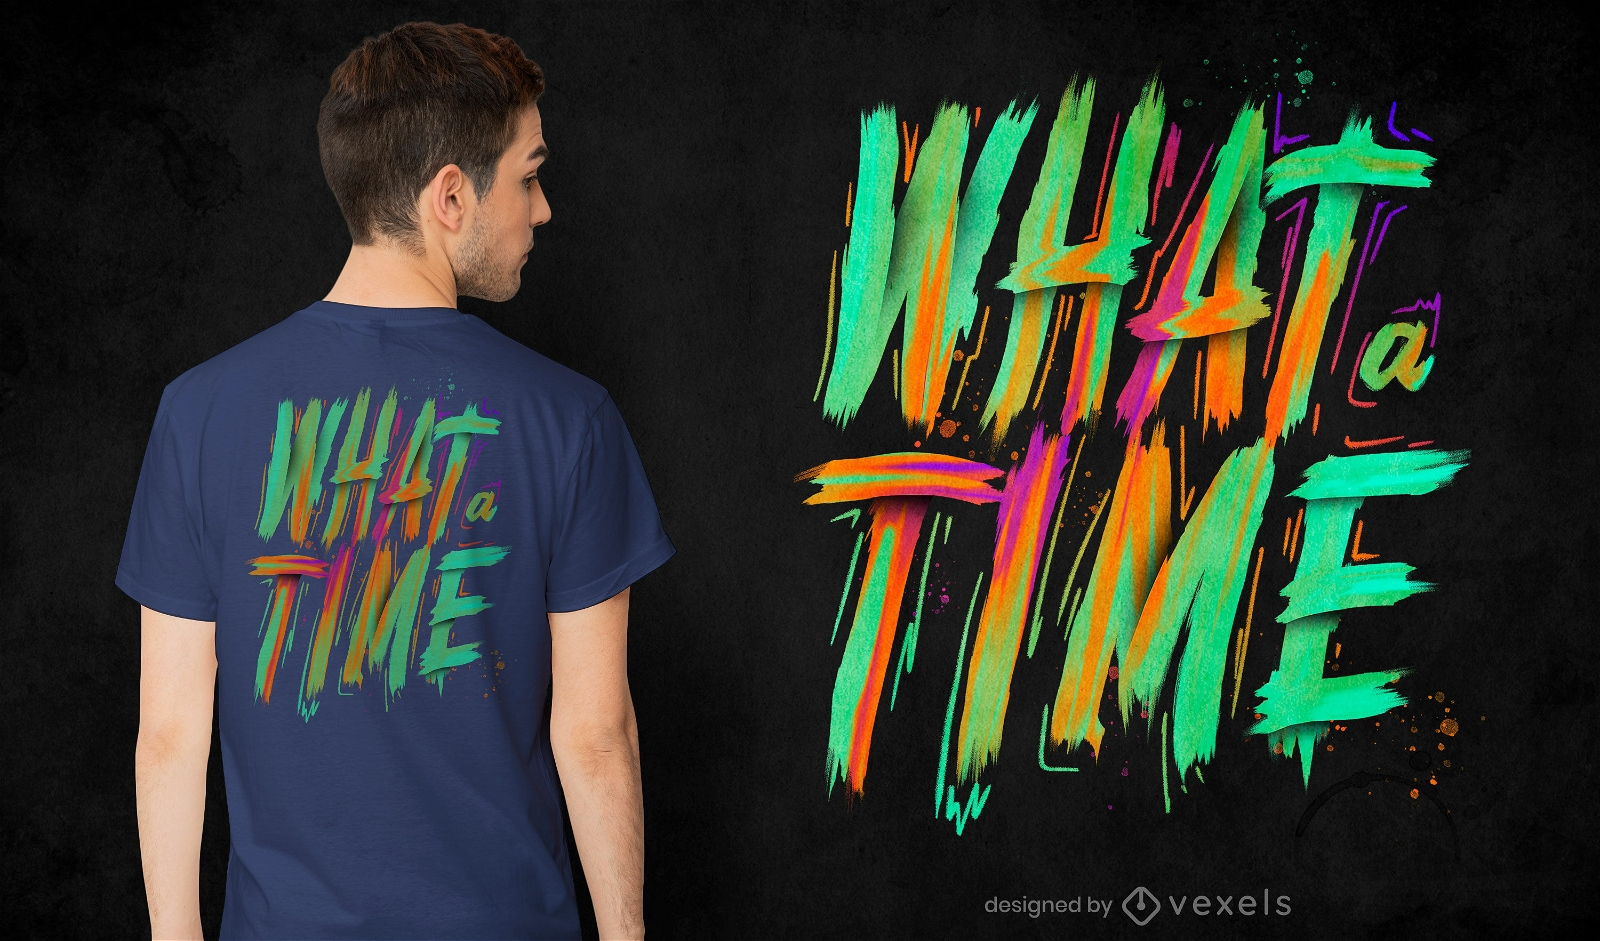
Que hora pincel lettering design de camiseta psd
Escolha uma pasta
Todos os favoritos
Criar novo
Salvar
Que hora pincel lettering design de camiseta psd
Camiseta PSD escalável
para Merch
Artigos de desporto t-shirt escalável psd
Escolha uma pasta
Todos os favoritos
Criar novo
Salvar
Artigos de desporto t-shirt escalável psd
Camiseta PSD escalável
para Merch
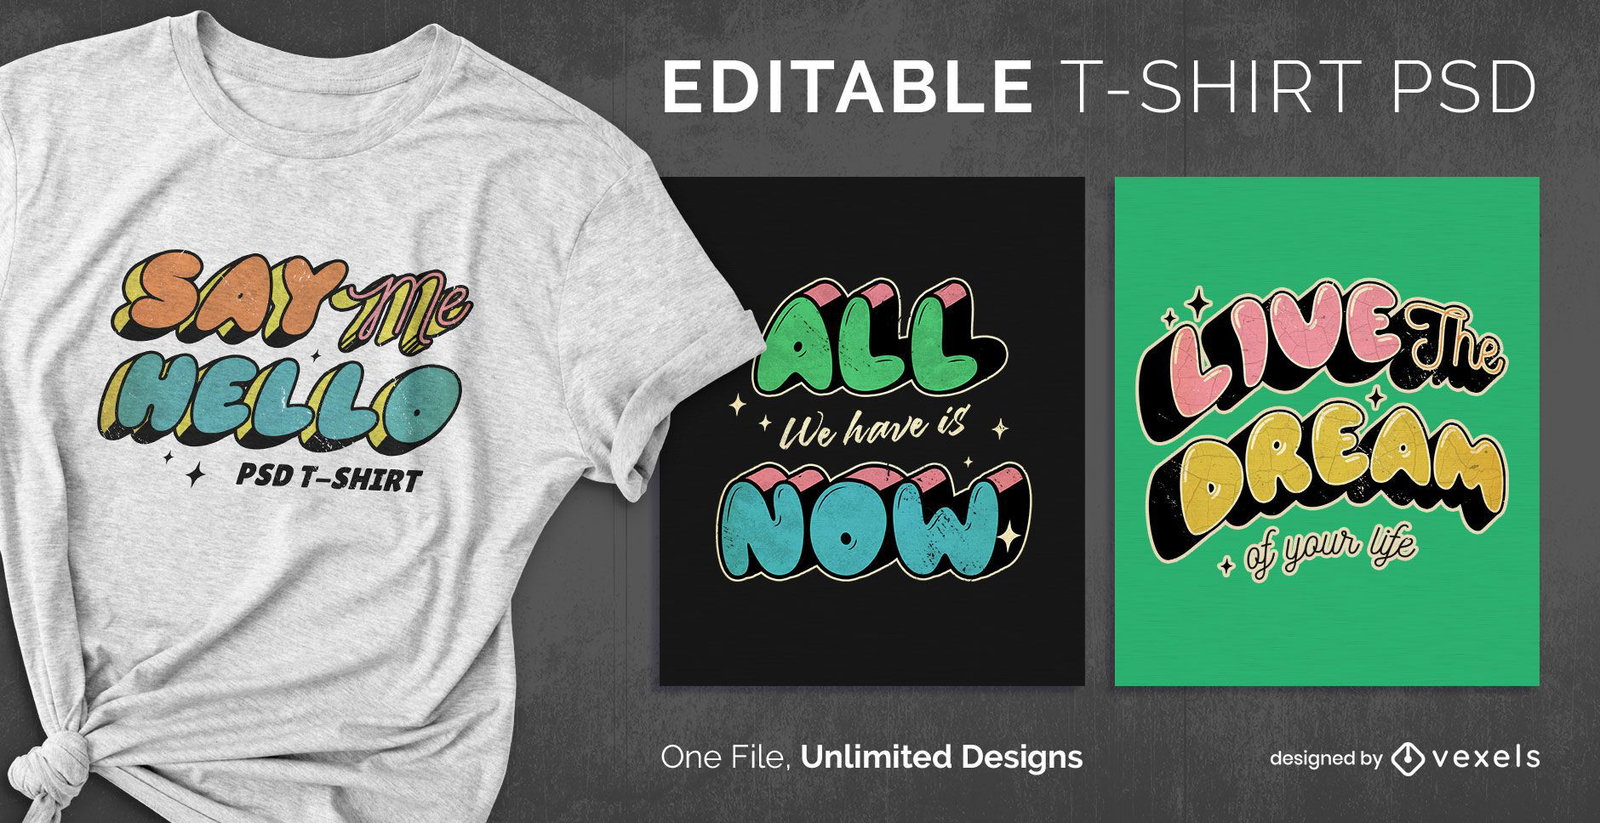
T-shirt escalável de texto retrô Bubble 3D PSD
Escolha uma pasta
Todos os favoritos
Criar novo
Salvar
T-shirt escalável de texto retrô Bubble 3D PSD
Camiseta PSD escalável
para Merch
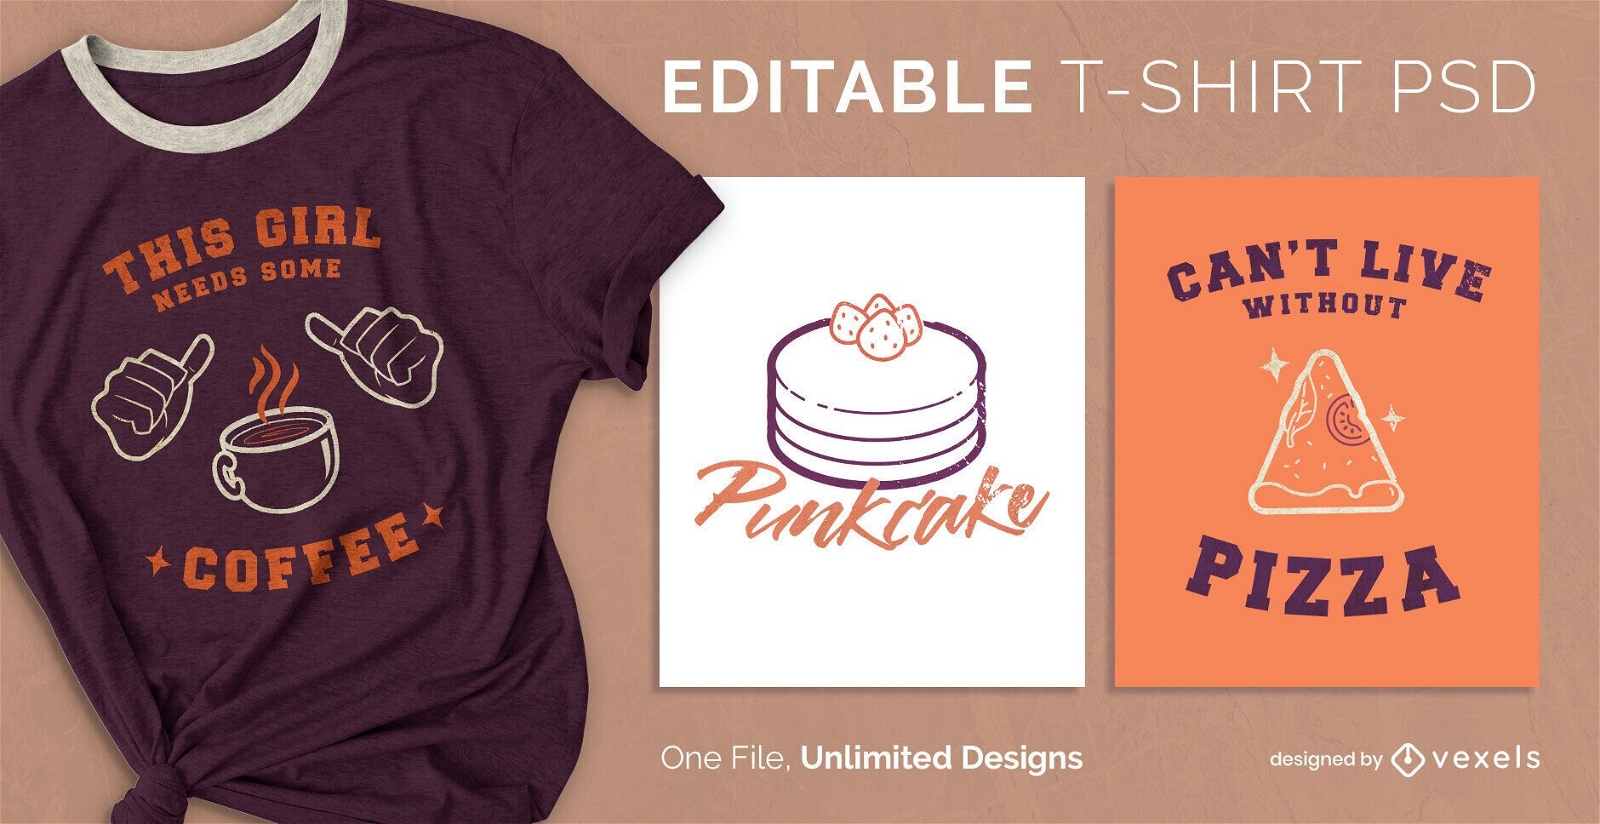
T-shirt alimentar escalável psd
Escolha uma pasta
Todos os favoritos
Criar novo
Salvar
T-shirt alimentar escalável psd
Camiseta PSD escalável
para Merch
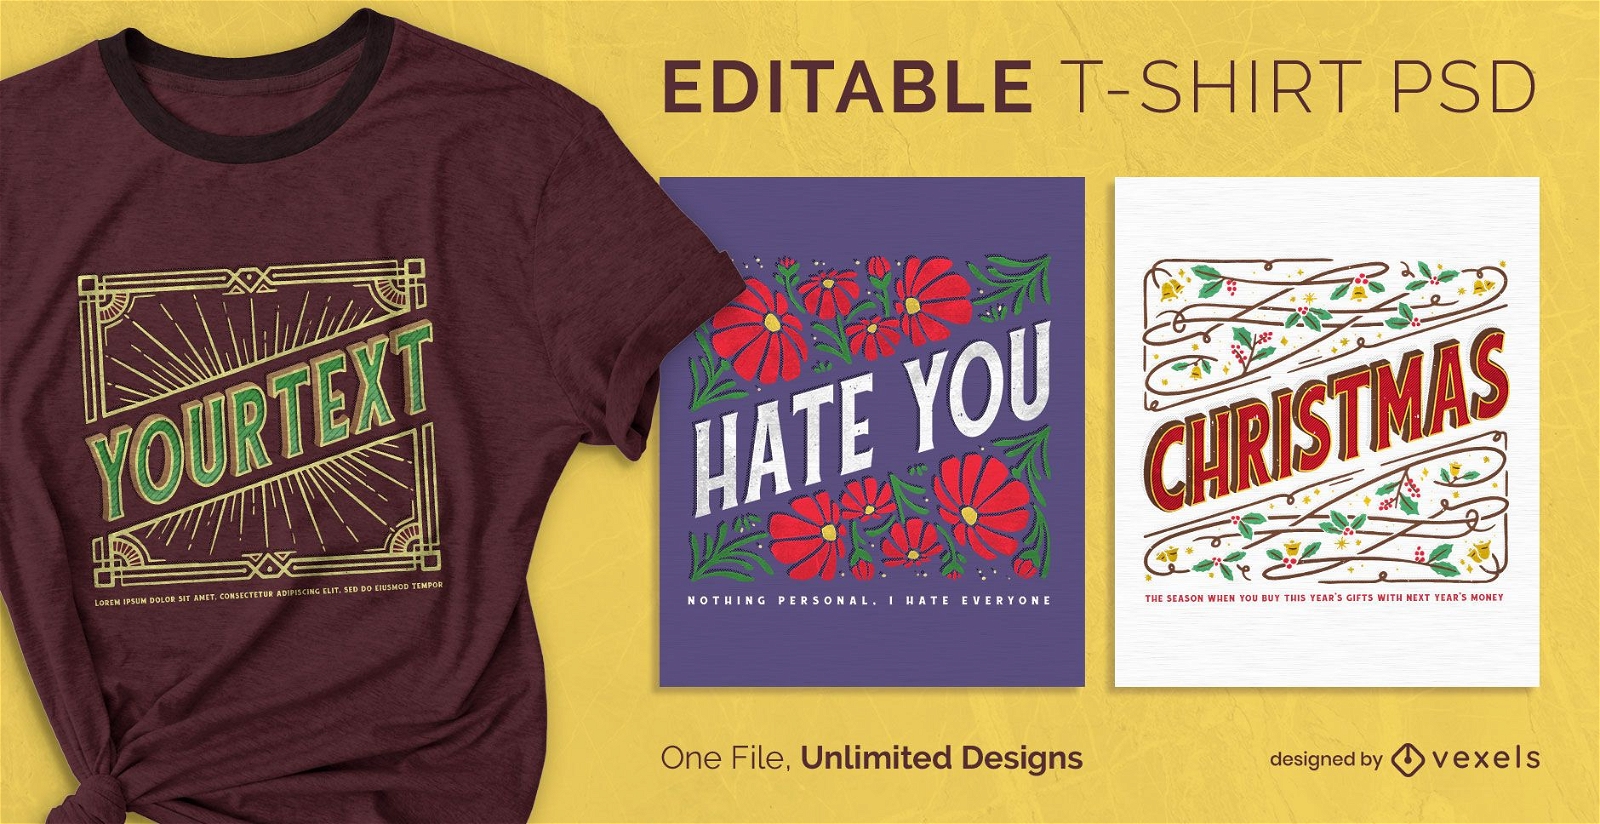
T-shirt escalonável com moldura vintage psd
Escolha uma pasta
Todos os favoritos
Criar novo
Salvar
T-shirt escalonável com moldura vintage psd
Pronto para imprimir
para Merch
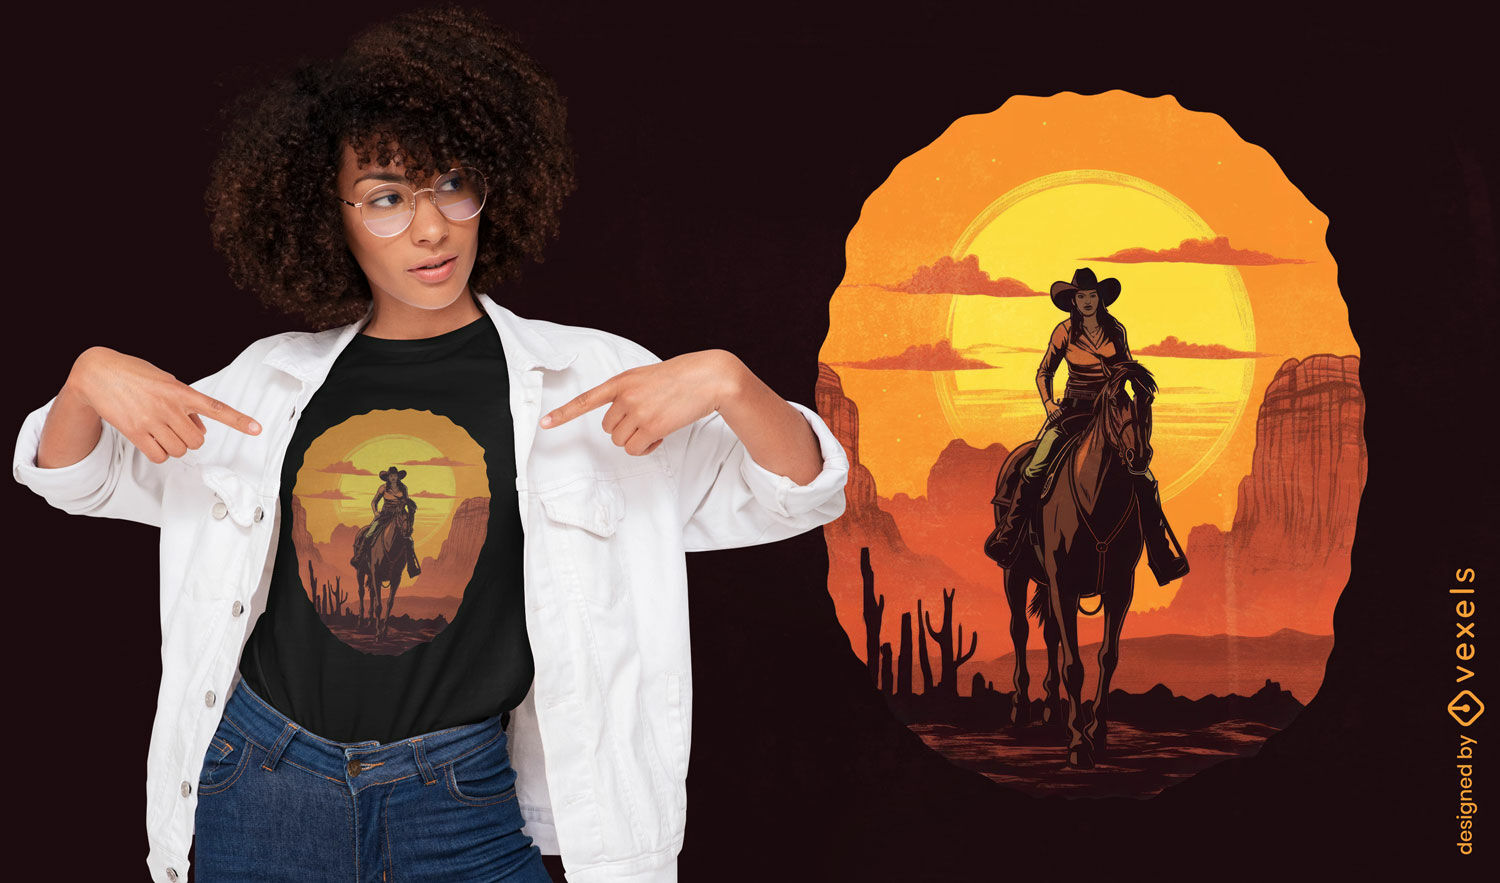
Design de camiseta com cavalo e pôr do sol de vaqueira
Escolha uma pasta
Todos os favoritos
Criar novo
Salvar
Design de camiseta com cavalo e pôr do sol de vaqueira
Pronto para imprimir
para Merch
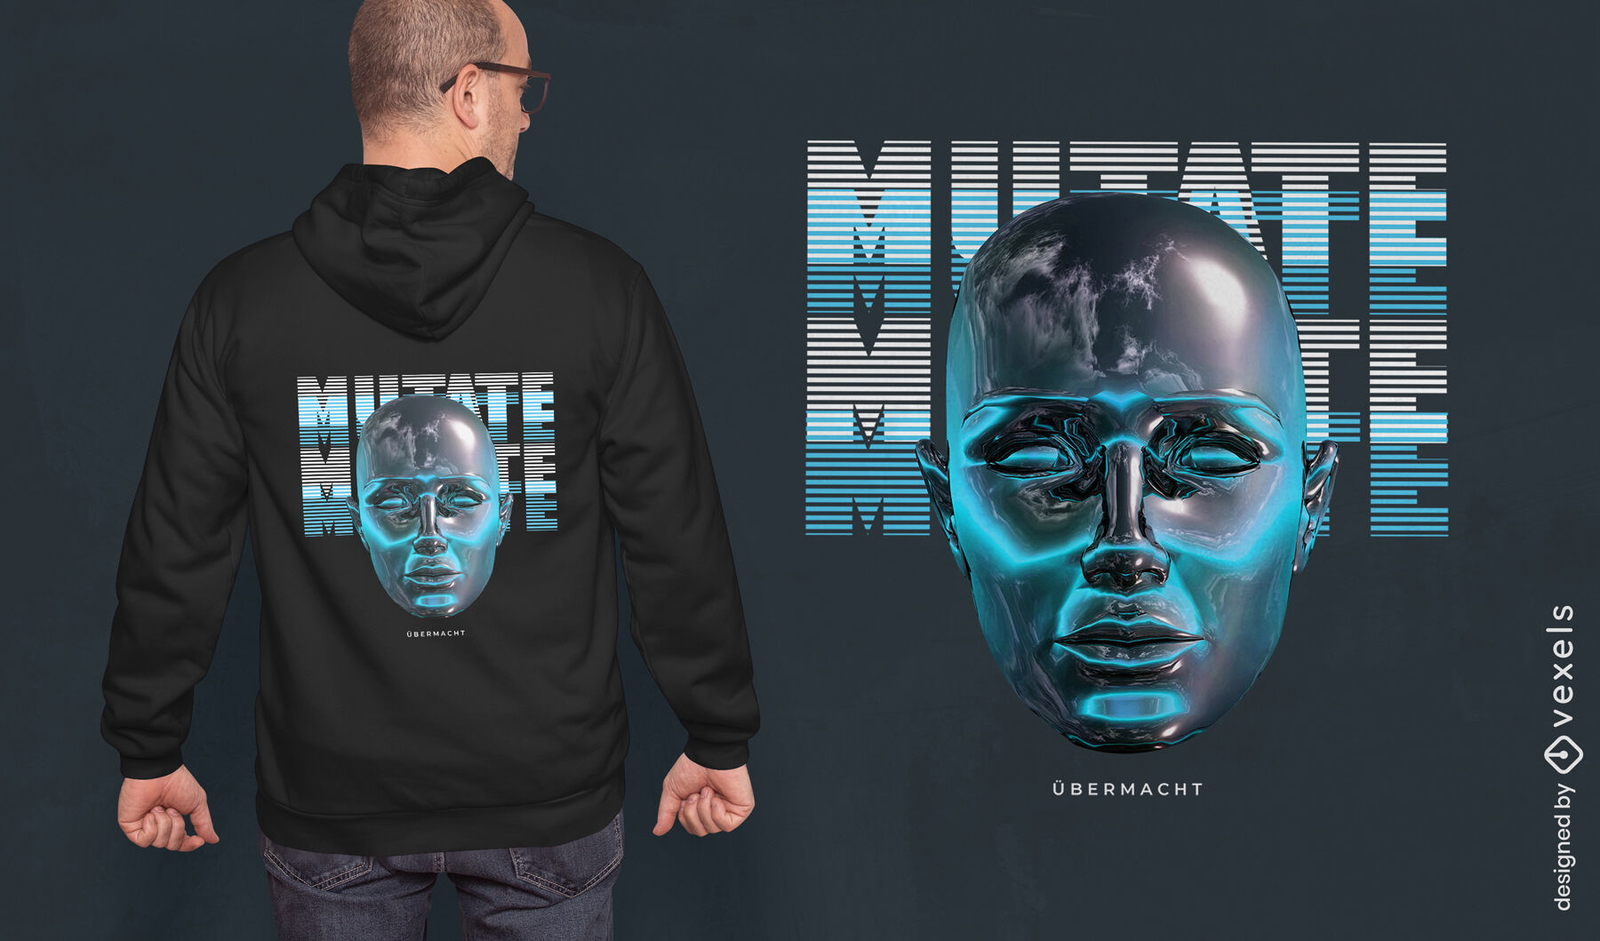
Design de t-shirt PSD cabeça futurista
Escolha uma pasta
Todos os favoritos
Criar novo
Salvar
Design de t-shirt PSD cabeça futurista
Pronto para imprimir
para Merch
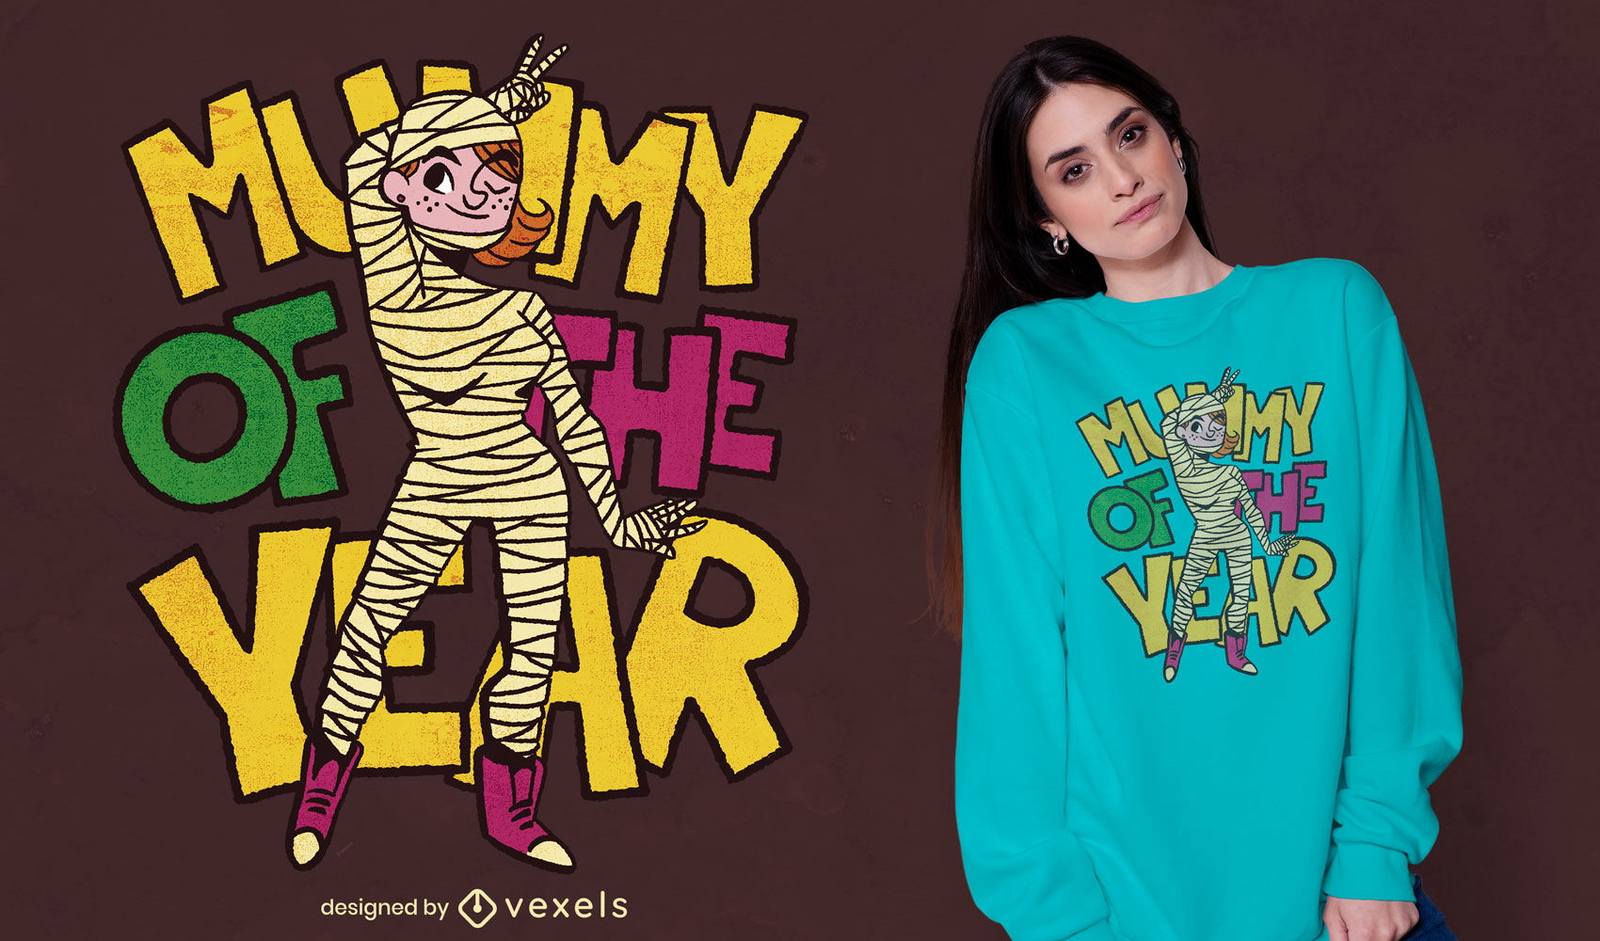
Design de t-shirt psd mãe mamãe
Escolha uma pasta
Todos os favoritos
Criar novo
Salvar
Design de t-shirt psd mãe mamãe
Pronto para imprimir
para Merch
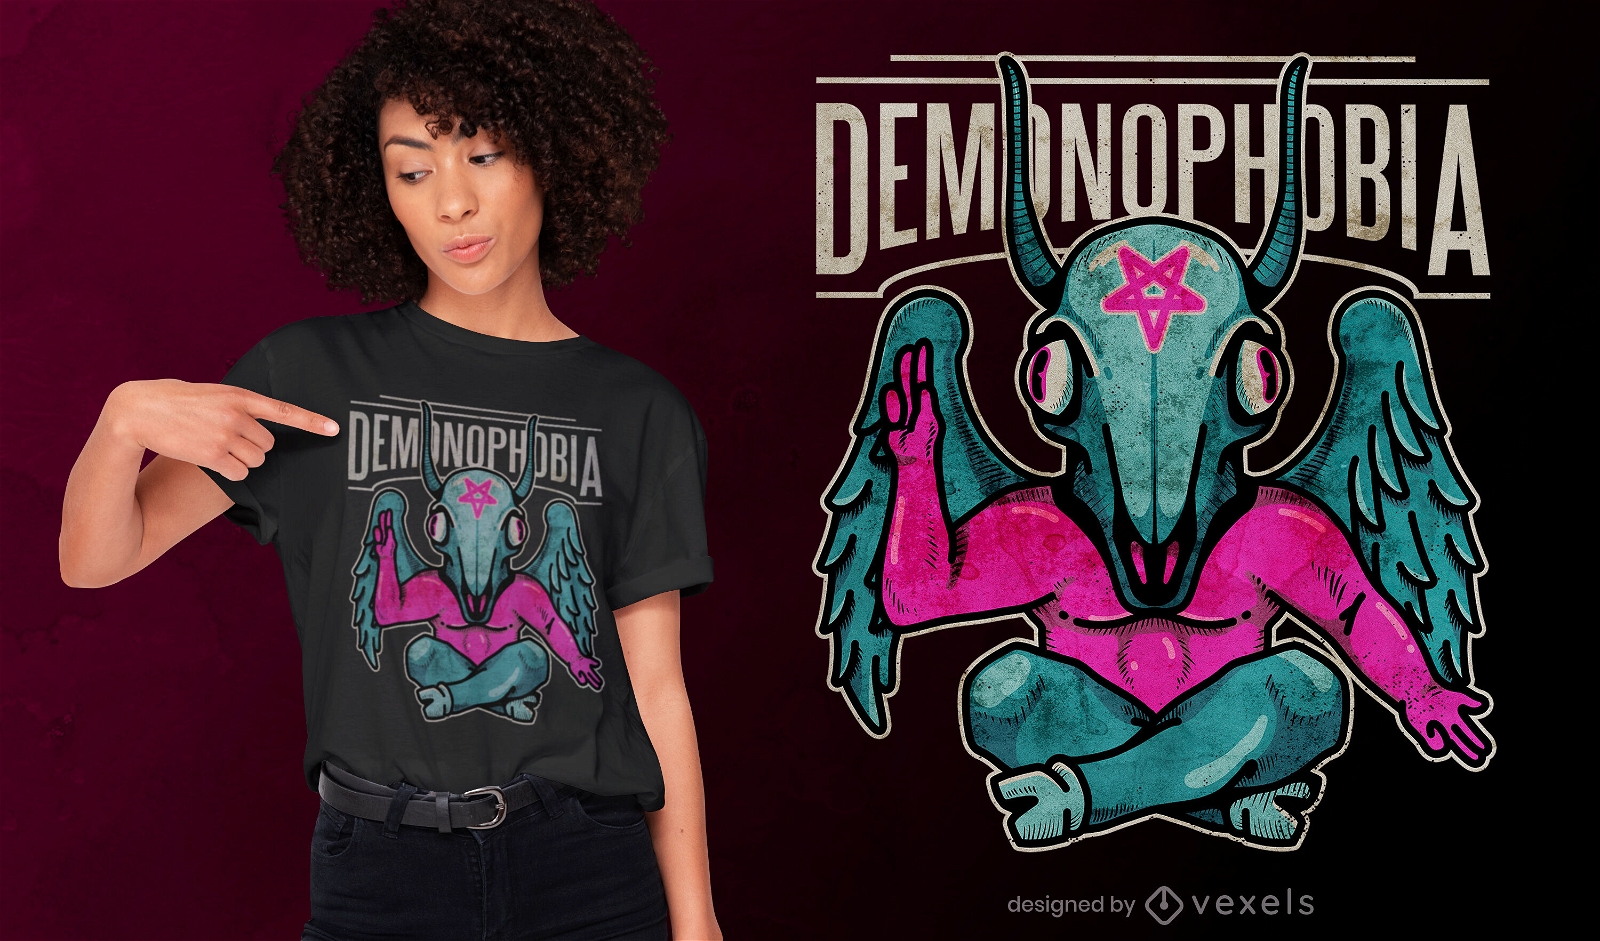
Design de camiseta Demonophobia psd
Escolha uma pasta
Todos os favoritos
Criar novo
Salvar
Design de camiseta Demonophobia psd
Pronto para imprimir
para Merch
Design de t-shirt psd com colagem de texto em japonês e menina
Escolha uma pasta
Todos os favoritos
Criar novo
Salvar
Design de t-shirt psd com colagem de texto em japonês e menina
Camiseta PSD escalável
para Merch
Corte de papel paisagem escalável t-shirt psd
Escolha uma pasta
Todos os favoritos
Criar novo
Salvar
Corte de papel paisagem escalável t-shirt psd
Camiseta PSD escalável
para Merch
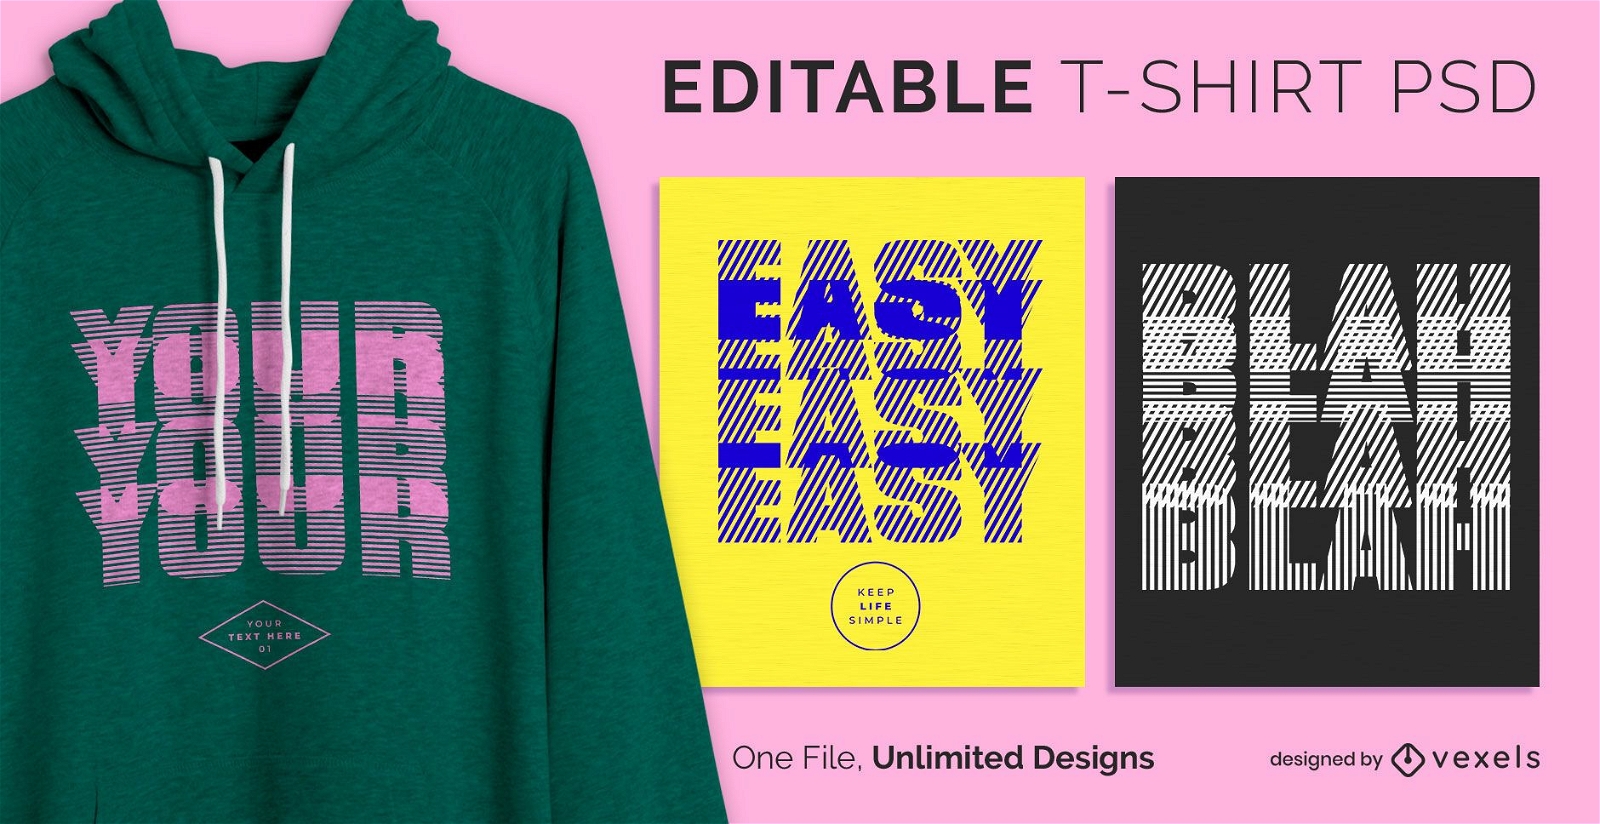
Texto desfocado escalável t-shirt psd
Escolha uma pasta
Todos os favoritos
Criar novo
Salvar
Texto desfocado escalável t-shirt psd
Camiseta PSD escalável
para Merch
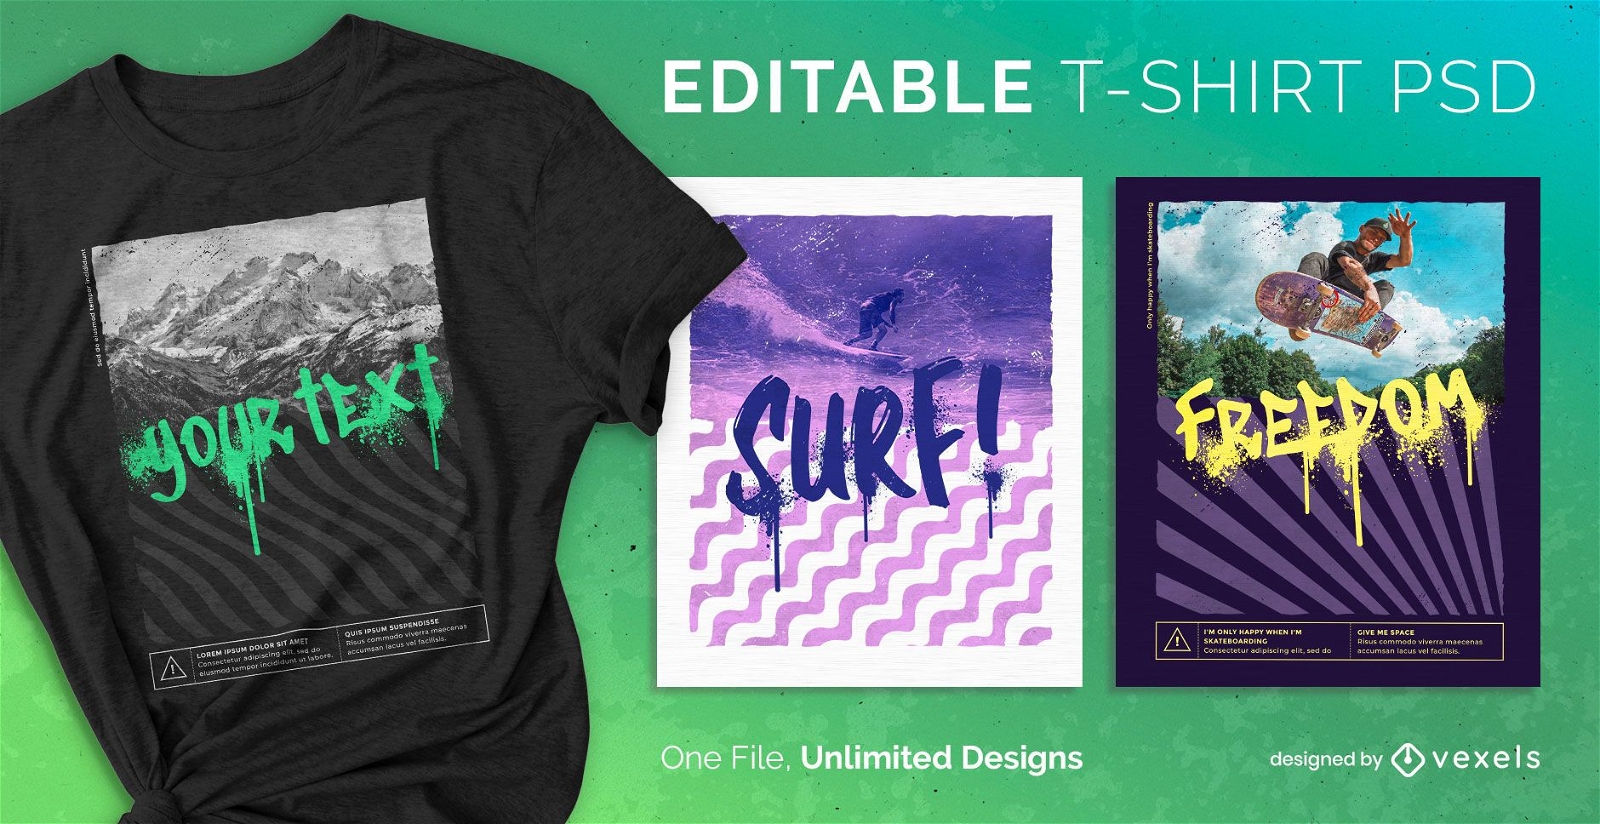
T-shirt escalonável com tinta spray psd
Escolha uma pasta
Todos os favoritos
Criar novo
Salvar
T-shirt escalonável com tinta spray psd
Camiseta PSD escalável
para Merch
T-shirt escalonável com texto curvo psd
Escolha uma pasta
Todos os favoritos
Criar novo
Salvar
T-shirt escalonável com texto curvo psd
Impulsione seu negócio
Com a plataforma gráfica líder de mercado.
Ver planos
Próxima
do 67
prev page
next page