Biblioteca de design
Novos designs Merch
Camisetas
Vectores
Designs de Merch de Tendência
PNGs & SVGs
Mockups
Modelos de T-Shirt PSD
Explorar Desenhos
Designs KDP
Pôsteres
Canecas
Capas para celular
Sacos de compras
Almofadas
Ferramentas de desenho
Merch Designer
Novo!
Mockup Generator
Gerador de Design de AI
Vetorizador
Quote Generator
T-Shirt Maker (Antigo)
Ajuda
Merch Digest
Blog
Centro de Ajuda
Saiba mais sobre o Merch
Feedback
Soluções Corporativas
Empresa
Acesso à API
Estúdio de Design
Design em Lote
Preços
Carregando...
Inscrever-se
Conecte-se
Merch Vectors
graficos
Biblioteca de design
Novos designs Merch
Camisetas
Vectores
Designs de Merch de Tendência
PNGs & SVGs
Mockups
Modelos de T-Shirt PSD
Explorar Desenhos
Designs KDP
Pôsteres
Canecas
Capas para celular
Sacos de compras
Almofadas
Ferramentas de desenho
Merch Designer
Novo!
Mockup Generator
Gerador de Design de AI
Vetorizador
Quote Generator
T-Shirt Maker (Antigo)
Ajuda
Merch Digest
Blog
Centro de Ajuda
Saiba mais sobre o Merch
Feedback
Soluções Corporativas
Empresa
Acesso à API
Estúdio de Design
Design em Lote
PLANOS
Merch Vectors
graficos
27291 Designs Vetoriais de graficos para Camisetas e Merch
Baixar e comprar Designs Vetoriais AI de graficos para Camisetas, Capas do Celular, Capas do Livros e outros produtos Merch
Relacionado:
graficos vetoriais
,
desenhos graficos de ações
,
graficos tridimensionais
Ordenar por
Mais relevante
Resultados patrocinados da
Ganhe 15% de desconto com o código: VEXELS15
veja mais detalhes
Gerado por IA, selecionado por nossos designers.
para Merch
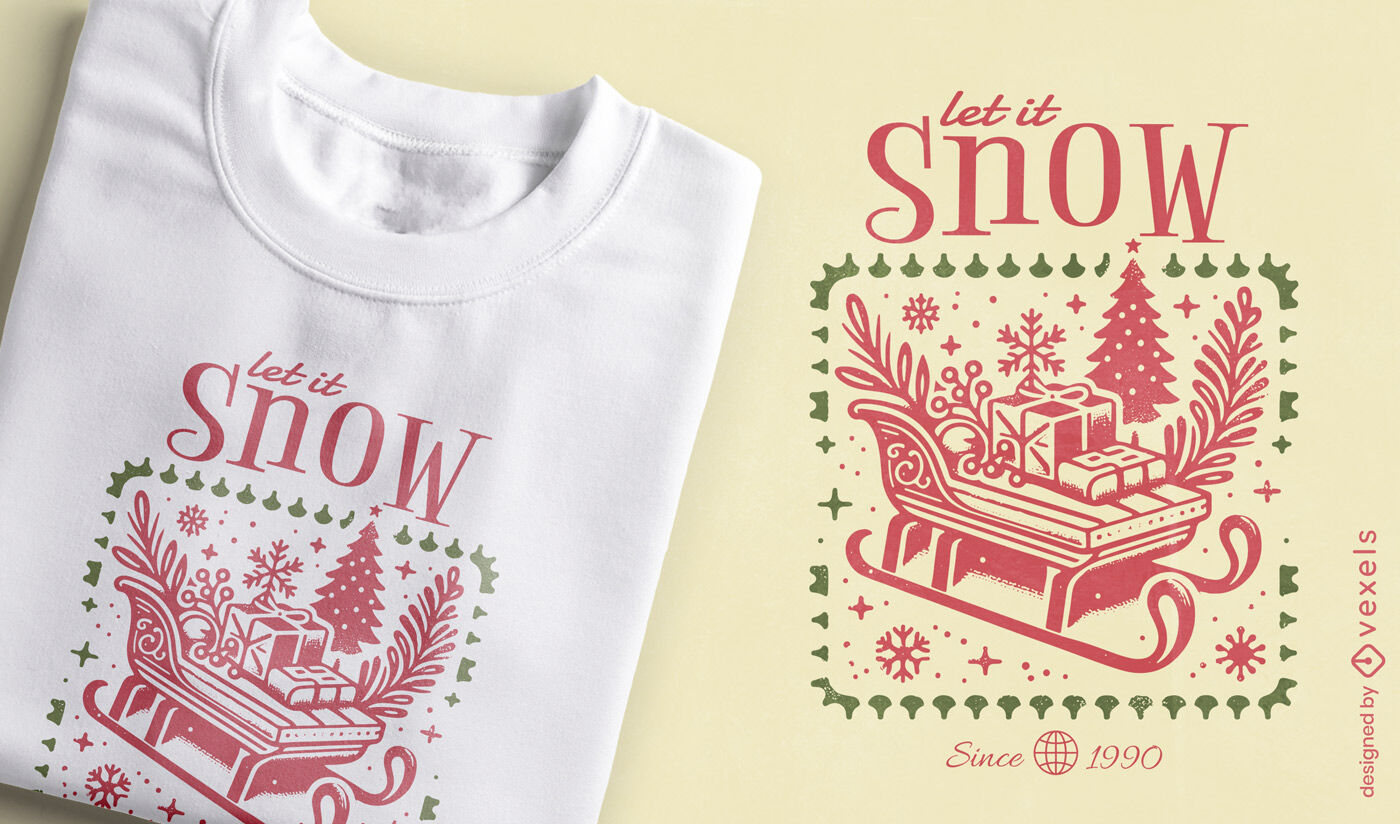
Design de camiseta de Natal "Deixe nevar"
Escolha uma pasta
Todos os favoritos
Criar novo
Salvar
Design de camiseta de Natal "Deixe nevar"
Gerado por IA, selecionado por nossos designers.
para Merch
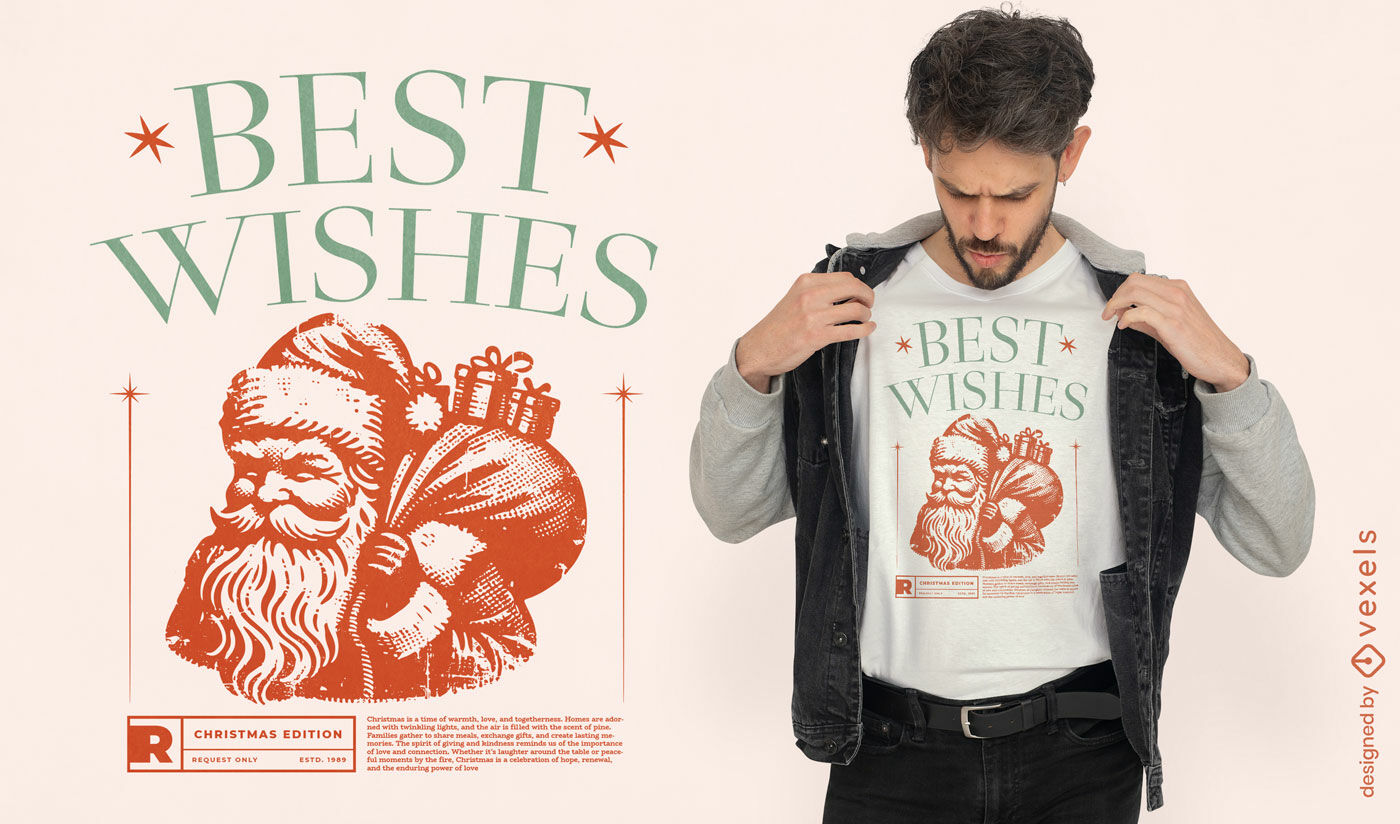
Design de camiseta vintage com os melhores desejos do Papai Noel
Escolha uma pasta
Todos os favoritos
Criar novo
Salvar
Design de camiseta vintage com os melhores desejos do Papai Noel
Pronto para imprimir
para Merch
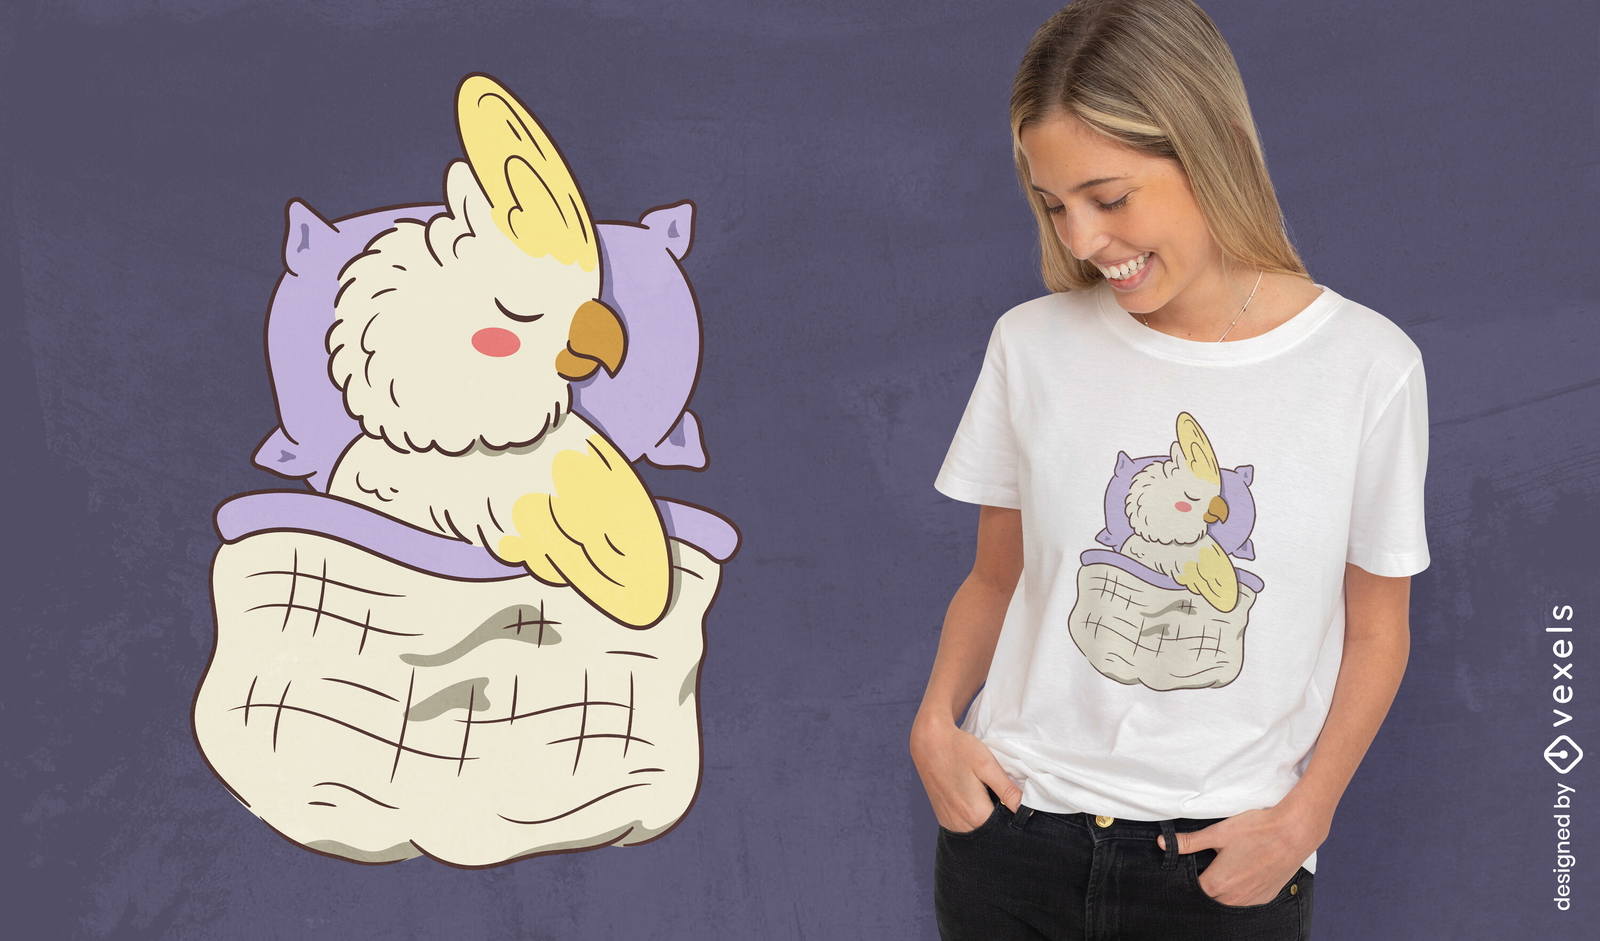
Design de camiseta com calopsita sonolenta na cama
Escolha uma pasta
Todos os favoritos
Criar novo
Salvar
Design de camiseta com calopsita sonolenta na cama
texto editável
Pronto para imprimir
para Merch
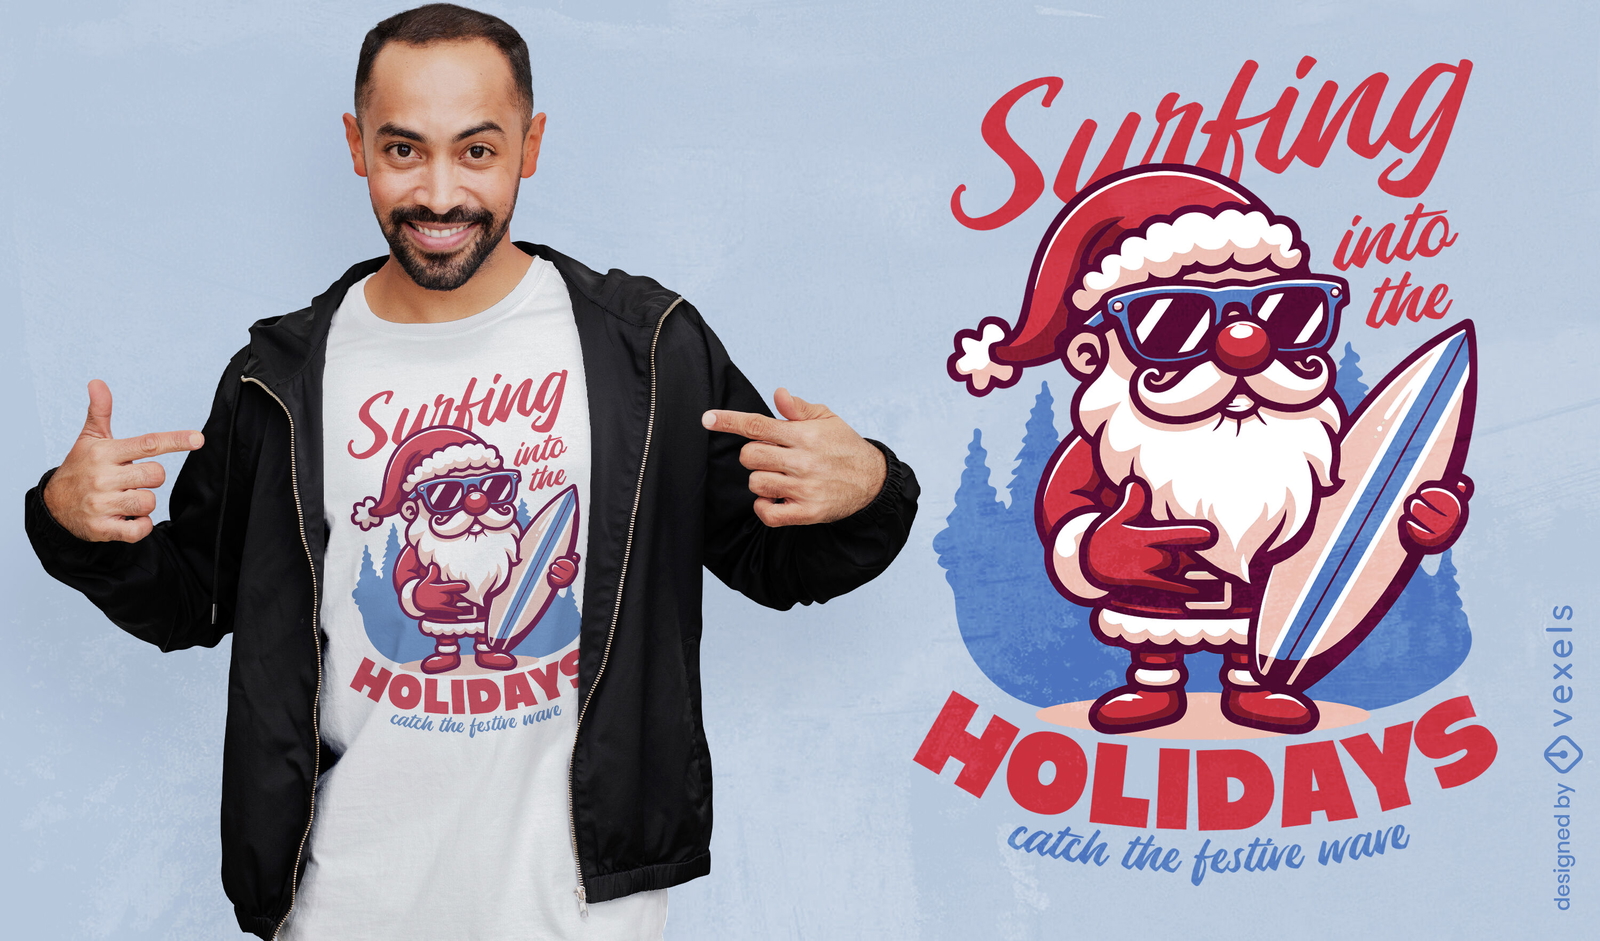
Design de camiseta "Surfing into the Holidays"
Escolha uma pasta
Todos os favoritos
Criar novo
Salvar
Design de camiseta "Surfing into the Holidays"
texto editável
Pronto para imprimir
para Merch
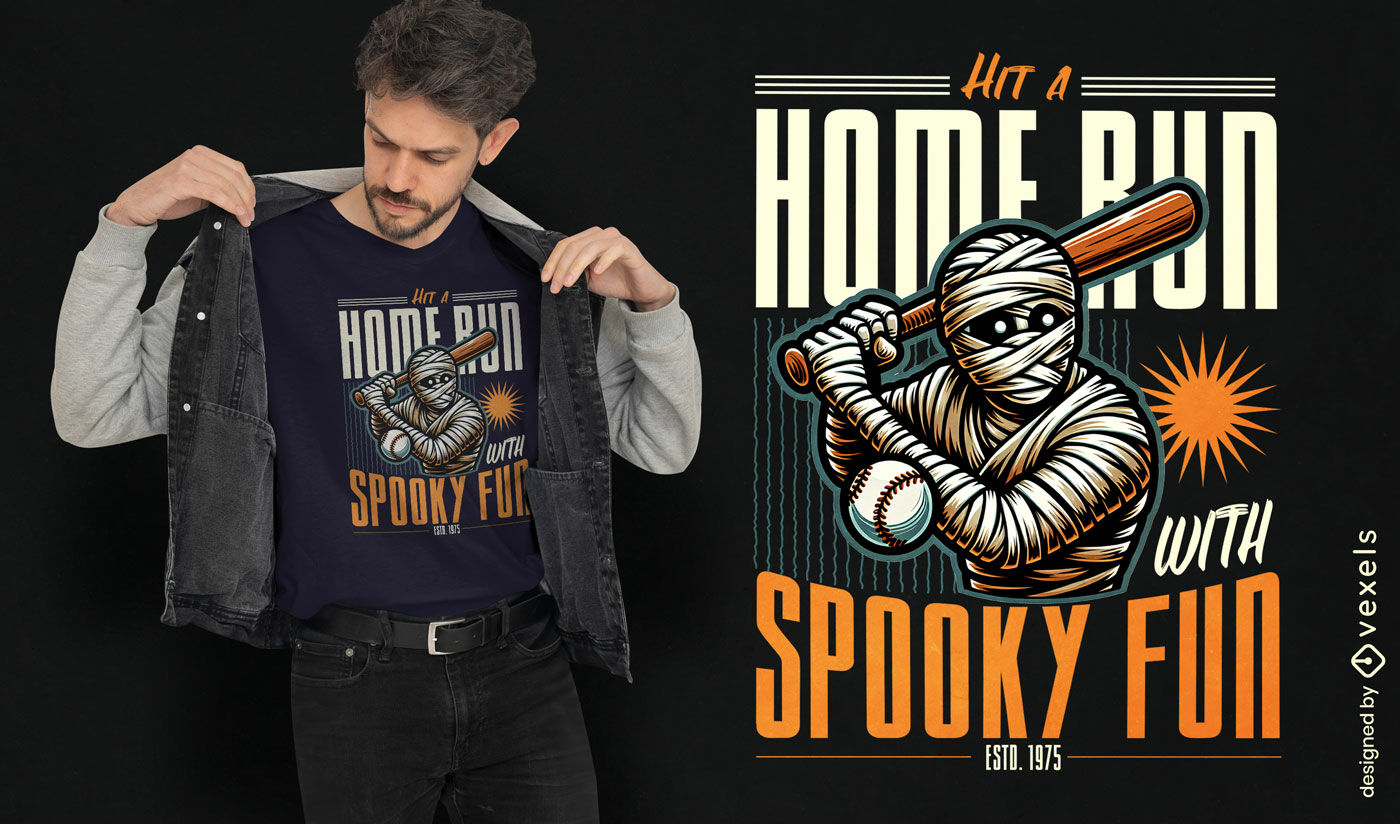
Design de camiseta de múmia de beisebol assustadora
Escolha uma pasta
Todos os favoritos
Criar novo
Salvar
Design de camiseta de múmia de beisebol assustadora
texto editável
Pronto para imprimir
para Merch
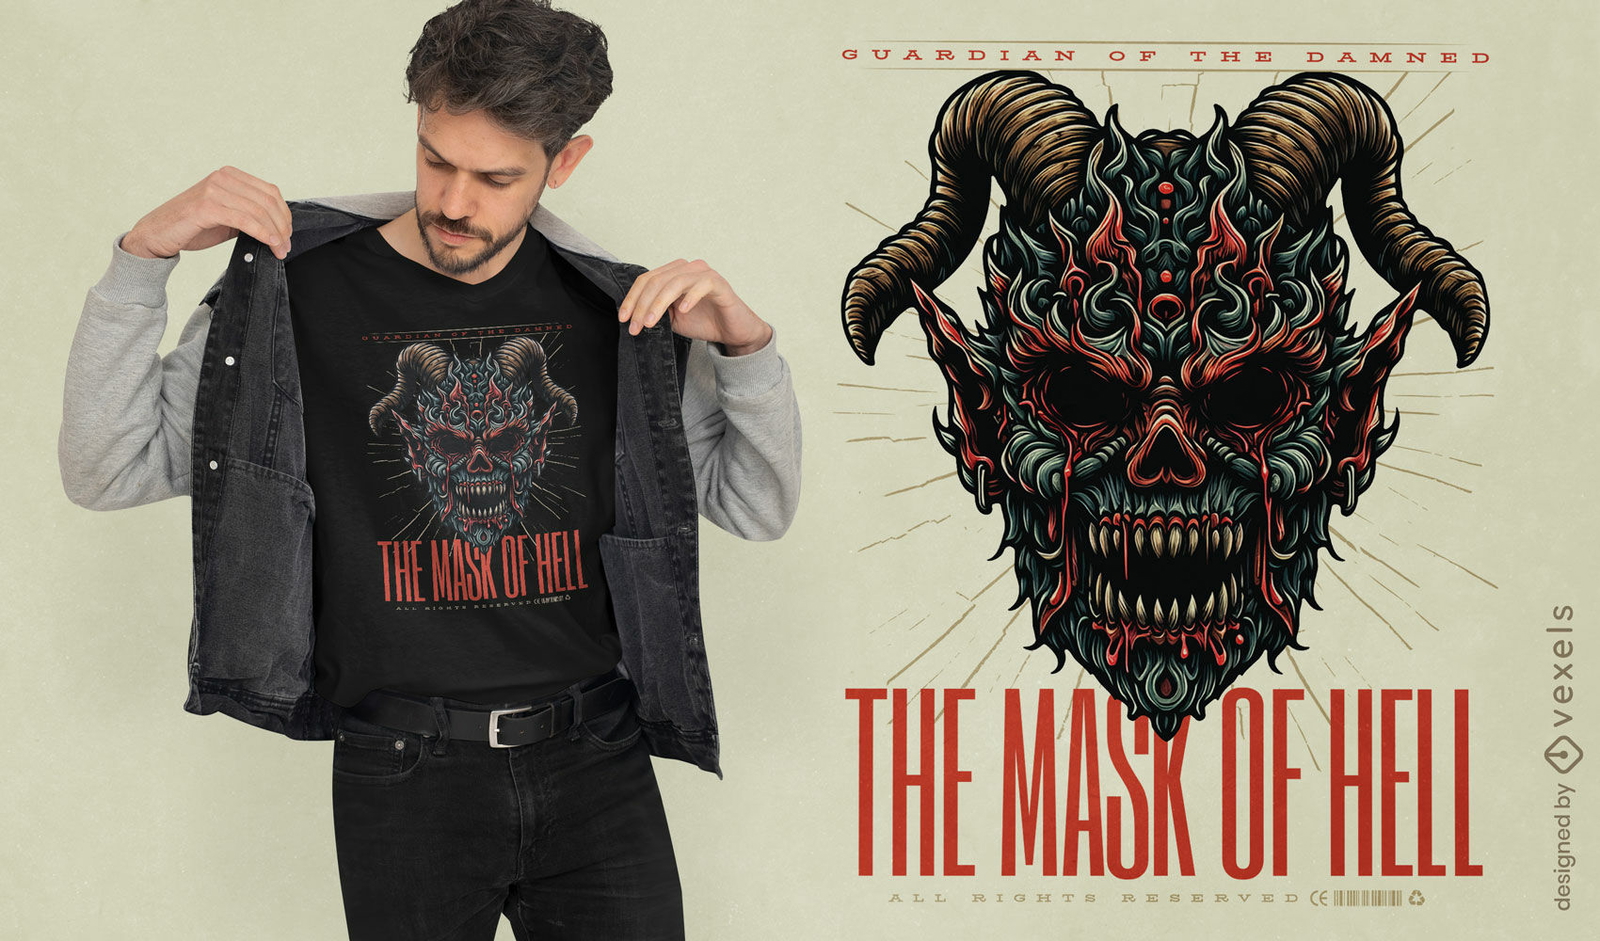
Design de camiseta com a máscara do monstro do inferno
Escolha uma pasta
Todos os favoritos
Criar novo
Salvar
Design de camiseta com a máscara do monstro do inferno
Gerado por IA, selecionado por nossos designers.
para Merch
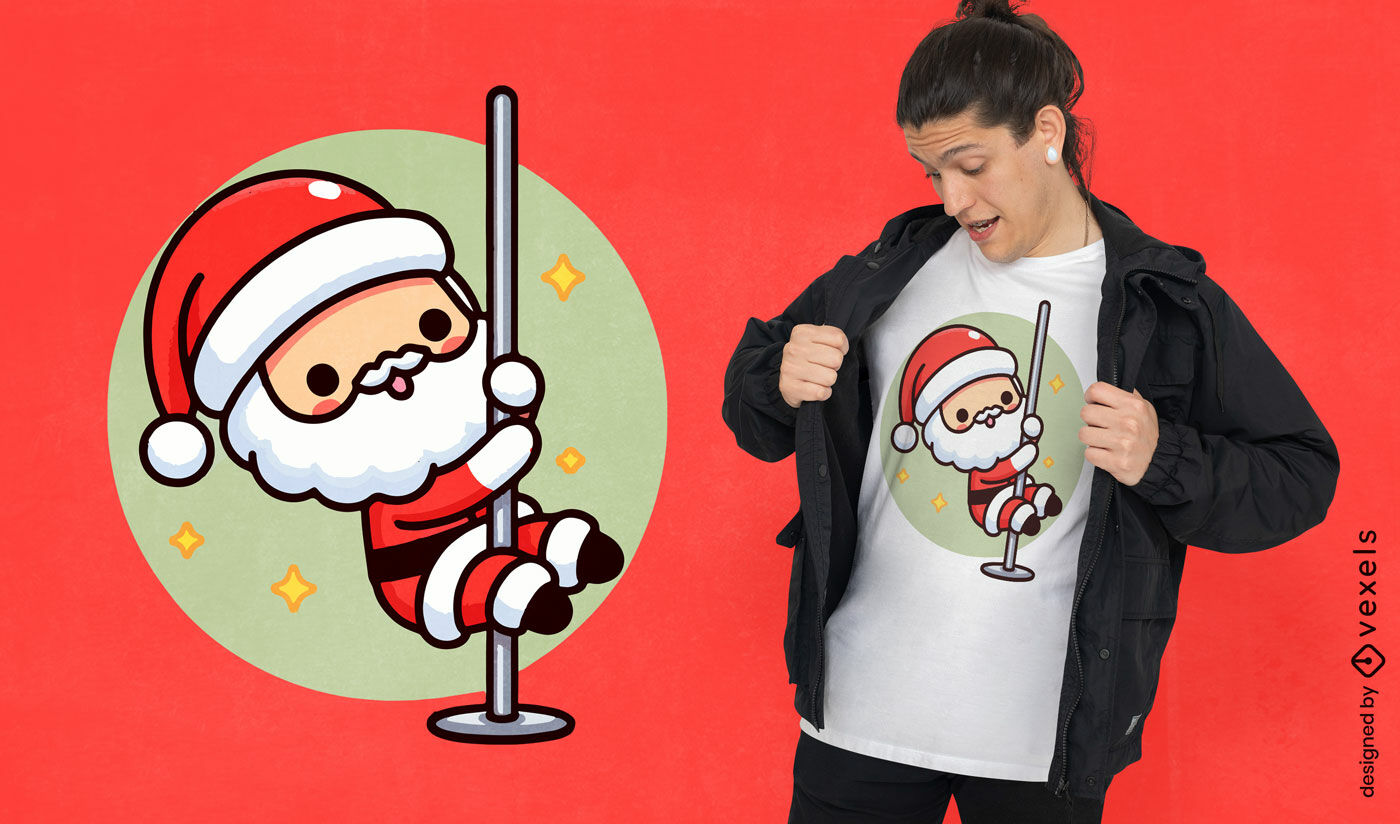
Design de camiseta dançando no poste do Papai Noel
Escolha uma pasta
Todos os favoritos
Criar novo
Salvar
Design de camiseta dançando no poste do Papai Noel
Pronto para imprimir
para Merch
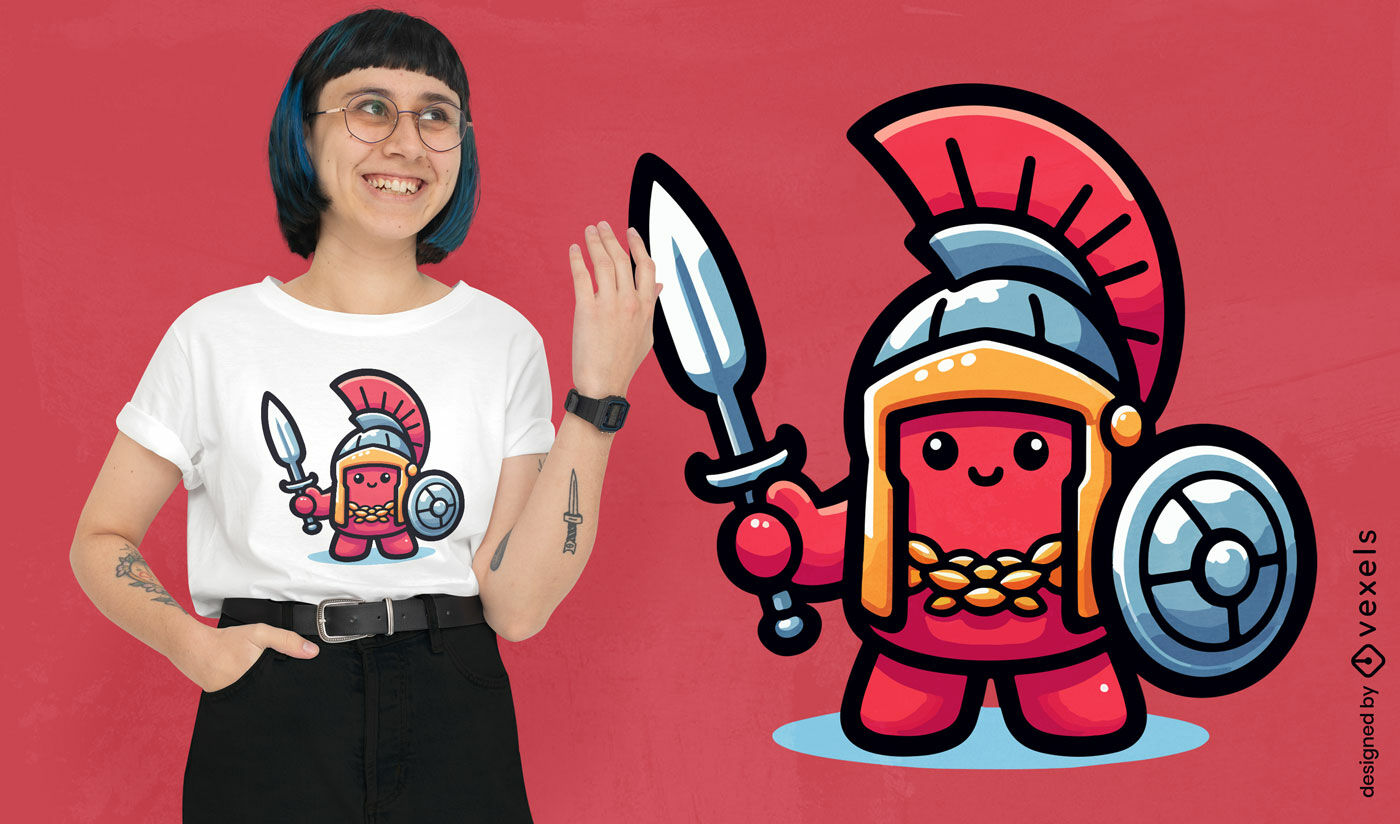
Design fofo de camiseta meeple de guerreiro romano
Escolha uma pasta
Todos os favoritos
Criar novo
Salvar
Design fofo de camiseta meeple de guerreiro romano
texto editável
Pronto para imprimir
para Merch
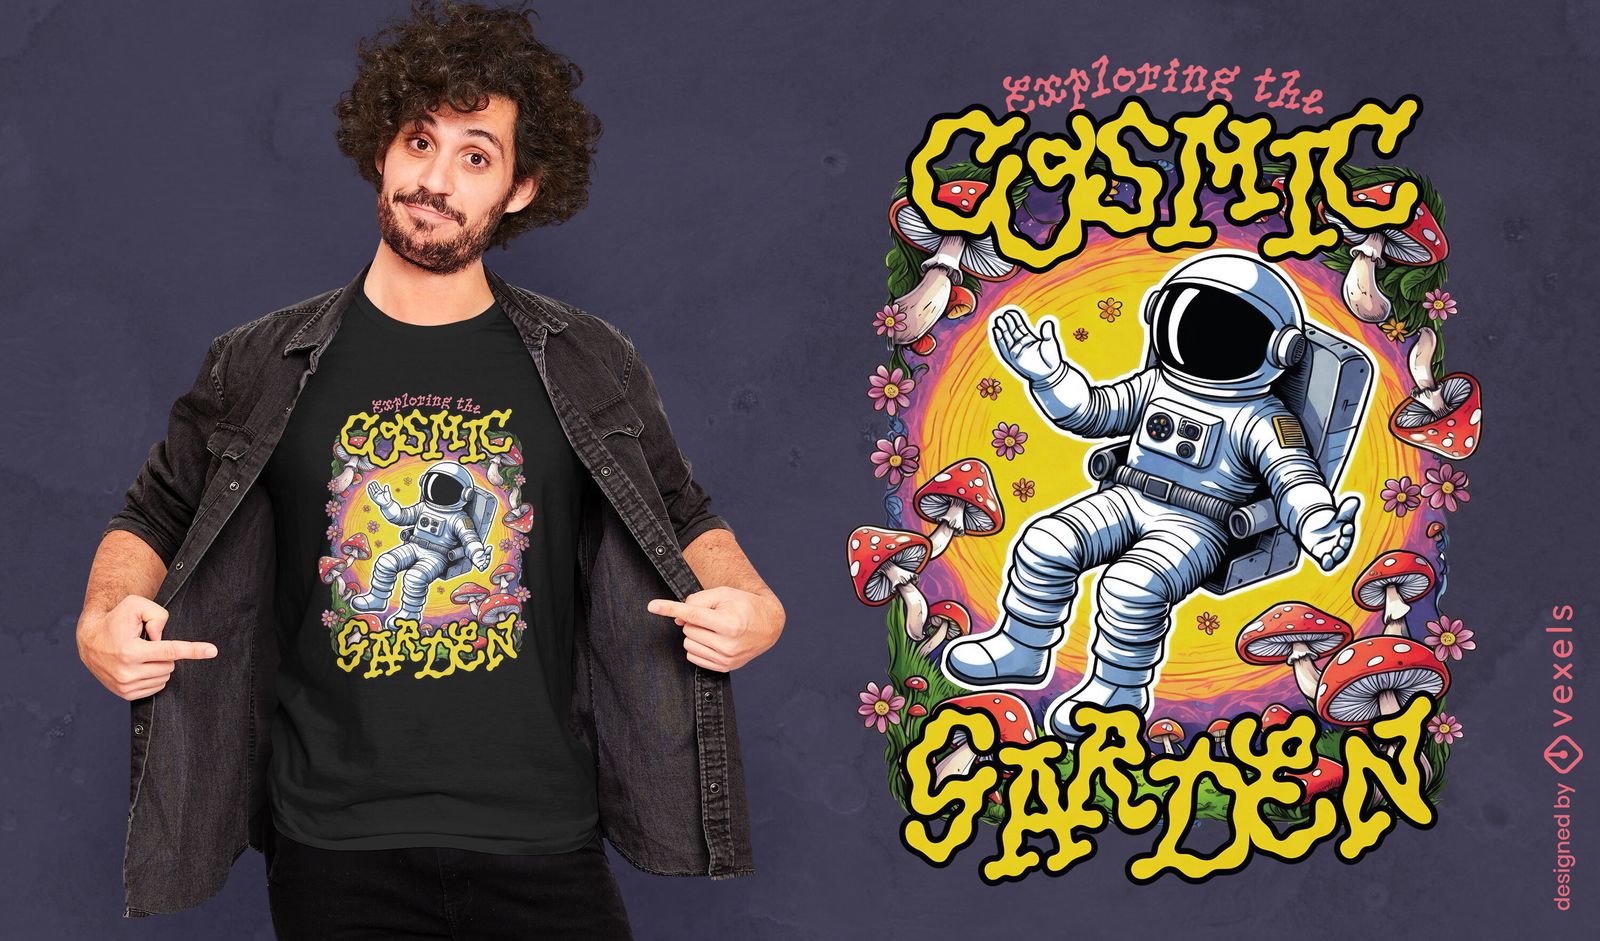
Design de camiseta para jardim cósmico
Escolha uma pasta
Todos os favoritos
Criar novo
Salvar
Design de camiseta para jardim cósmico
Pronto para imprimir
para Merch
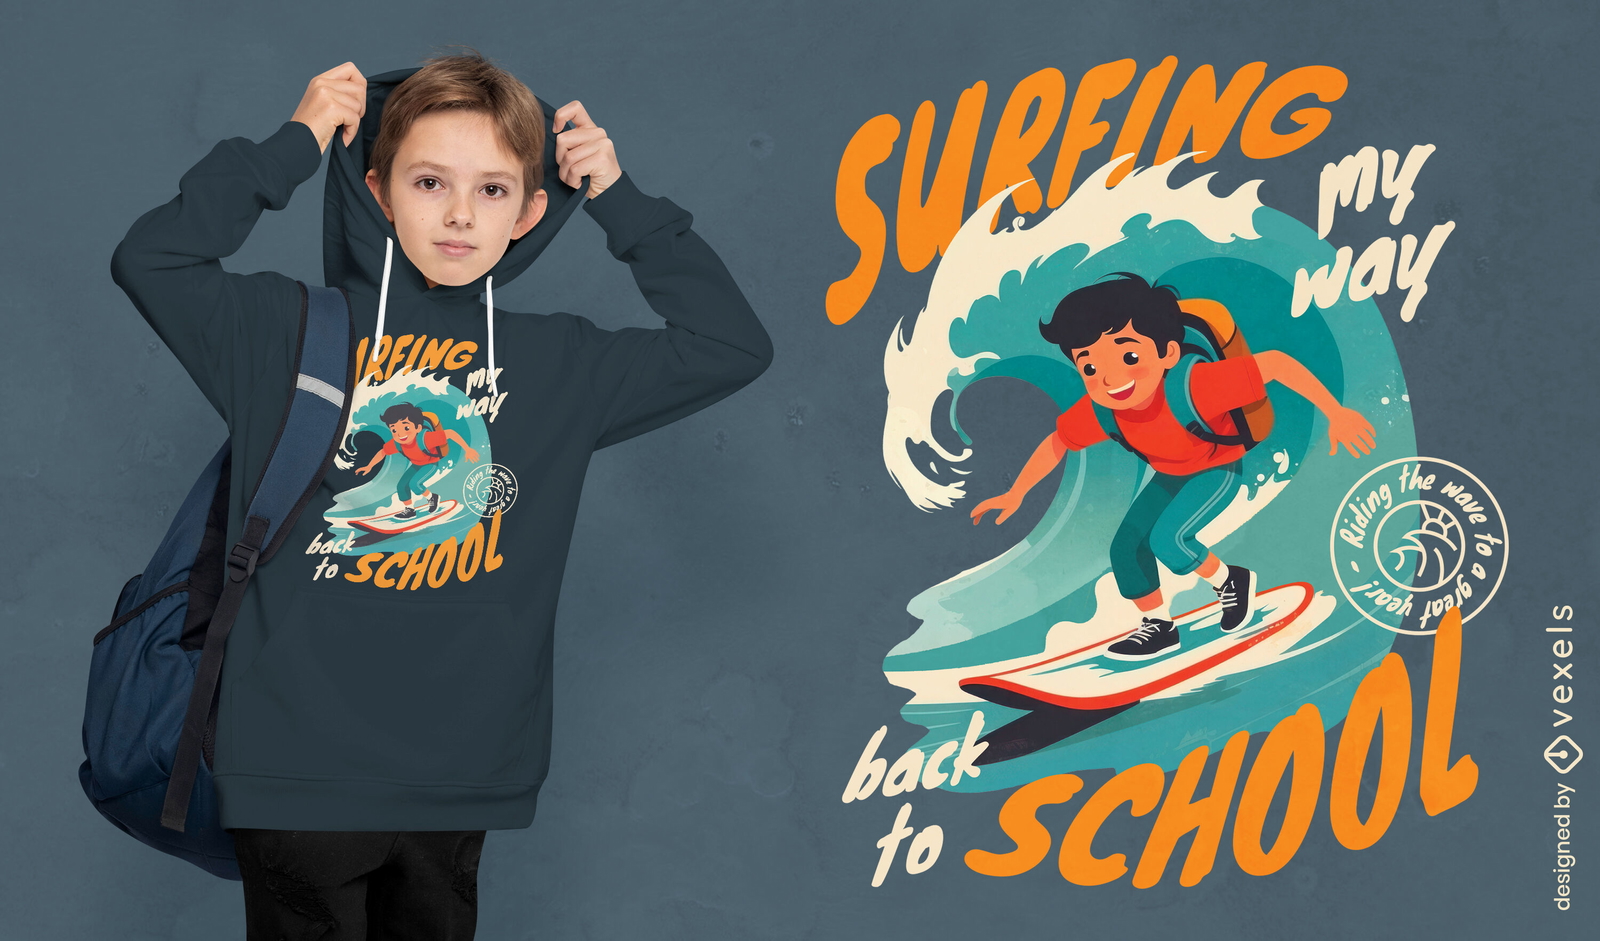
Design de camiseta surfando de volta às aulas
Escolha uma pasta
Todos os favoritos
Criar novo
Salvar
Design de camiseta surfando de volta às aulas
texto editável
Pronto para imprimir
para Merch
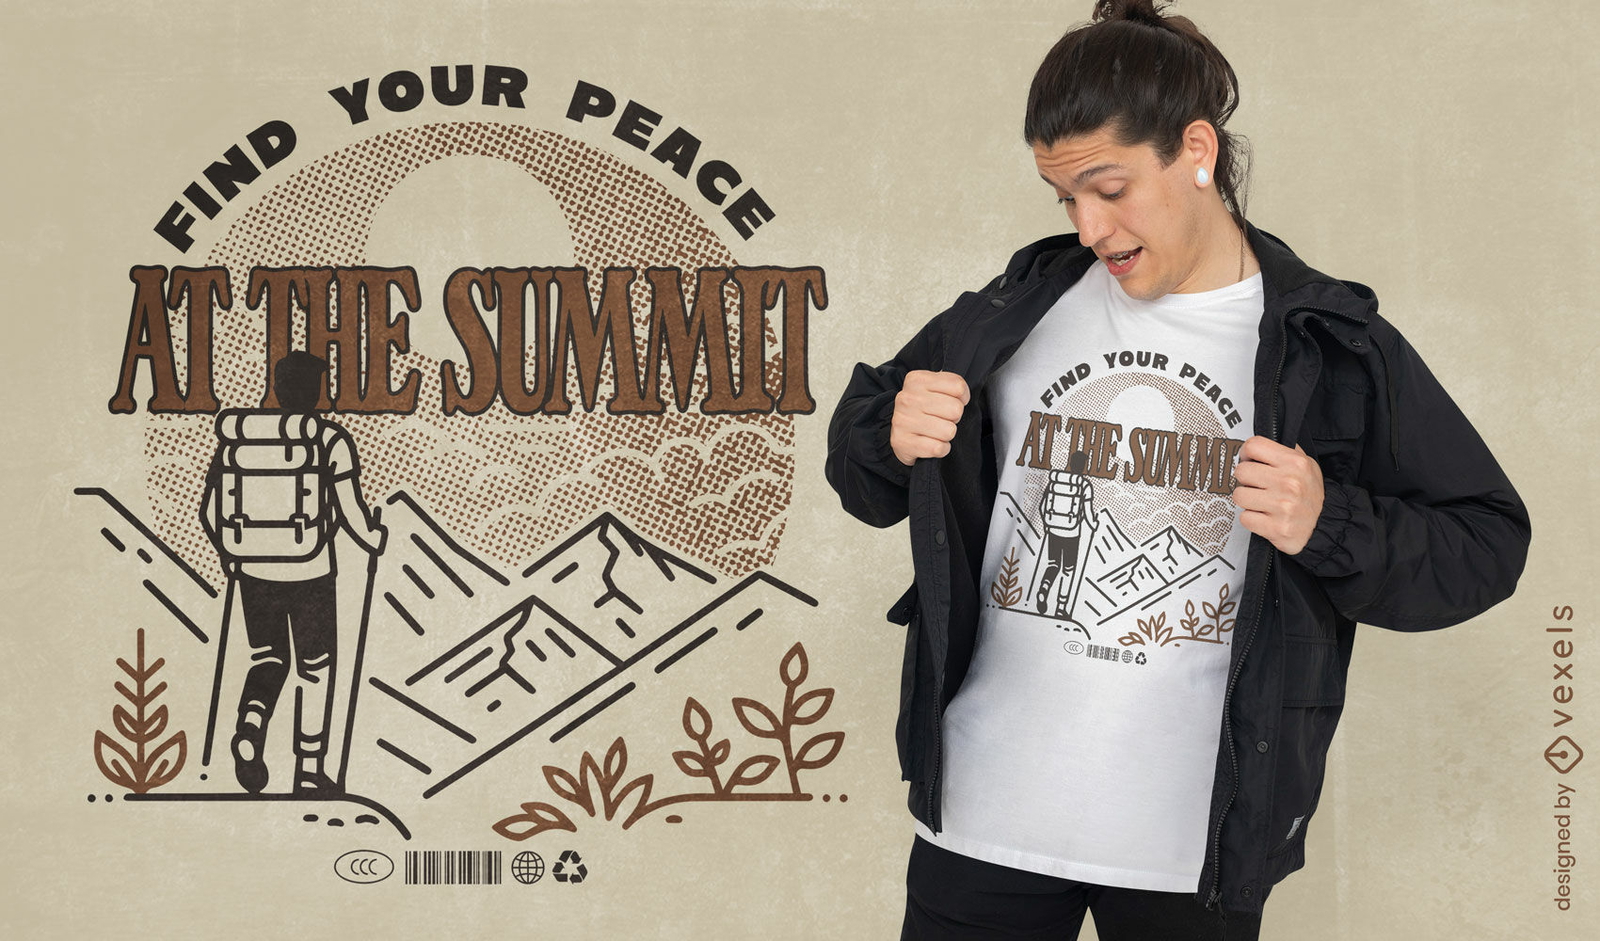
Design de camiseta no cume
Escolha uma pasta
Todos os favoritos
Criar novo
Salvar
Design de camiseta no cume
texto editável
Pronto para imprimir
para Merch
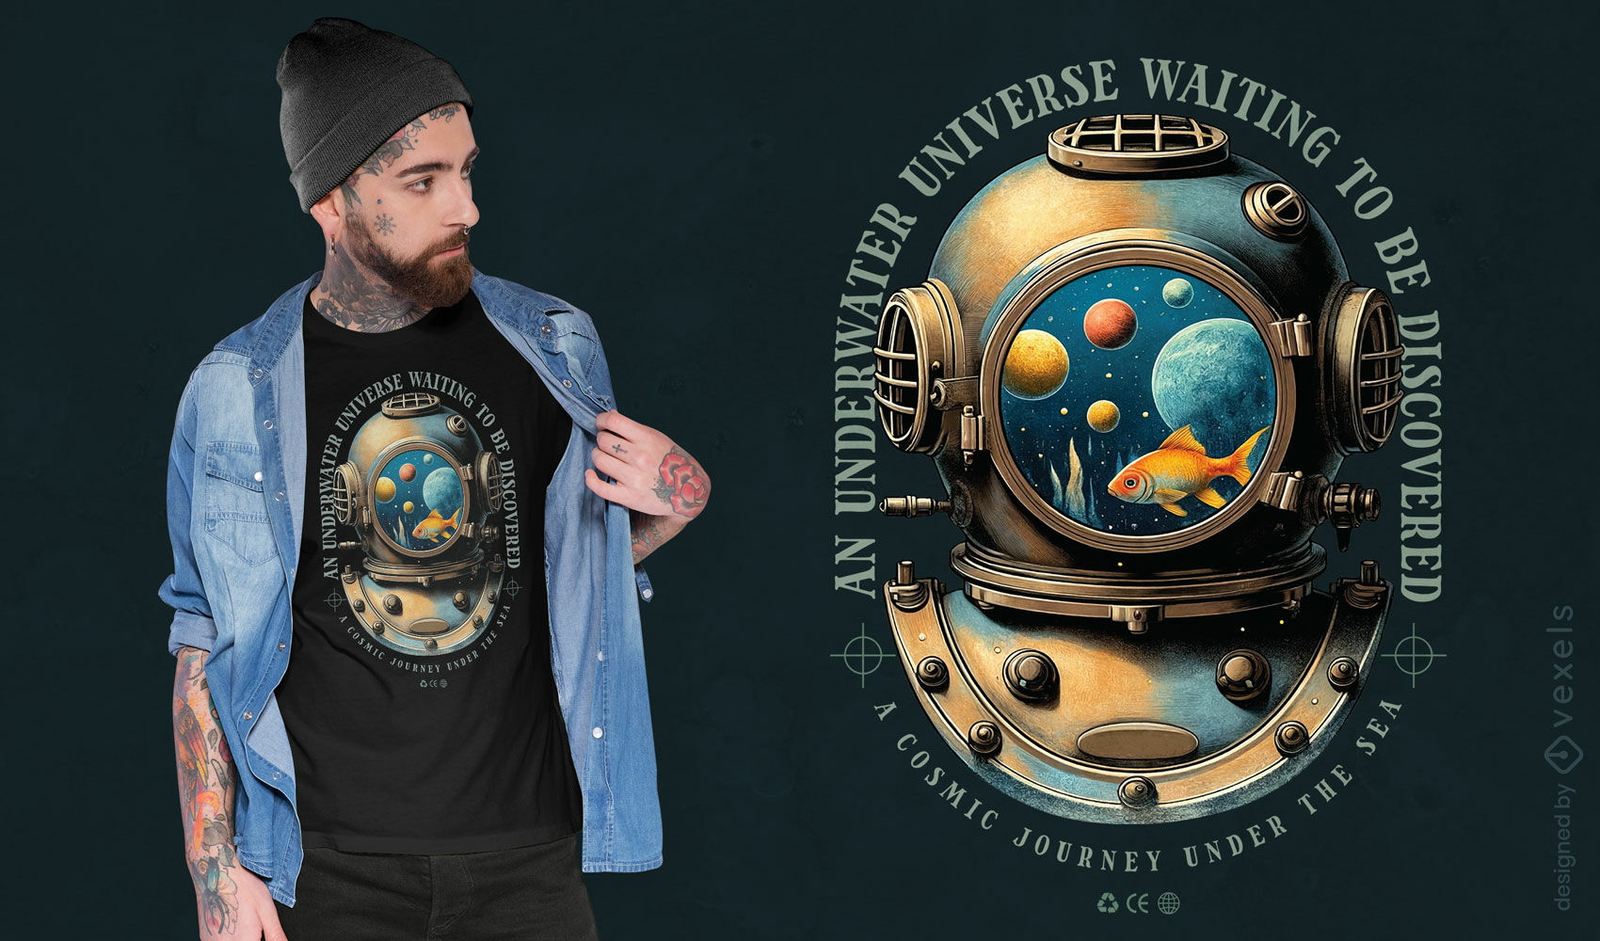
Design de camiseta do universo subaquático
Escolha uma pasta
Todos os favoritos
Criar novo
Salvar
Design de camiseta do universo subaquático
texto editável
Pronto para imprimir
para Merch
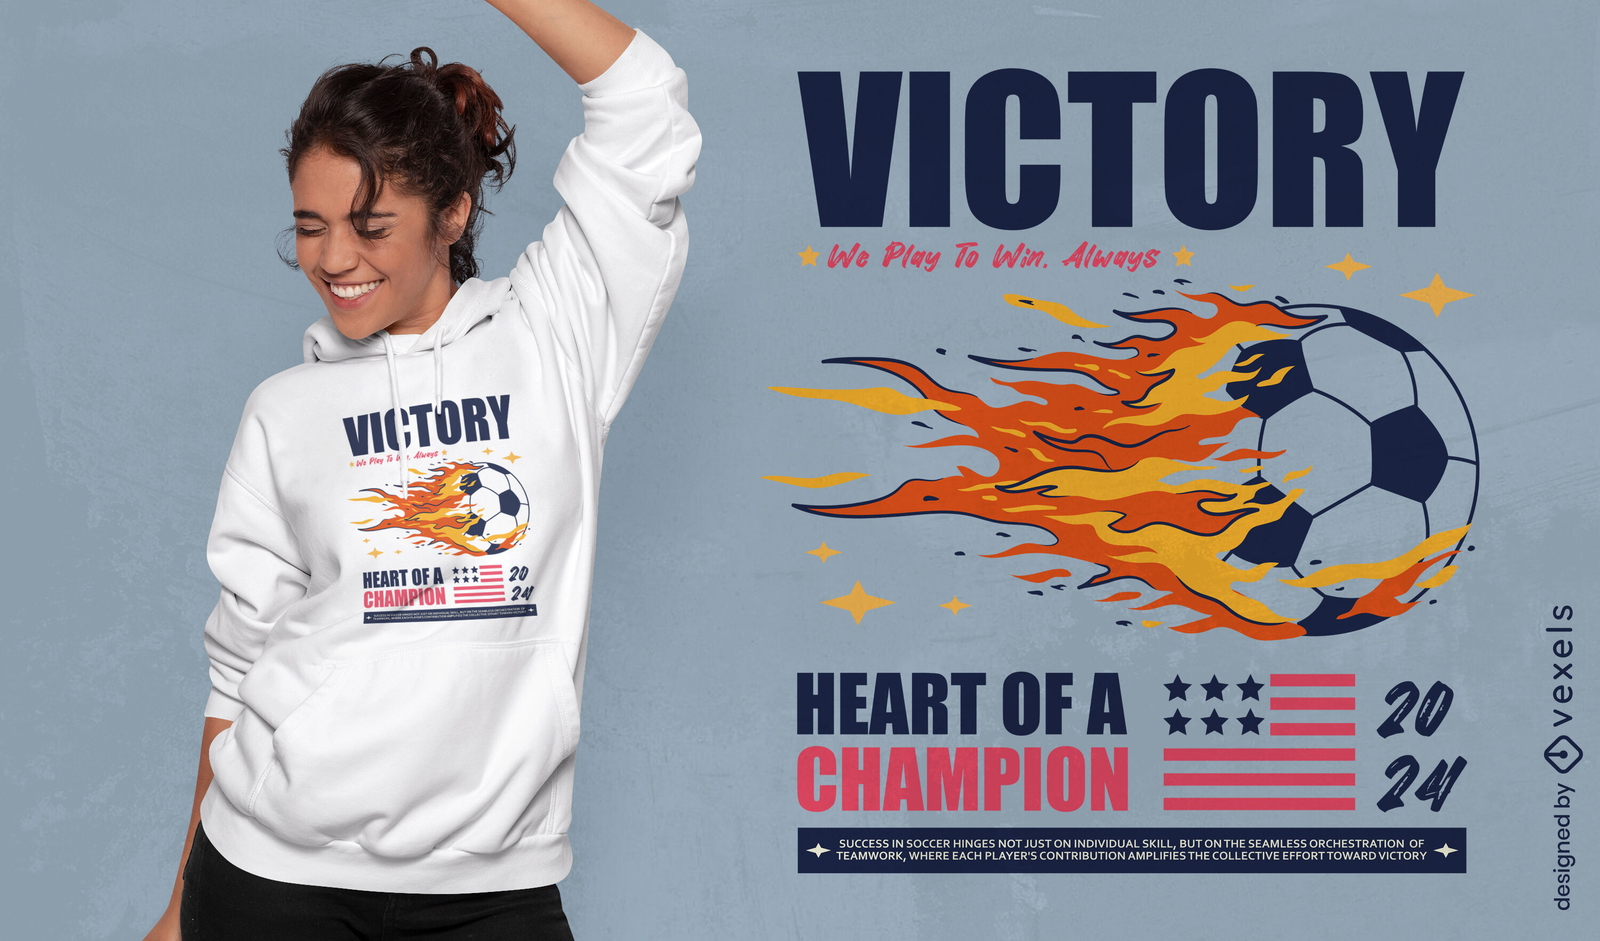
Design de camiseta de futebol da vitória
Escolha uma pasta
Todos os favoritos
Criar novo
Salvar
Design de camiseta de futebol da vitória
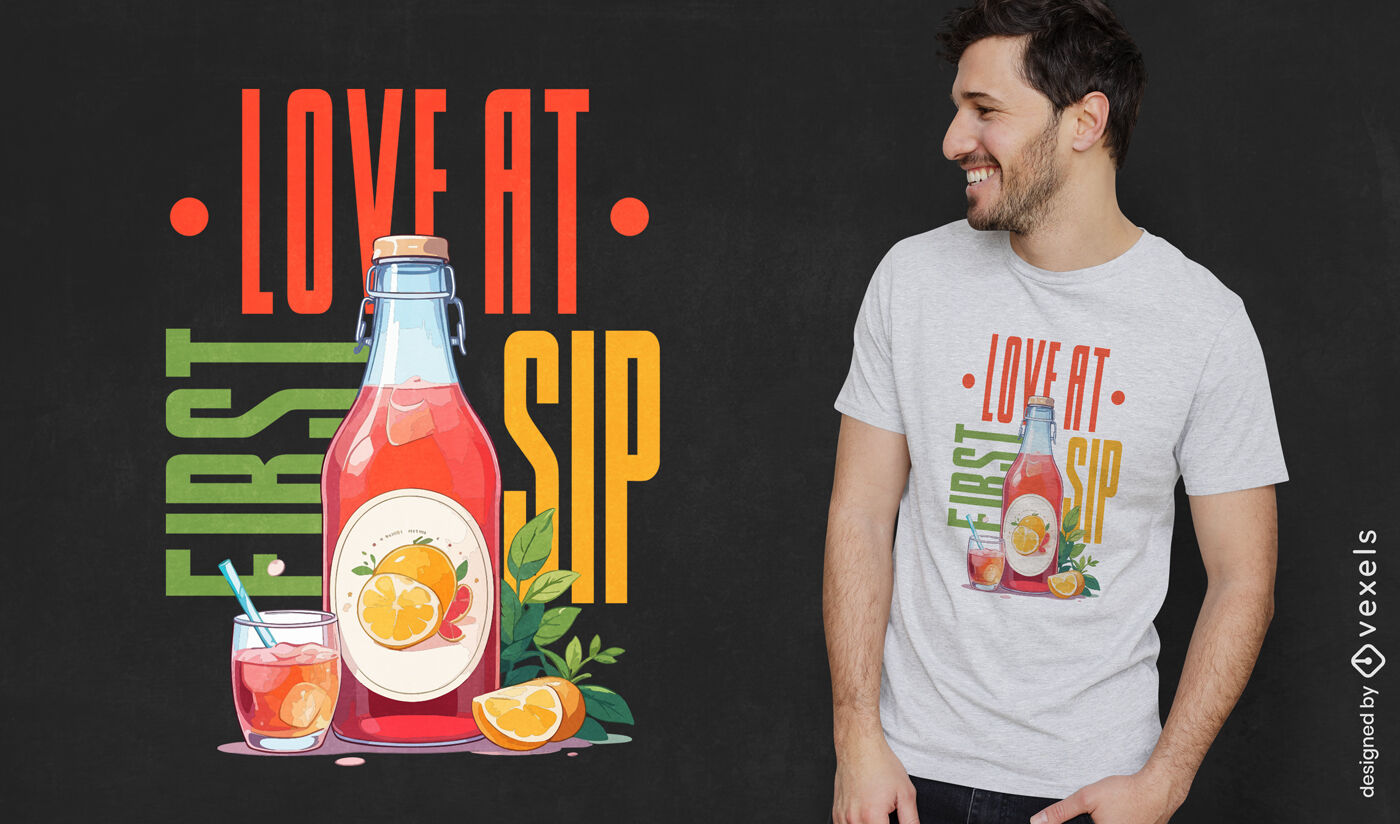
Gerado por IA, selecionado por nossos designers.
para Merch
Design de camiseta com amor ao primeiro gole
Escolha uma pasta
Todos os favoritos
Criar novo
Salvar
Design de camiseta com amor ao primeiro gole
Pronto para imprimir
para Merch
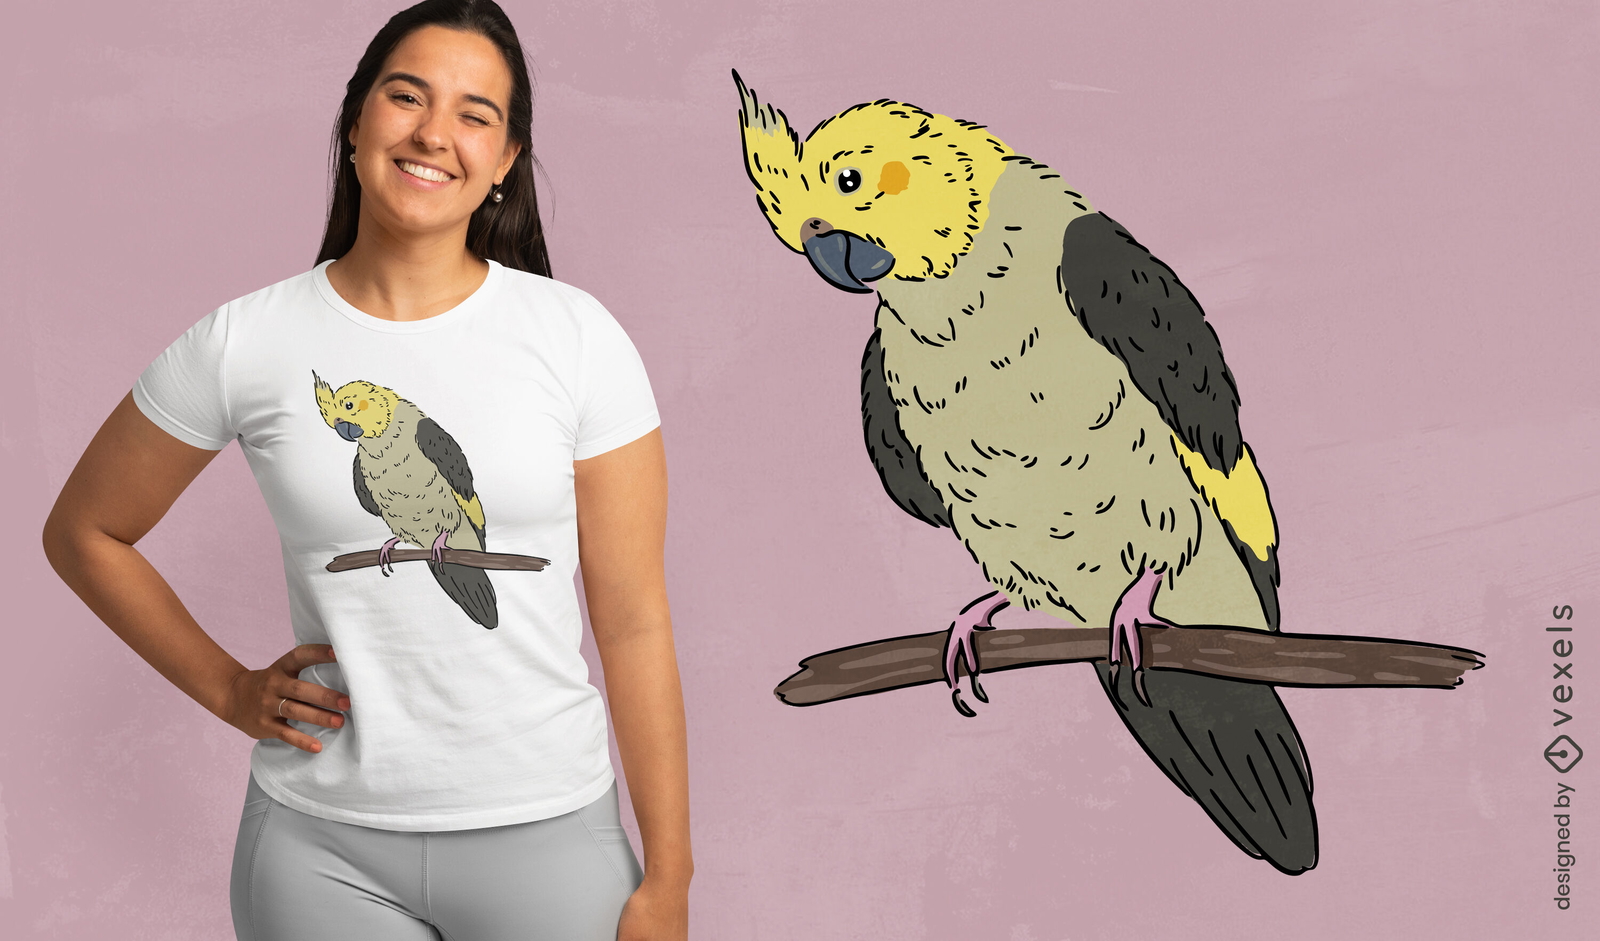
Design de camiseta de pássaro calopsita em um galho
Escolha uma pasta
Todos os favoritos
Criar novo
Salvar
Design de camiseta de pássaro calopsita em um galho
texto editável
Pronto para imprimir
para Merch
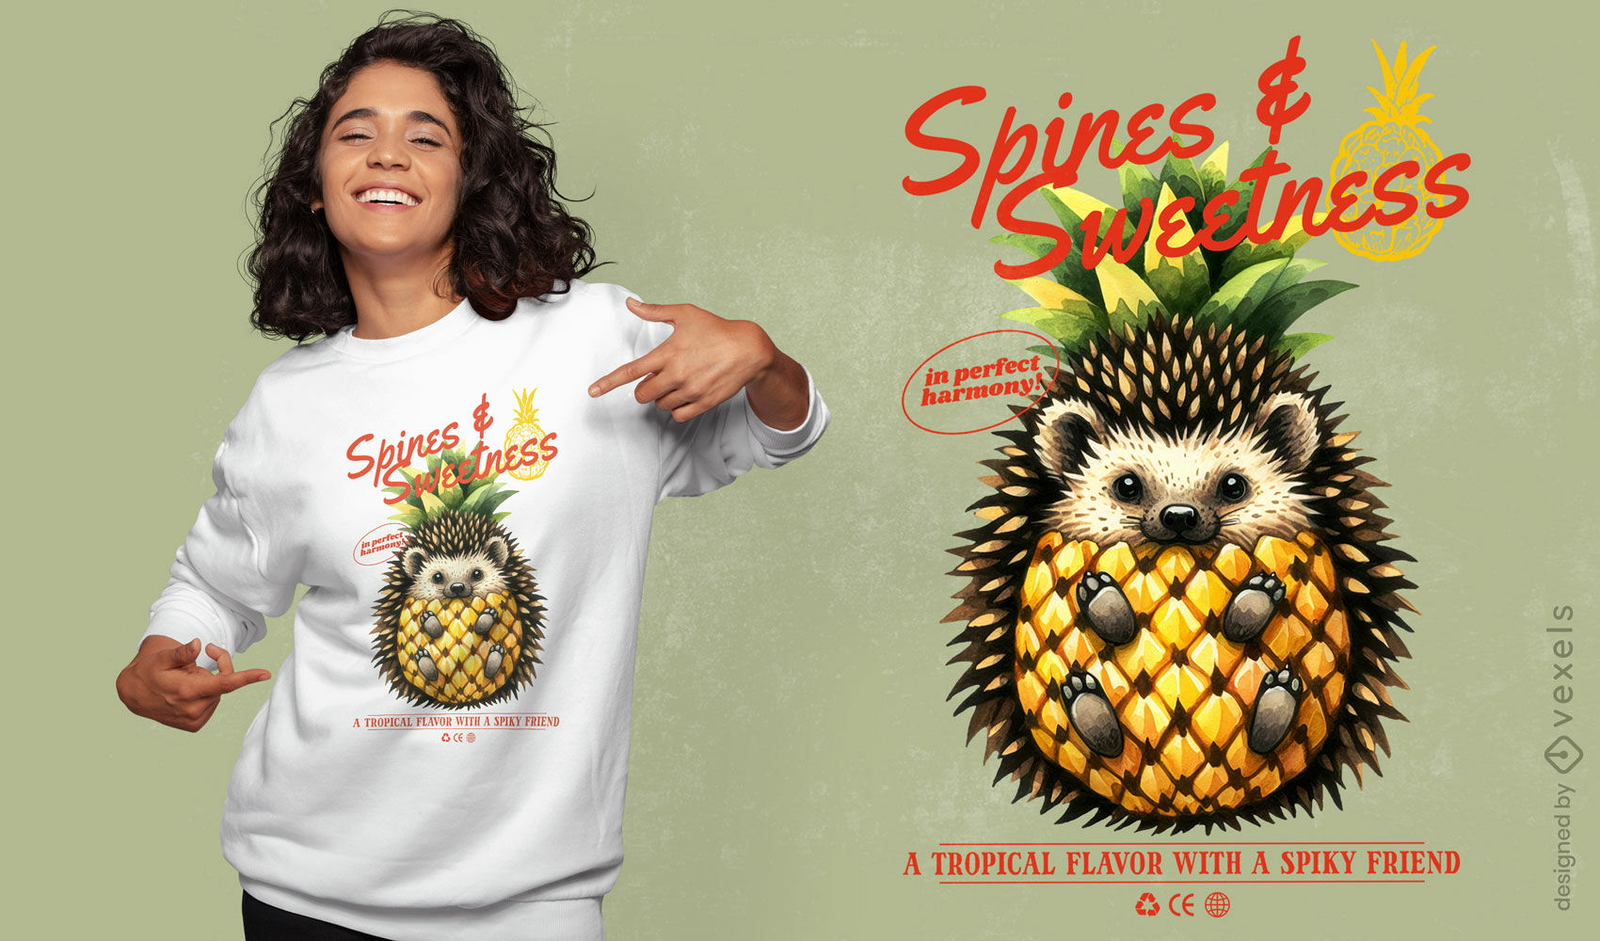
Design de camisetas com espinhos e doces
Escolha uma pasta
Todos os favoritos
Criar novo
Salvar
Design de camisetas com espinhos e doces
texto editável
Pronto para imprimir
para Merch
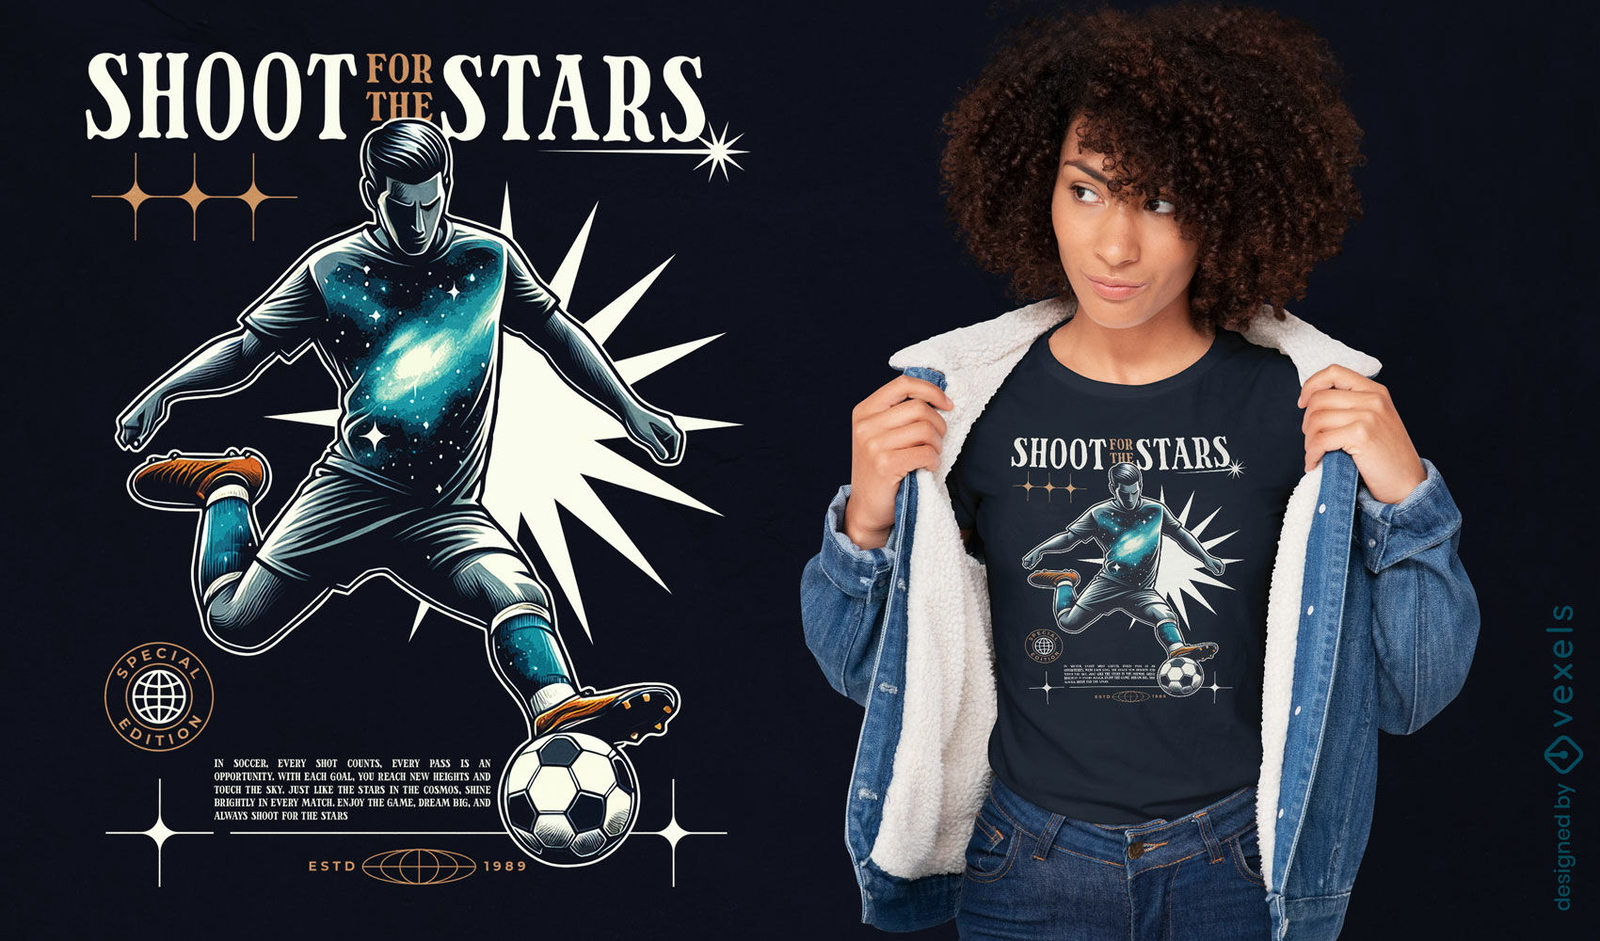
Atire nas estrelas com design de camiseta
Escolha uma pasta
Todos os favoritos
Criar novo
Salvar
Atire nas estrelas com design de camiseta
Pronto para imprimir
para Merch
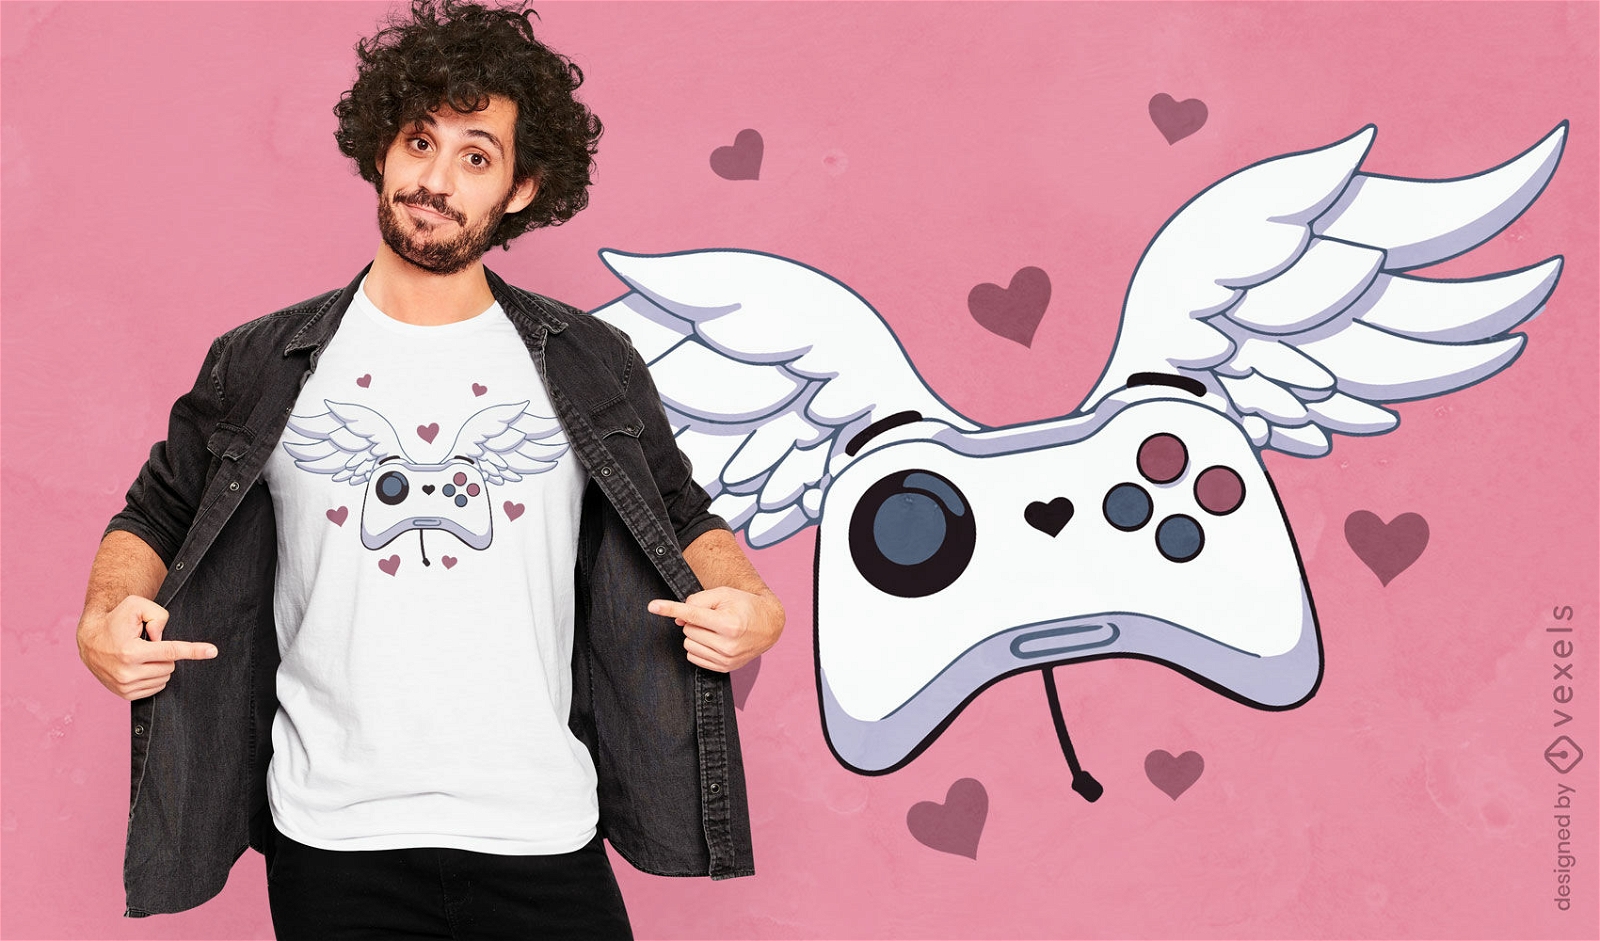
Controlador de jogo com design de camiseta com asas
Escolha uma pasta
Todos os favoritos
Criar novo
Salvar
Controlador de jogo com design de camiseta com asas
Pronto para imprimir
para Merch
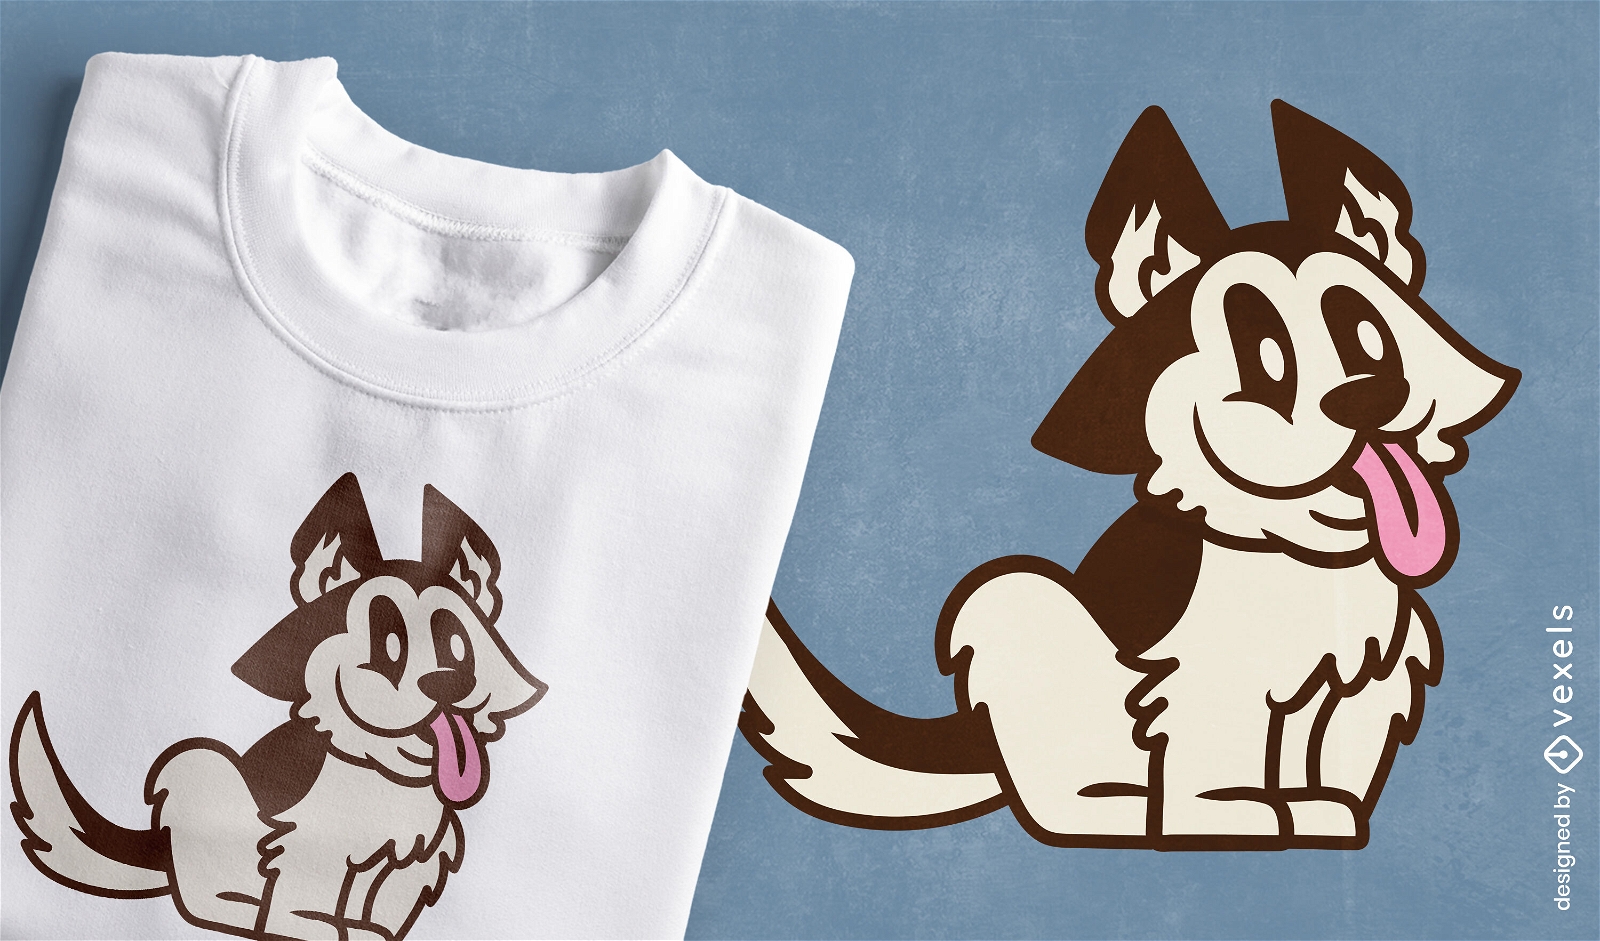
Design de camiseta de desenho animado Shetland Sheepdog
Escolha uma pasta
Todos os favoritos
Criar novo
Salvar
Design de camiseta de desenho animado Shetland Sheepdog
Pronto para imprimir
para Merch
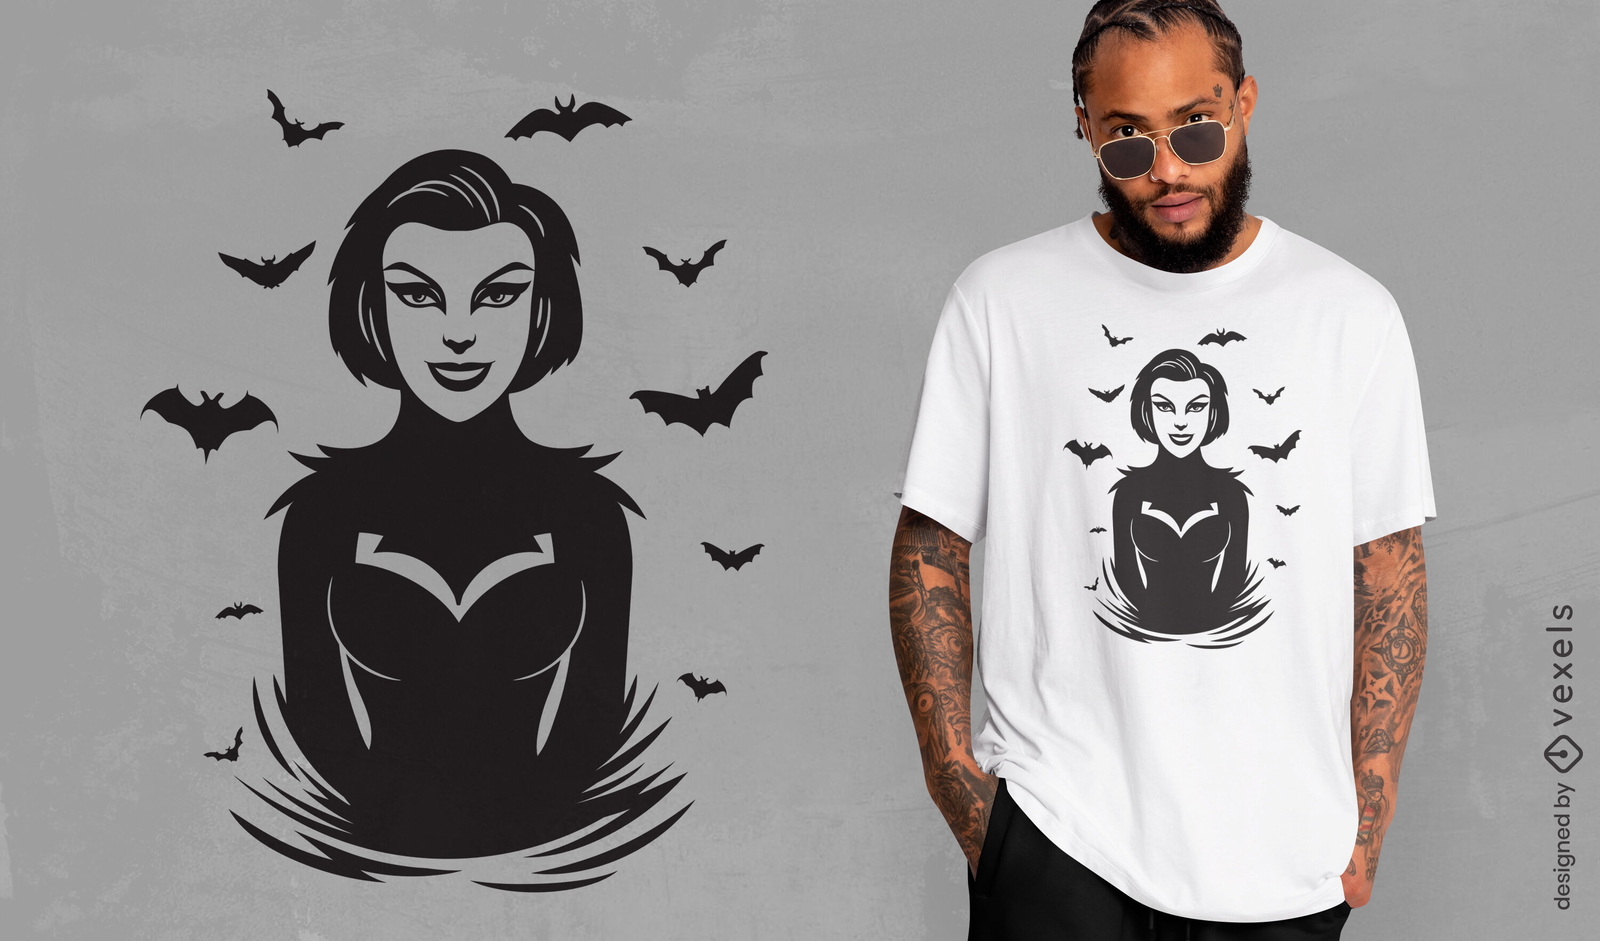
Design de camiseta gótica para mulher vampira
Escolha uma pasta
Todos os favoritos
Criar novo
Salvar
Design de camiseta gótica para mulher vampira
texto editável
Pronto para imprimir
para Merch
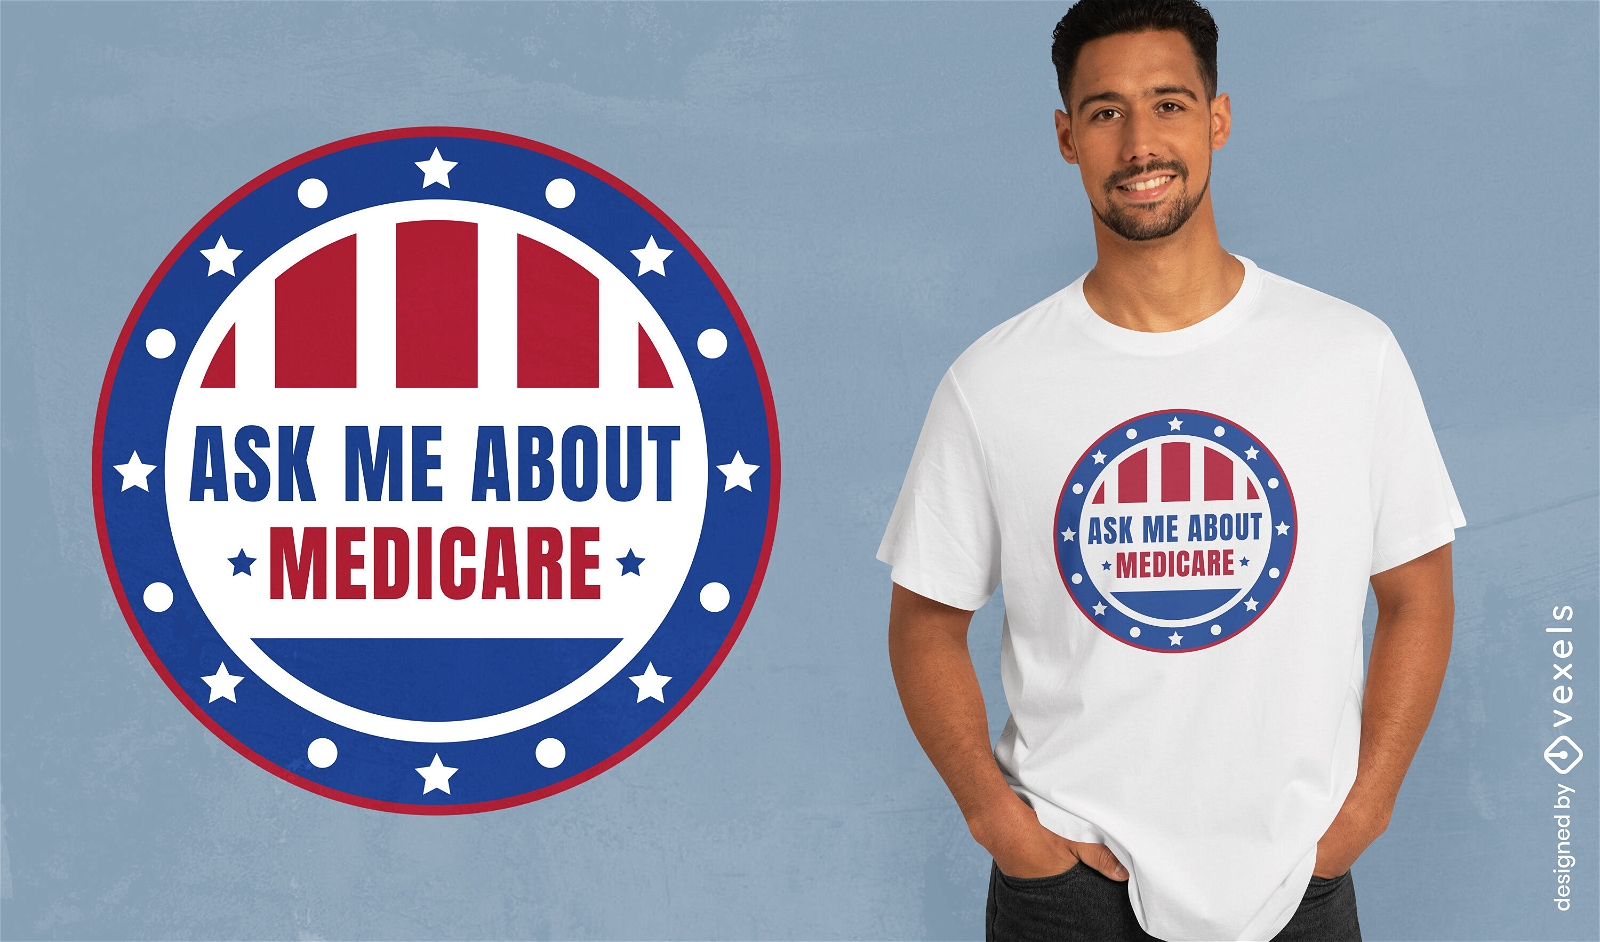
Design de camiseta com distintivo de consulta do Medicare
Escolha uma pasta
Todos os favoritos
Criar novo
Salvar
Design de camiseta com distintivo de consulta do Medicare
Gerado por IA, selecionado por nossos designers.
para Merch
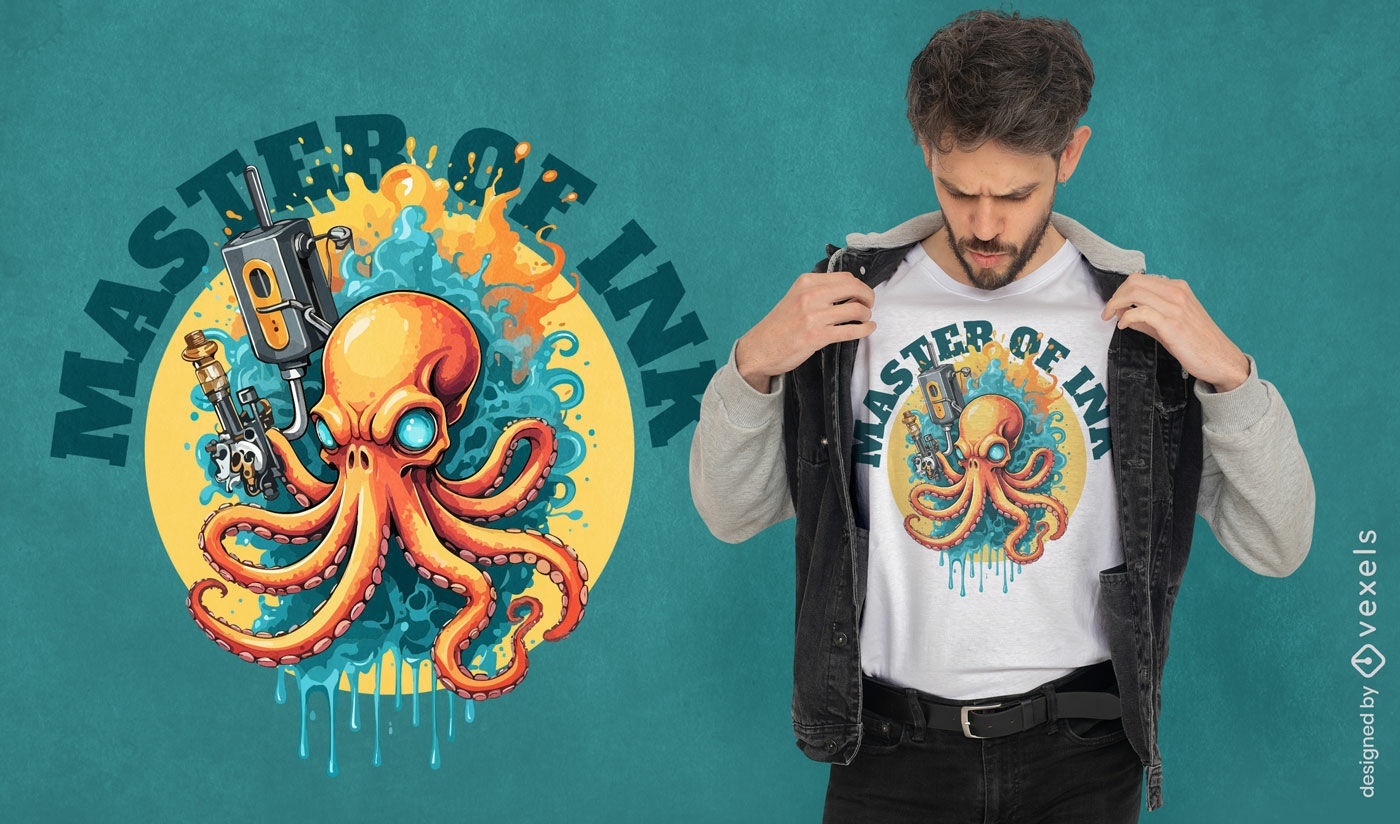
Design de camiseta de polvo mestre em tinta
Escolha uma pasta
Todos os favoritos
Criar novo
Salvar
Design de camiseta de polvo mestre em tinta
Pronto para imprimir
para Merch
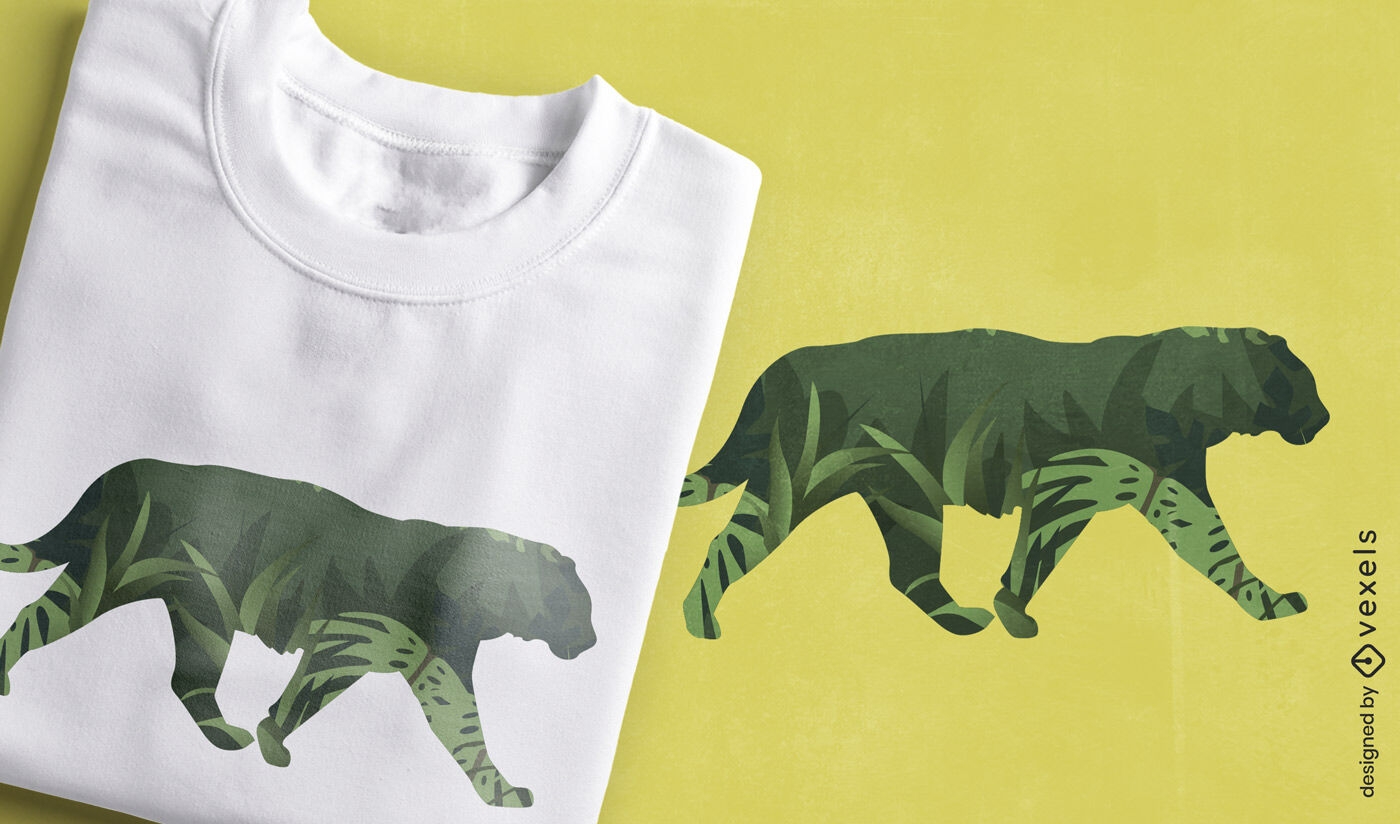
Design de camiseta com folhagem camuflada de tigre
Escolha uma pasta
Todos os favoritos
Criar novo
Salvar
Design de camiseta com folhagem camuflada de tigre
texto editável
Pronto para imprimir
para Merch
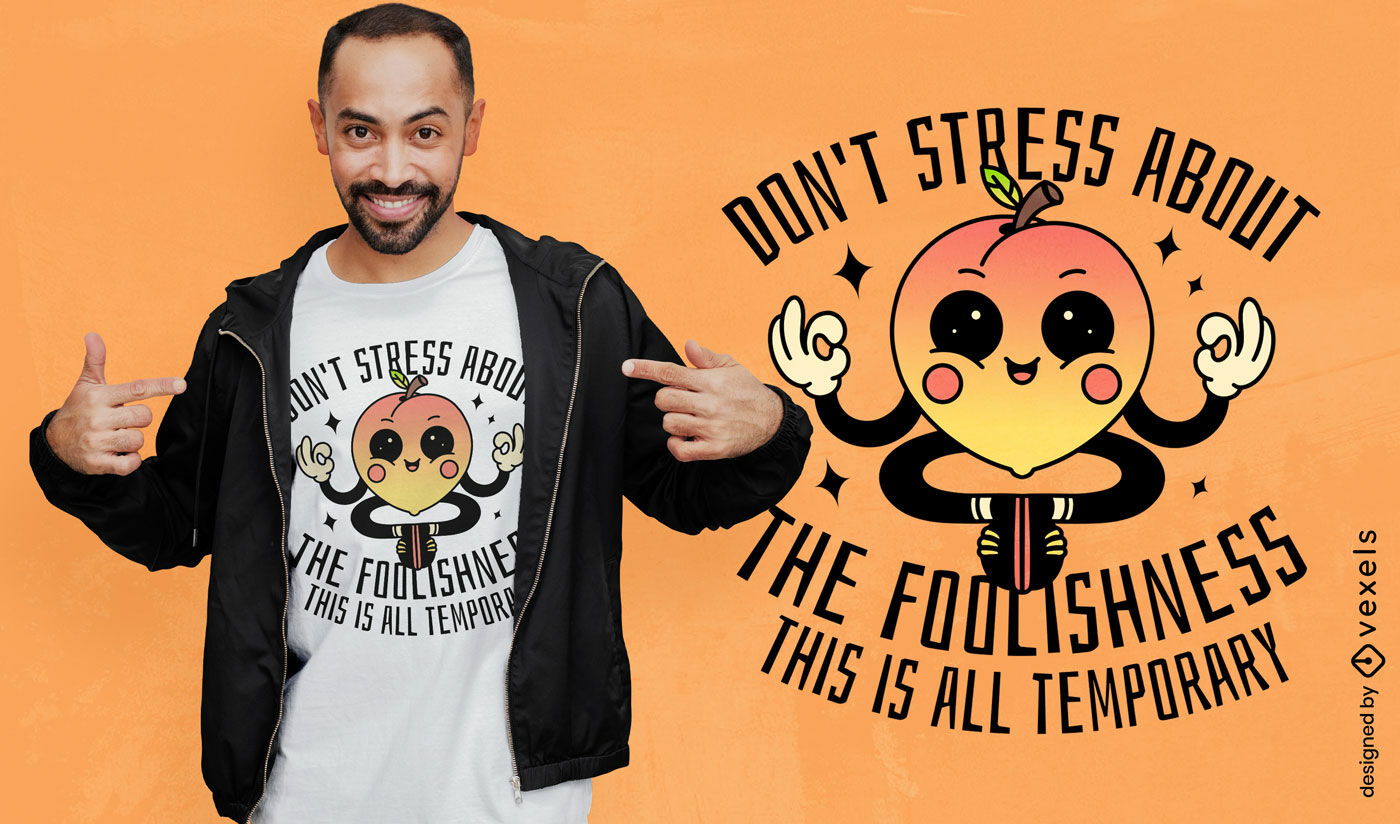
Design de personagem motivacional de pêssego
Escolha uma pasta
Todos os favoritos
Criar novo
Salvar
Design de personagem motivacional de pêssego
Gerado por IA, selecionado por nossos designers.
para Merch
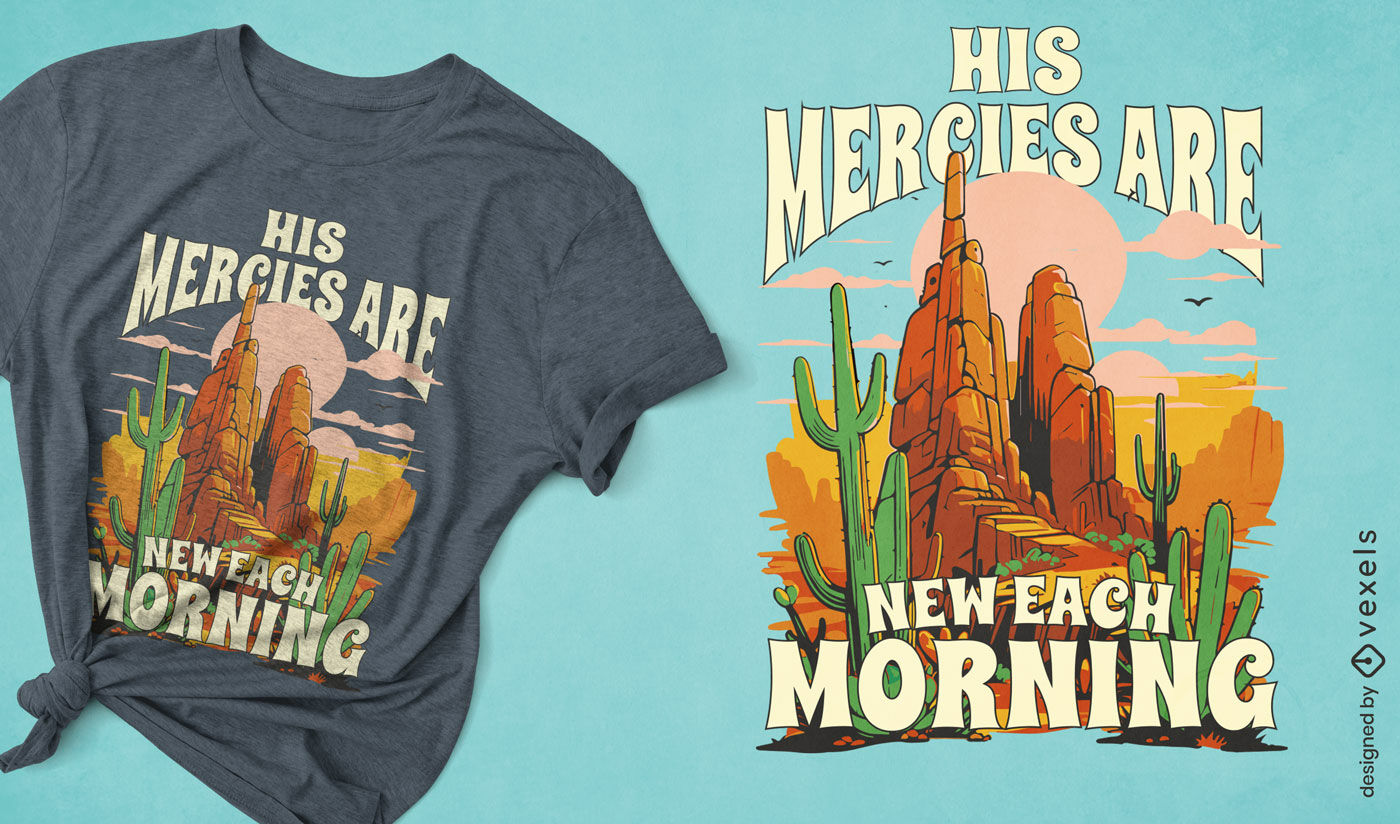
Design de camiseta com cita??o de paisagem ocidental
Escolha uma pasta
Todos os favoritos
Criar novo
Salvar
Design de camiseta com cita??o de paisagem ocidental
Pronto para imprimir
para Merch
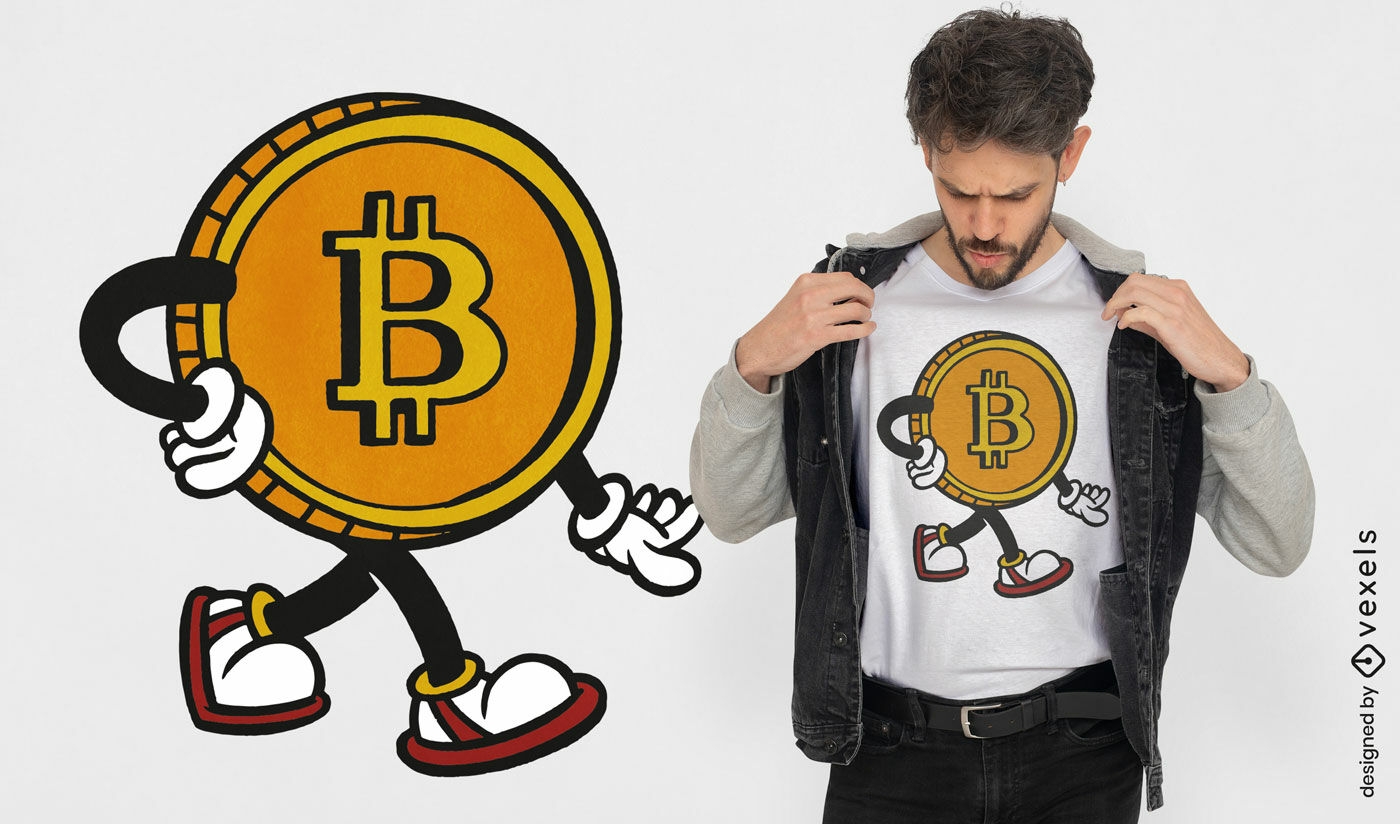
Design de camiseta do mascote da criptomoeda
Escolha uma pasta
Todos os favoritos
Criar novo
Salvar
Design de camiseta do mascote da criptomoeda
Pronto para imprimir
para Merch
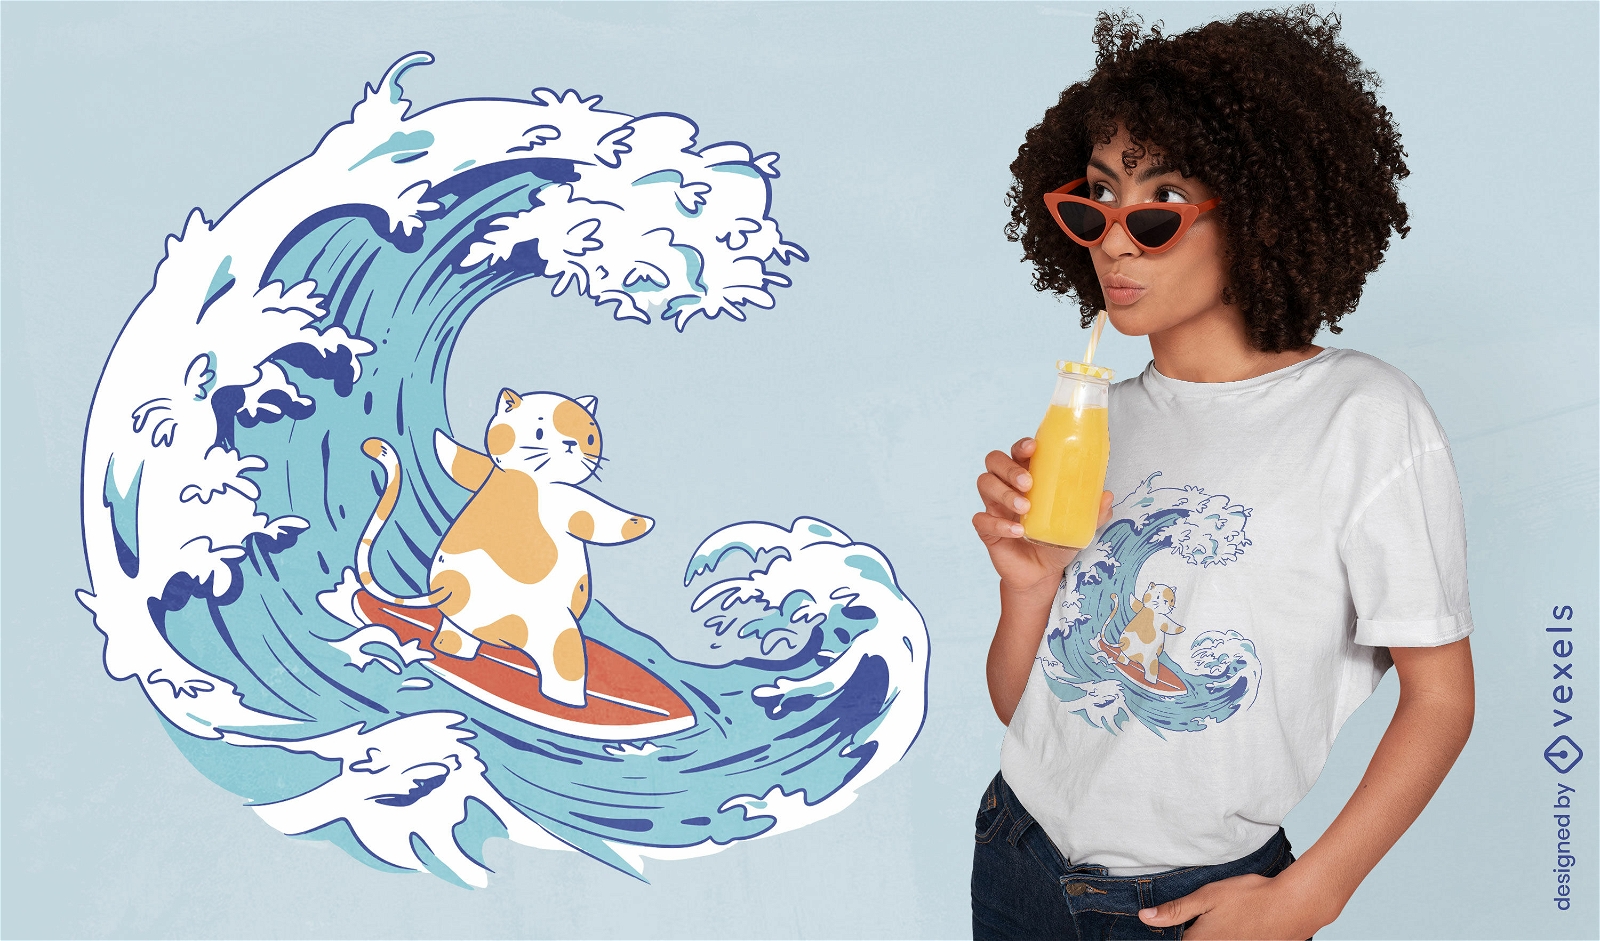
Design de camiseta de onda de gato surfista
Escolha uma pasta
Todos os favoritos
Criar novo
Salvar
Design de camiseta de onda de gato surfista
Pronto para imprimir
para Merch
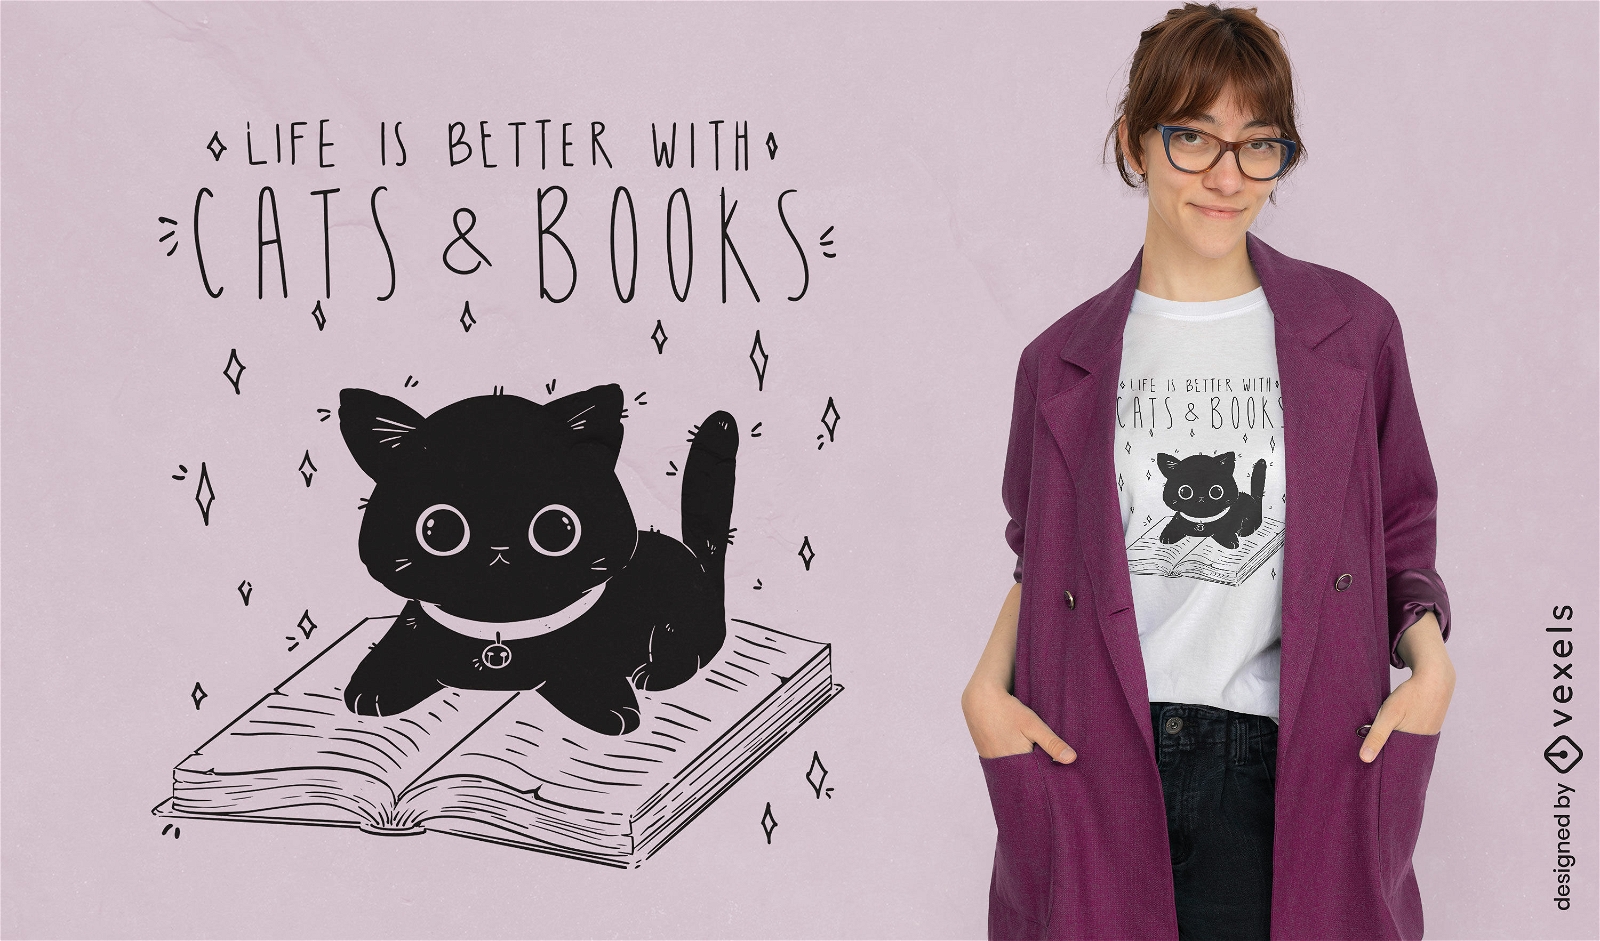
Design de camiseta de gatos e livros
Escolha uma pasta
Todos os favoritos
Criar novo
Salvar
Design de camiseta de gatos e livros
texto editável
Pronto para imprimir
para Merch
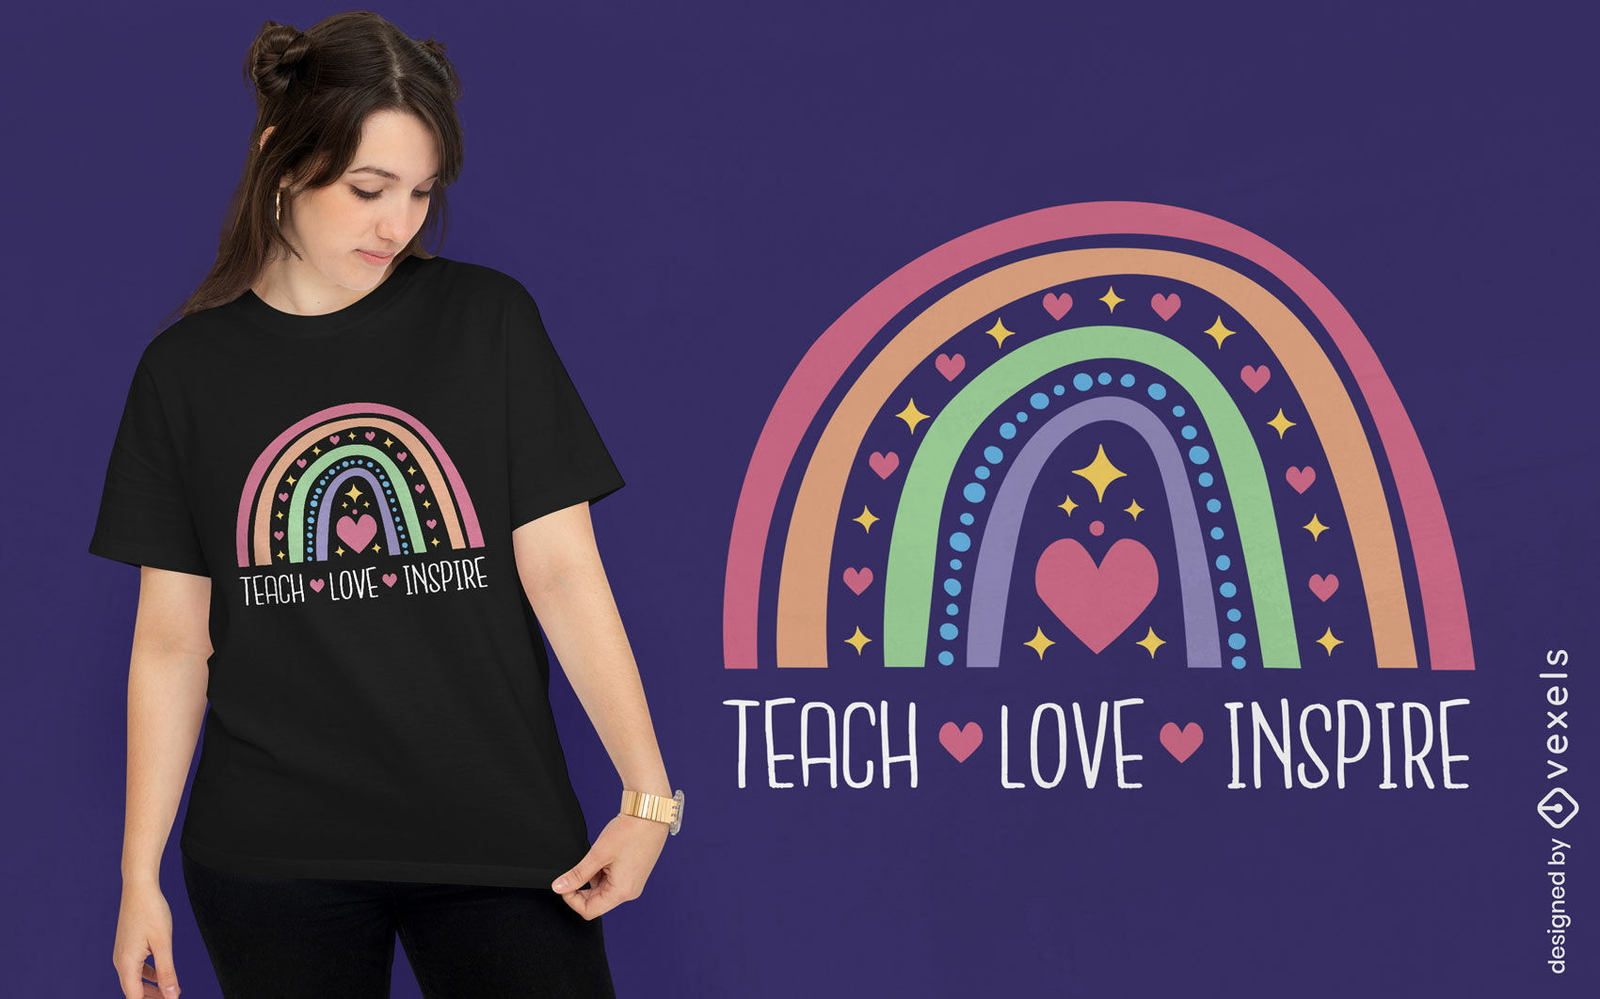
Design de camiseta com citação de amor do professor
Escolha uma pasta
Todos os favoritos
Criar novo
Salvar
Design de camiseta com citação de amor do professor
texto editável
Pronto para imprimir
para Merch
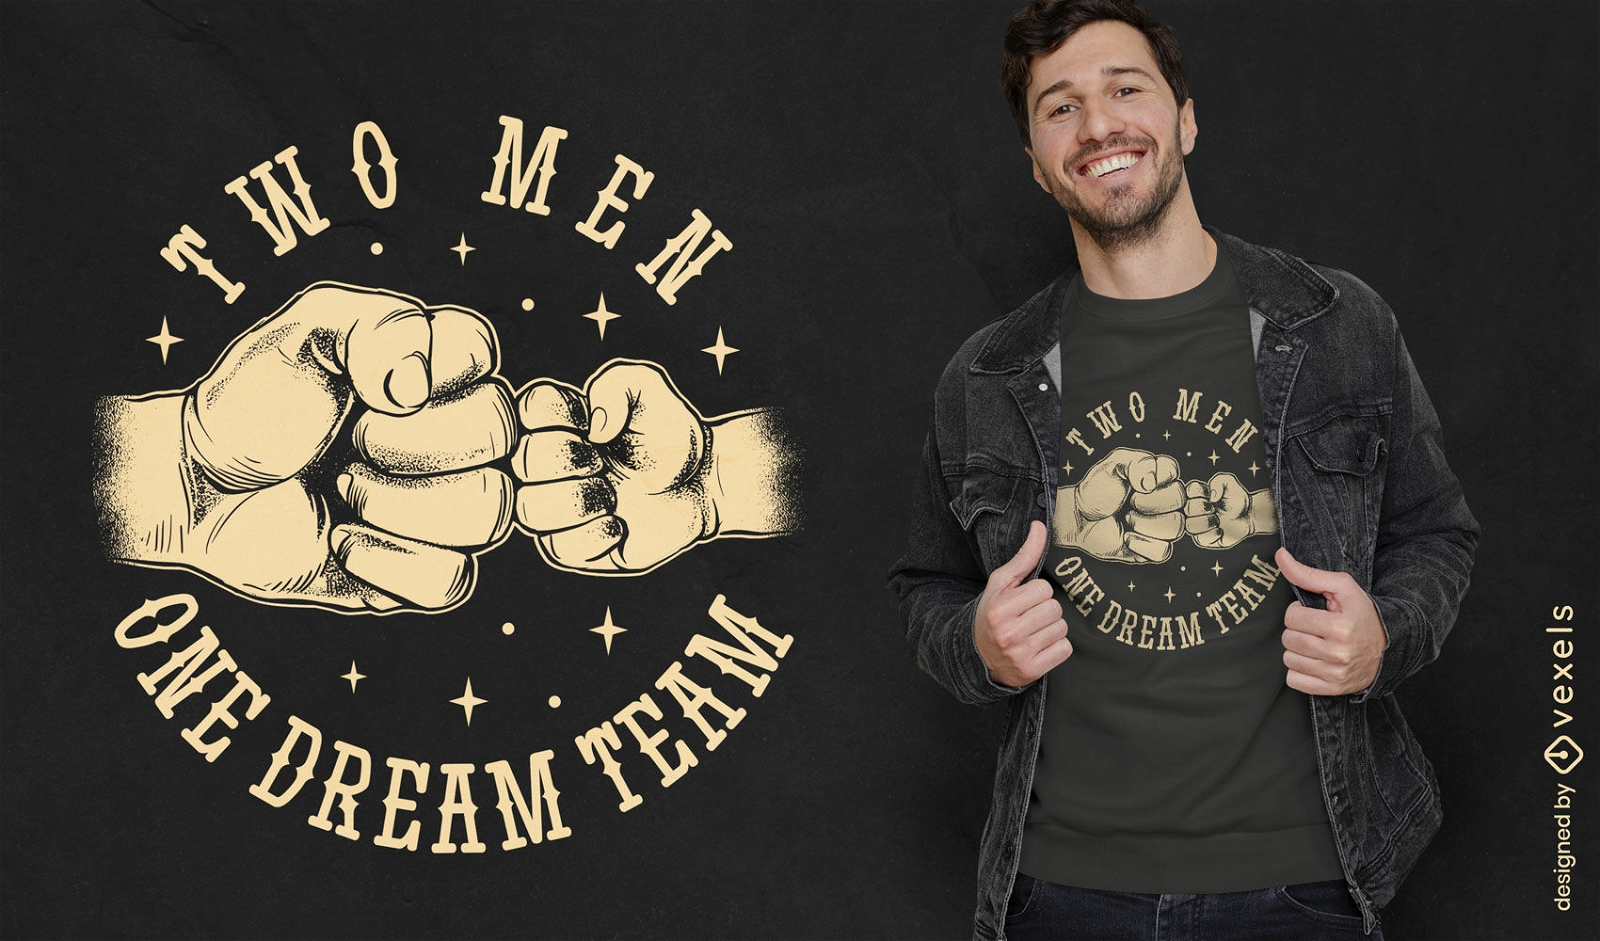
Pai e filho batem o design de camiseta de punhos
Escolha uma pasta
Todos os favoritos
Criar novo
Salvar
Pai e filho batem o design de camiseta de punhos
Pronto para imprimir
para Merch
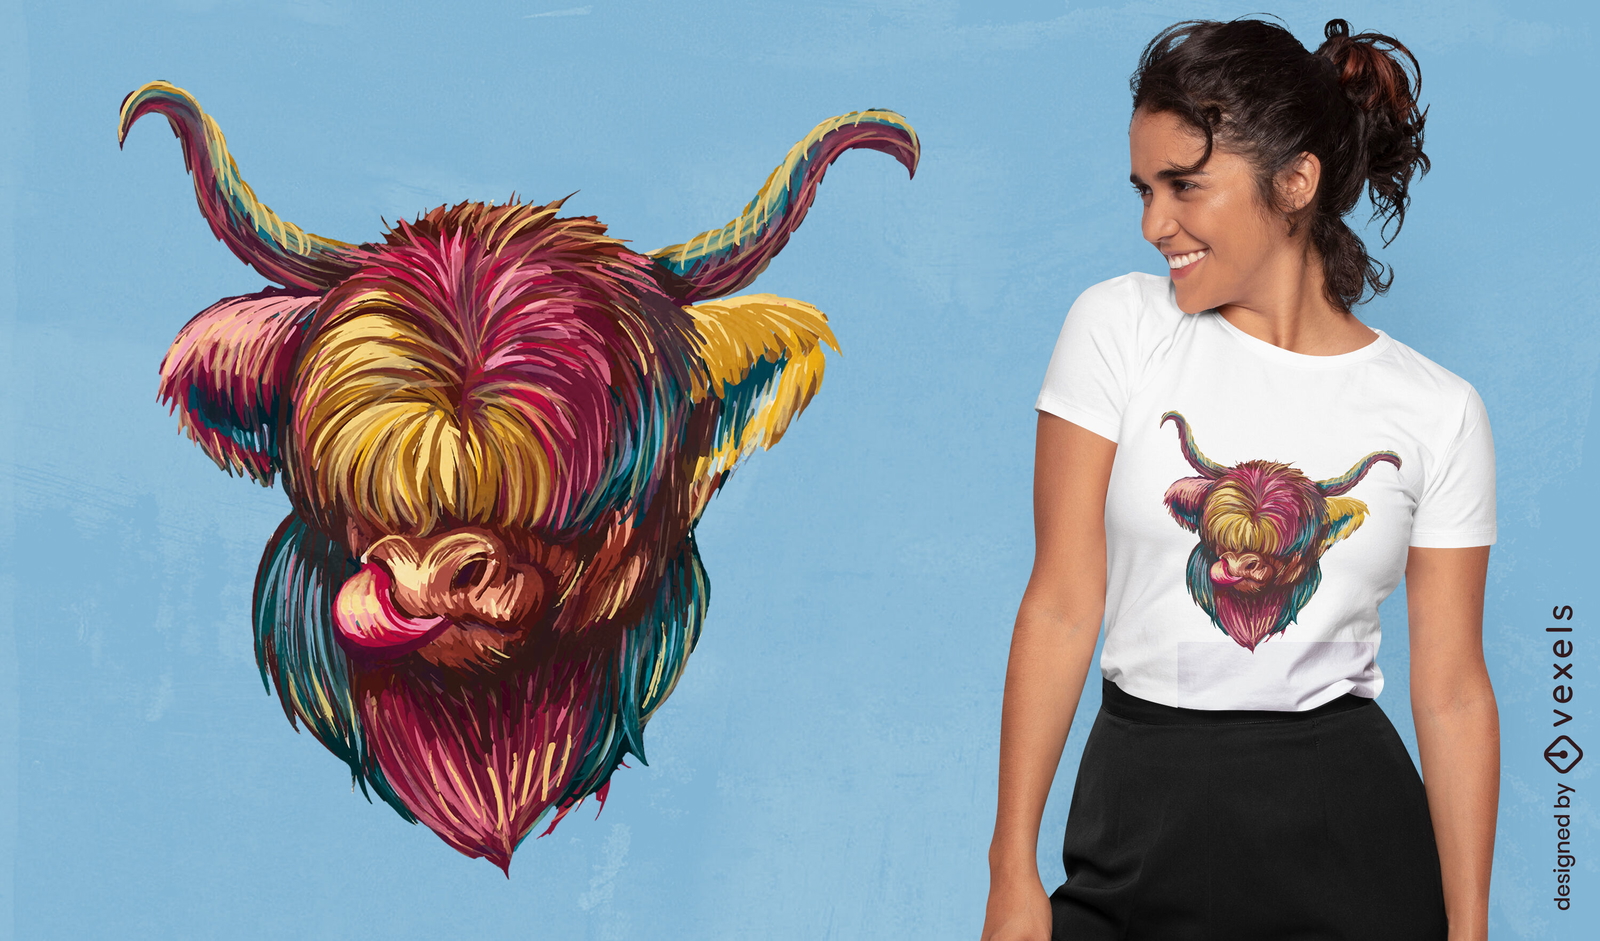
Design de camiseta de ilustração de animais de vaca das montanhas
Escolha uma pasta
Todos os favoritos
Criar novo
Salvar
Design de camiseta de ilustração de animais de vaca das montanhas
Pronto para imprimir
para Merch
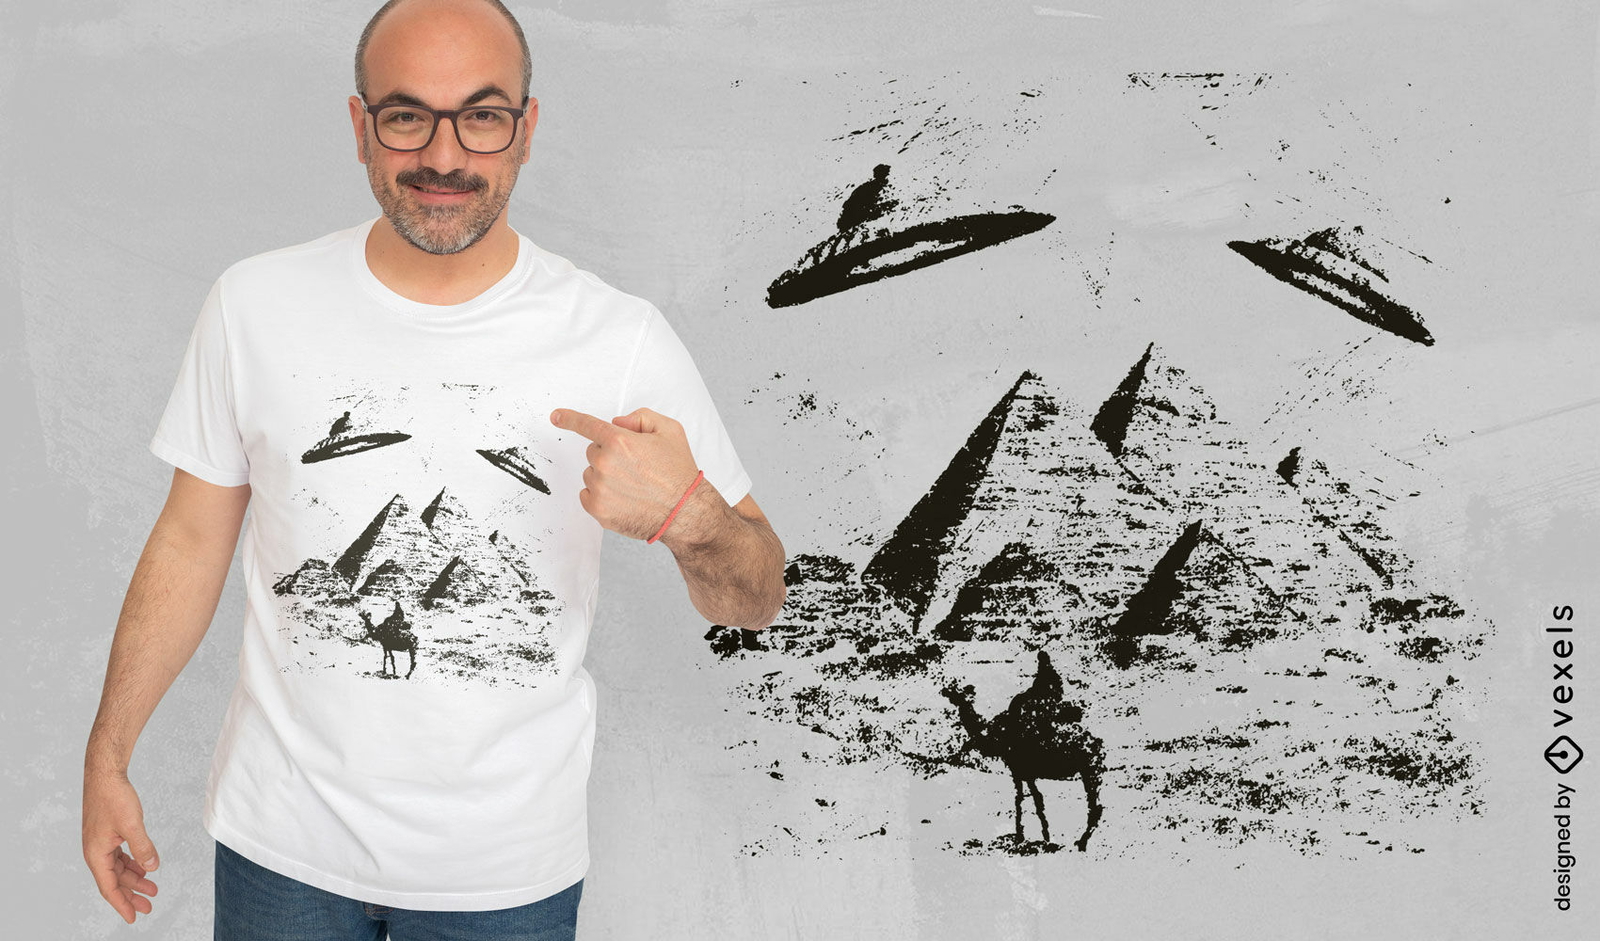
Design de camiseta de pirâmides de OVNIs
Escolha uma pasta
Todos os favoritos
Criar novo
Salvar
Design de camiseta de pirâmides de OVNIs
Pronto para imprimir
para Merch
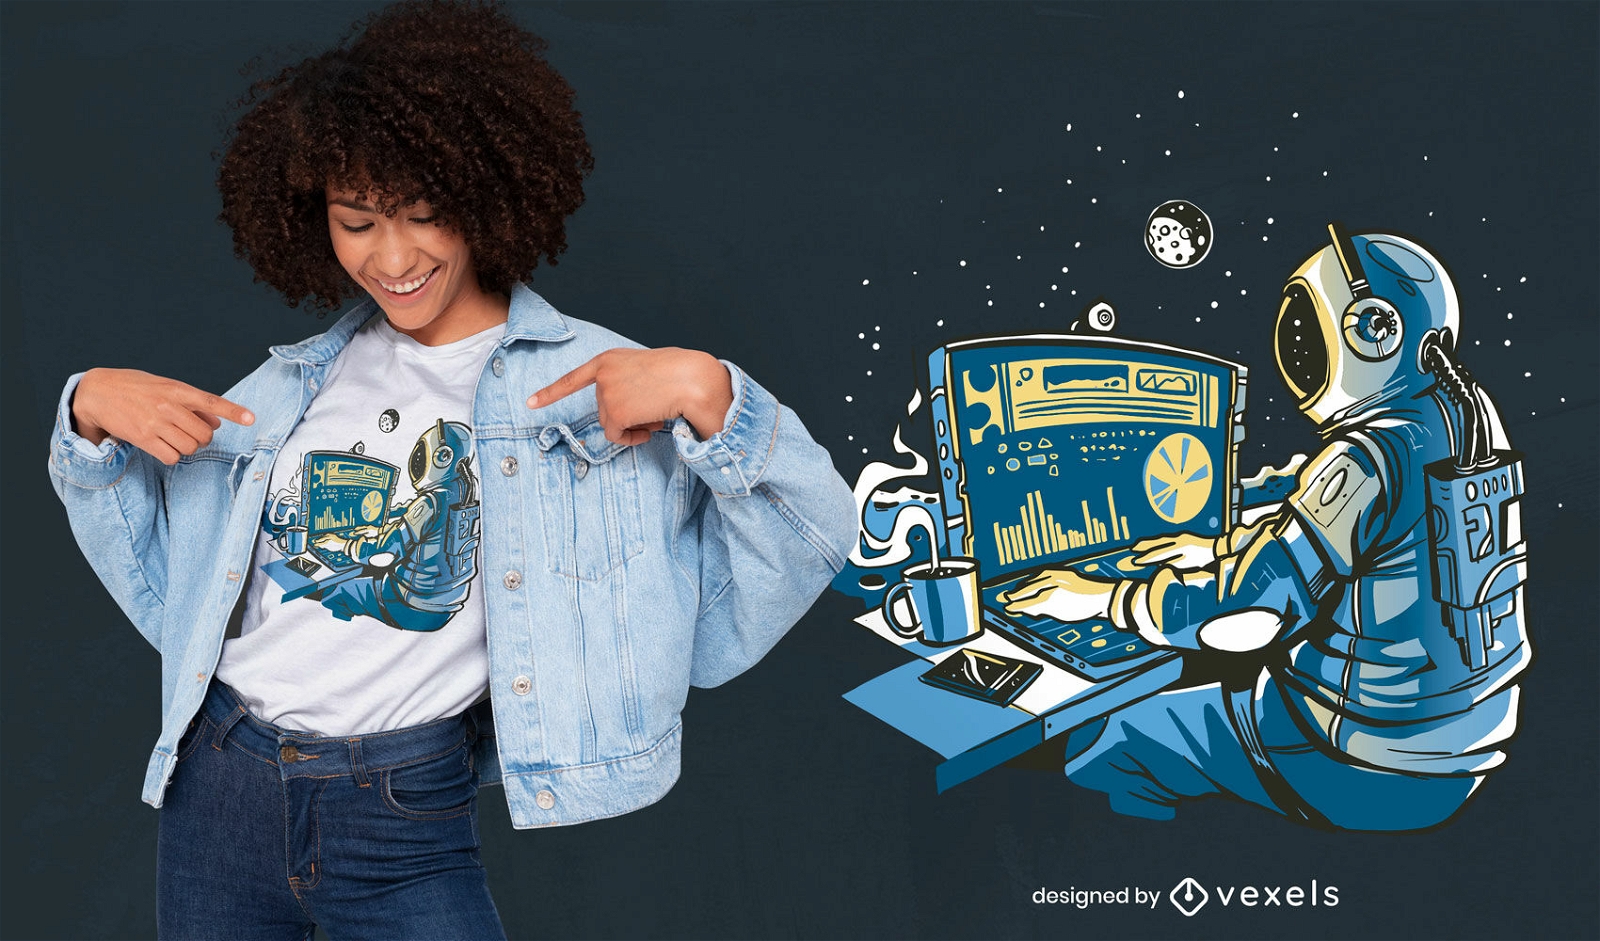
Astronauta espacial no design de uma camiseta para computador
Escolha uma pasta
Todos os favoritos
Criar novo
Salvar
Astronauta espacial no design de uma camiseta para computador
Pronto para imprimir
para Merch
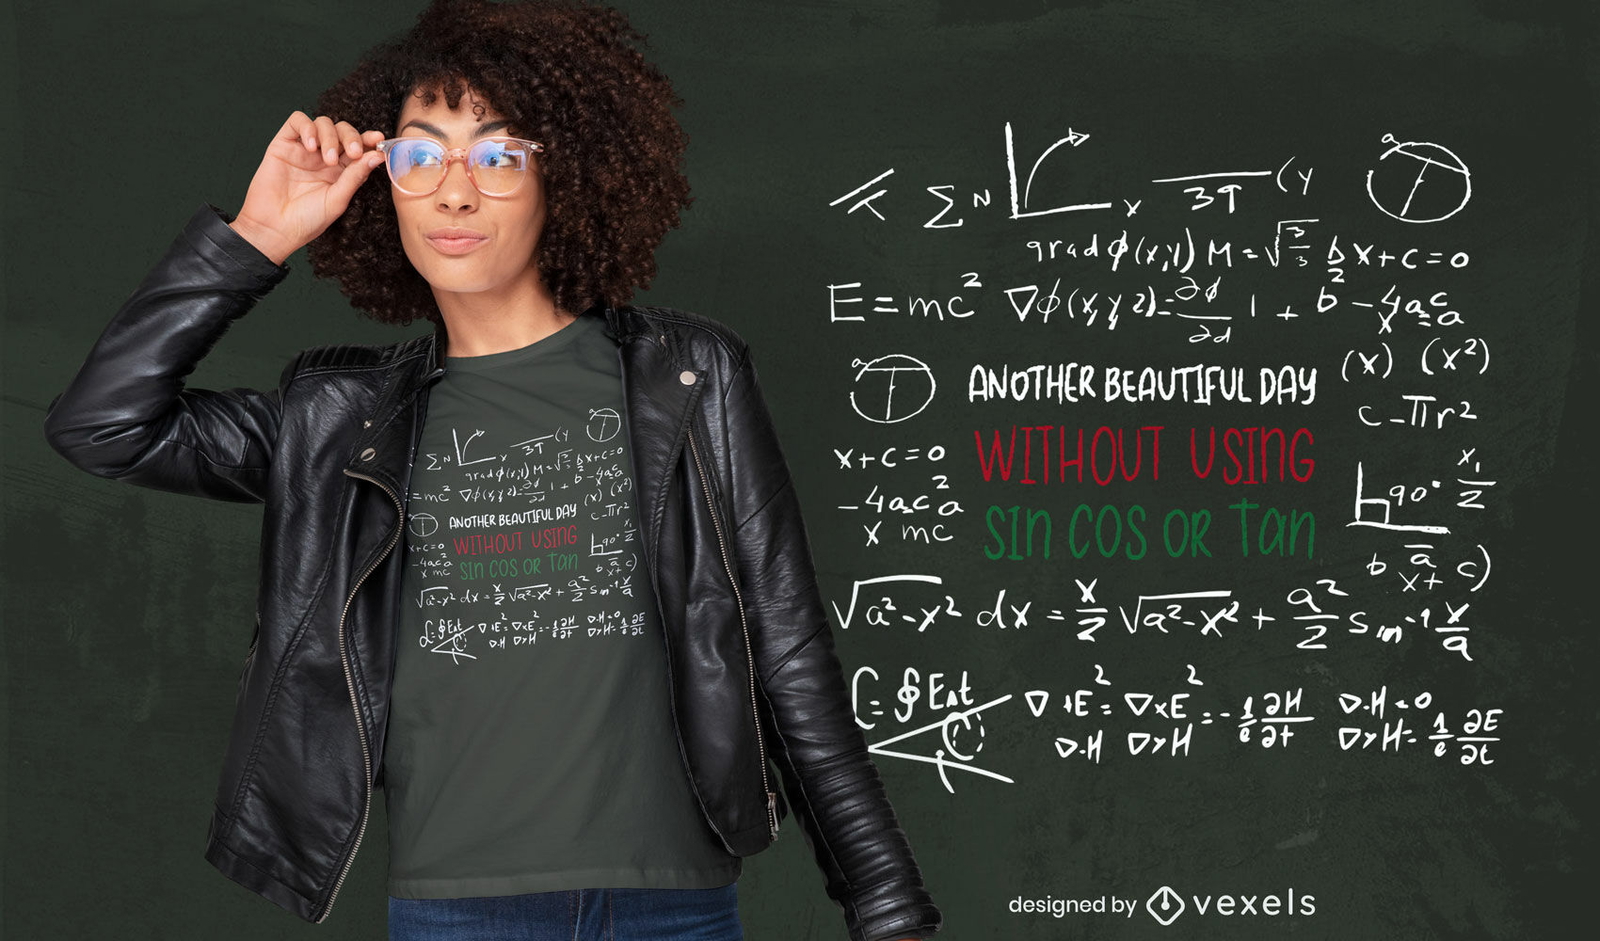
Design de t-shirt do quadro-negro para matemática e ciências
Escolha uma pasta
Todos os favoritos
Criar novo
Salvar
Design de t-shirt do quadro-negro para matemática e ciências
Pronto para imprimir
para Merch
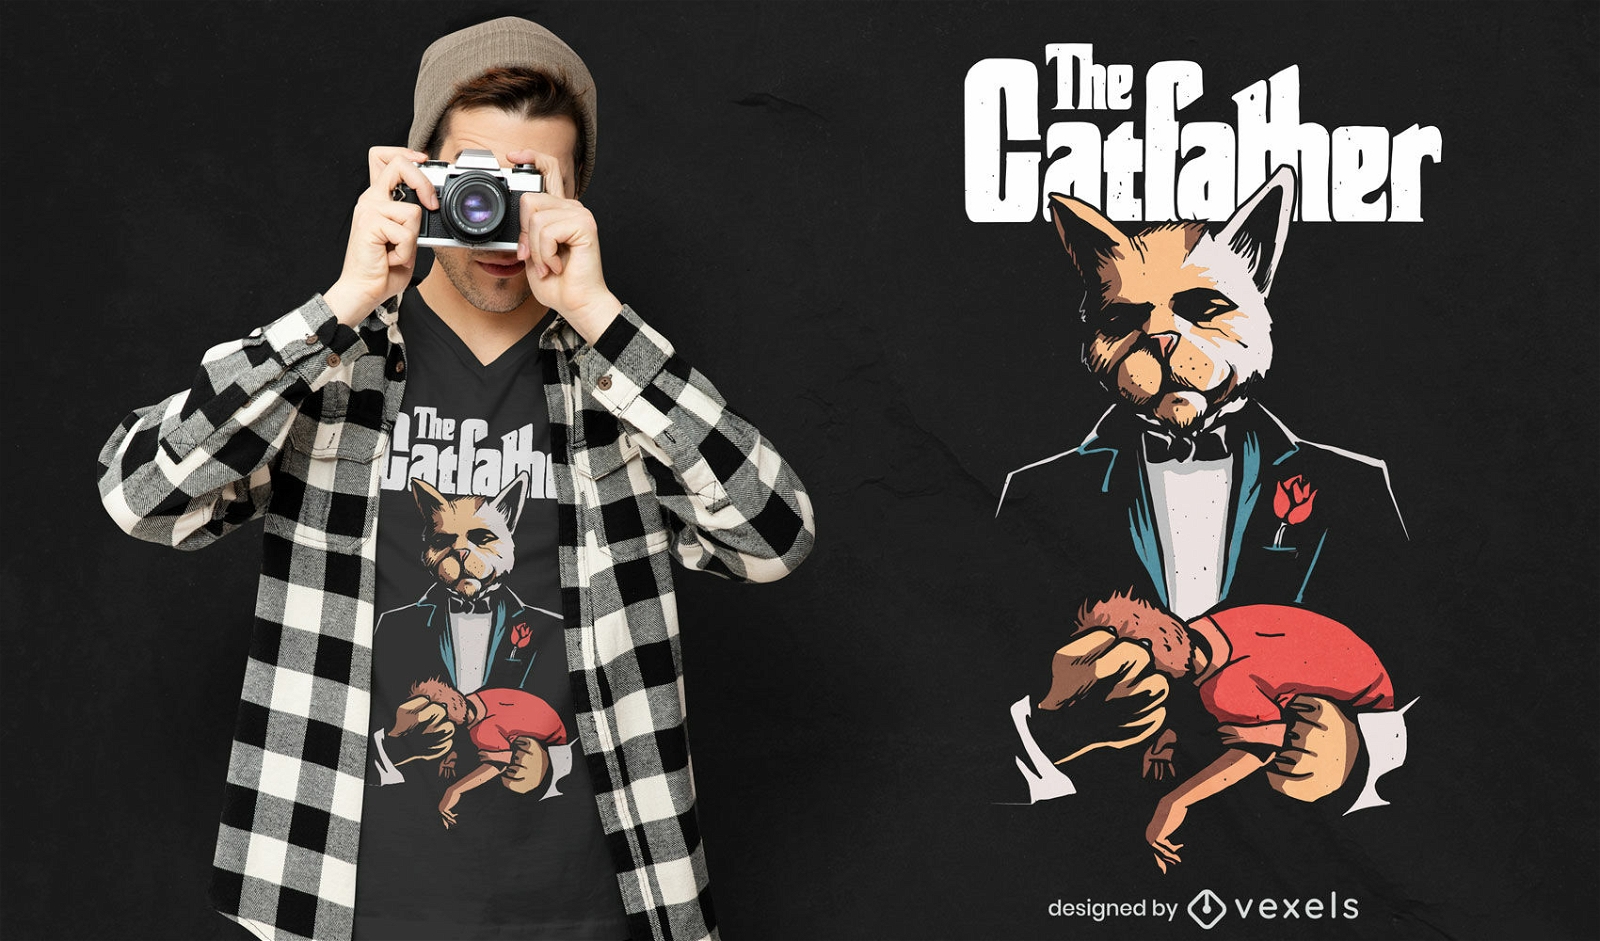
O design da camiseta catfather
Escolha uma pasta
Todos os favoritos
Criar novo
Salvar
O design da camiseta catfather
Pronto para imprimir
para Merch
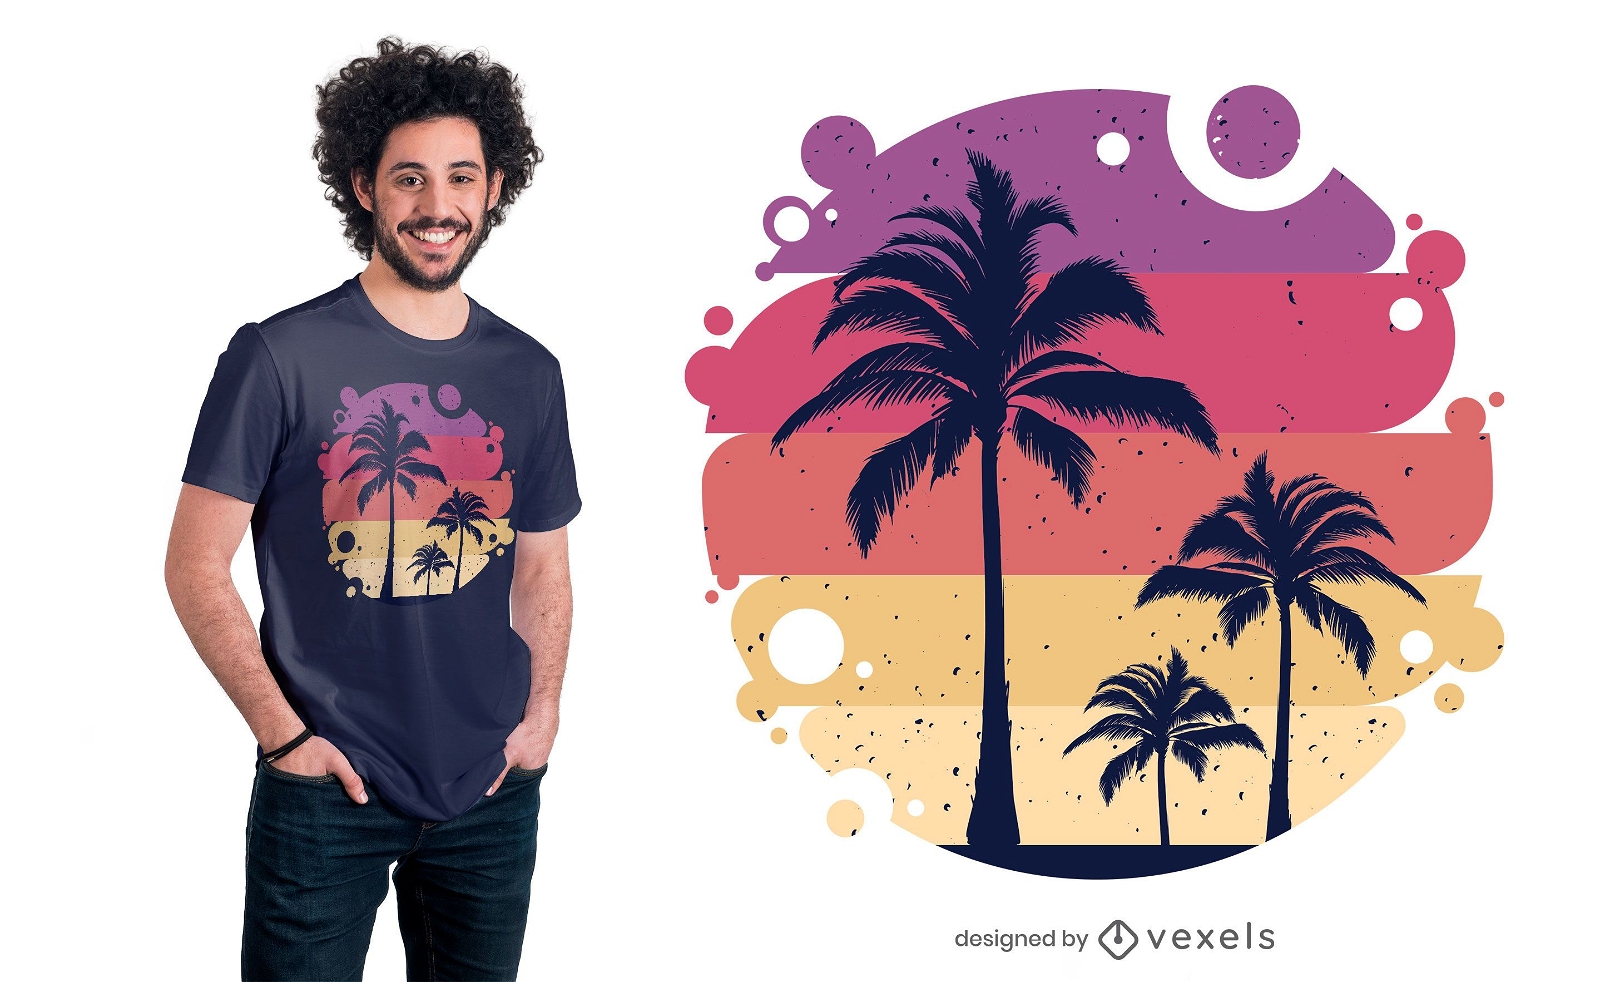
Design de camisetas tropicais de verão
Escolha uma pasta
Todos os favoritos
Criar novo
Salvar
Design de camisetas tropicais de verão
para Merch
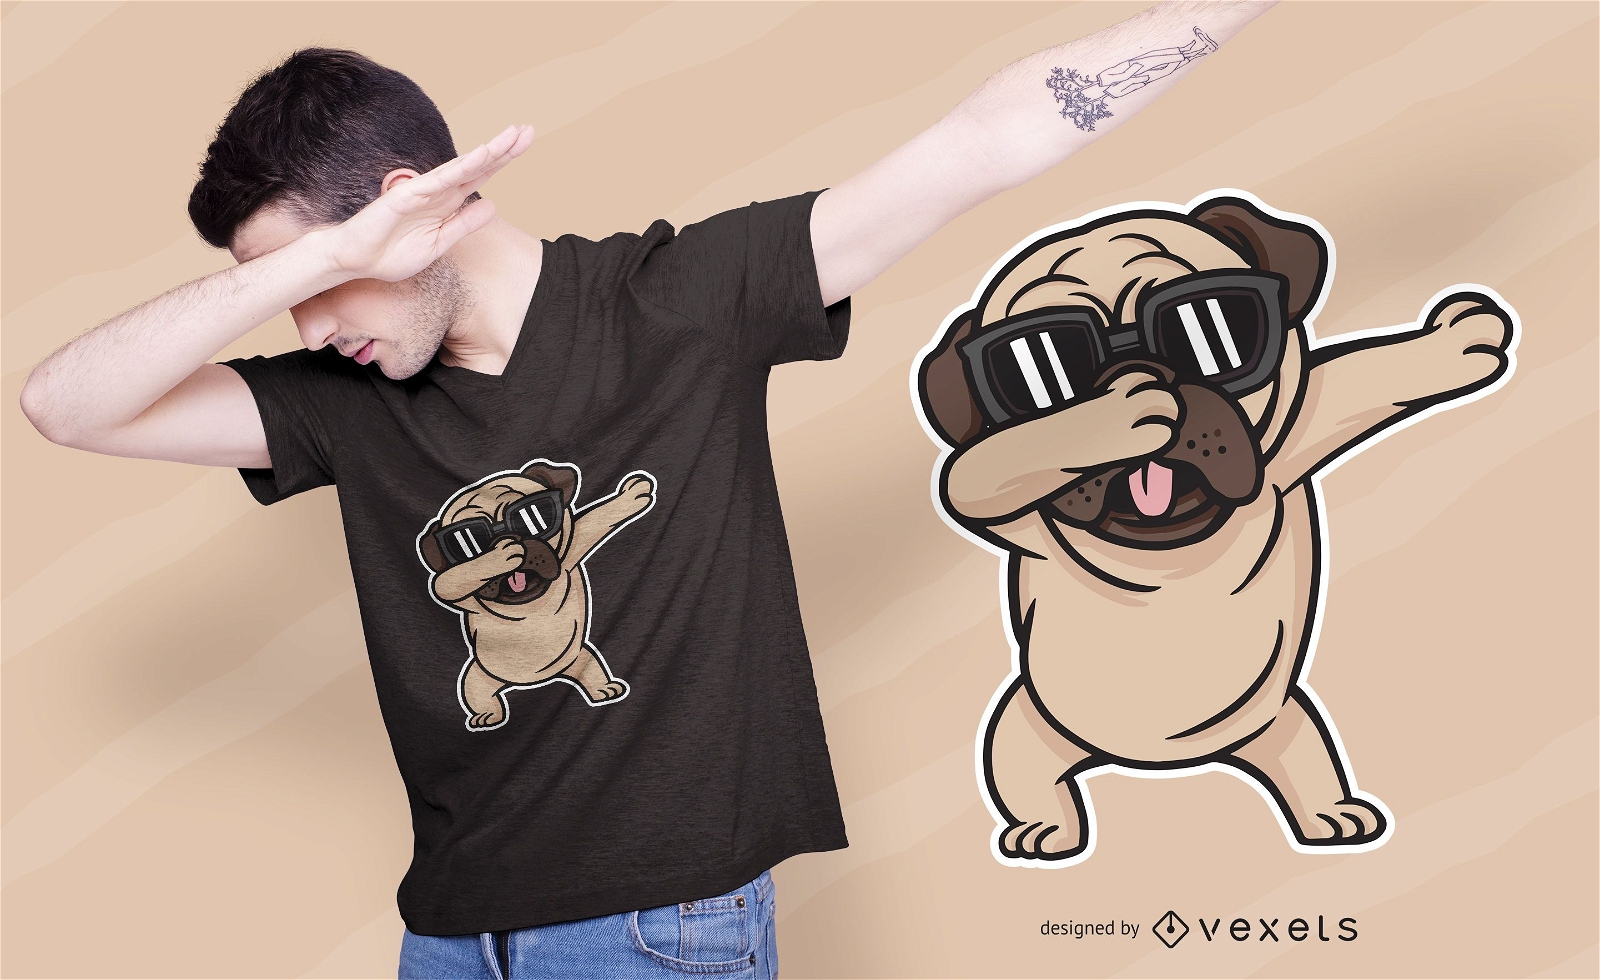
Design de camisetas para cães Pug Dabbing
Escolha uma pasta
Todos os favoritos
Criar novo
Salvar
Design de camisetas para cães Pug Dabbing
Pronto para imprimir
para Merch
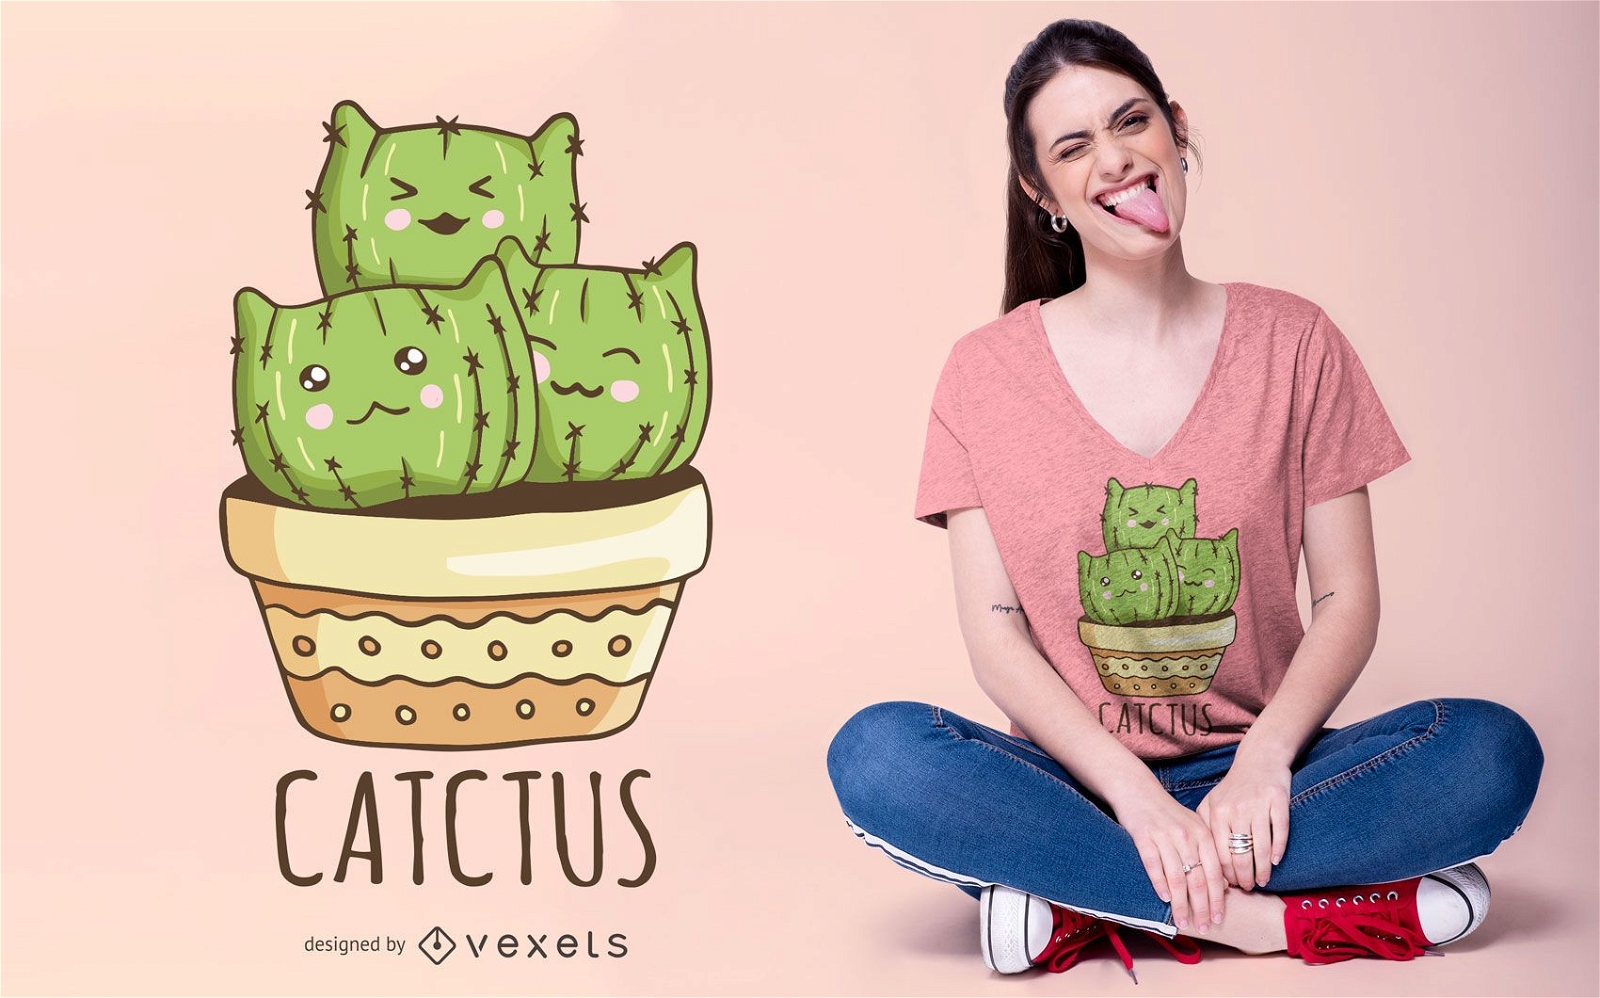
Design de camiseta Catctus
Escolha uma pasta
Todos os favoritos
Criar novo
Salvar
Design de camiseta Catctus
Pronto para imprimir
para Merch
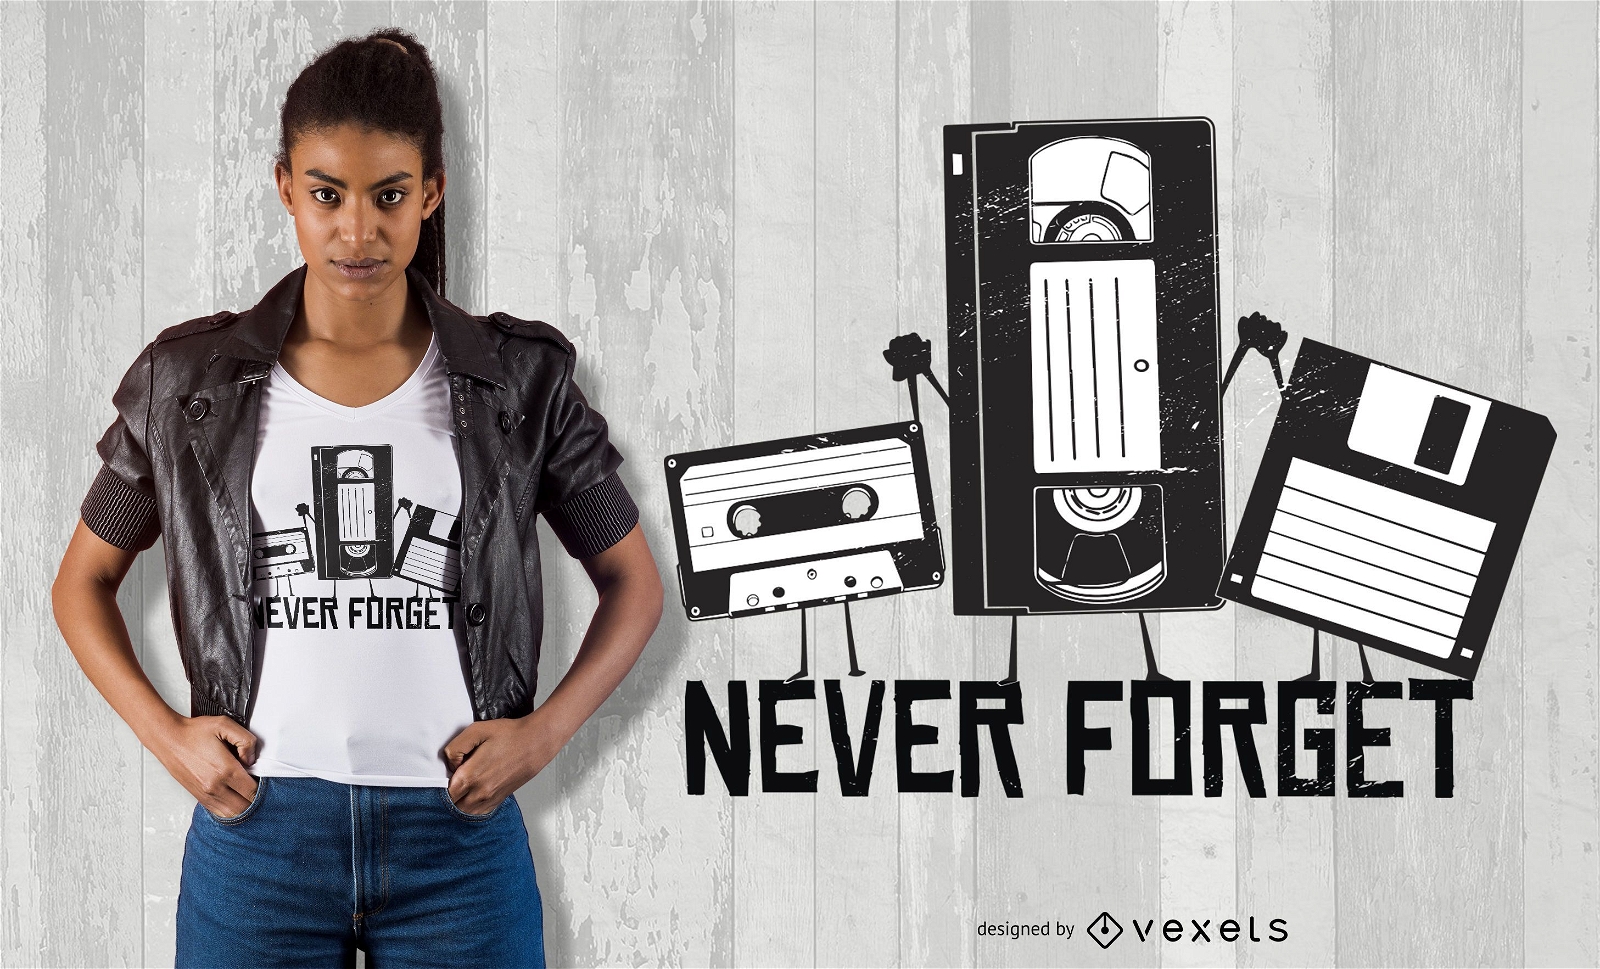
Nunca se esqueça do design engraçado da camiseta com fita adesiva
Escolha uma pasta
Todos os favoritos
Criar novo
Salvar
Nunca se esqueça do design engraçado da camiseta com fita adesiva
Pronto para imprimir
para Merch
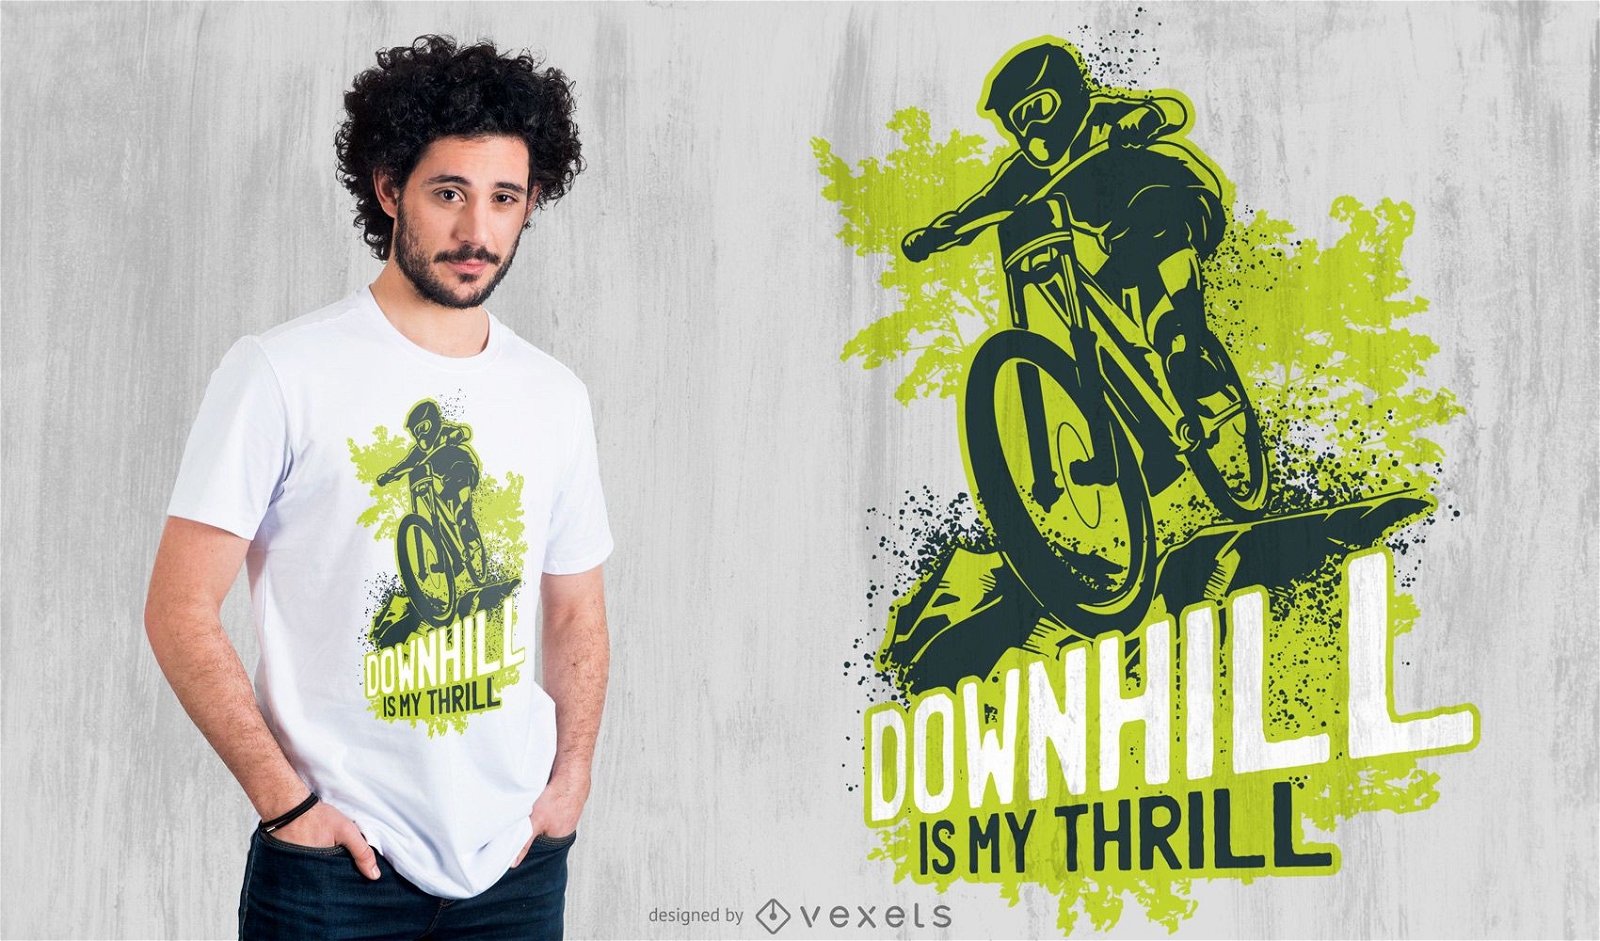
Design de camiseta para ciclismo downhill
Escolha uma pasta
Todos os favoritos
Criar novo
Salvar
Design de camiseta para ciclismo downhill
Pronto para imprimir
para Merch
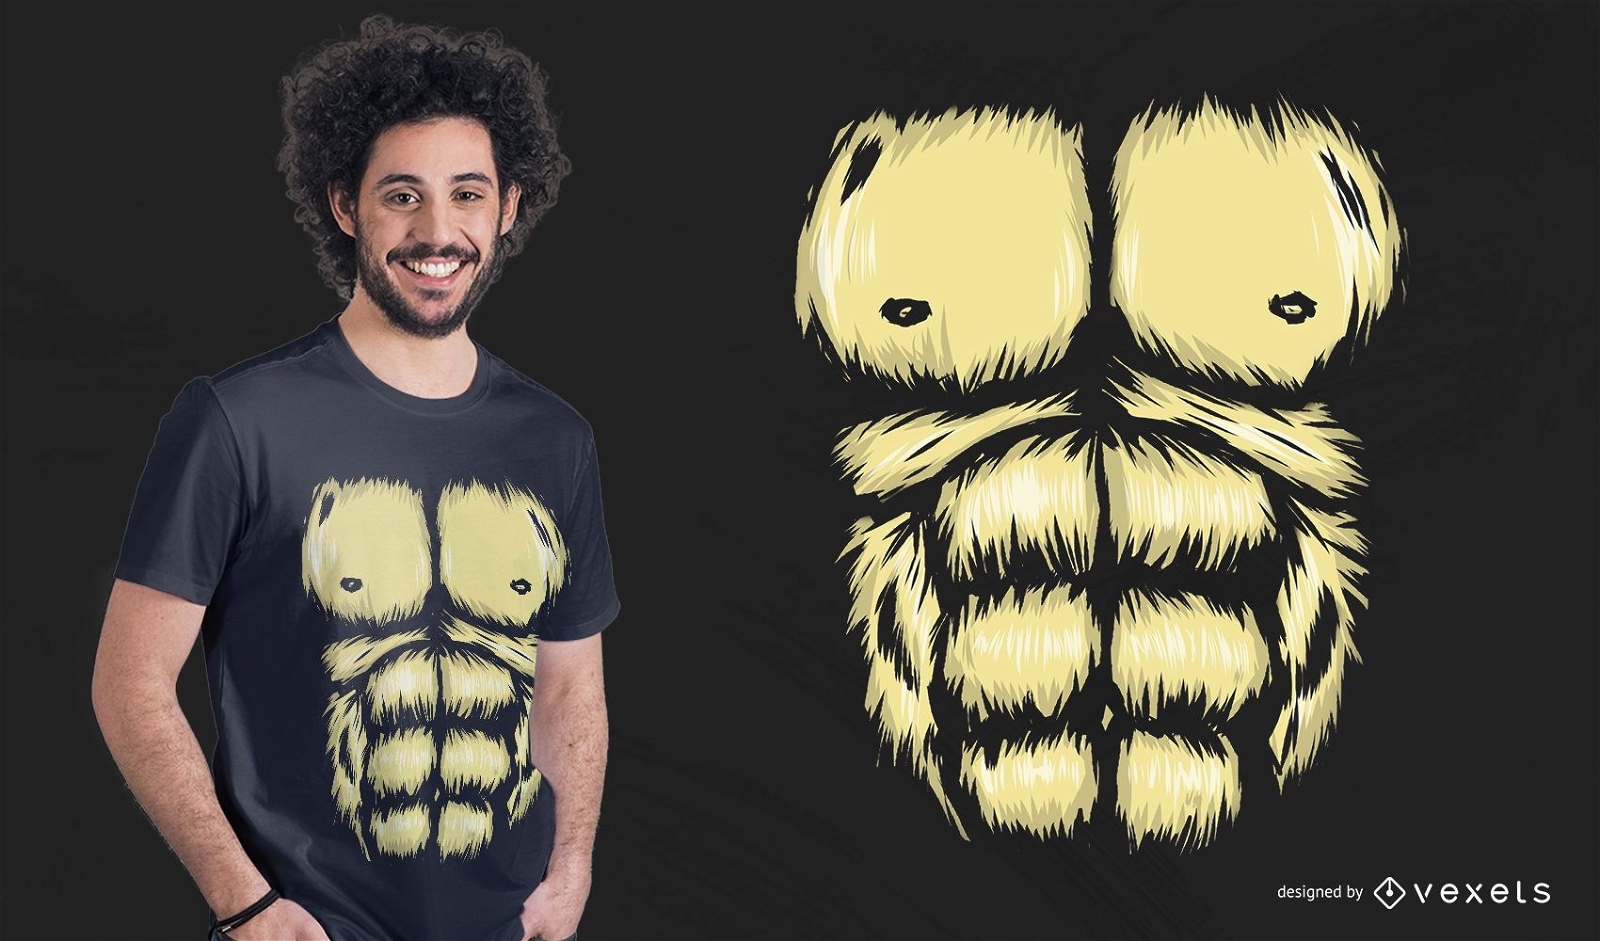
Design de camiseta com peito de gorila
Escolha uma pasta
Todos os favoritos
Criar novo
Salvar
Design de camiseta com peito de gorila
para Merch
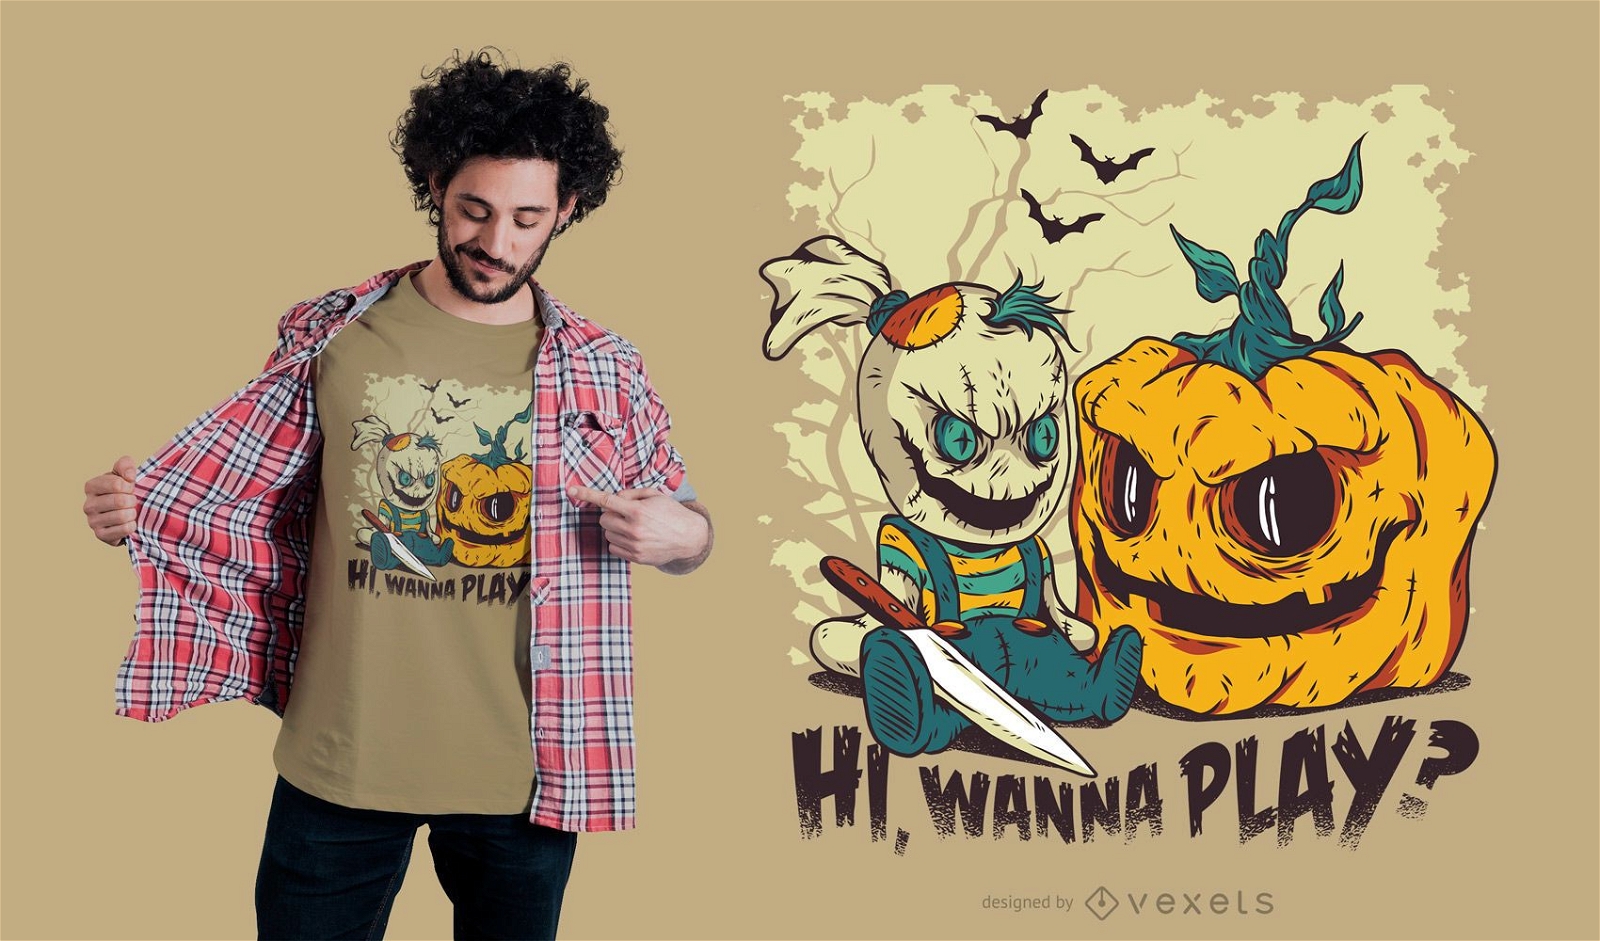
Design de camiseta do mal de Halloween
Escolha uma pasta
Todos os favoritos
Criar novo
Salvar
Design de camiseta do mal de Halloween
texto editável
Pronto para imprimir
para Merch
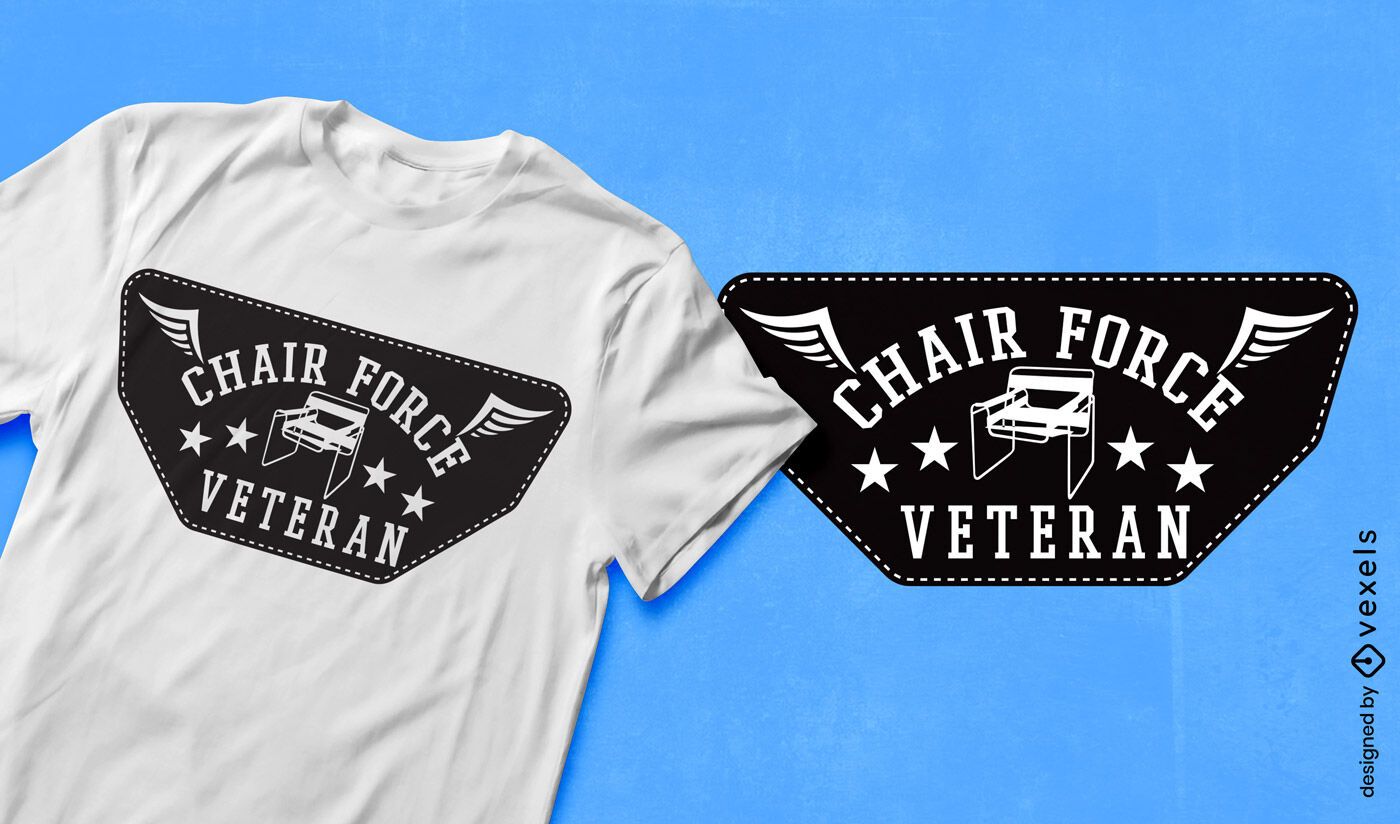
Design de camiseta com emblema de veterano da Chair Force
Escolha uma pasta
Todos os favoritos
Criar novo
Salvar
Design de camiseta com emblema de veterano da Chair Force
texto editável
Pronto para imprimir
para Merch
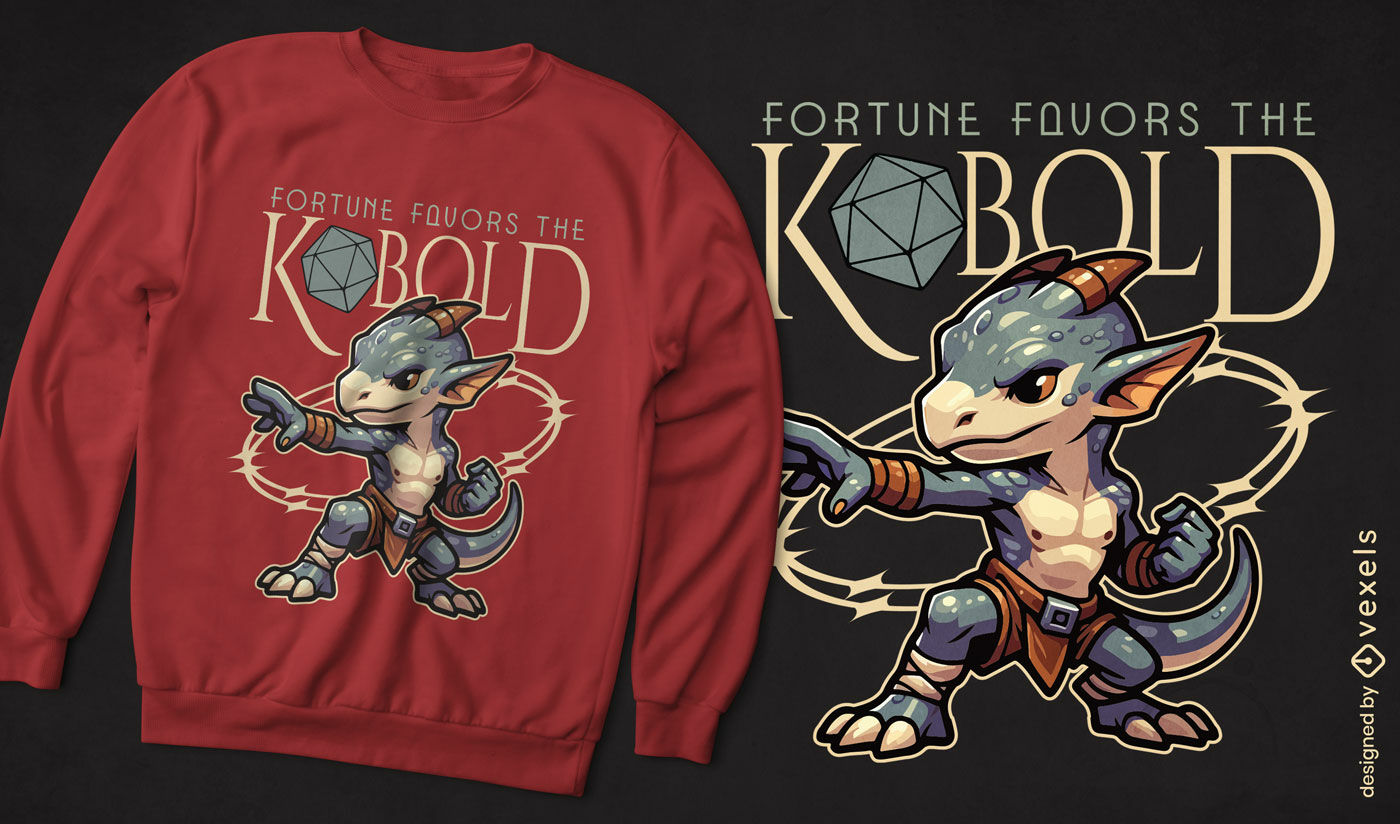
Design de camiseta do personagem Chibi Kobold
Escolha uma pasta
Todos os favoritos
Criar novo
Salvar
Design de camiseta do personagem Chibi Kobold
Pronto para imprimir
para Merch
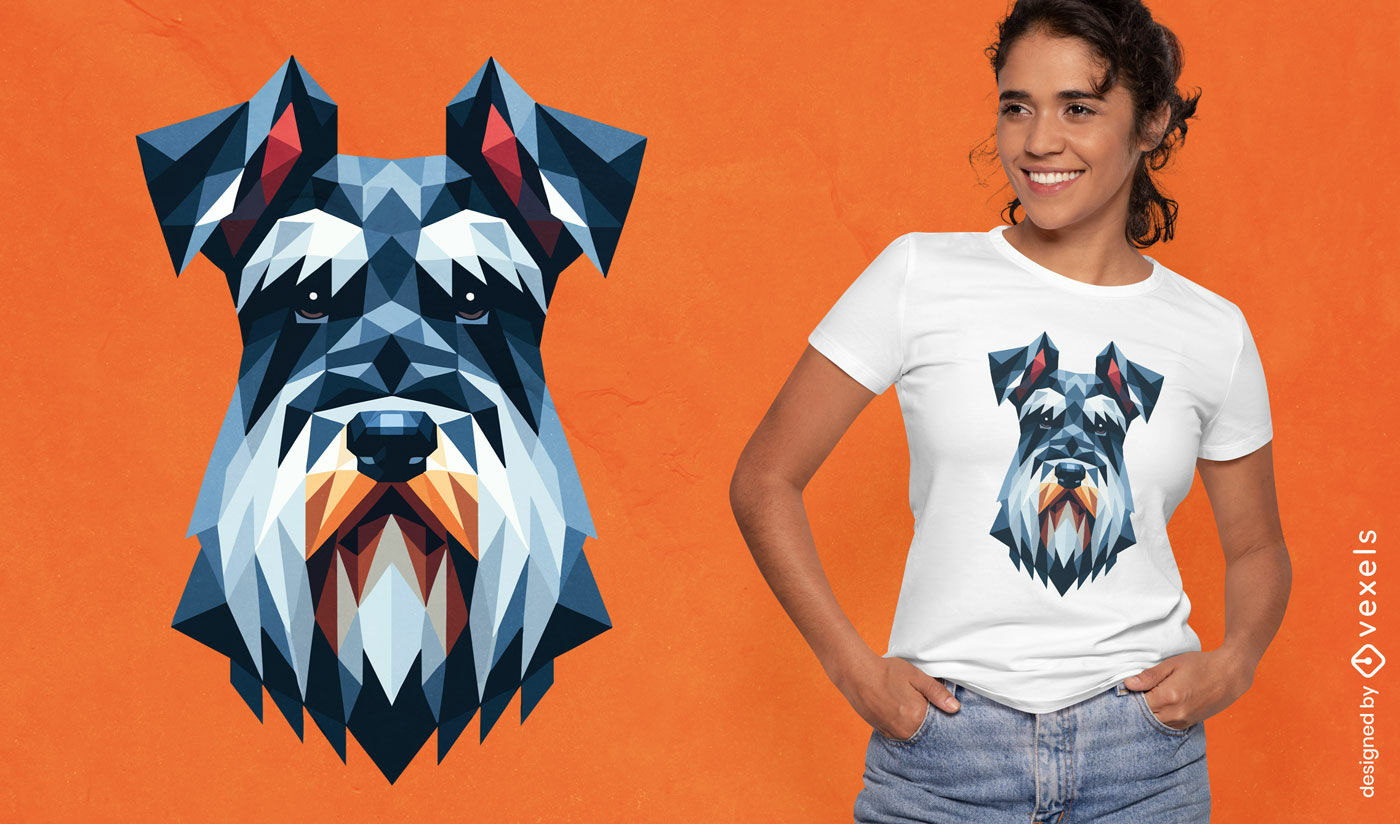
Design geométrico para camiseta de cachorro Schnauzer
Escolha uma pasta
Todos os favoritos
Criar novo
Salvar
Design geométrico para camiseta de cachorro Schnauzer
Pronto para imprimir
para Merch
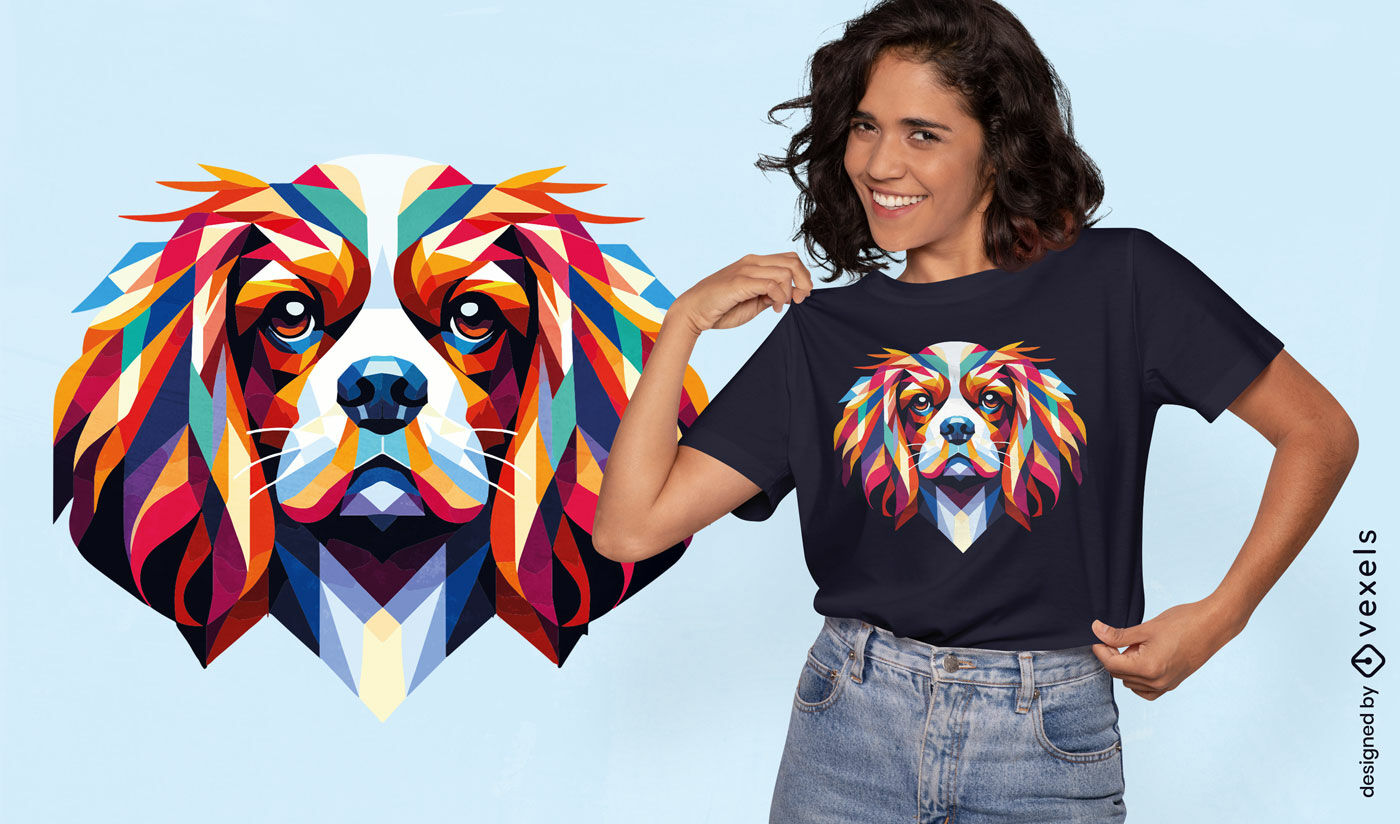
Design de camiseta Cavalier King Spaniel
Escolha uma pasta
Todos os favoritos
Criar novo
Salvar
Design de camiseta Cavalier King Spaniel
Pronto para imprimir
para Merch
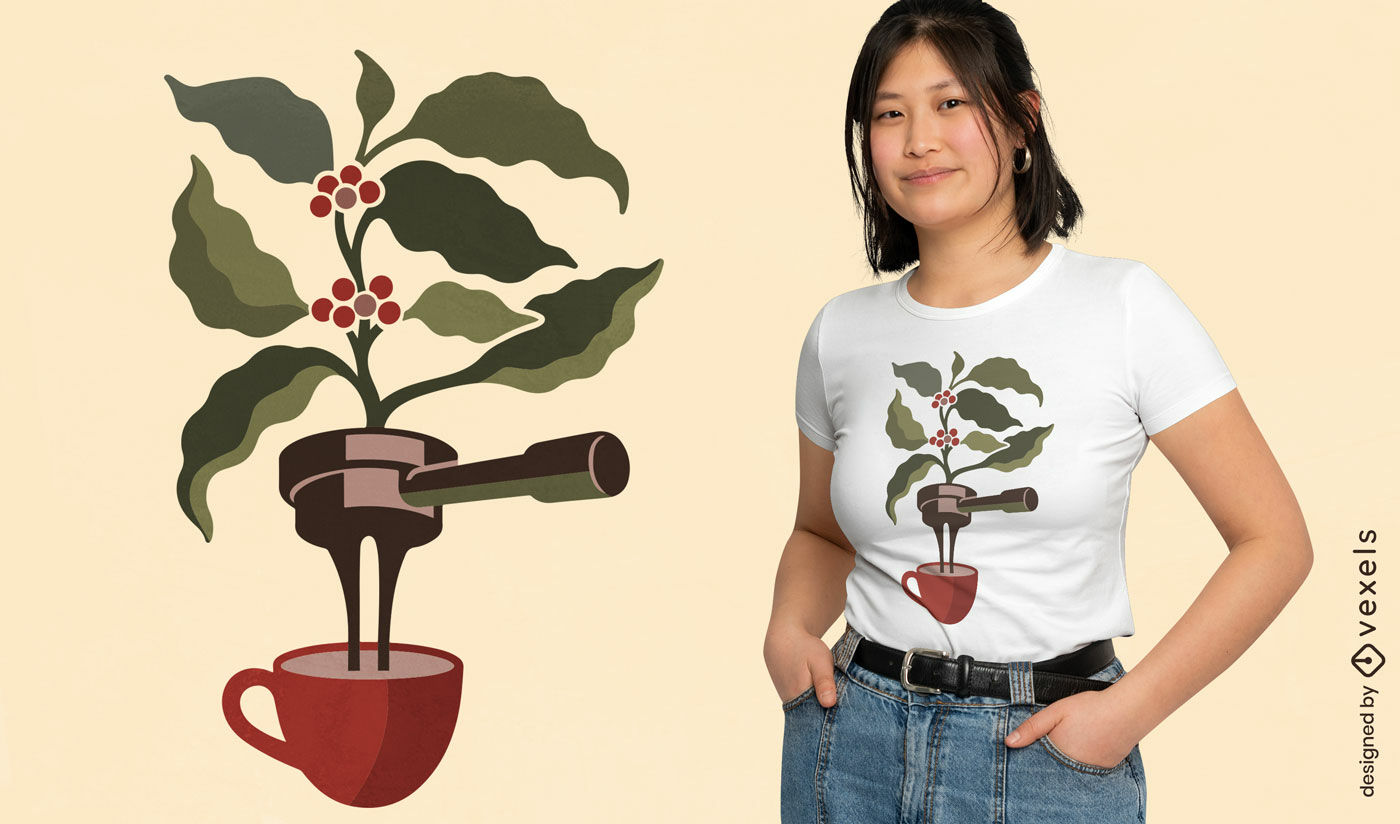
Design de camiseta com planta de café expresso
Escolha uma pasta
Todos os favoritos
Criar novo
Salvar
Design de camiseta com planta de café expresso
texto editável
Pronto para imprimir
para Merch
Design de camiseta com estampa de coração anatômico
Escolha uma pasta
Todos os favoritos
Criar novo
Salvar
Design de camiseta com estampa de coração anatômico
texto editável
Pronto para imprimir
para Merch
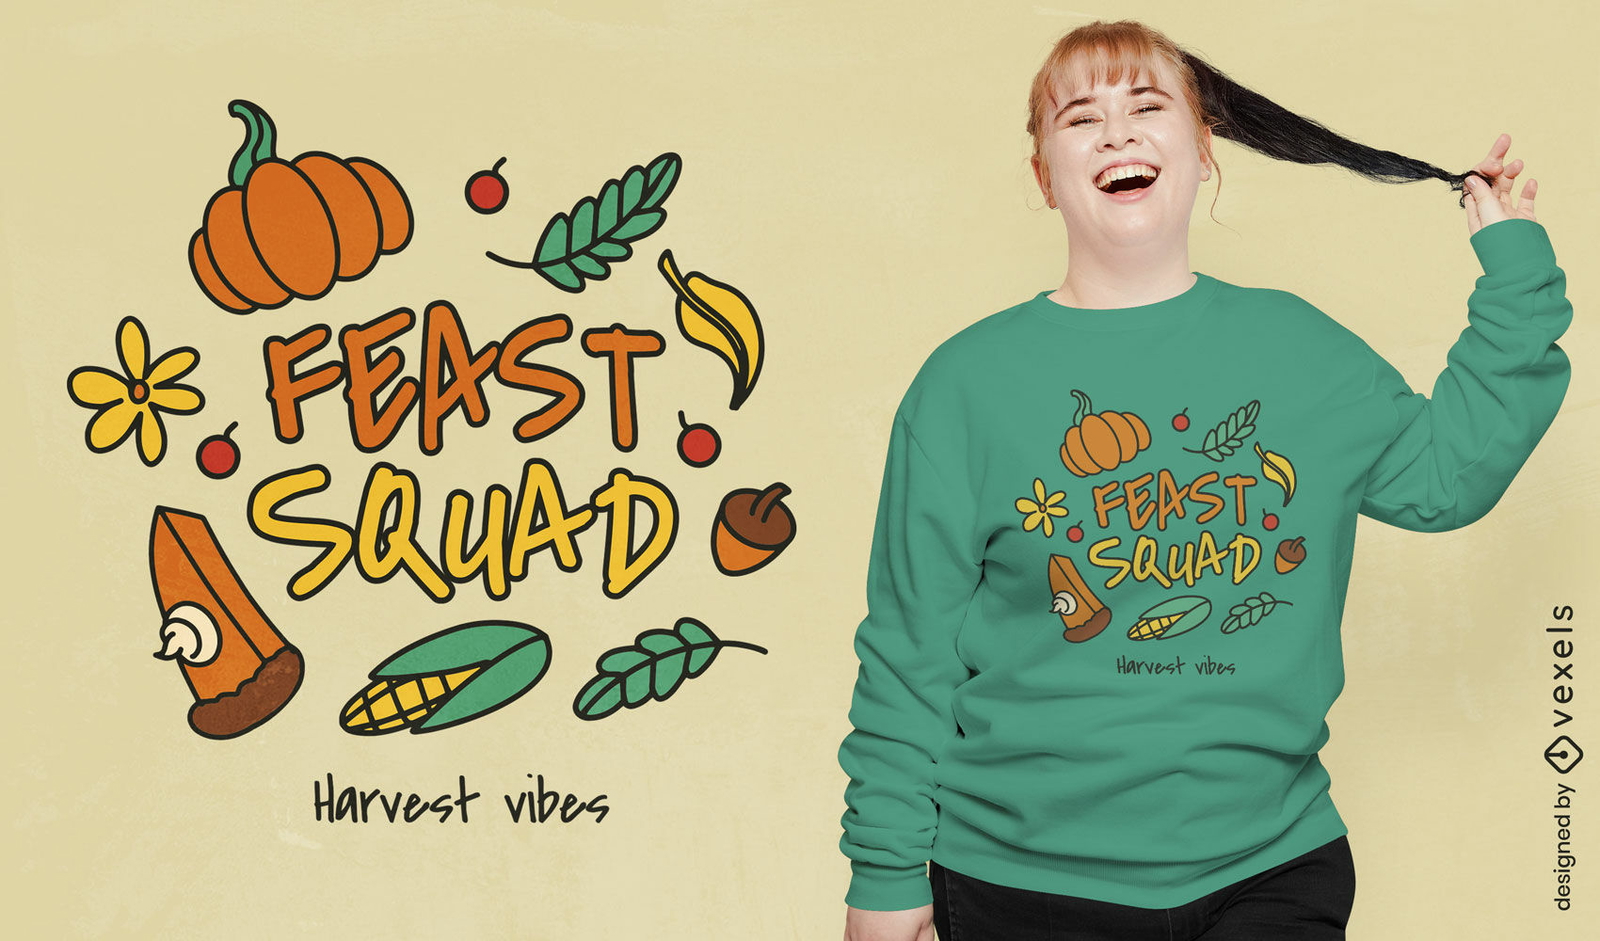
Design de camiseta com ícones da colheita do esquadrão de festa
Escolha uma pasta
Todos os favoritos
Criar novo
Salvar
Design de camiseta com ícones da colheita do esquadrão de festa
texto editável
Pronto para imprimir
para Merch
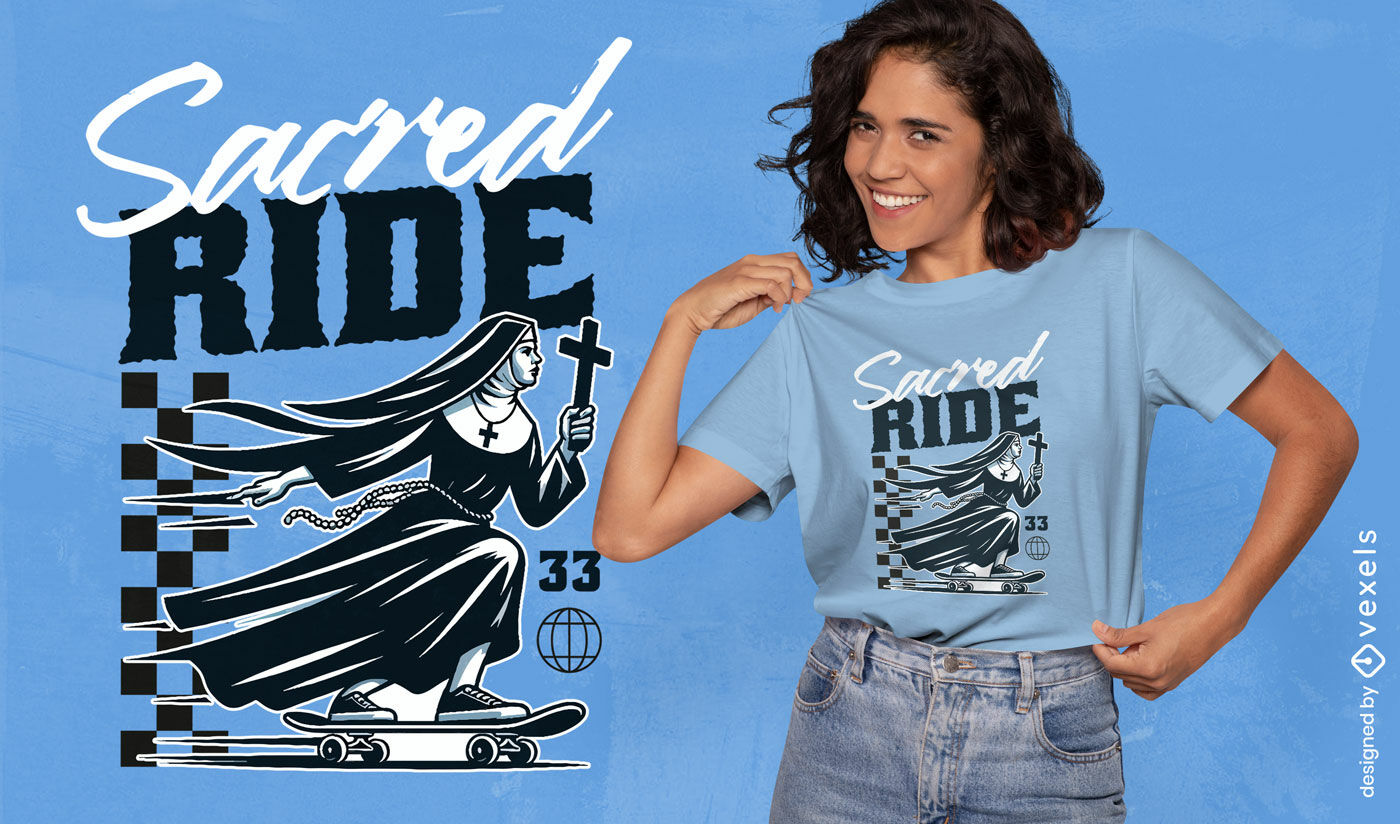
Design de camiseta de freira skatista
Escolha uma pasta
Todos os favoritos
Criar novo
Salvar
Design de camiseta de freira skatista
Impulsione seu negócio
Com a plataforma gráfica líder de mercado.
Ver planos
Próxima
do 546
prev page
next page