Biblioteca de design
Novos designs Merch
Camisetas
Vectores
Designs de Merch de Tendência
PNGs & SVGs
Mockups
Modelos de T-Shirt PSD
Explorar Desenhos
Designs KDP
Pôsteres
Canecas
Capas para celular
Sacos de compras
Almofadas
Ferramentas de desenho
Merch Designer
Novo!
Mockup Generator
Gerador de Design de AI
Vetorizador
Quote Generator
T-Shirt Maker (Antigo)
Ajuda
Merch Digest
Blog
Centro de Ajuda
Saiba mais sobre o Merch
Feedback
Soluções Corporativas
Empresa
Acesso à API
Estúdio de Design
Design em Lote
Preços
Carregando...
Inscrever-se
Conecte-se
Merch Vectors
graficos
Biblioteca de design
Novos designs Merch
Camisetas
Vectores
Designs de Merch de Tendência
PNGs & SVGs
Mockups
Modelos de T-Shirt PSD
Explorar Desenhos
Designs KDP
Pôsteres
Canecas
Capas para celular
Sacos de compras
Almofadas
Ferramentas de desenho
Merch Designer
Novo!
Mockup Generator
Gerador de Design de AI
Vetorizador
Quote Generator
T-Shirt Maker (Antigo)
Ajuda
Merch Digest
Blog
Centro de Ajuda
Saiba mais sobre o Merch
Feedback
Soluções Corporativas
Empresa
Acesso à API
Estúdio de Design
Design em Lote
PLANOS
Merch Vectors
graficos
27291 Designs Vetoriais de graficos para Camisetas e Merch
Baixar e comprar Designs Vetoriais AI de graficos para Camisetas, Capas do Celular, Capas do Livros e outros produtos Merch
Relacionado:
graficos vetoriais
,
desenhos graficos de ações
,
graficos tridimensionais
Ordenar por
Mais relevante
Resultados patrocinados da
Ganhe 15% de desconto com o código: VEXELS15
veja mais detalhes
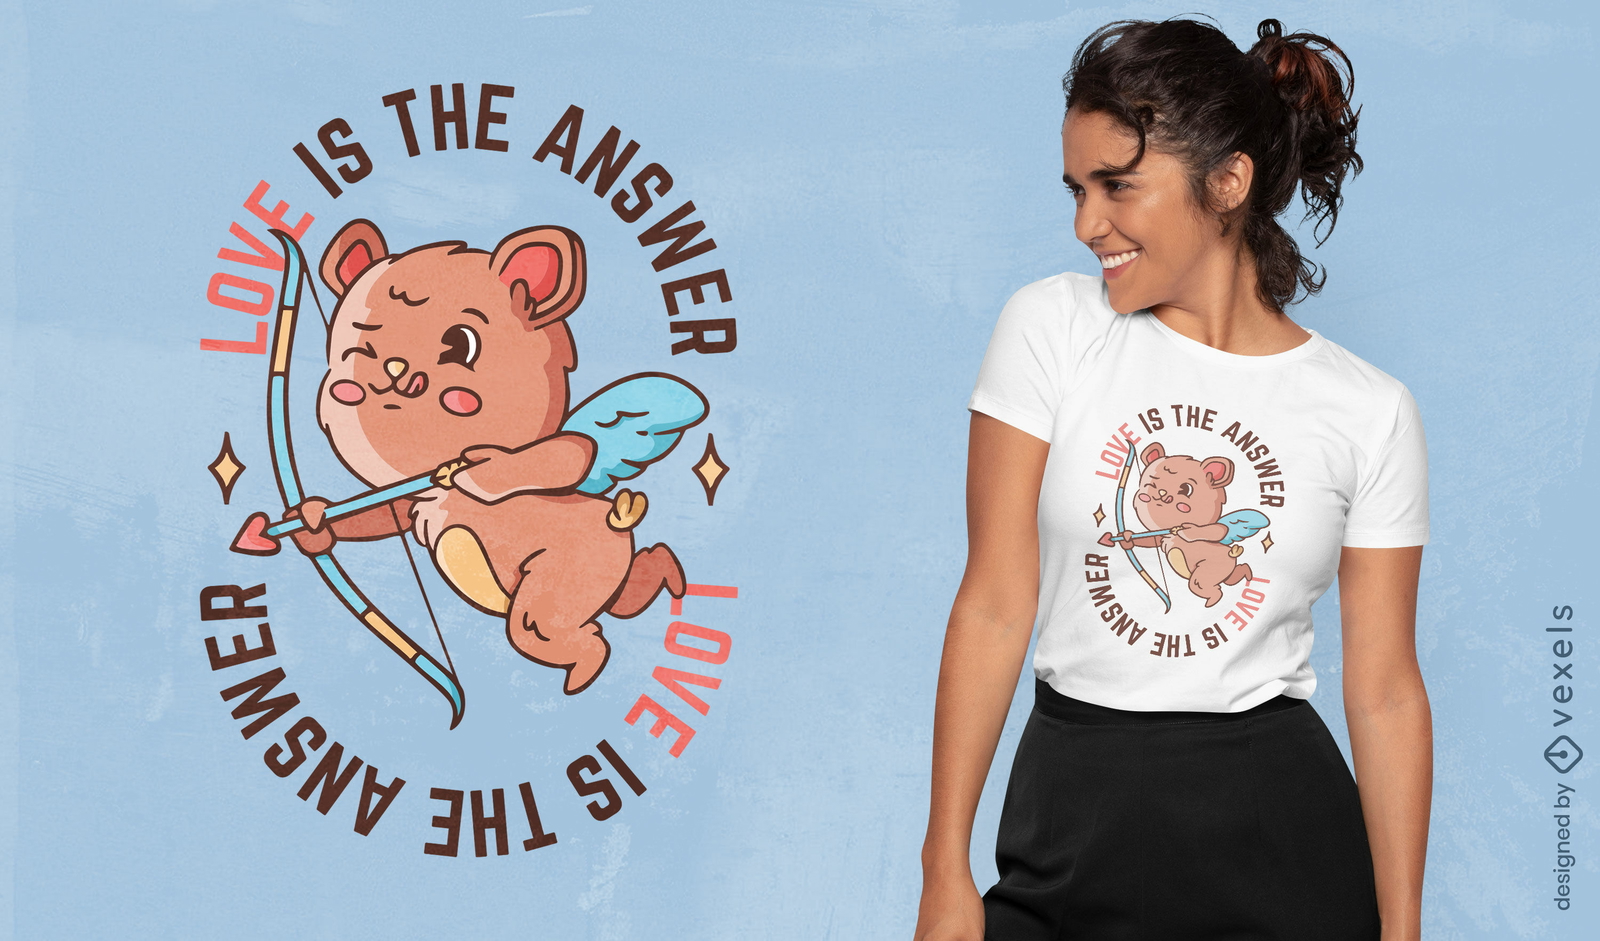
Pronto para imprimir
para Merch
Design de camiseta de dia dos namorados com urso cupido
Escolha uma pasta
Todos os favoritos
Criar novo
Salvar
Design de camiseta de dia dos namorados com urso cupido
Pronto para imprimir
para Merch
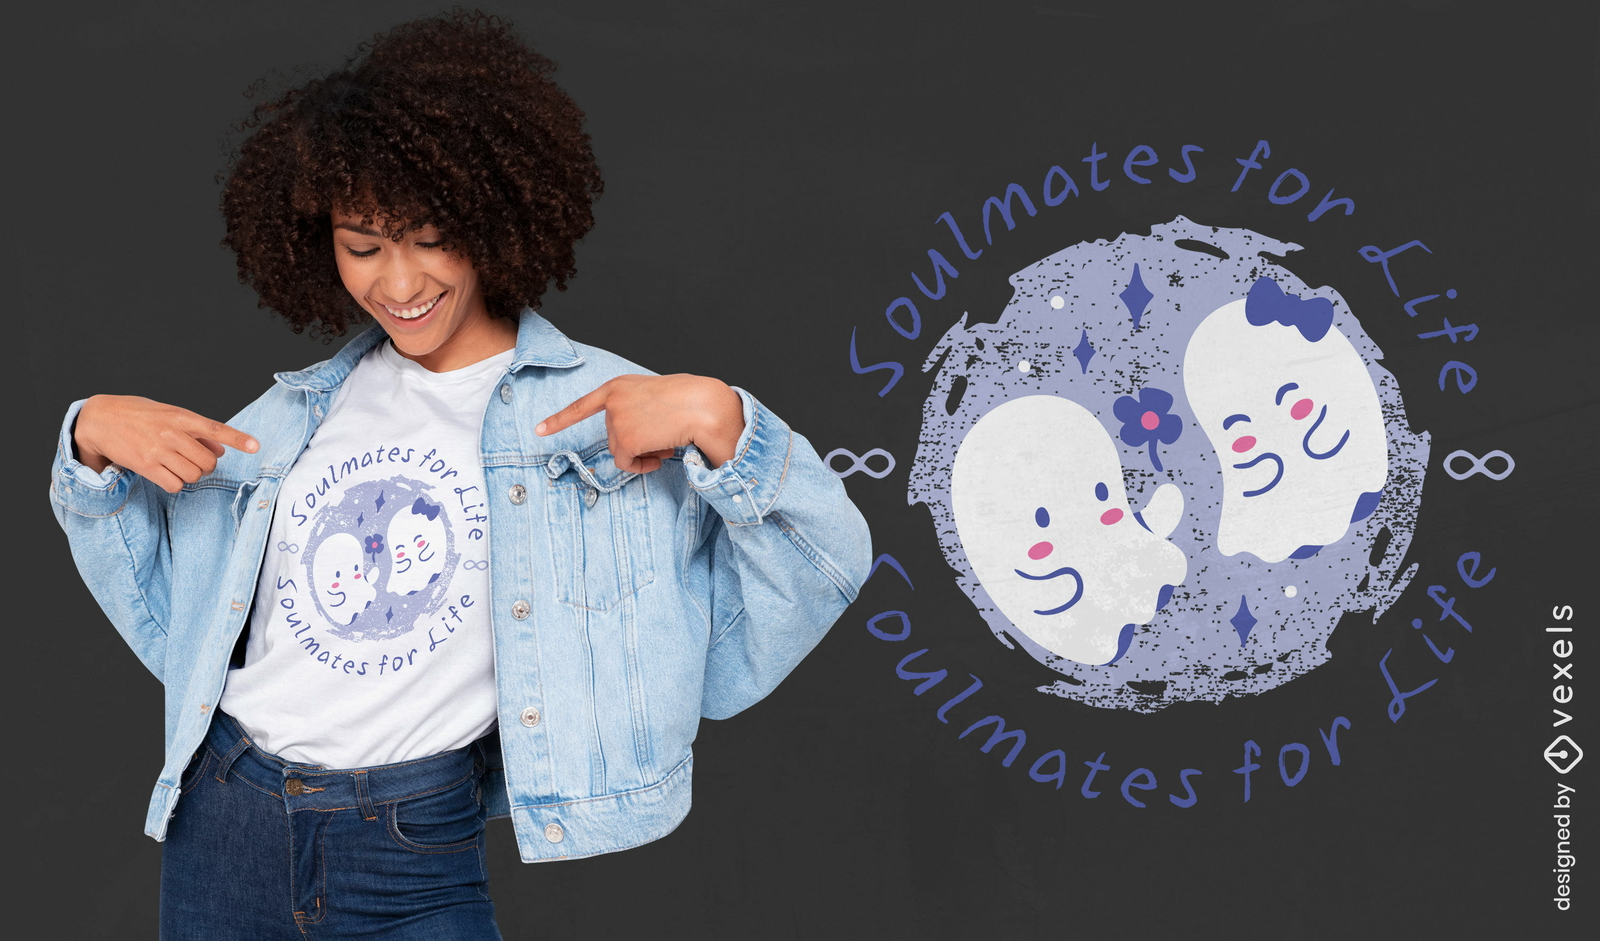
Design de camiseta com almas fofas
Escolha uma pasta
Todos os favoritos
Criar novo
Salvar
Design de camiseta com almas fofas
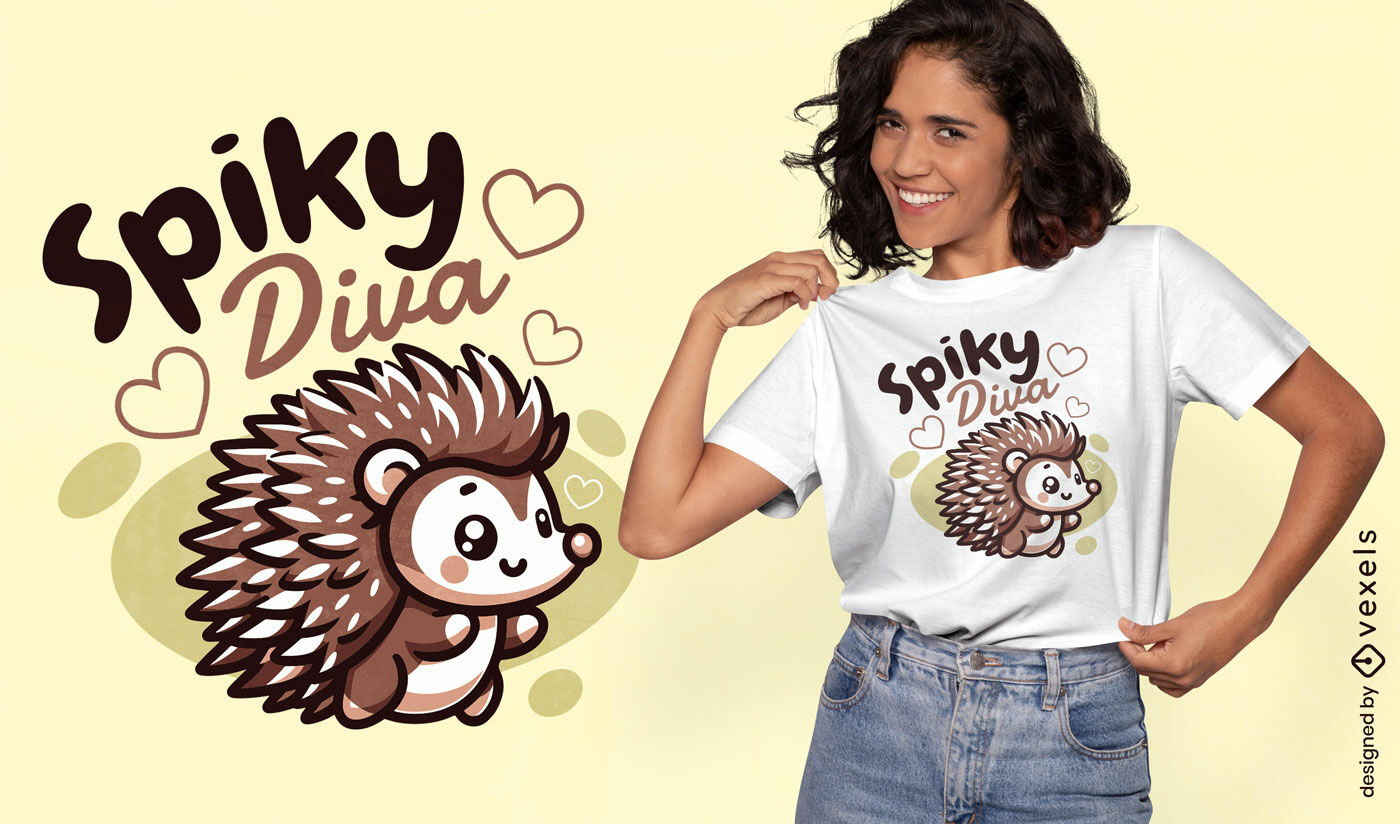
Gerado por IA, selecionado por nossos designers.
para Merch
Design de camiseta com ouriço diva espetado
Escolha uma pasta
Todos os favoritos
Criar novo
Salvar
Design de camiseta com ouriço diva espetado
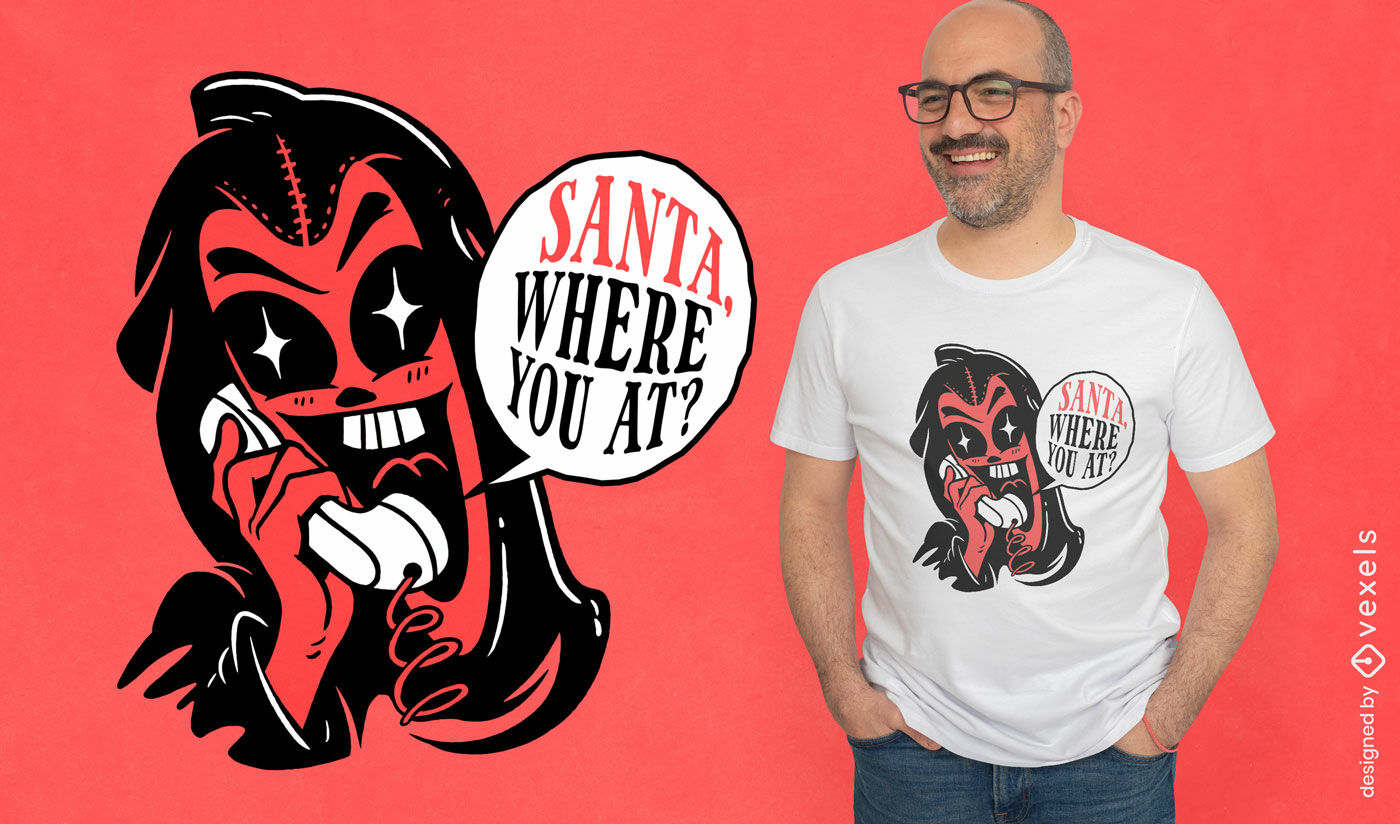
texto editável
Pronto para imprimir
para Merch
Design de camiseta "Devil calling Santa"
Escolha uma pasta
Todos os favoritos
Criar novo
Salvar
Design de camiseta "Devil calling Santa"
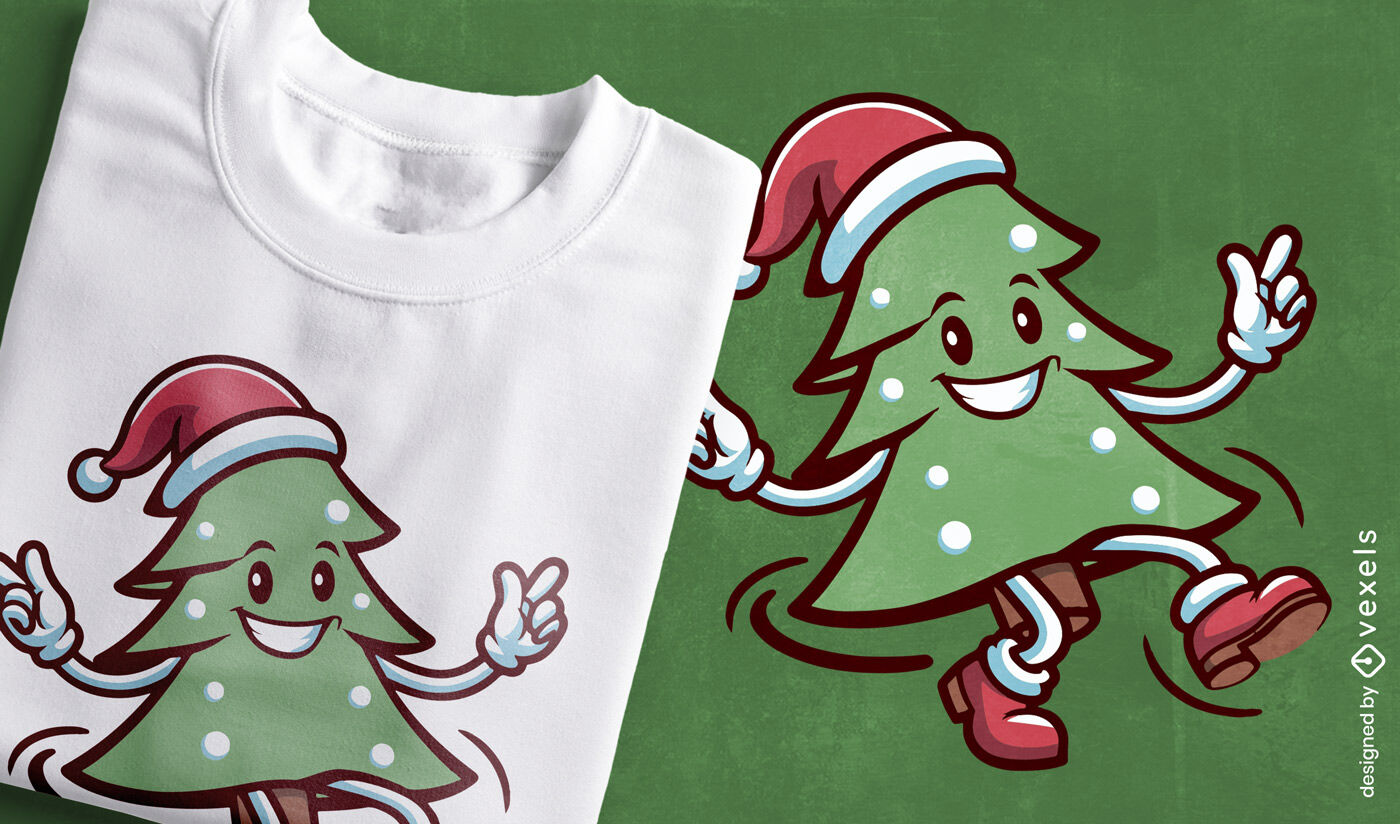
Gerado por IA, selecionado por nossos designers.
para Merch
Design de camiseta com árvore de natal dançante
Escolha uma pasta
Todos os favoritos
Criar novo
Salvar
Design de camiseta com árvore de natal dançante
Gerado por IA, selecionado por nossos designers.
para Merch
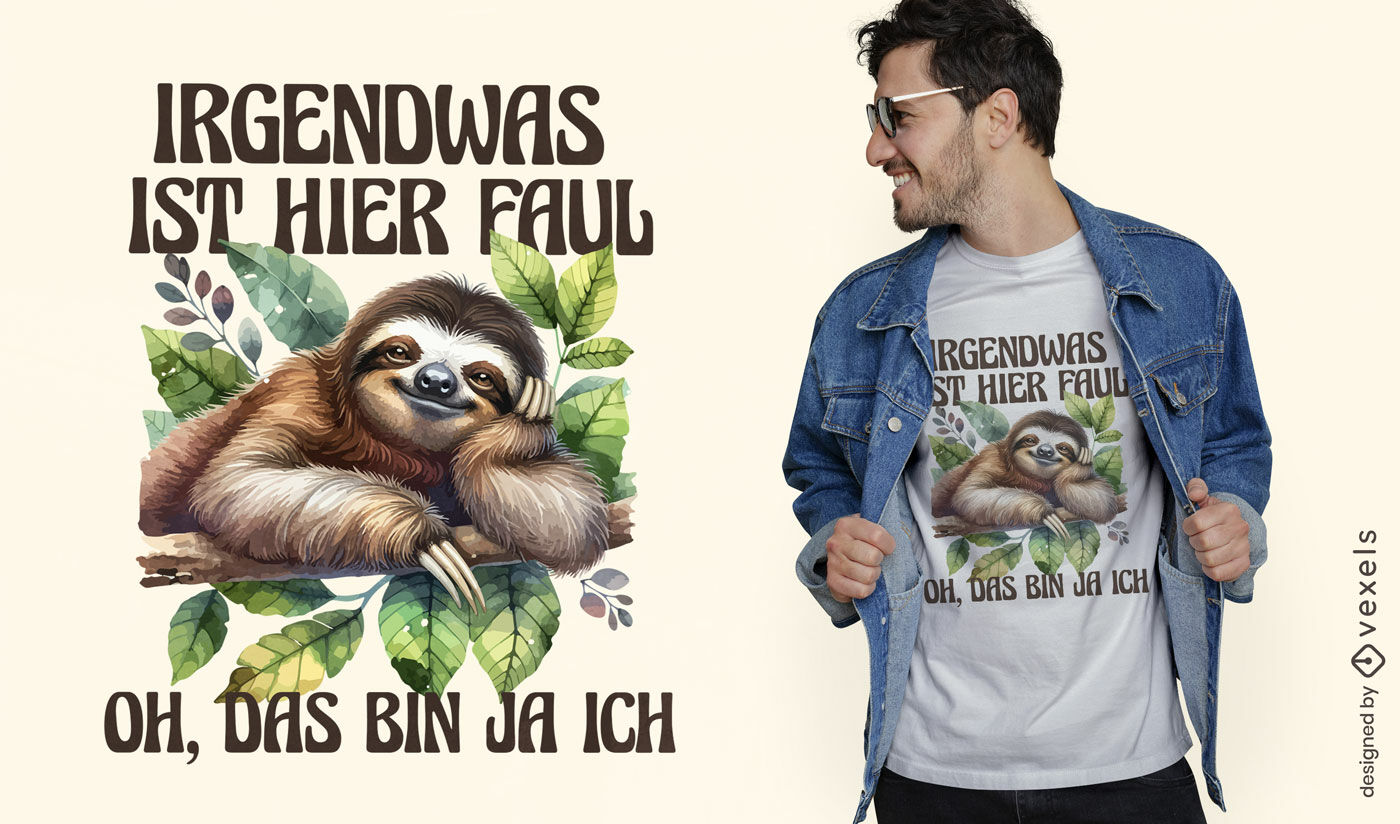
Design de camiseta aquarela preguiça alemã
Escolha uma pasta
Todos os favoritos
Criar novo
Salvar
Design de camiseta aquarela preguiça alemã
texto editável
Pronto para imprimir
para Merch
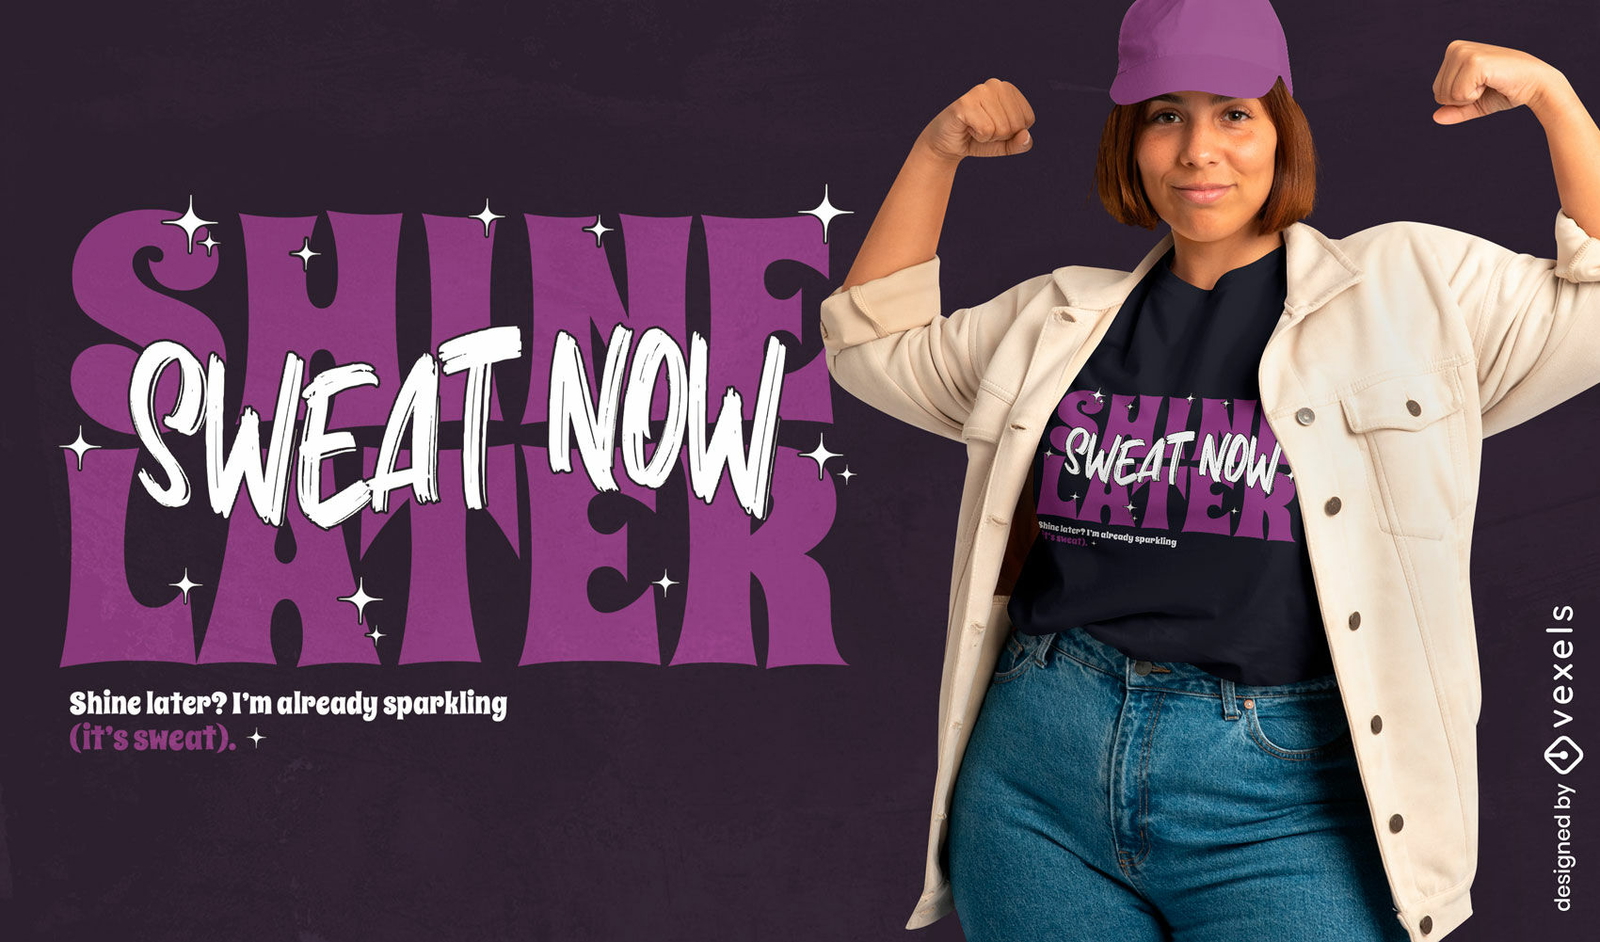
Design de camiseta Brilhe agora, sue depois
Escolha uma pasta
Todos os favoritos
Criar novo
Salvar
Design de camiseta Brilhe agora, sue depois
Gerado por IA, selecionado por nossos designers.
para Merch
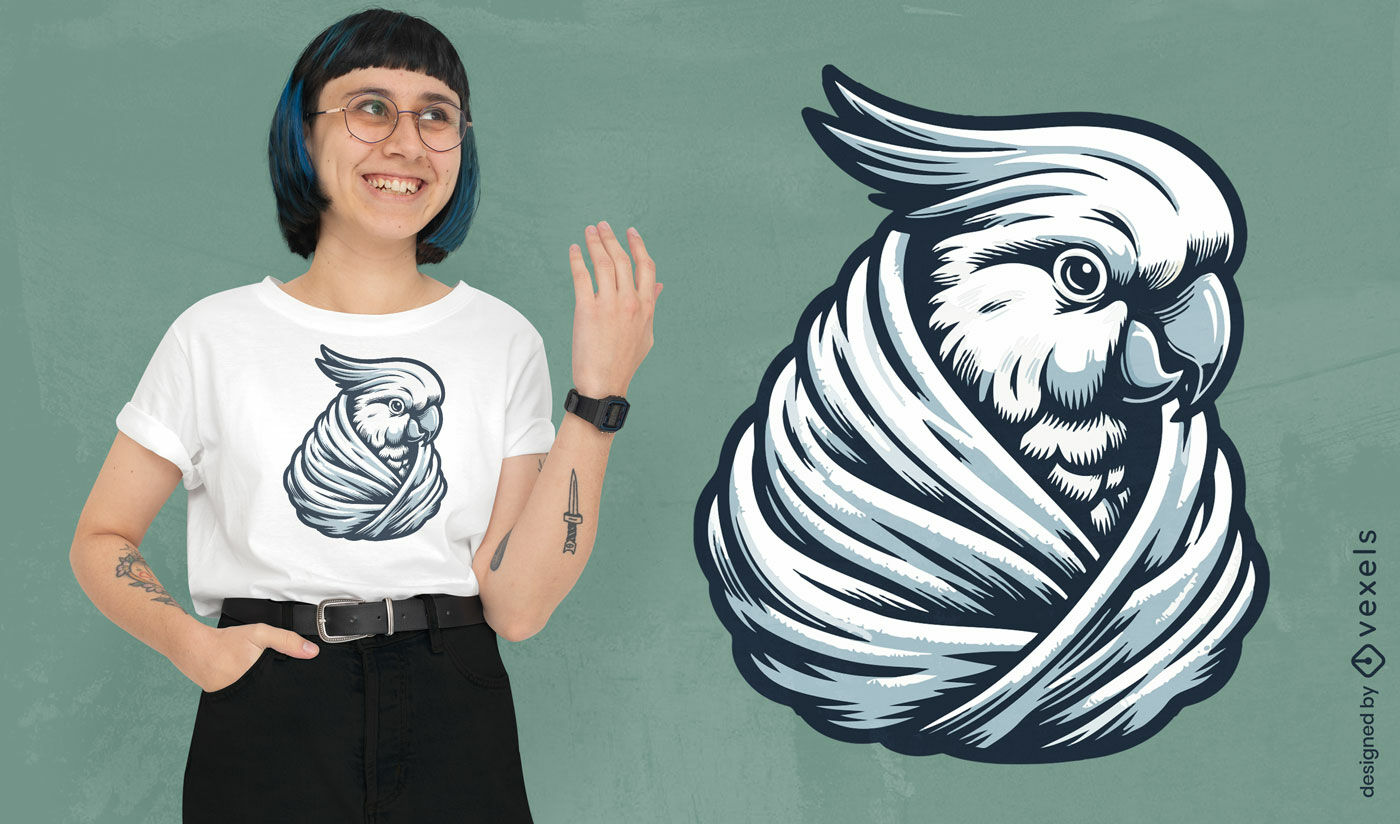
Design de camiseta com perfil lateral de cacatua
Escolha uma pasta
Todos os favoritos
Criar novo
Salvar
Design de camiseta com perfil lateral de cacatua
Gerado por IA, selecionado por nossos designers.
para Merch
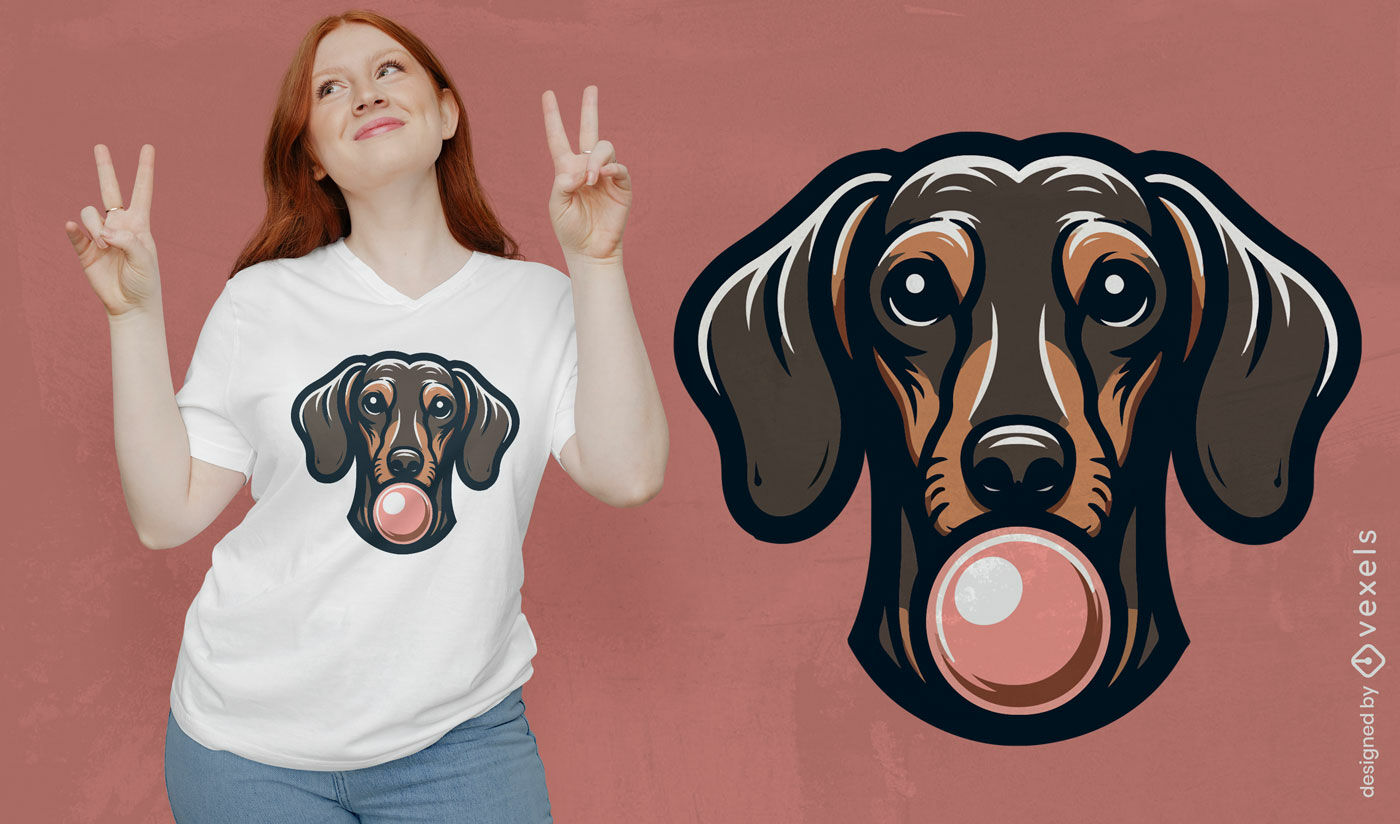
Design de camiseta de chiclete de Dachshund
Escolha uma pasta
Todos os favoritos
Criar novo
Salvar
Design de camiseta de chiclete de Dachshund
texto editável
Pronto para imprimir
para Merch
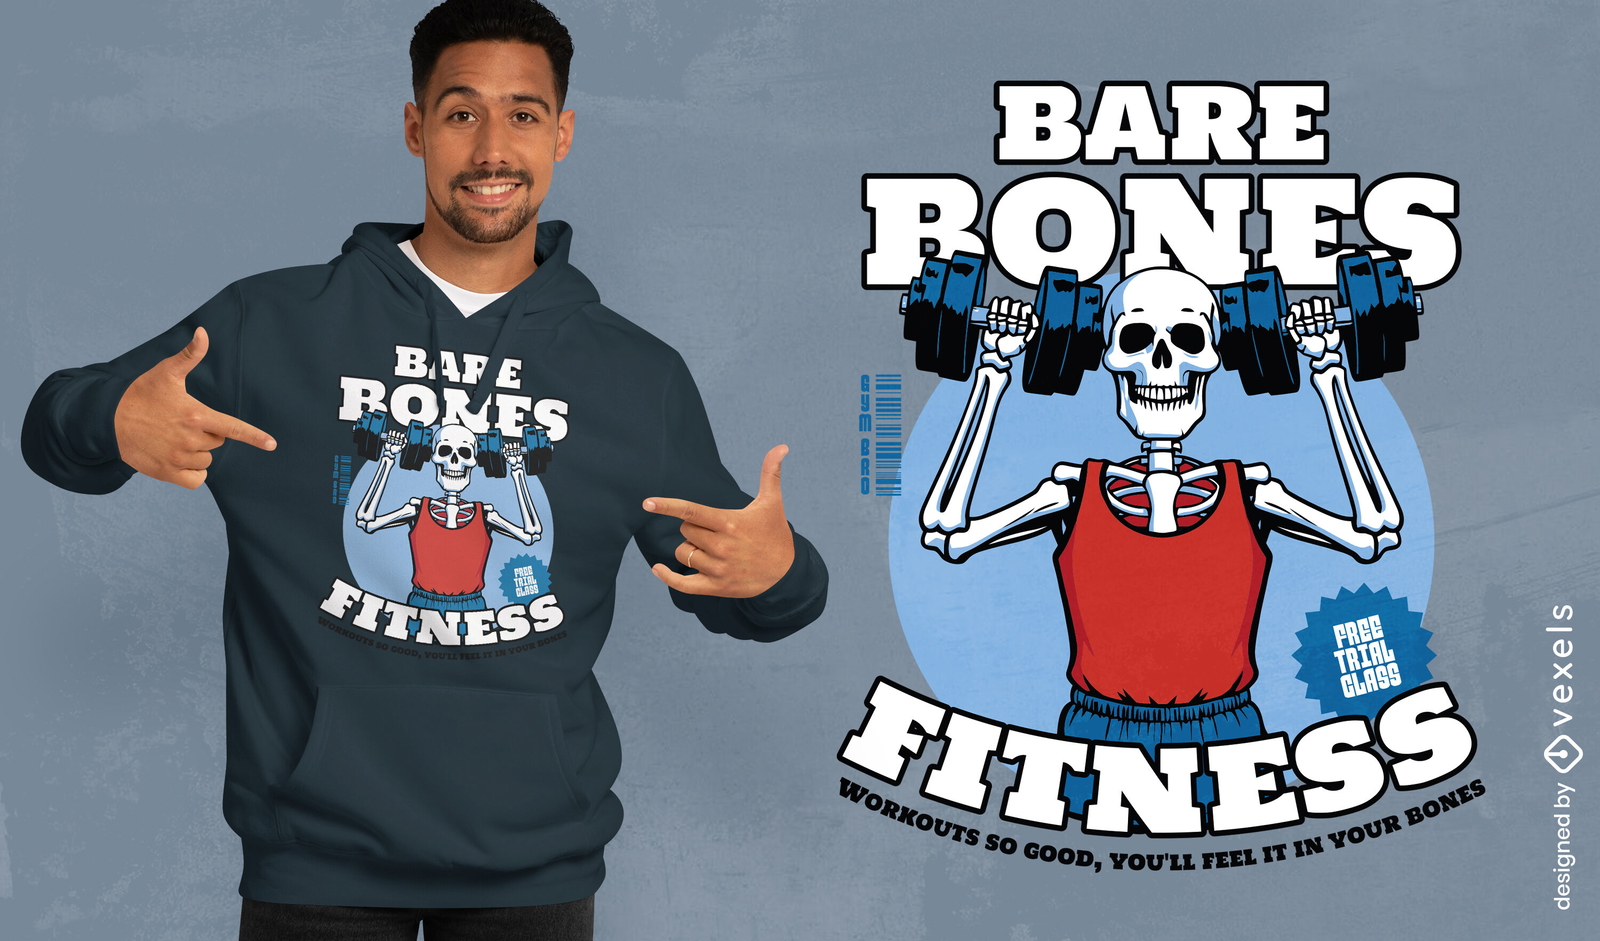
Design de camiseta fitness básica
Escolha uma pasta
Todos os favoritos
Criar novo
Salvar
Design de camiseta fitness básica
Pronto para imprimir
para Merch
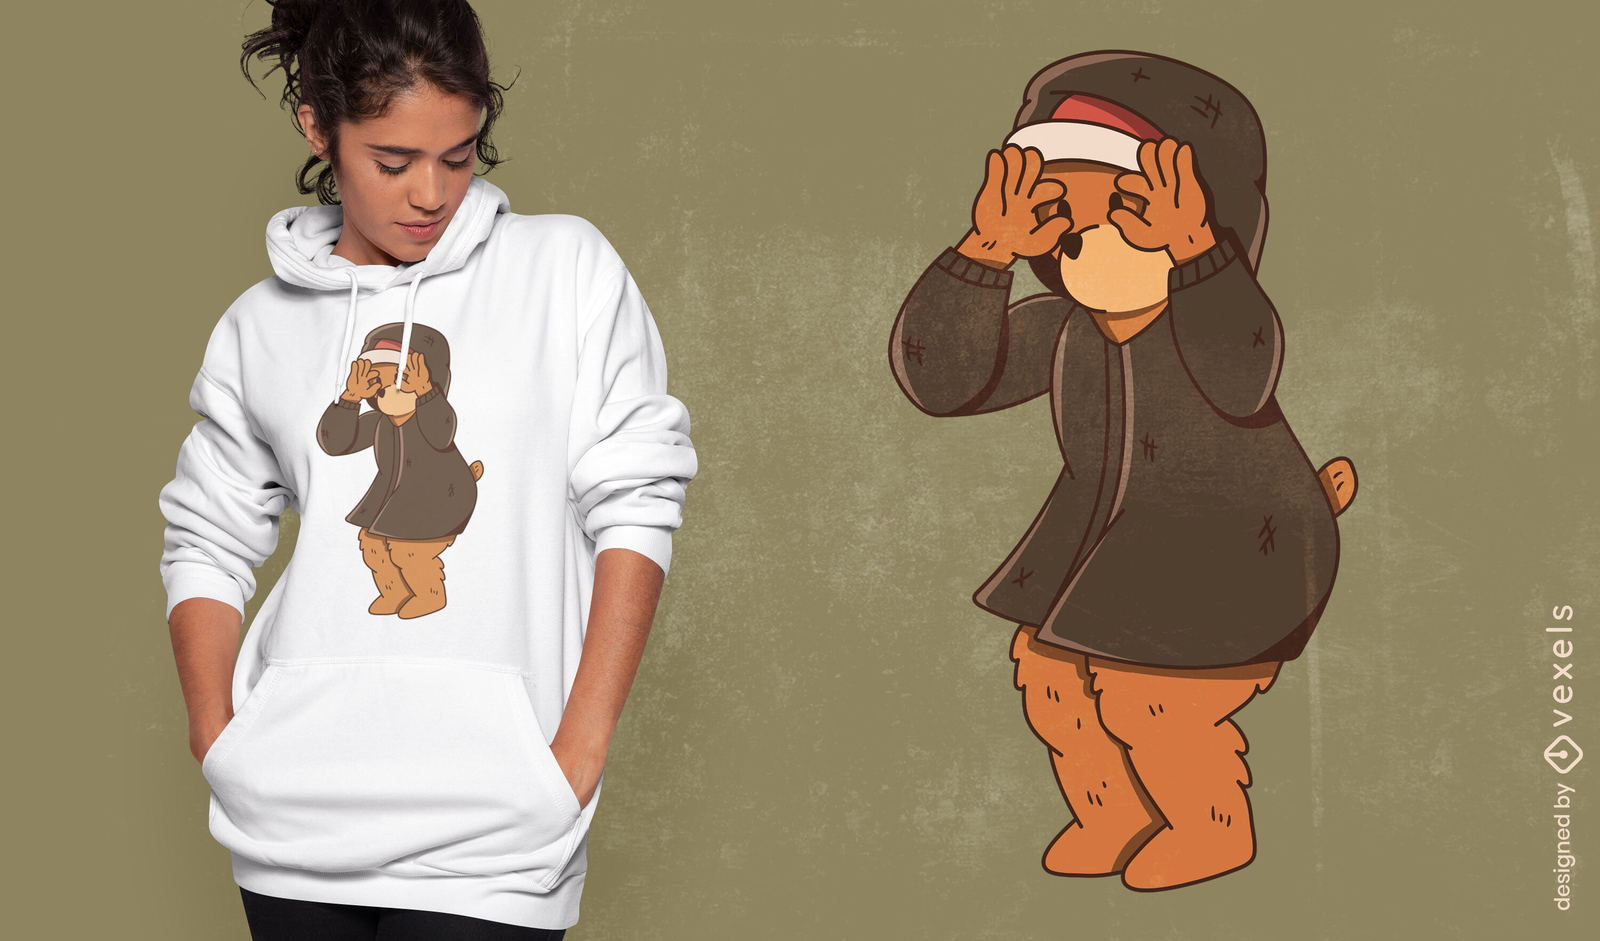
Design de camiseta com urso pardo dançando
Escolha uma pasta
Todos os favoritos
Criar novo
Salvar
Design de camiseta com urso pardo dançando
texto editável
Pronto para imprimir
para Merch
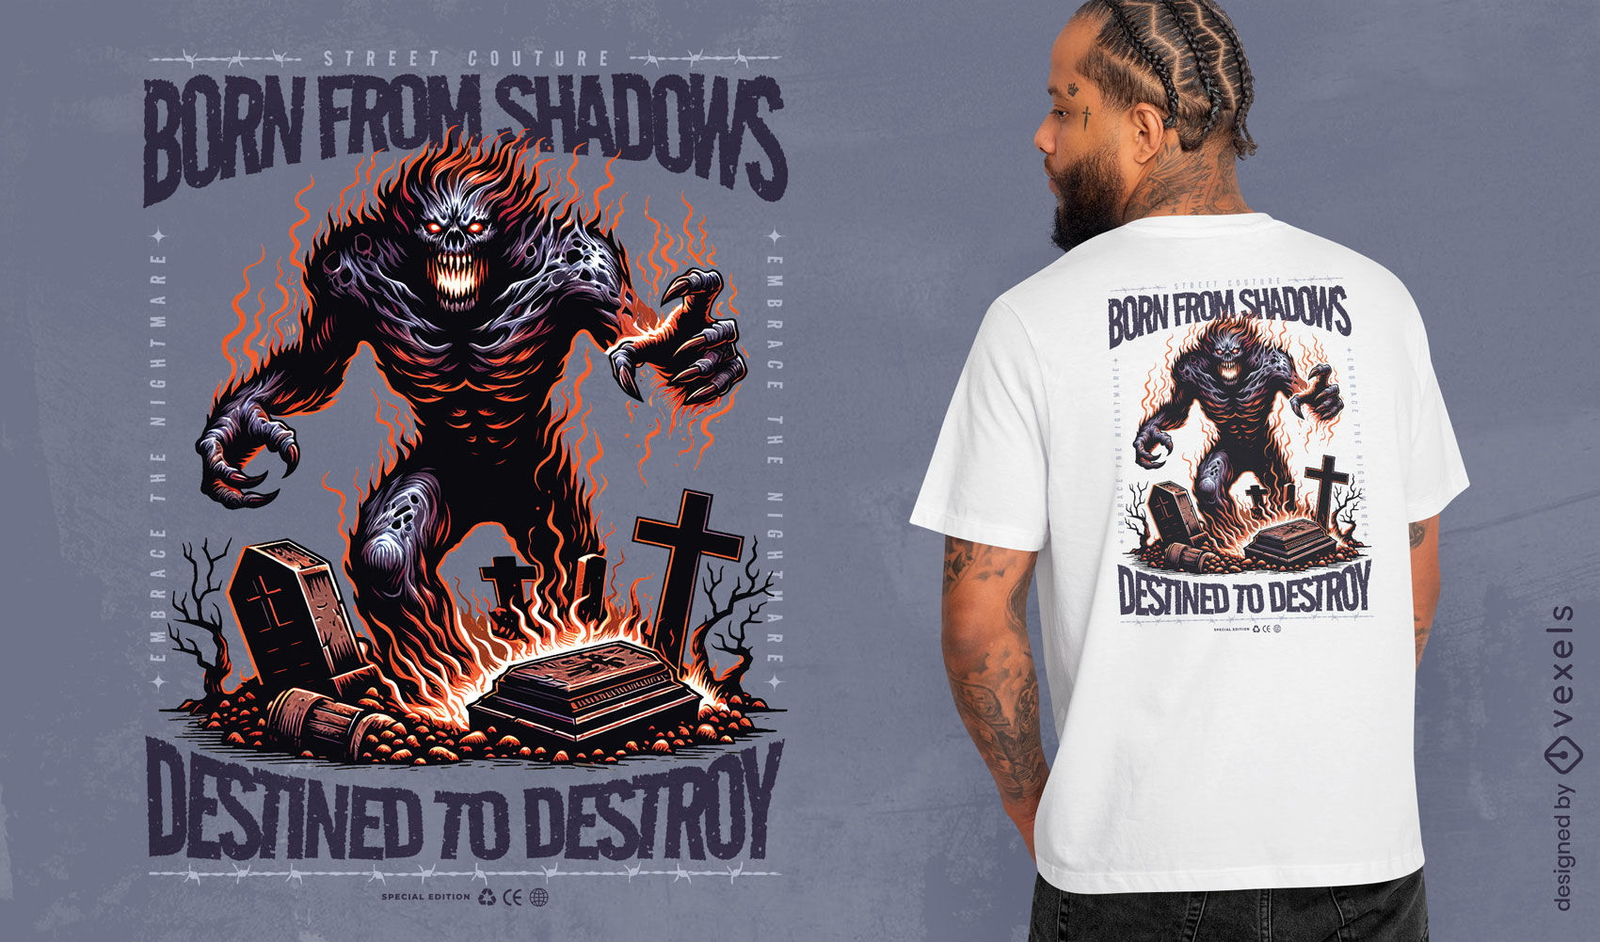
Design de camiseta monstro nascido das sombras
Escolha uma pasta
Todos os favoritos
Criar novo
Salvar
Design de camiseta monstro nascido das sombras
Gerado por IA, selecionado por nossos designers.
para Merch
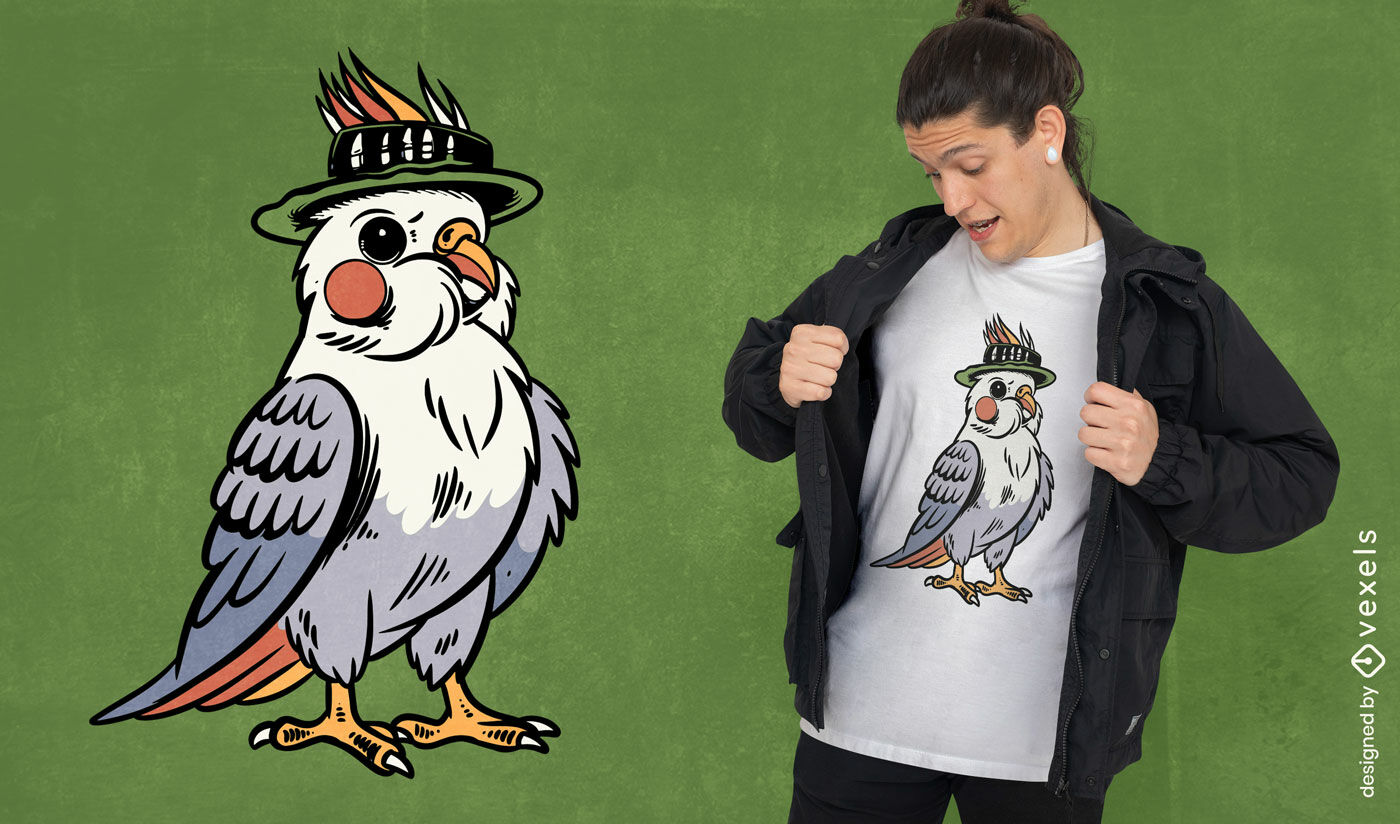
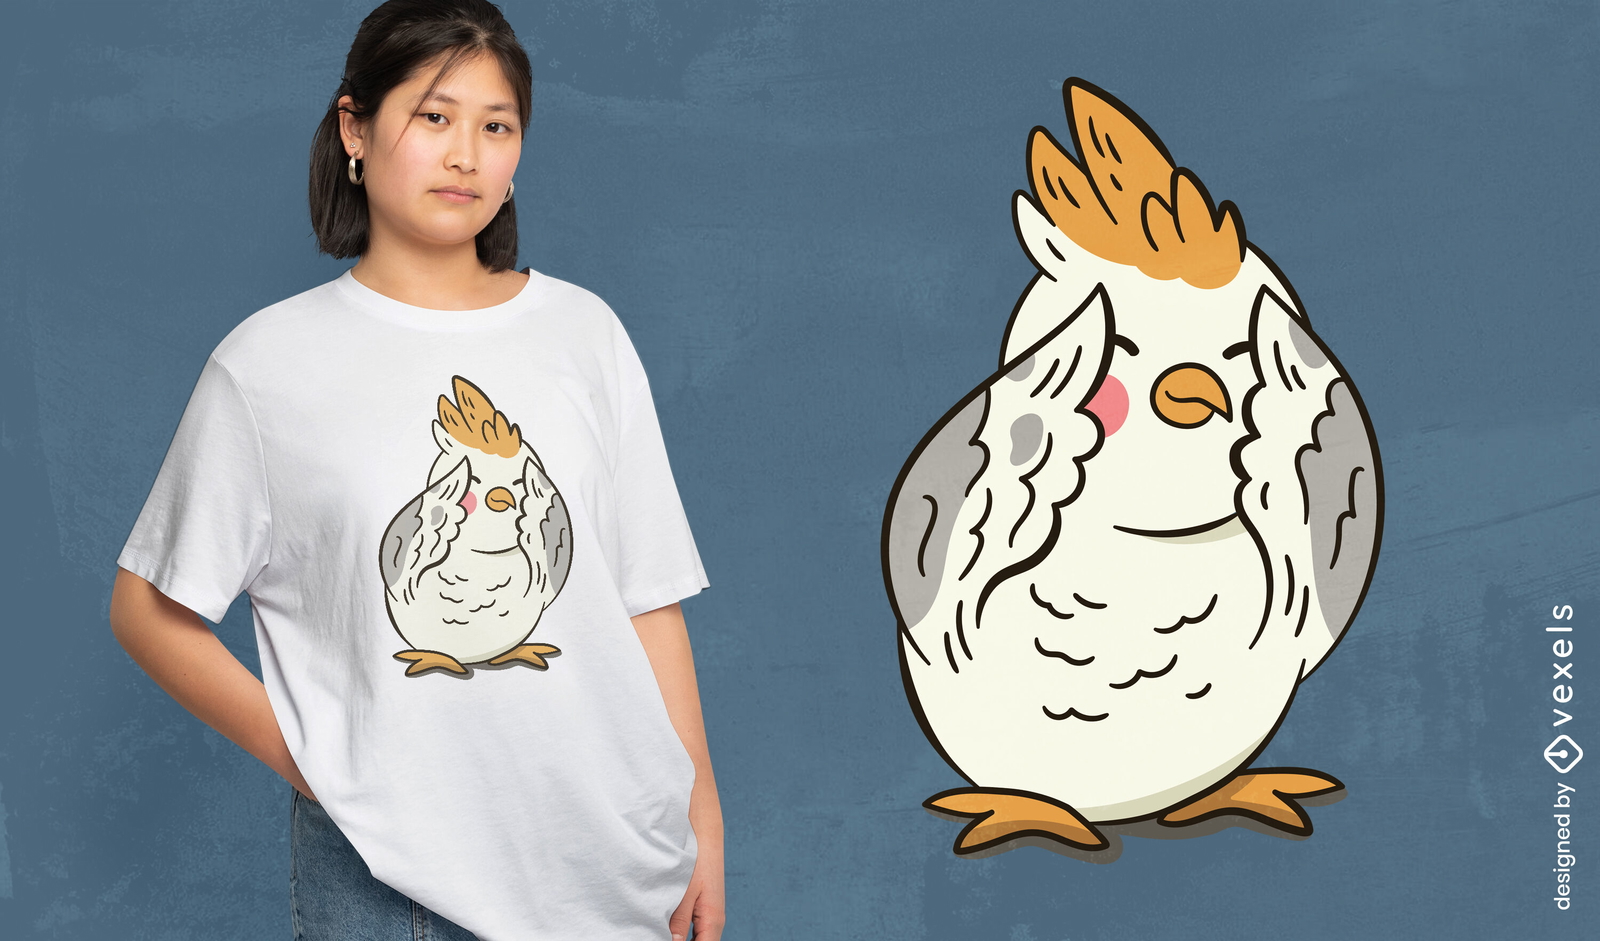
Design de camiseta com chap?u de penas de calopsita
Escolha uma pasta
Todos os favoritos
Criar novo
Salvar
Design de camiseta com chap?u de penas de calopsita
texto editável
Pronto para imprimir
para Merch
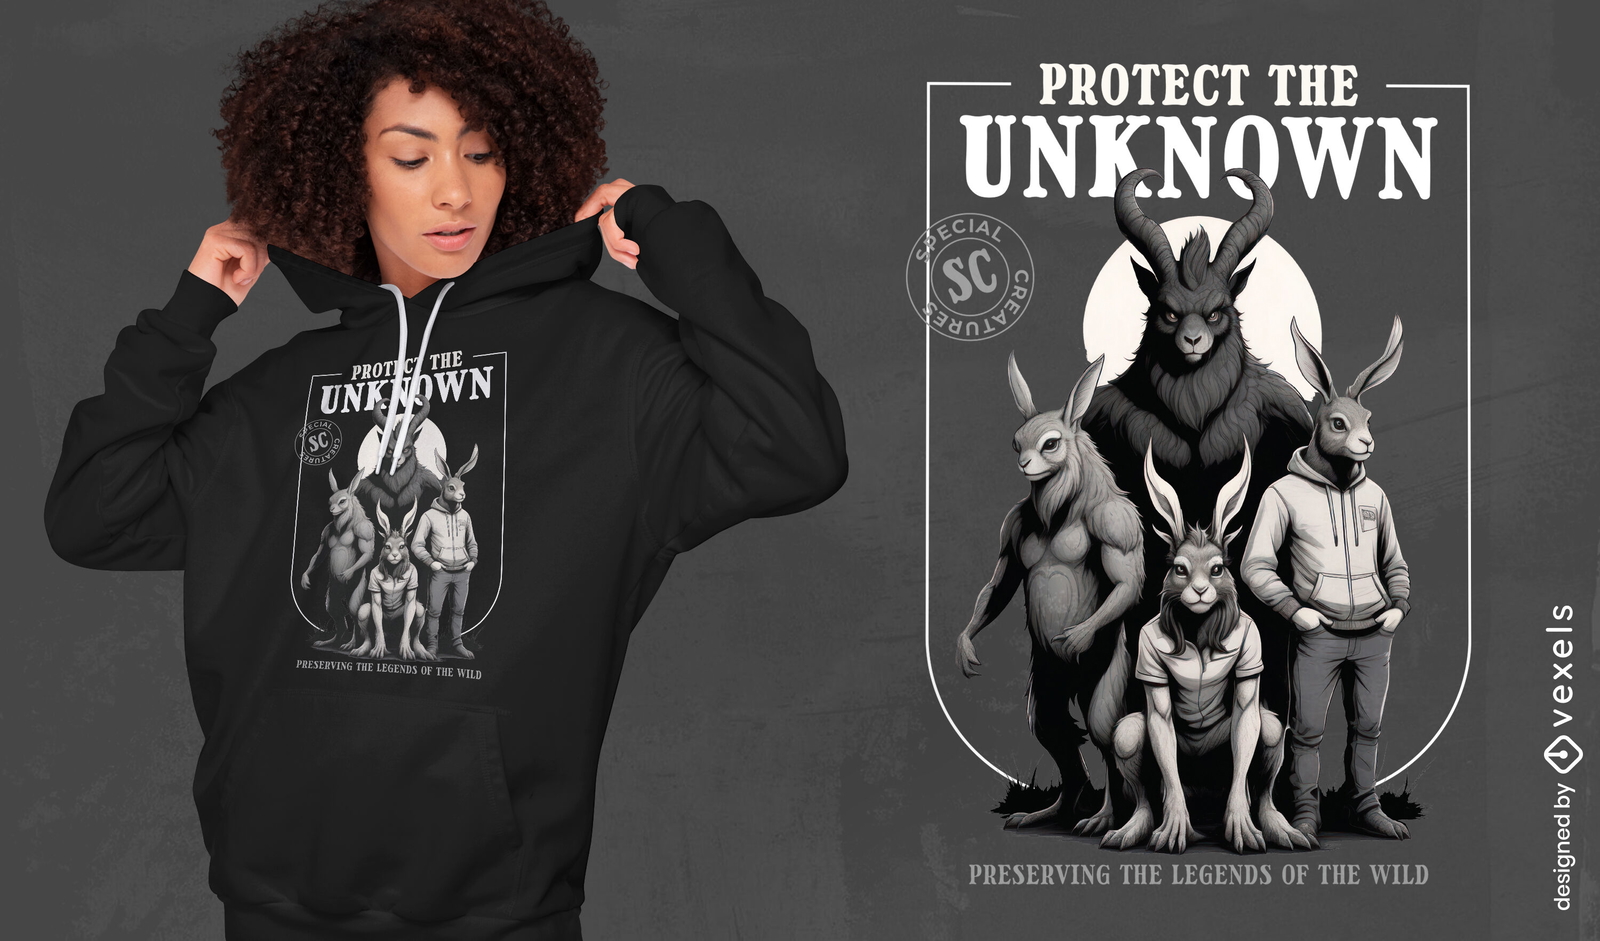
Proteja o design desconhecido da camiseta
Escolha uma pasta
Todos os favoritos
Criar novo
Salvar
Proteja o design desconhecido da camiseta
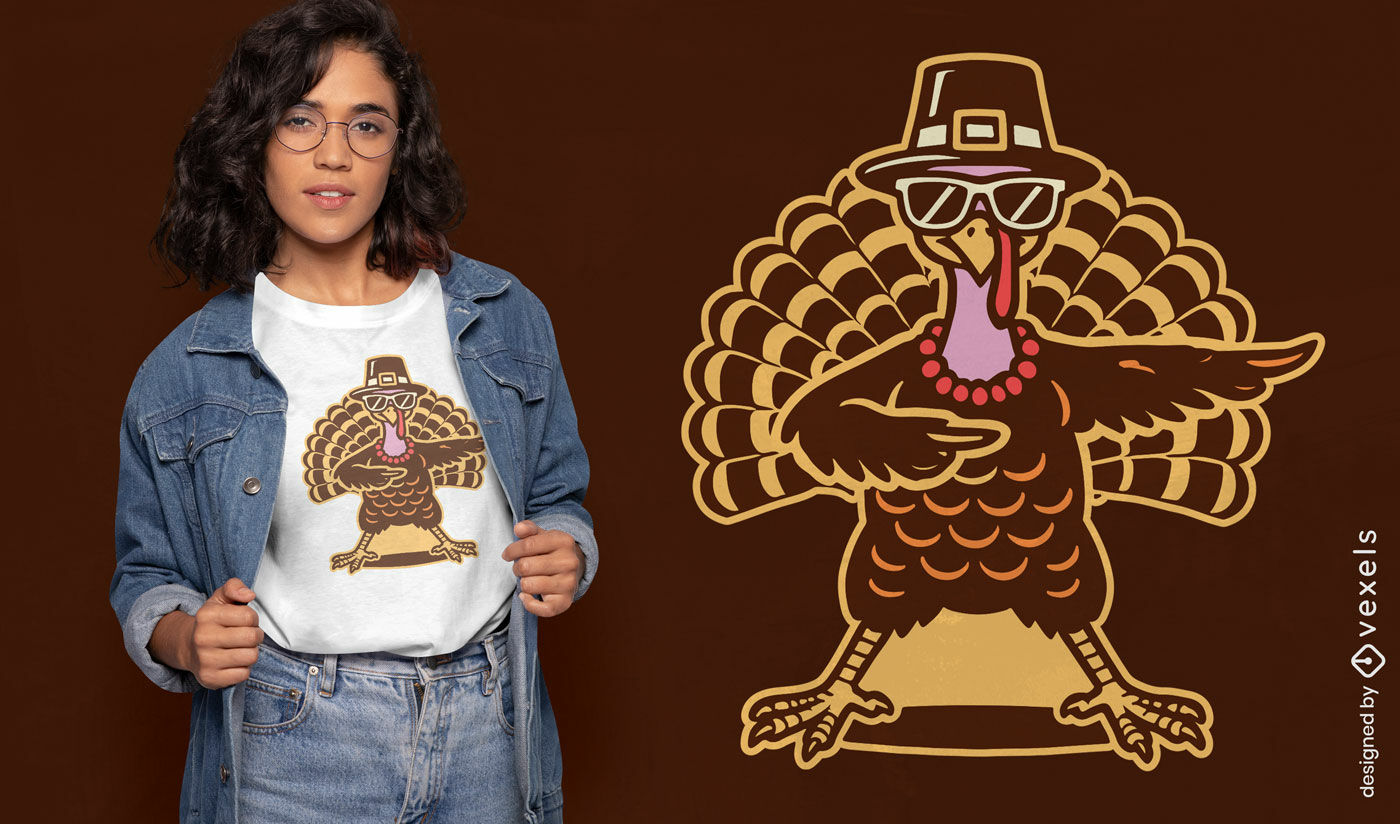
Pronto para imprimir
para Merch
Design de camiseta de peru peregrino usando fio dental
Escolha uma pasta
Todos os favoritos
Criar novo
Salvar
Design de camiseta de peru peregrino usando fio dental
Gerado por IA, selecionado por nossos designers.
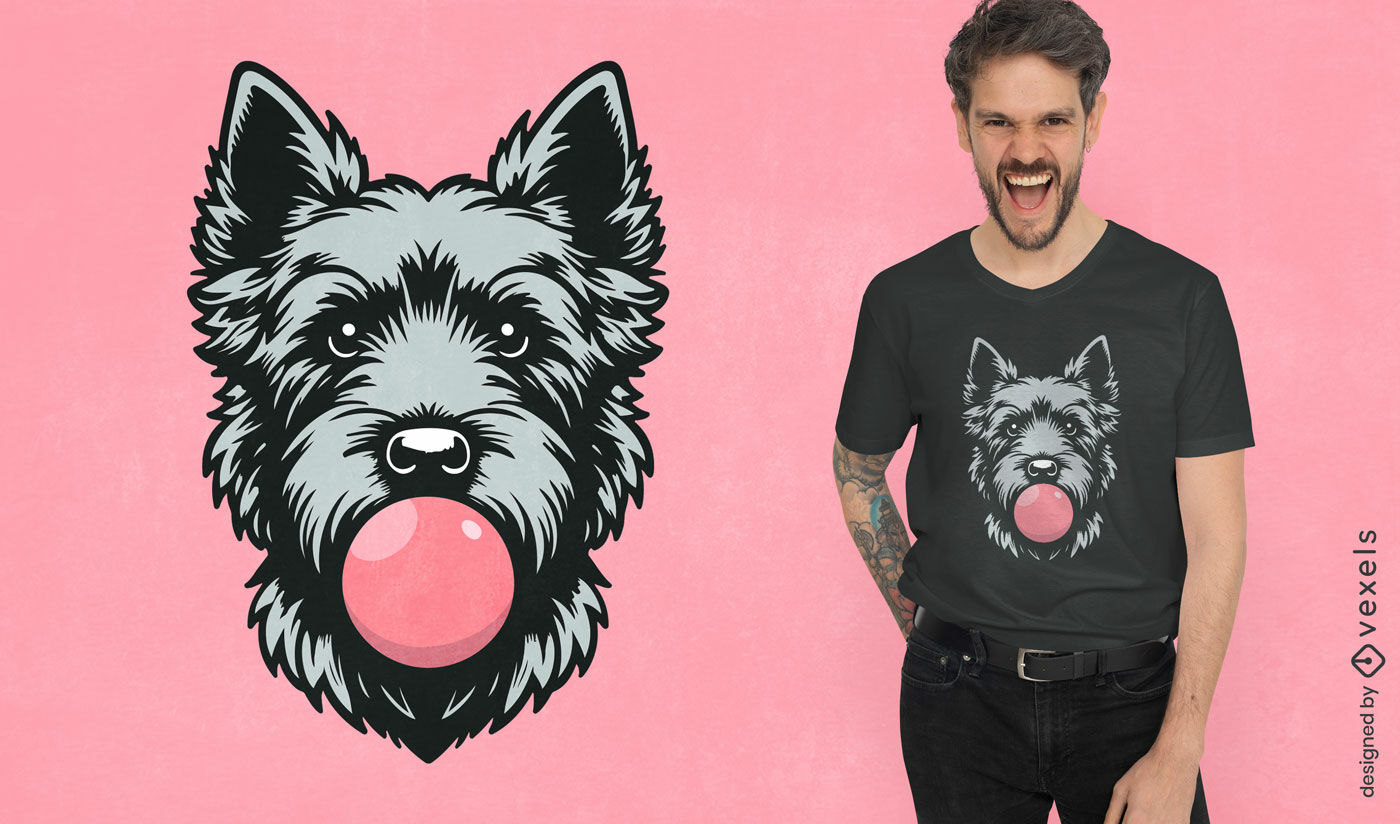
para Merch
Design de camiseta para cachorrinho Bubblegum
Escolha uma pasta
Todos os favoritos
Criar novo
Salvar
Design de camiseta para cachorrinho Bubblegum
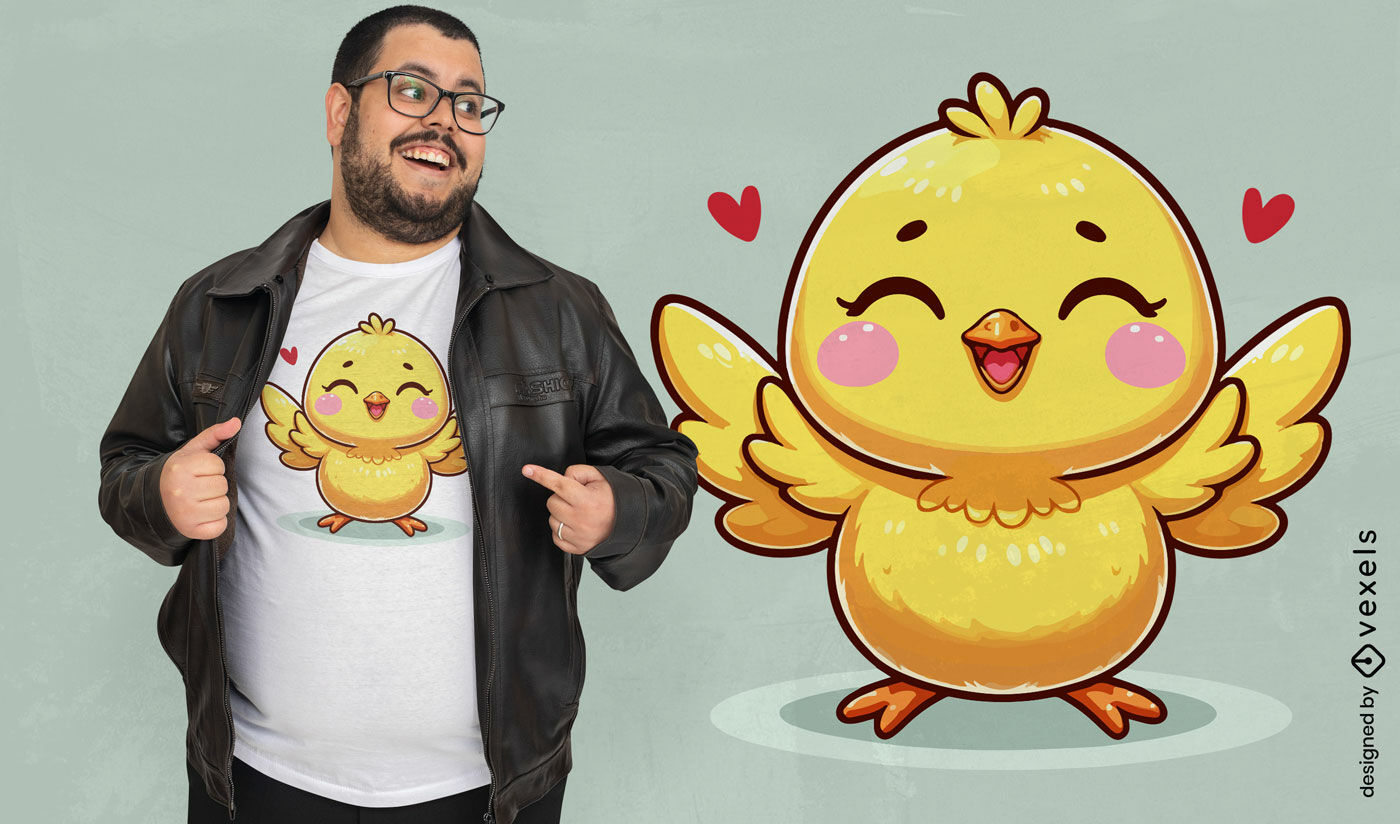
Pronto para imprimir
para Merch
Design de camiseta de garota feliz
Escolha uma pasta
Todos os favoritos
Criar novo
Salvar
Design de camiseta de garota feliz
Gerado por IA, selecionado por nossos designers.
para Merch
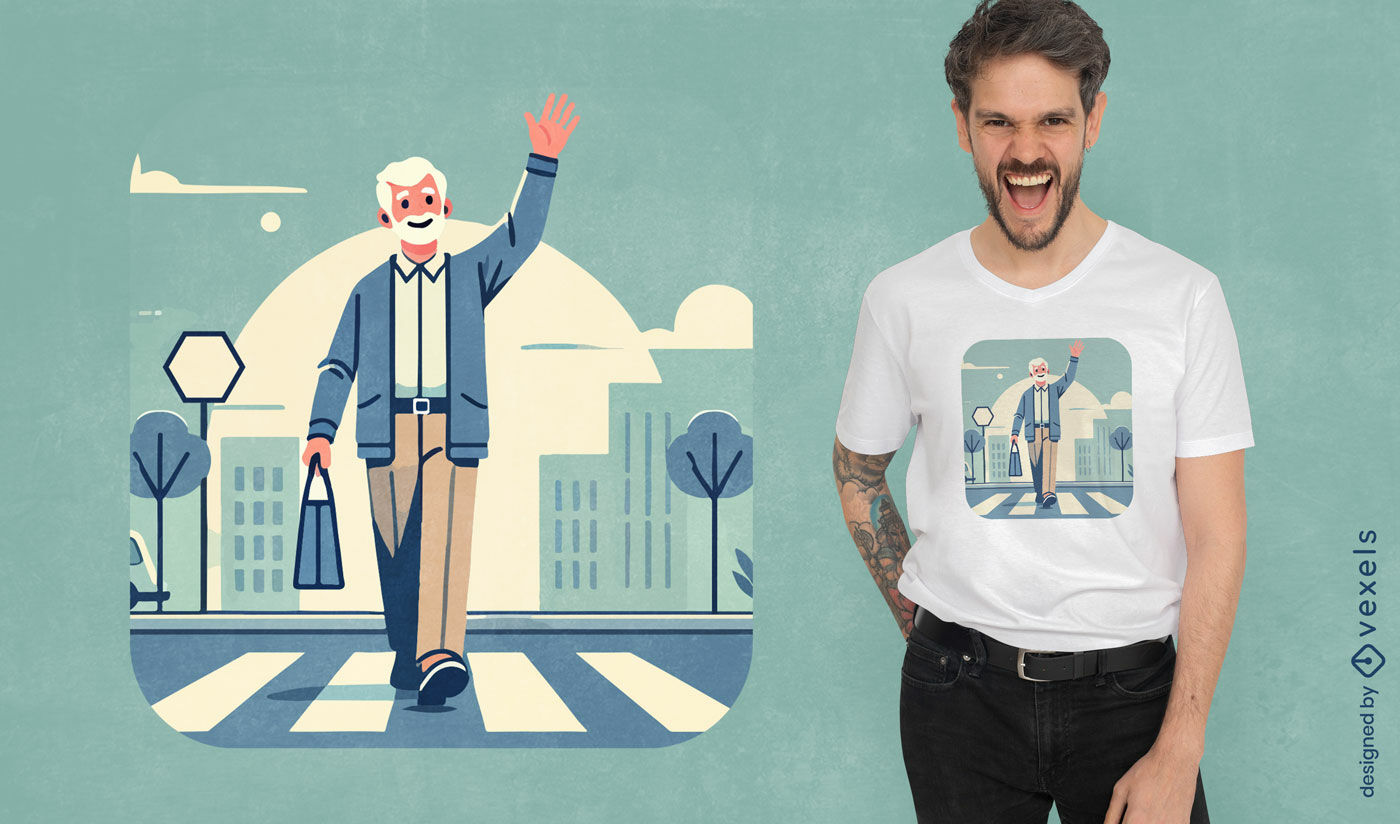
Design de camiseta para homem aposentado atravessando a rua
Escolha uma pasta
Todos os favoritos
Criar novo
Salvar
Design de camiseta para homem aposentado atravessando a rua
texto editável
Pronto para imprimir
para Merch
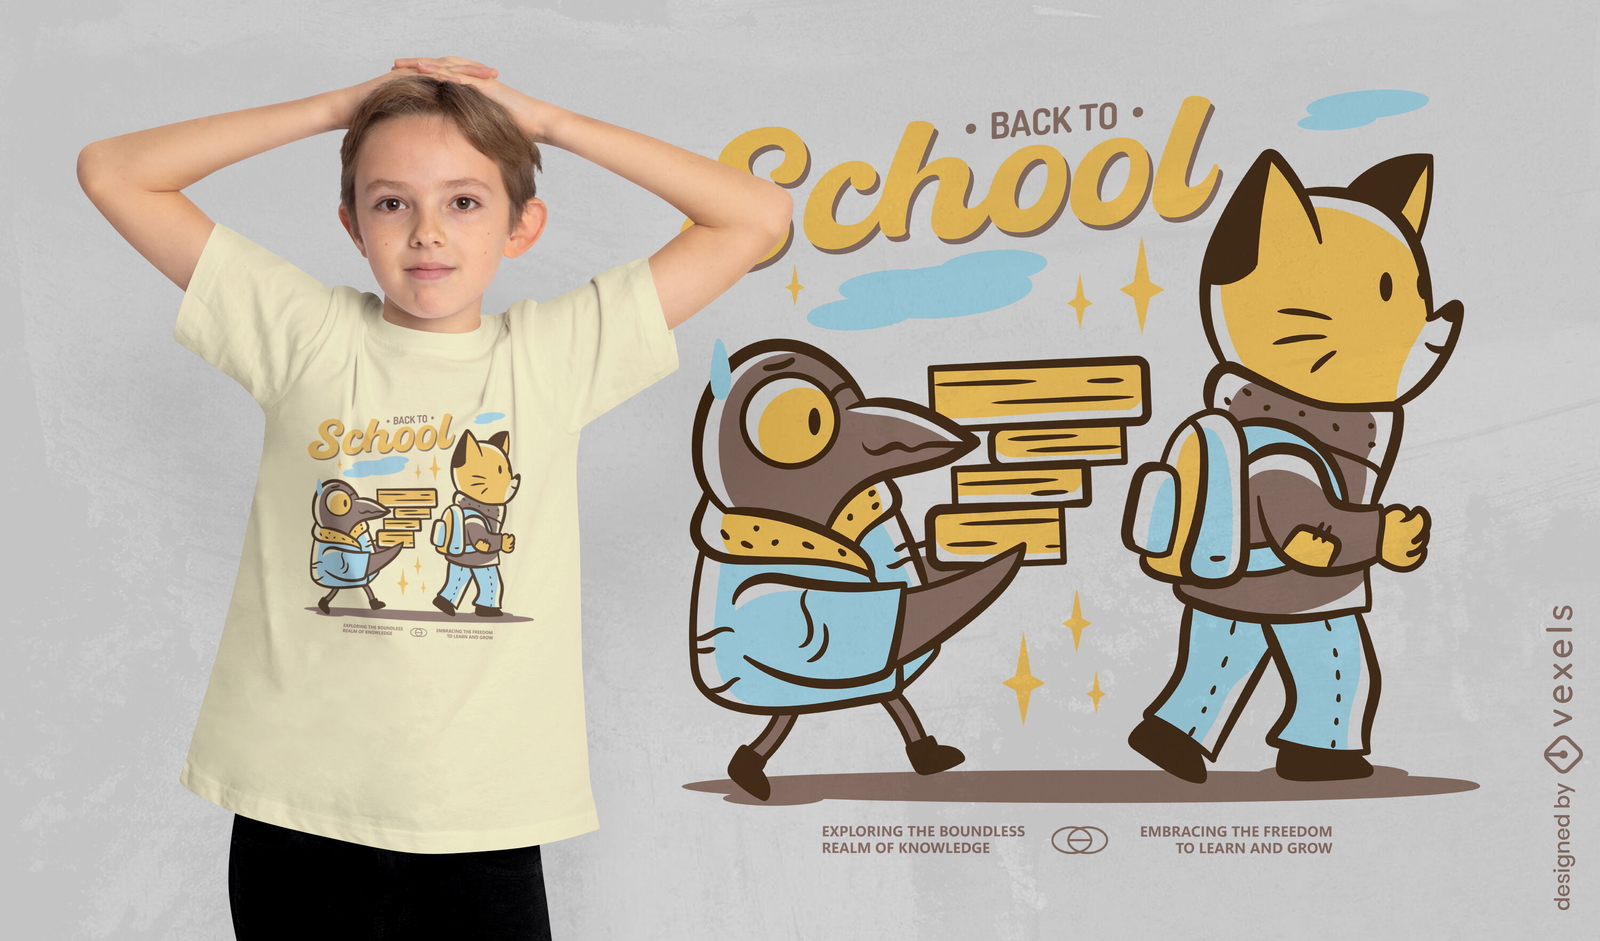
Design de camiseta de desenho animado de volta às aulas
Escolha uma pasta
Todos os favoritos
Criar novo
Salvar
Design de camiseta de desenho animado de volta às aulas
texto editável
Pronto para imprimir
para Merch
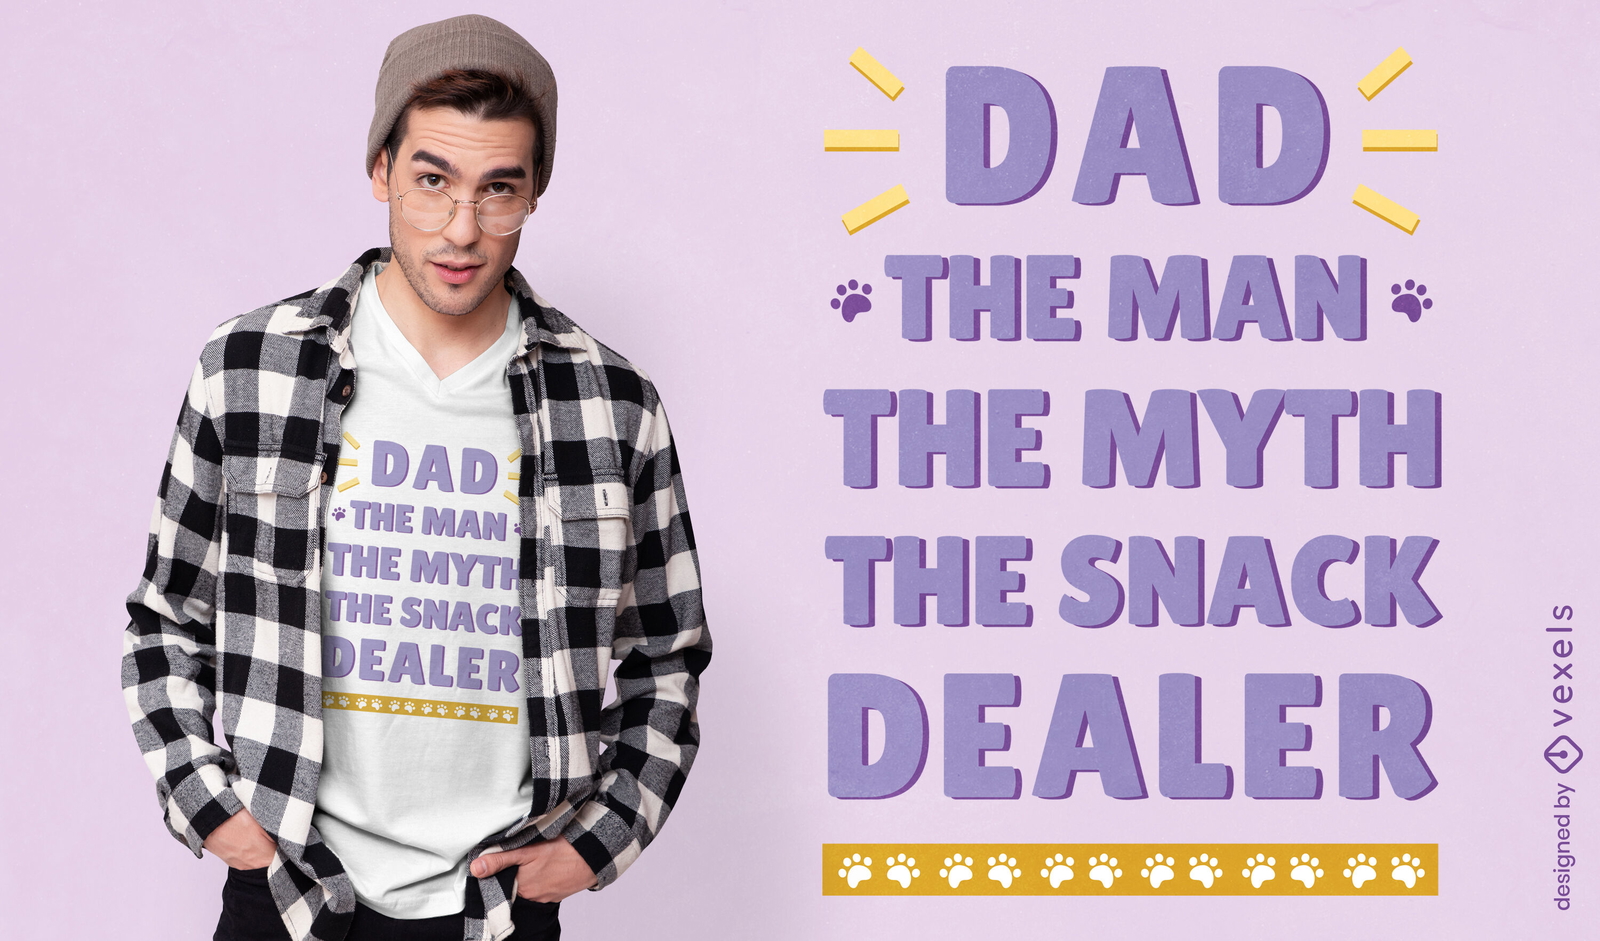
Design de camiseta para papai revendedor de lanches
Escolha uma pasta
Todos os favoritos
Criar novo
Salvar
Design de camiseta para papai revendedor de lanches
Pronto para imprimir
para Merch
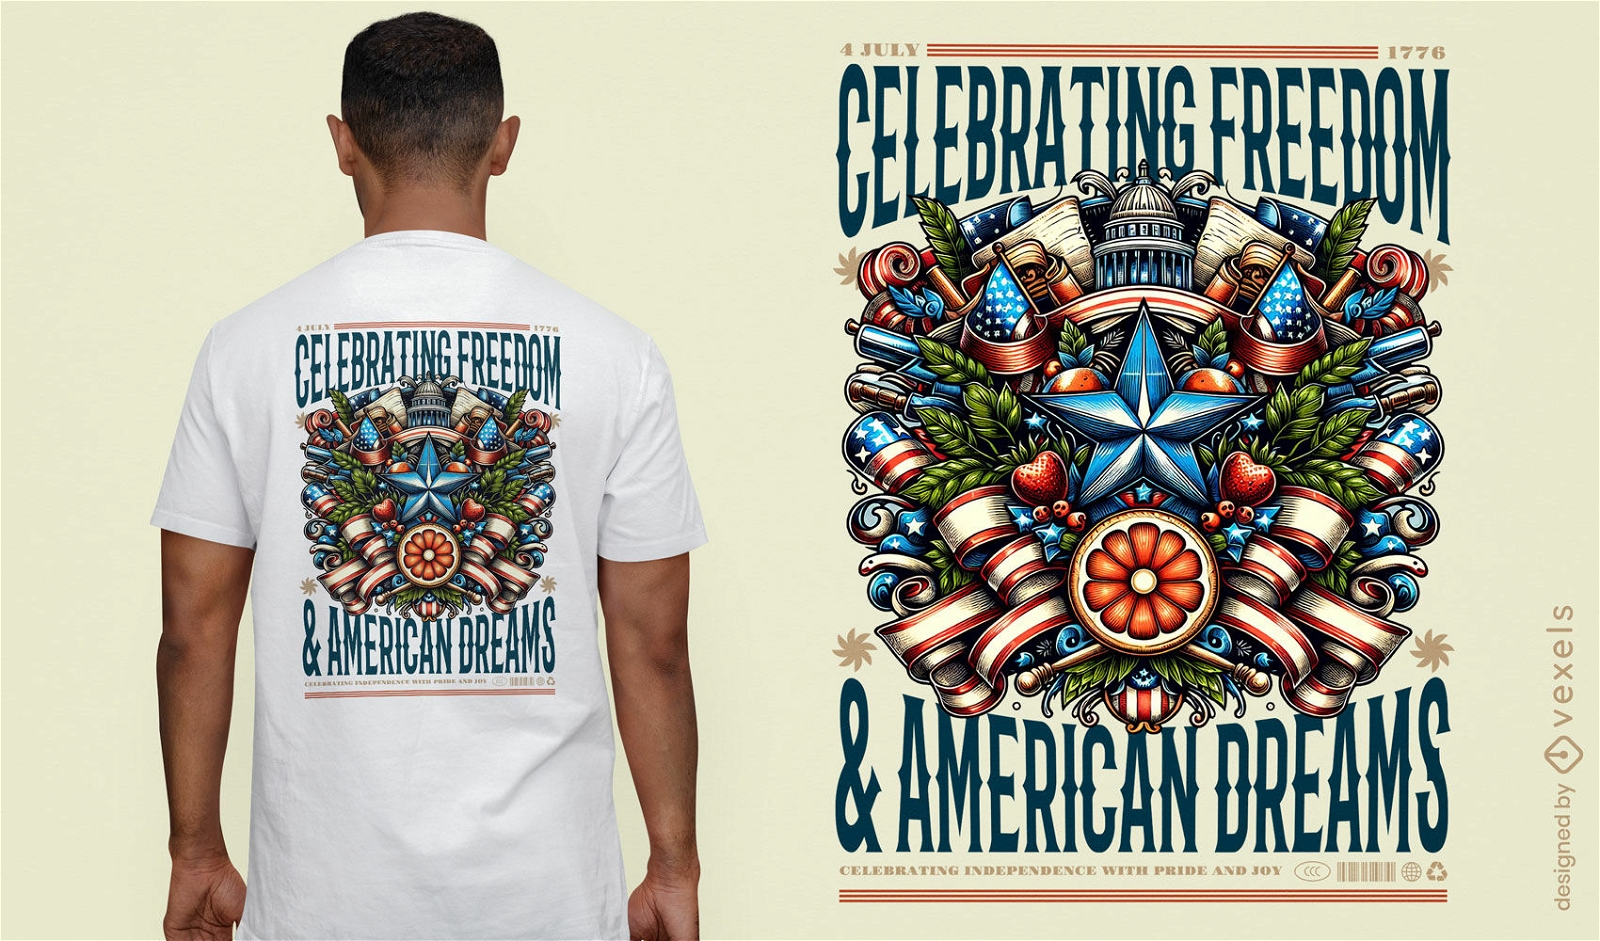
Comemorando o design de camisetas pela liberdade
Escolha uma pasta
Todos os favoritos
Criar novo
Salvar
Comemorando o design de camisetas pela liberdade
texto editável
Pronto para imprimir
para Merch
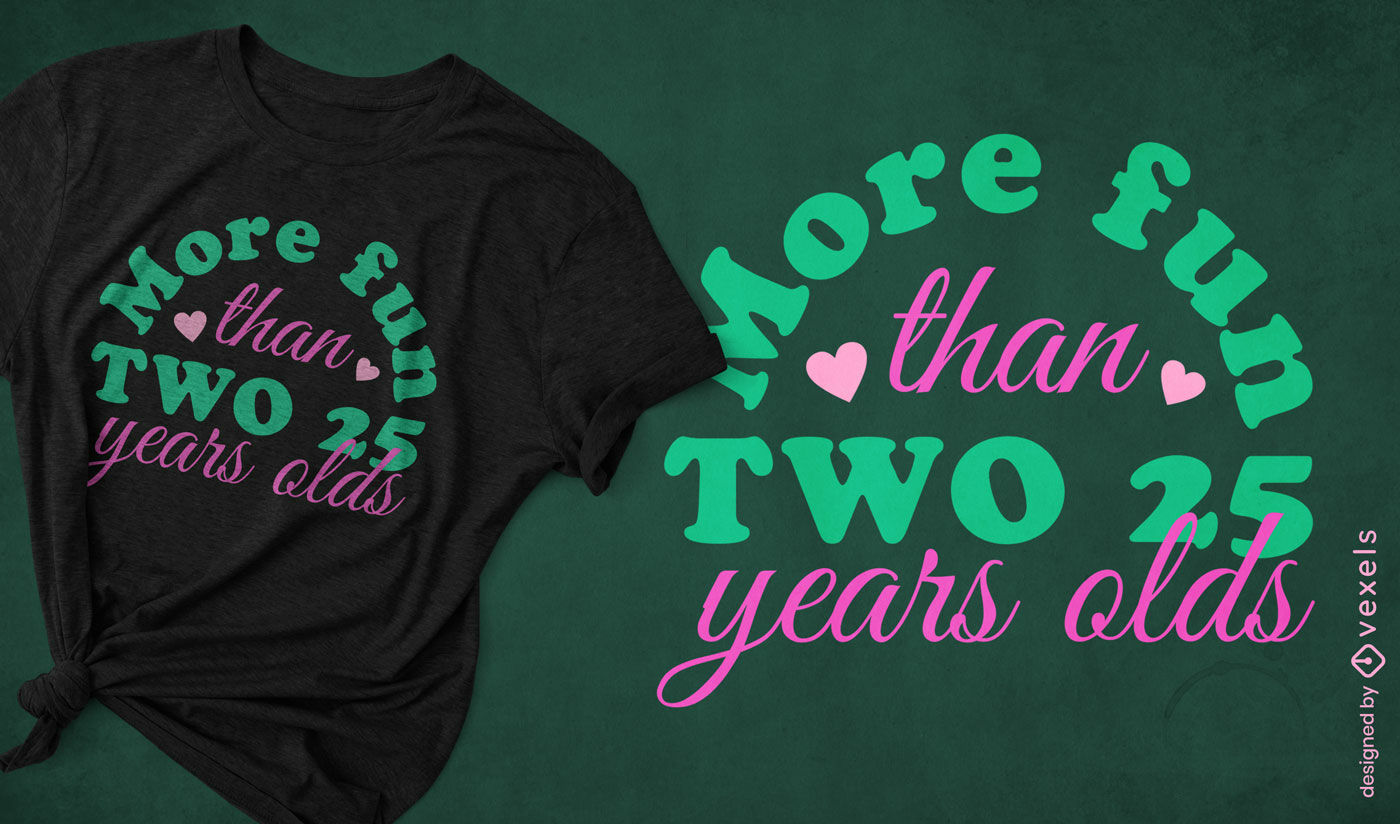
Design de camiseta com cita??o divertida
Escolha uma pasta
Todos os favoritos
Criar novo
Salvar
Design de camiseta com cita??o divertida
Gerado por IA, selecionado por nossos designers.
para Merch
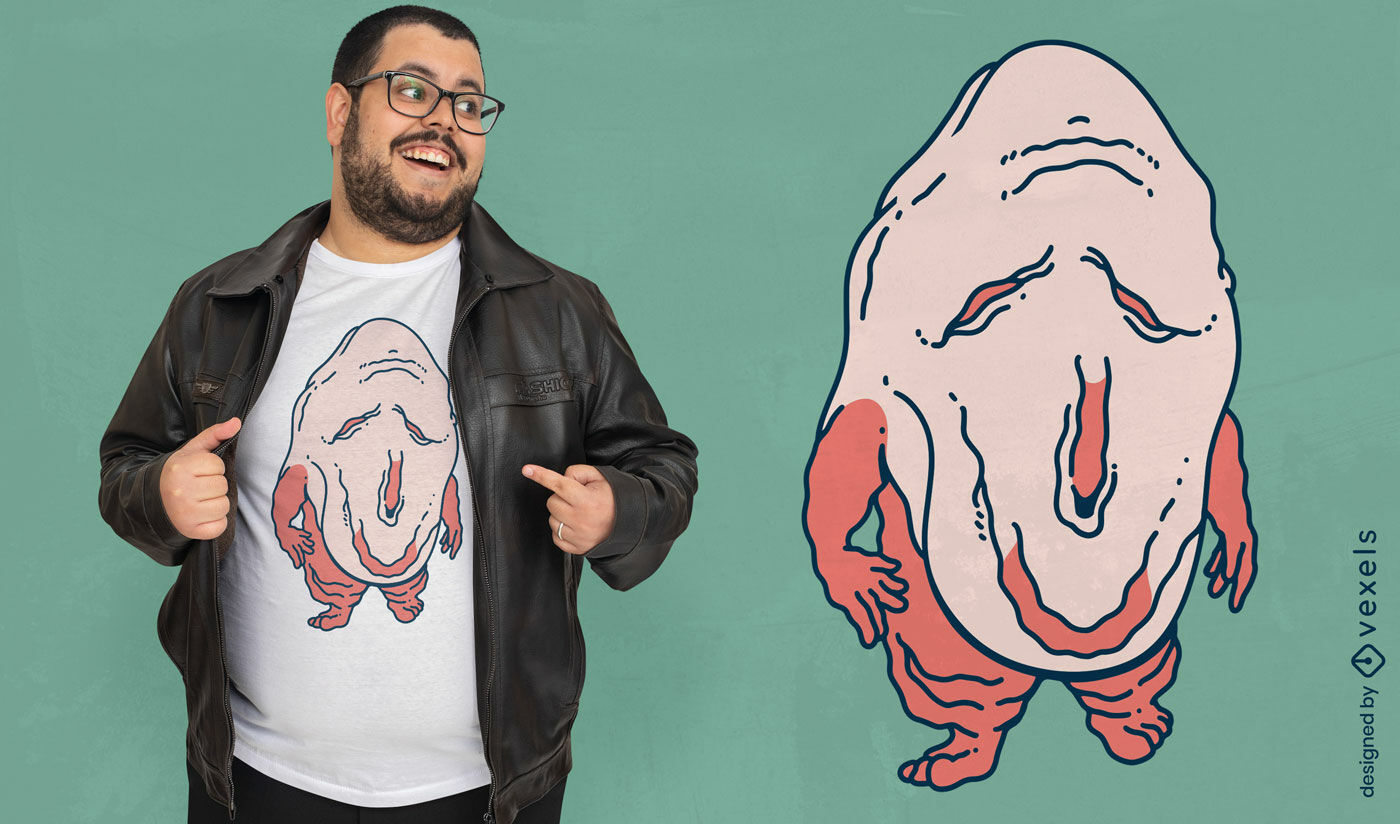
Design peculiar de camiseta da criatura Nuppeppo
Escolha uma pasta
Todos os favoritos
Criar novo
Salvar
Design peculiar de camiseta da criatura Nuppeppo
Pronto para imprimir
para Merch
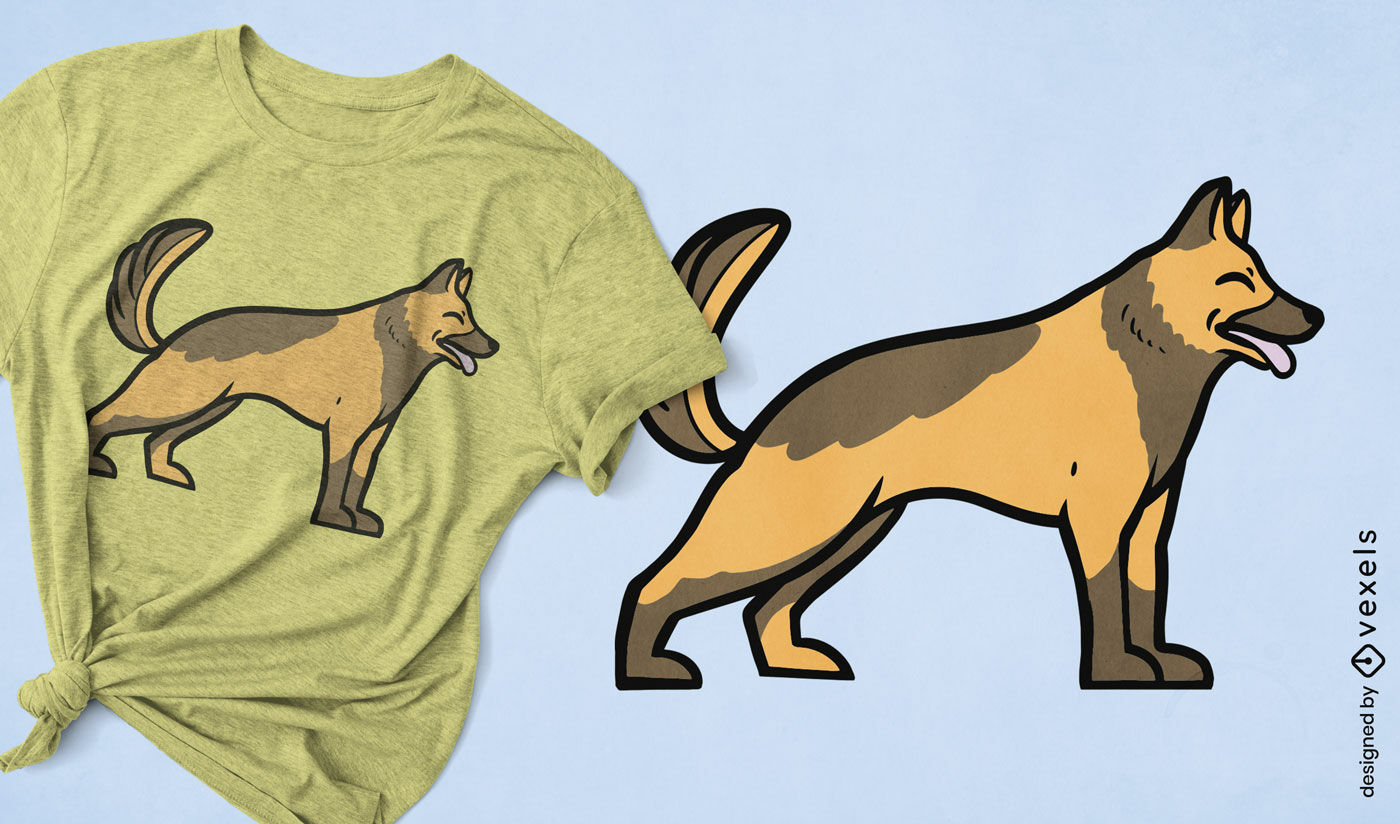
Design de camiseta pastor alem?o em p?
Escolha uma pasta
Todos os favoritos
Criar novo
Salvar
Design de camiseta pastor alem?o em p?
Pronto para imprimir
para Merch
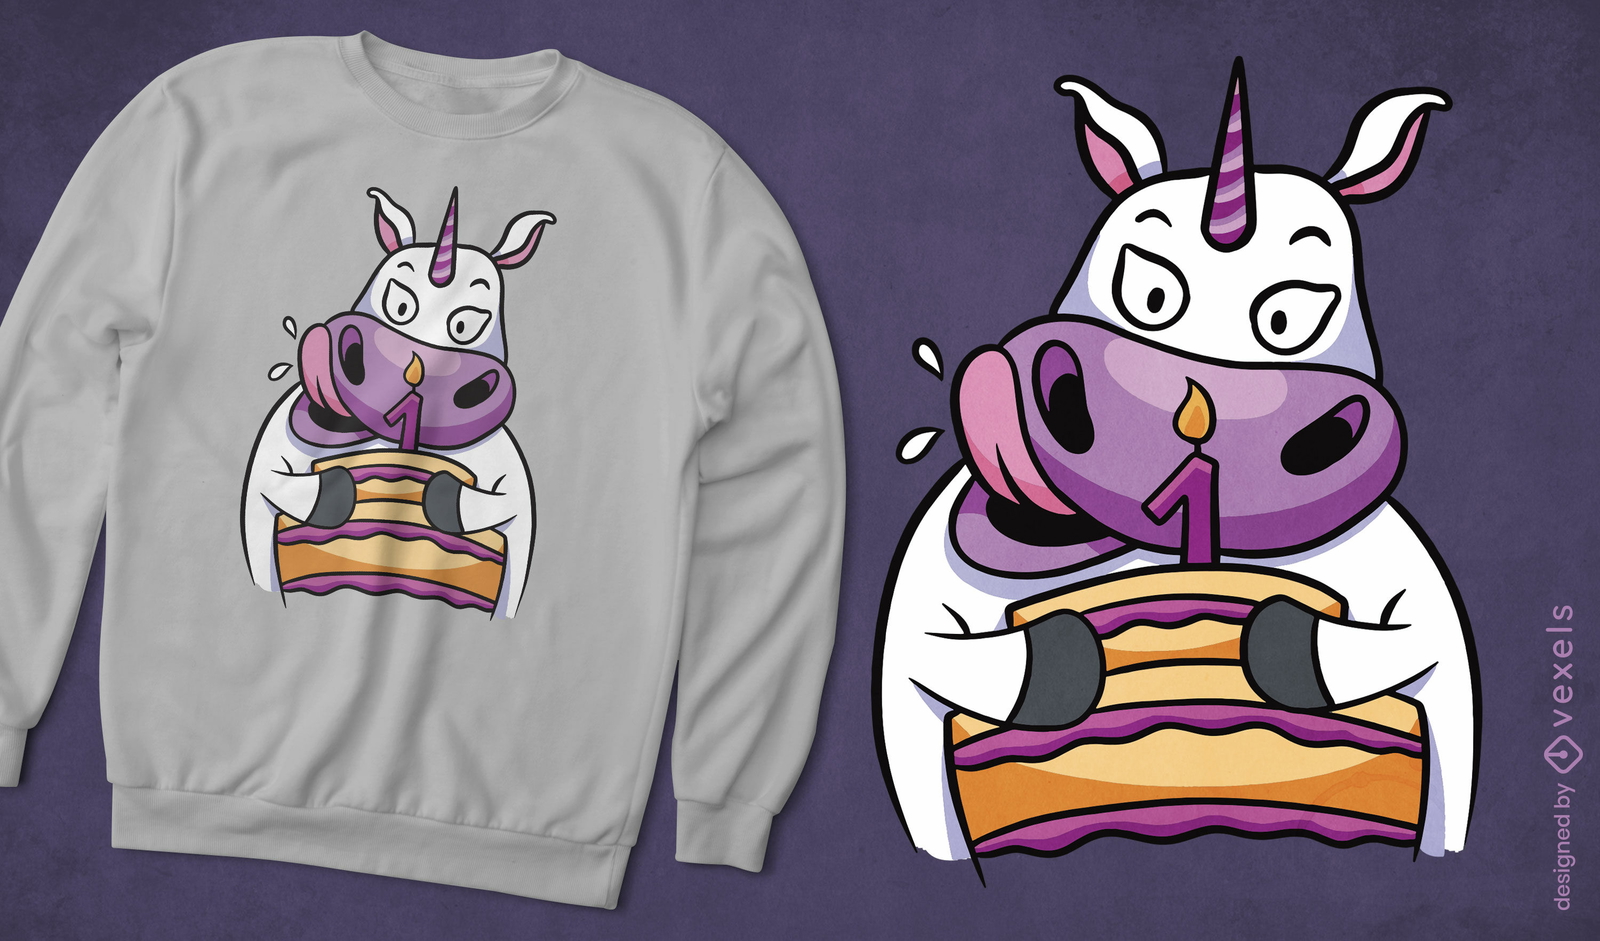
Design de camiseta de unicórnio e bolo de aniversário
Escolha uma pasta
Todos os favoritos
Criar novo
Salvar
Design de camiseta de unicórnio e bolo de aniversário
Pronto para imprimir
para Merch
Design de camiseta com desenho animado de p?ssaro esconde-esconde
Escolha uma pasta
Todos os favoritos
Criar novo
Salvar
Design de camiseta com desenho animado de p?ssaro esconde-esconde
texto editável
Pronto para imprimir
para Merch
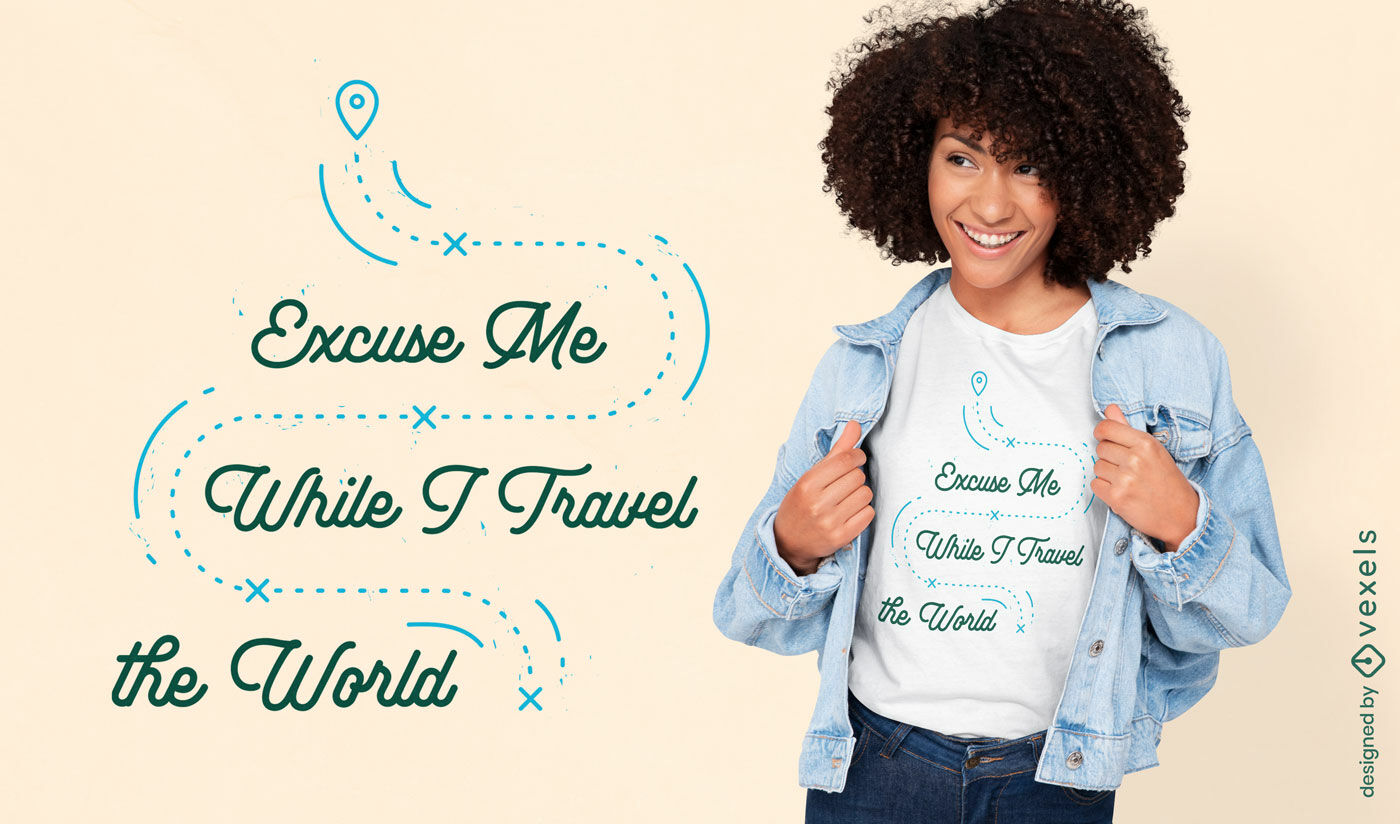
Com licença, design de camiseta com citação de viagem
Escolha uma pasta
Todos os favoritos
Criar novo
Salvar
Com licença, design de camiseta com citação de viagem
texto editável
Pronto para imprimir
para Merch
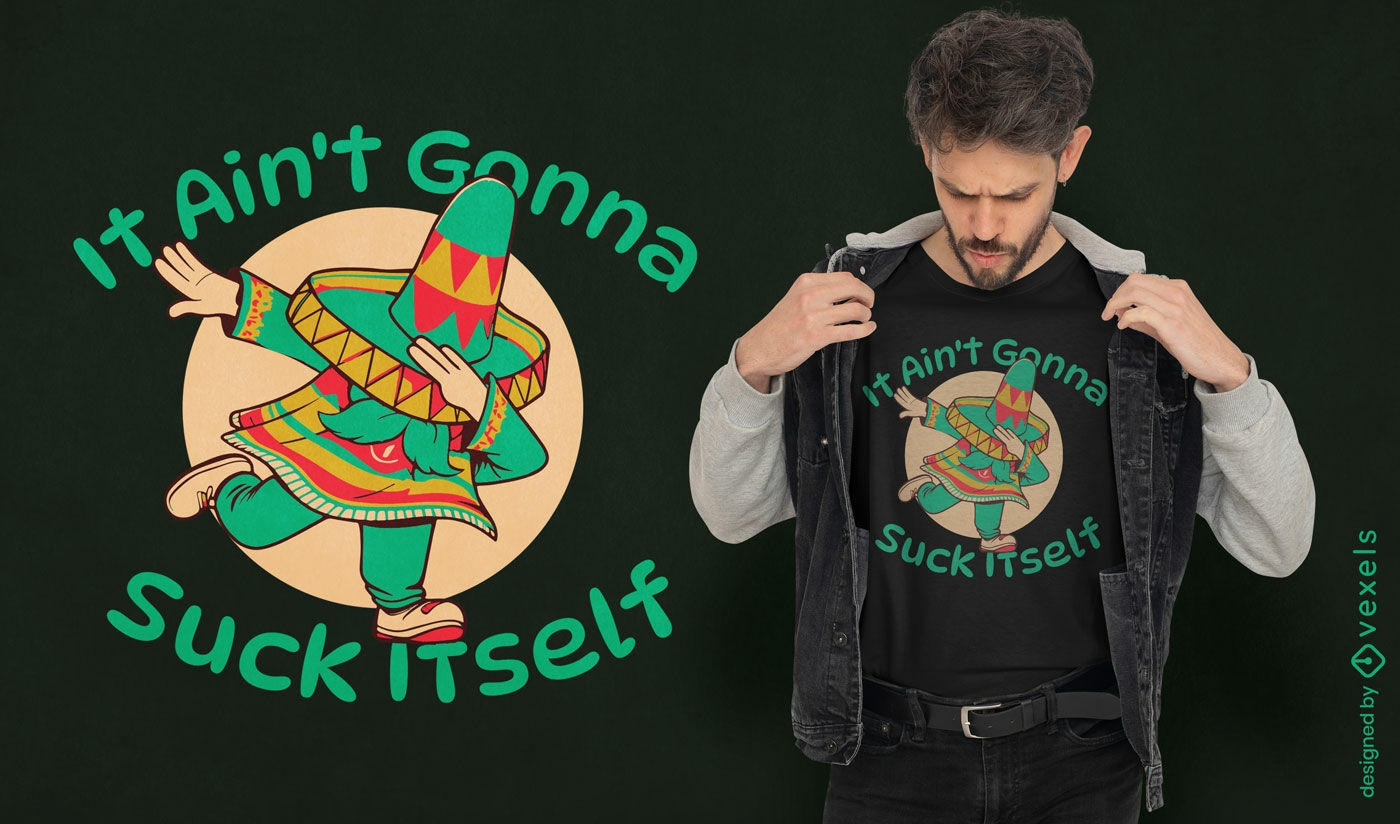
Design de camiseta com personagem mexicano
Escolha uma pasta
Todos os favoritos
Criar novo
Salvar
Design de camiseta com personagem mexicano
texto editável
Pronto para imprimir
para Merch
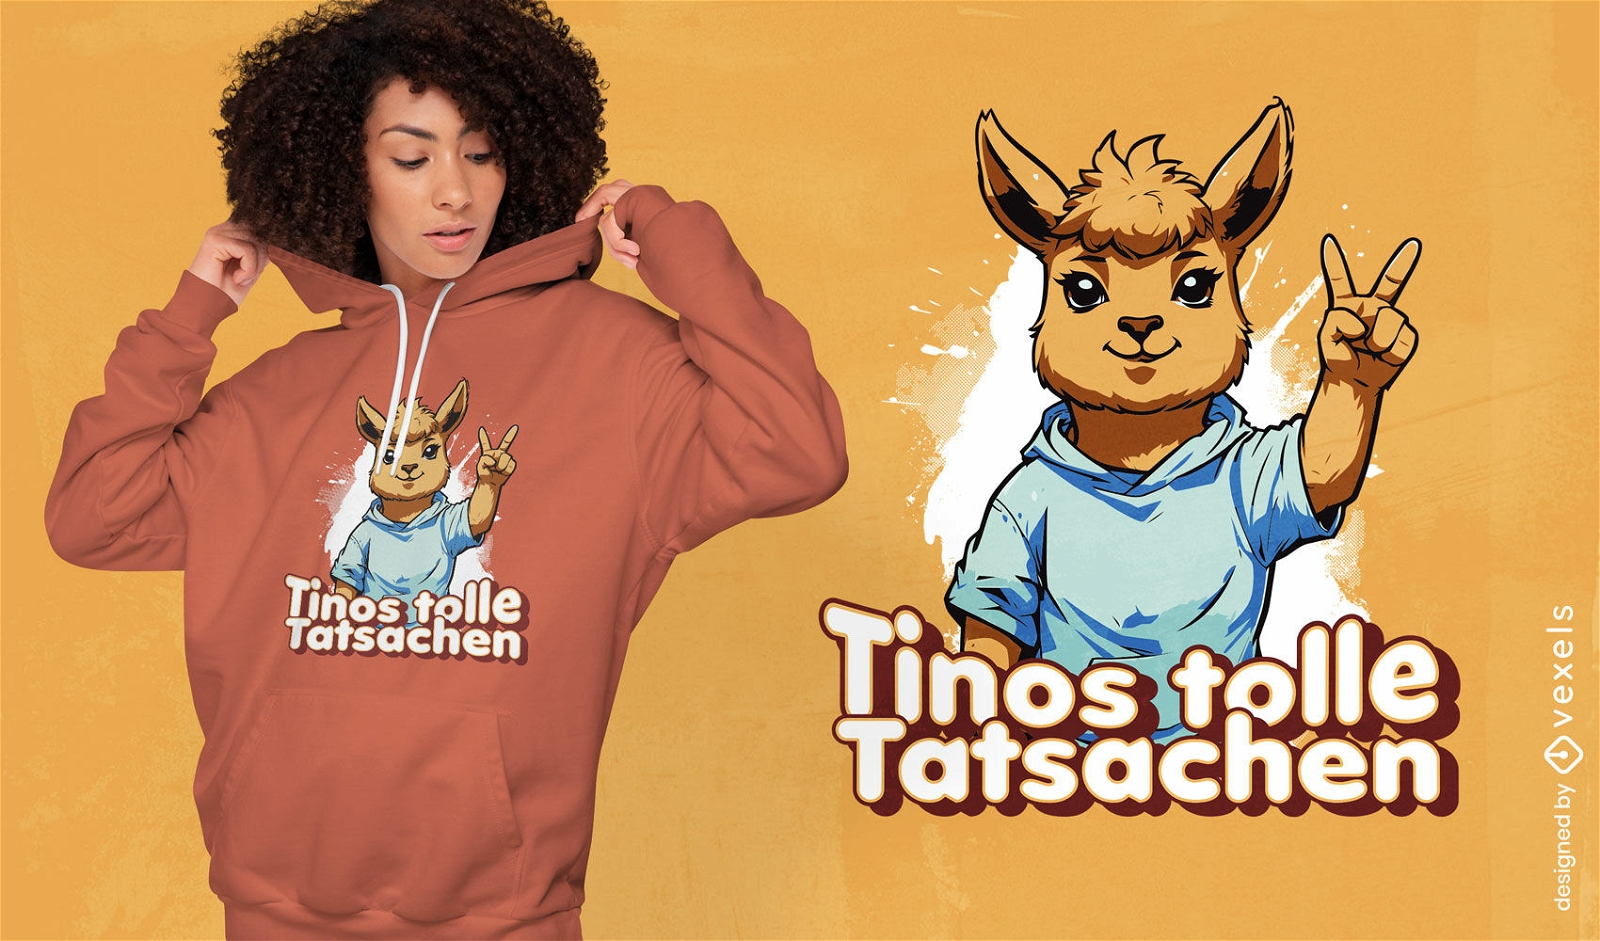
Design de camiseta da paz Alpaca
Escolha uma pasta
Todos os favoritos
Criar novo
Salvar
Design de camiseta da paz Alpaca
Gerado por IA, selecionado por nossos designers.
para Merch
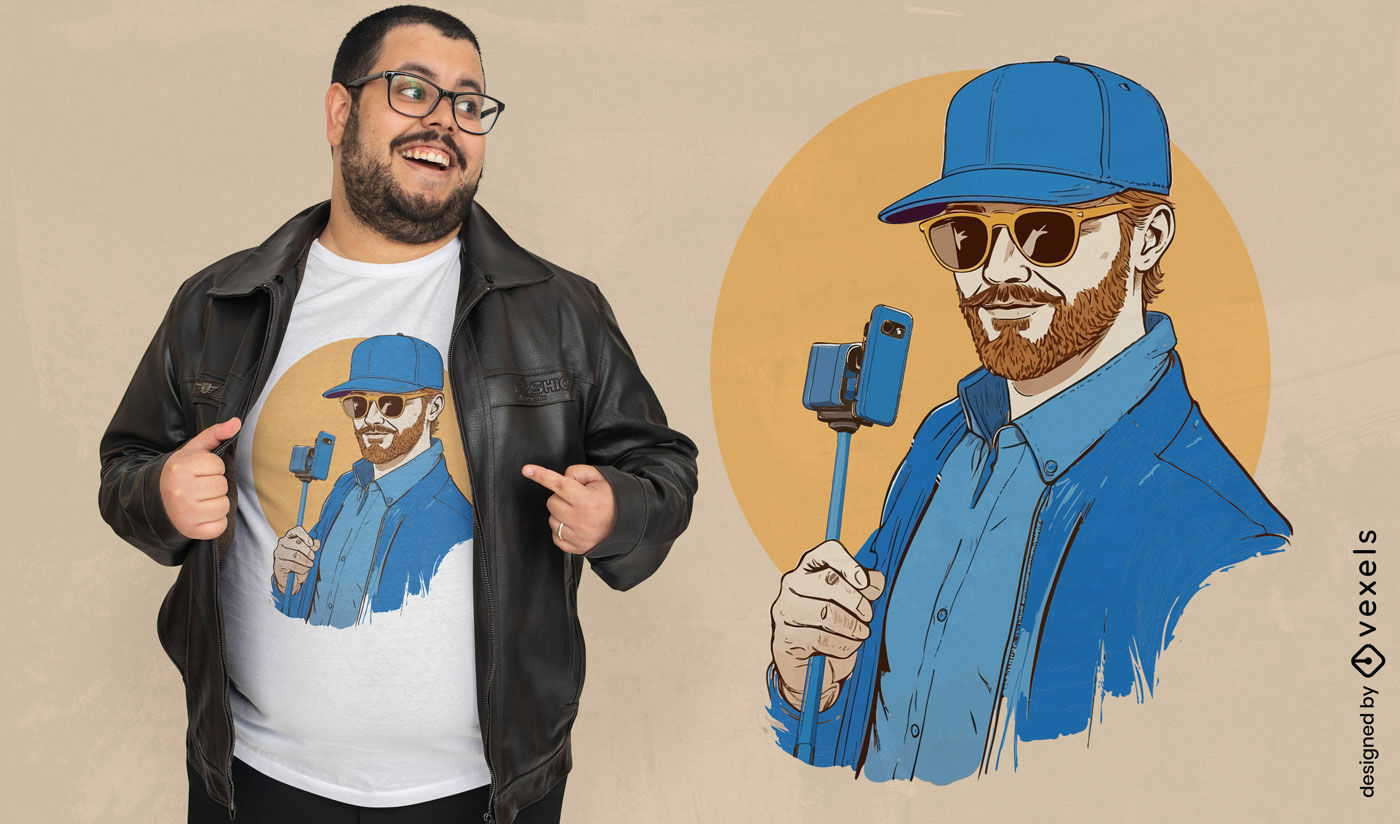
Design de camiseta com bastão de selfie
Escolha uma pasta
Todos os favoritos
Criar novo
Salvar
Design de camiseta com bastão de selfie
texto editável
Pronto para imprimir
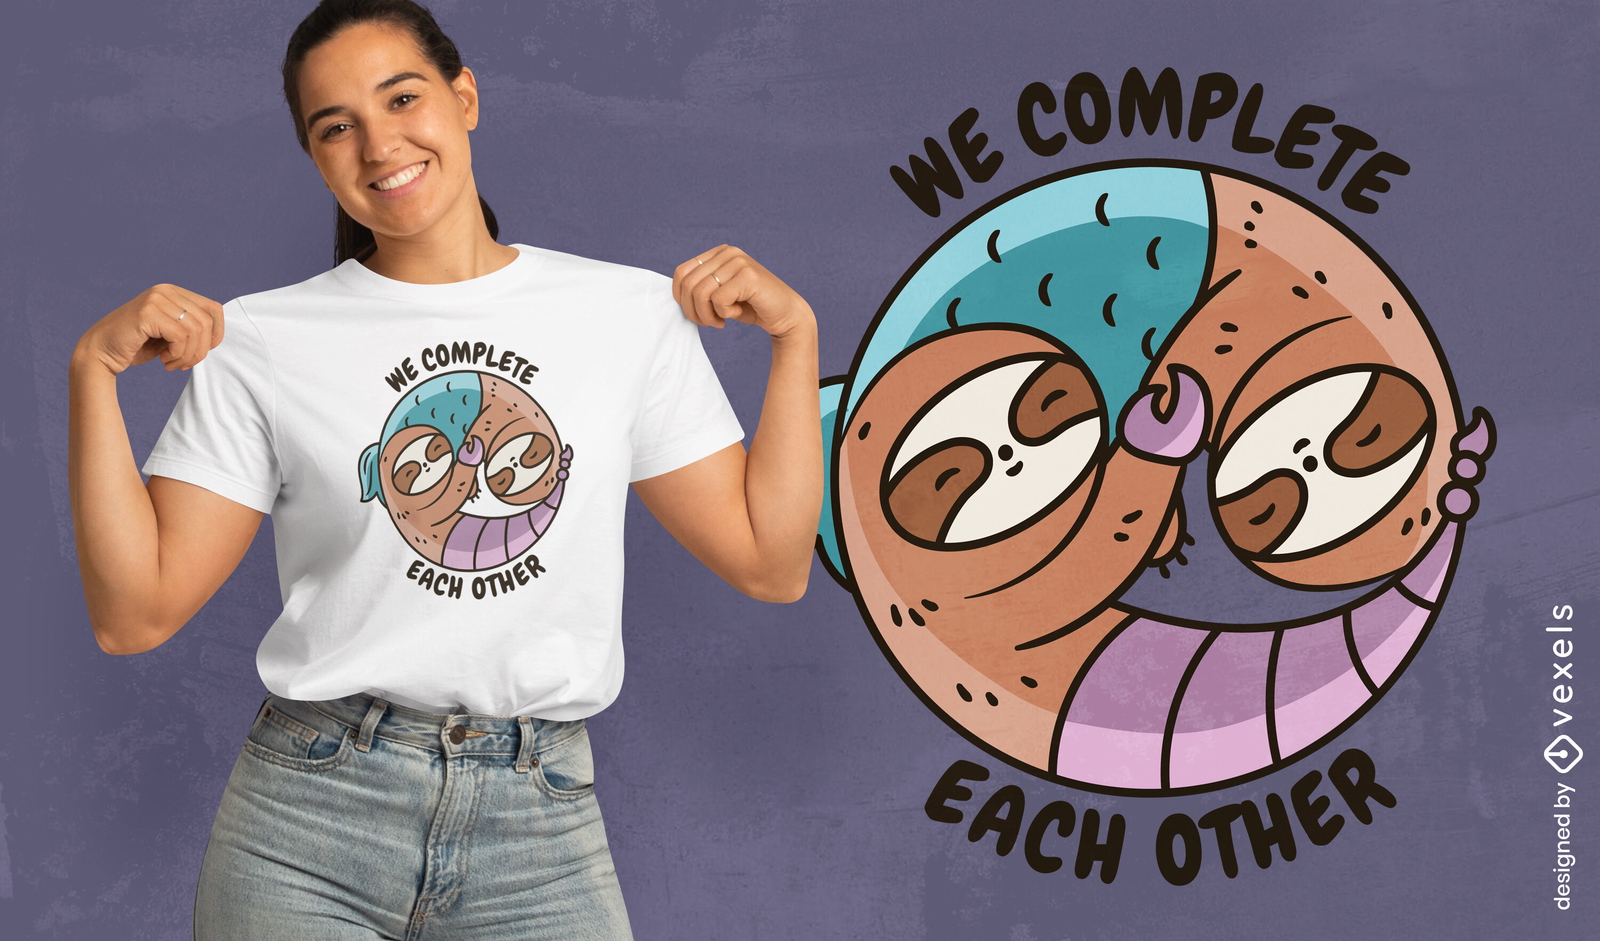
para Merch
Design de camiseta de desenho animado pregui?a yin yang
Escolha uma pasta
Todos os favoritos
Criar novo
Salvar
Design de camiseta de desenho animado pregui?a yin yang
Pronto para imprimir
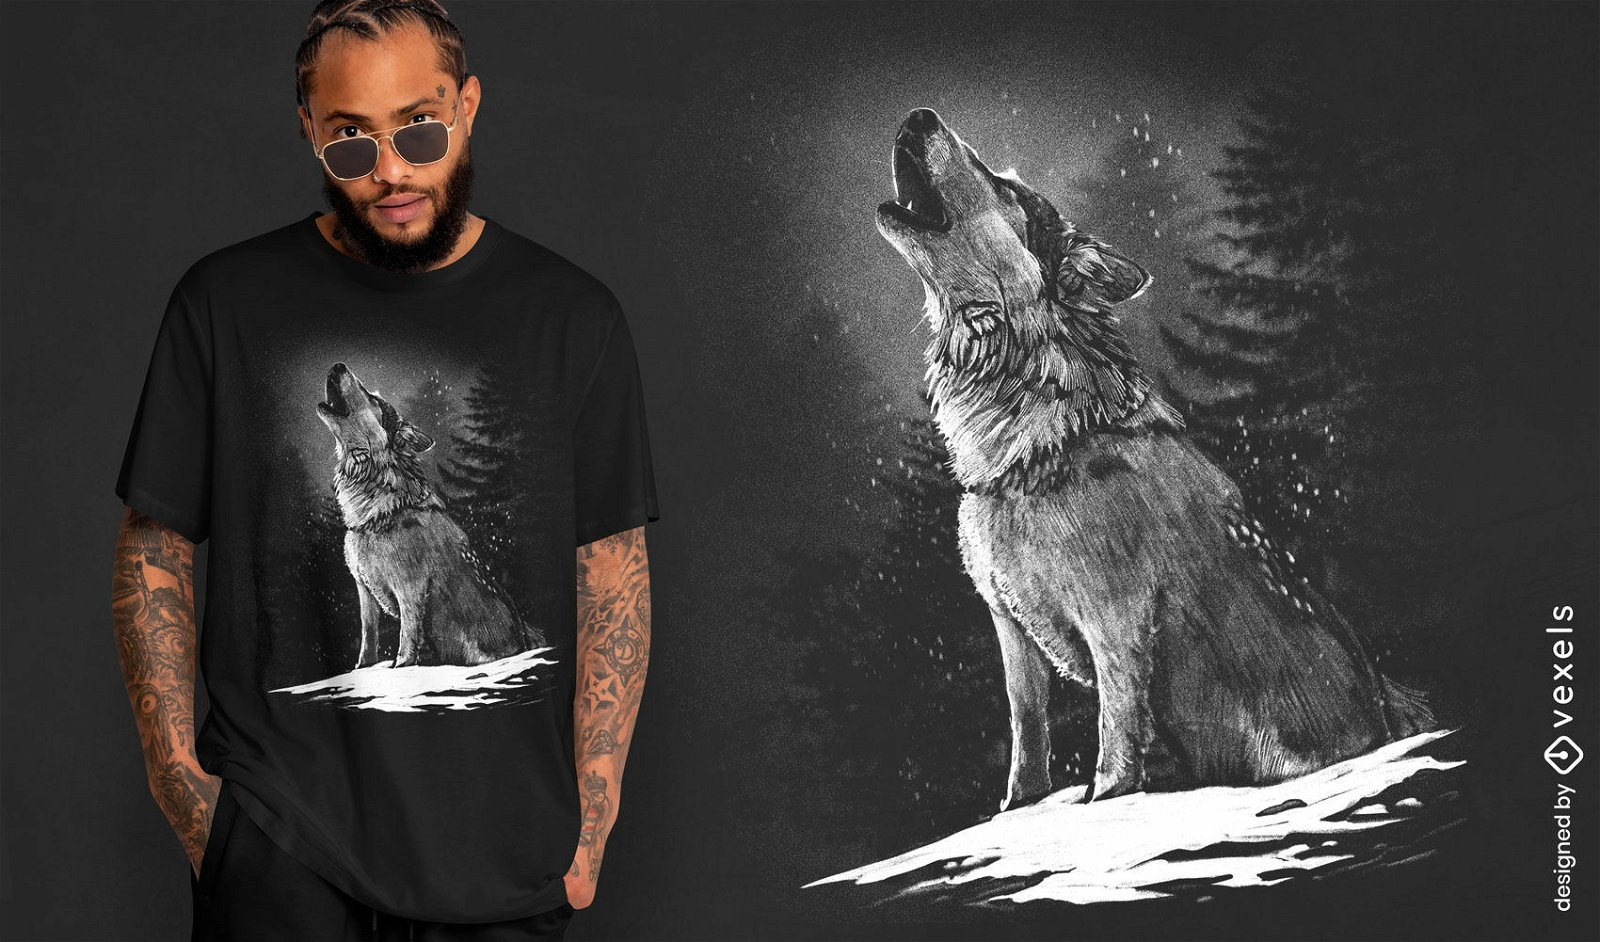
para Merch
Design de camiseta realista de lobo uivando
Escolha uma pasta
Todos os favoritos
Criar novo
Salvar
Design de camiseta realista de lobo uivando
Pronto para imprimir
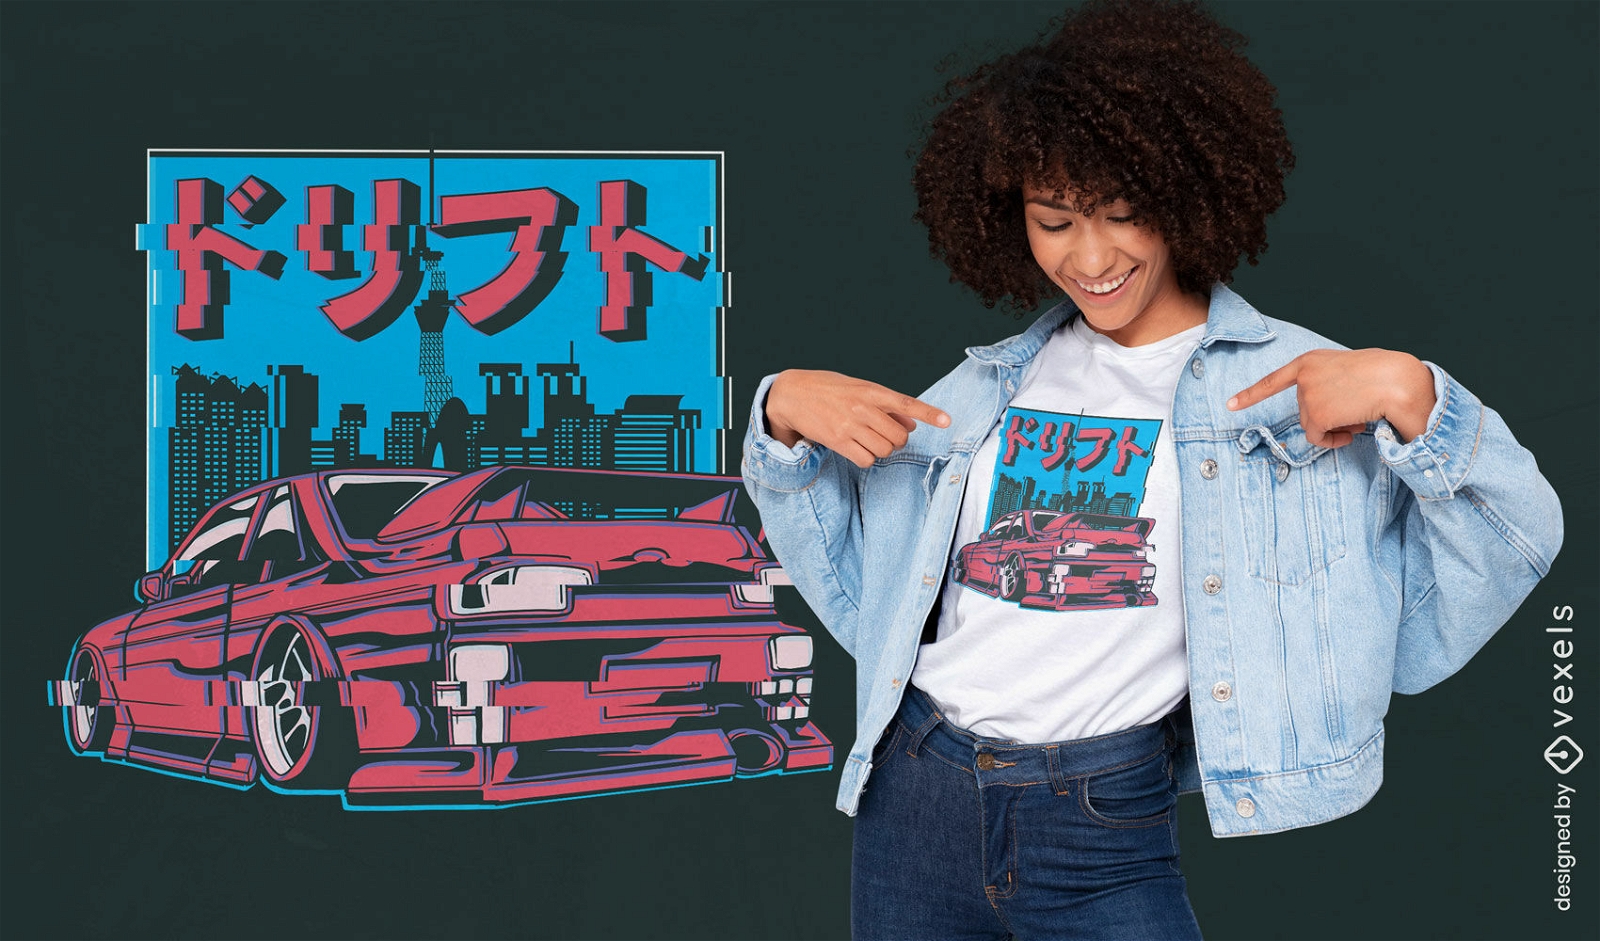
para Merch
Design de camiseta de carro com falha japonesa
Escolha uma pasta
Todos os favoritos
Criar novo
Salvar
Design de camiseta de carro com falha japonesa
texto editável
Pronto para imprimir
para Merch
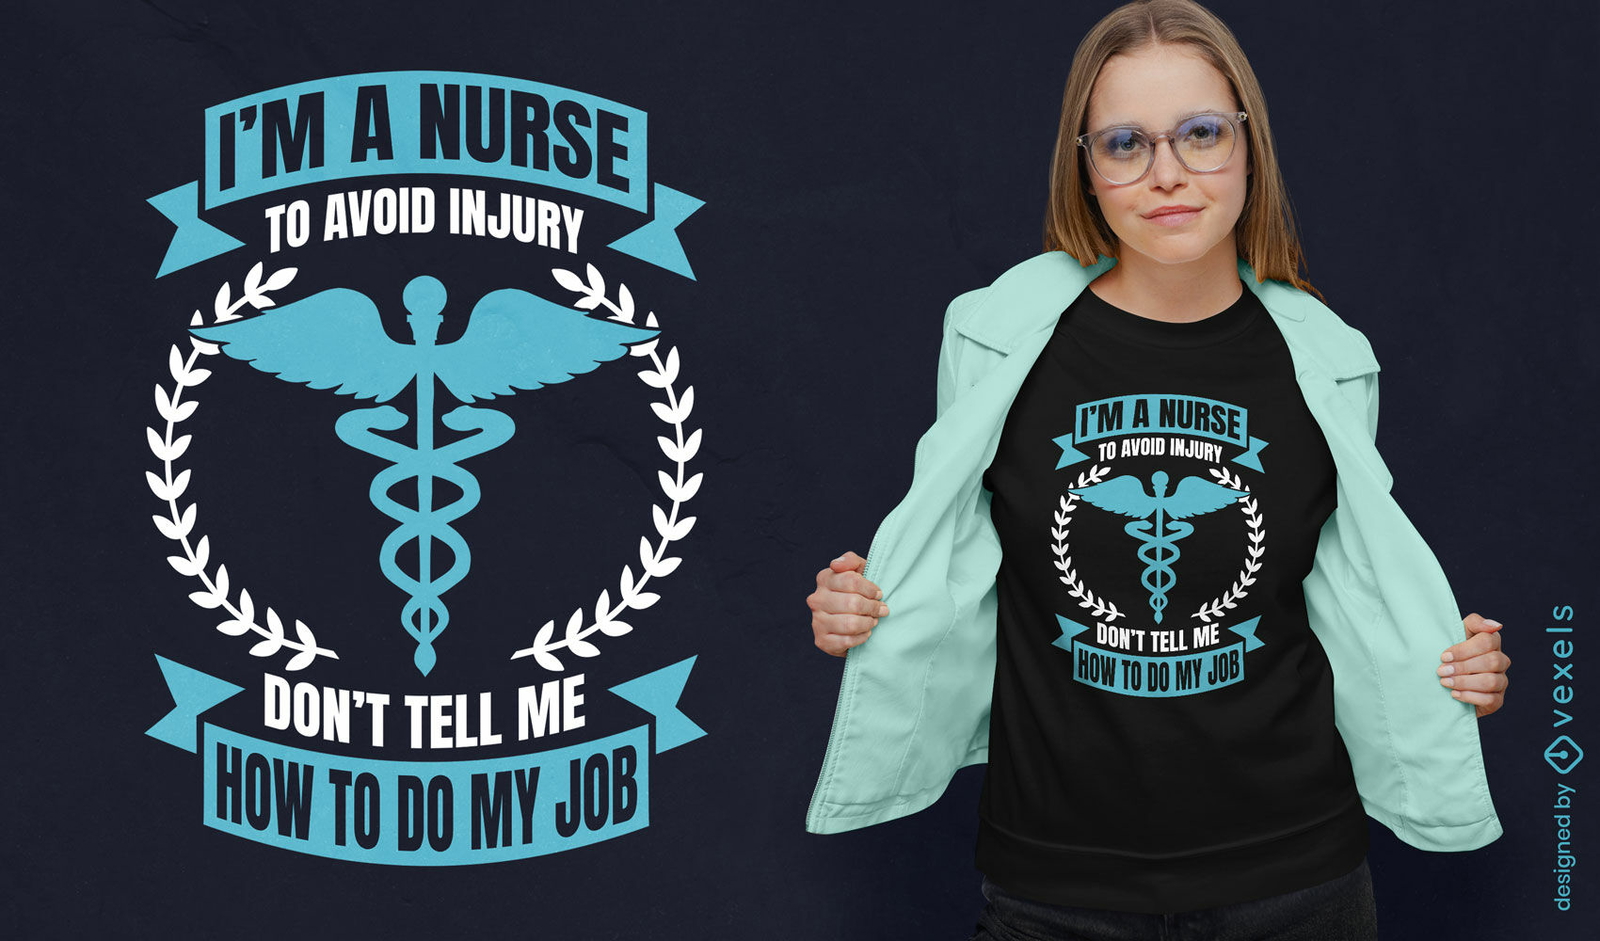
Design de camiseta de citação de trabalho de enfermeira
Escolha uma pasta
Todos os favoritos
Criar novo
Salvar
Design de camiseta de citação de trabalho de enfermeira
Pronto para imprimir
para Merch
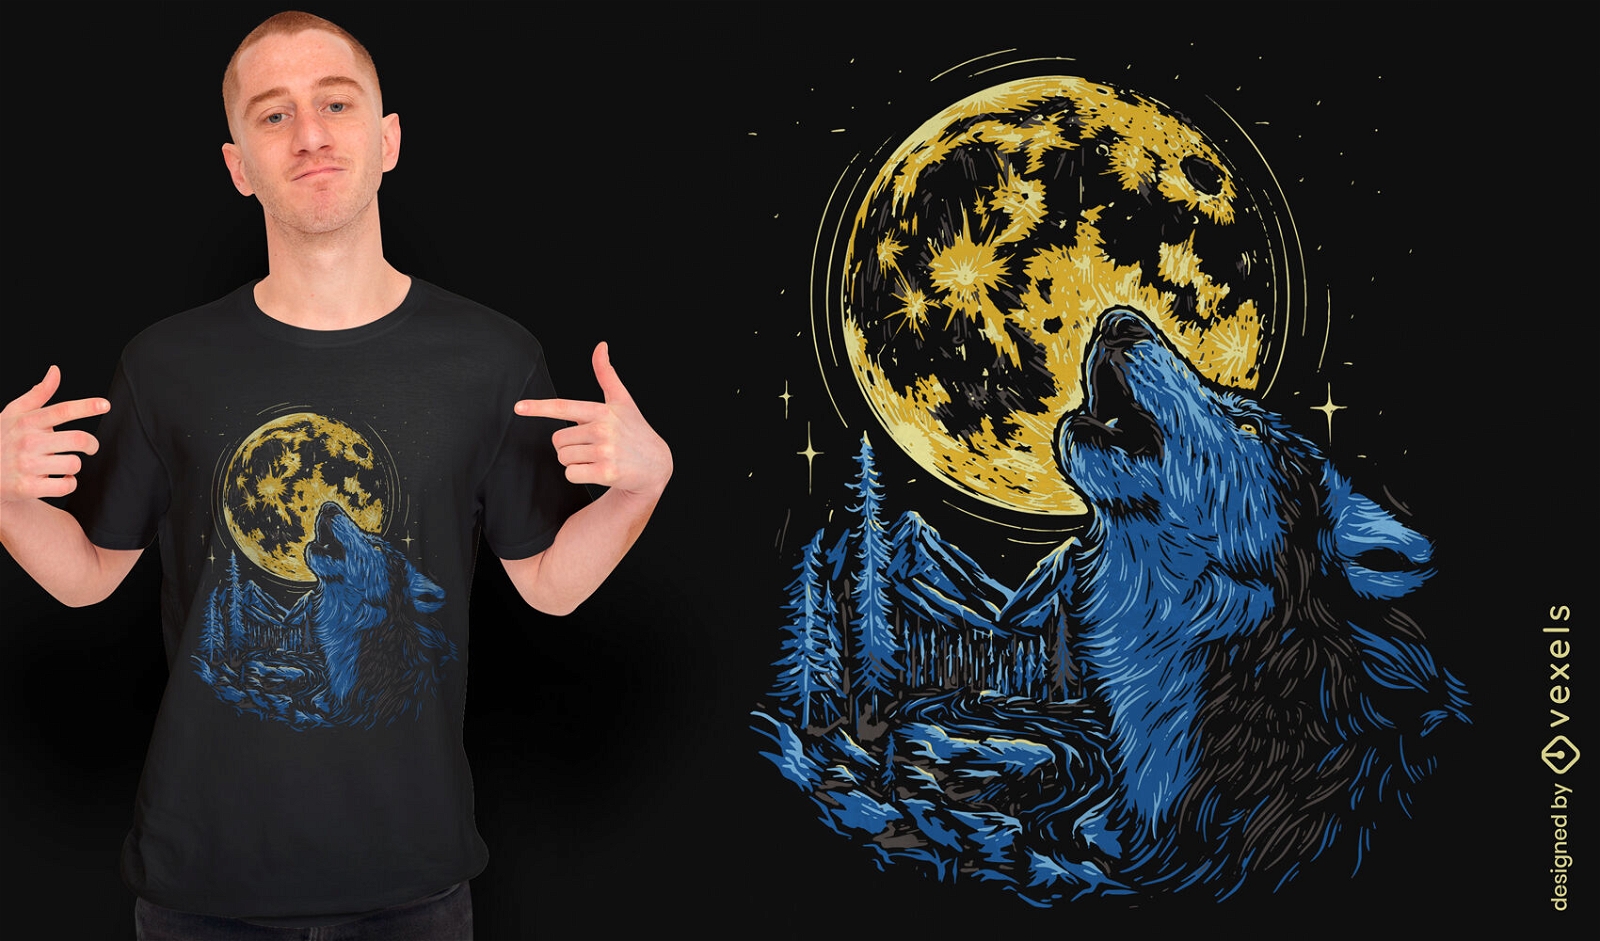
Design de camiseta de lua uivante de lobo
Escolha uma pasta
Todos os favoritos
Criar novo
Salvar
Design de camiseta de lua uivante de lobo
Pronto para imprimir
para Merch
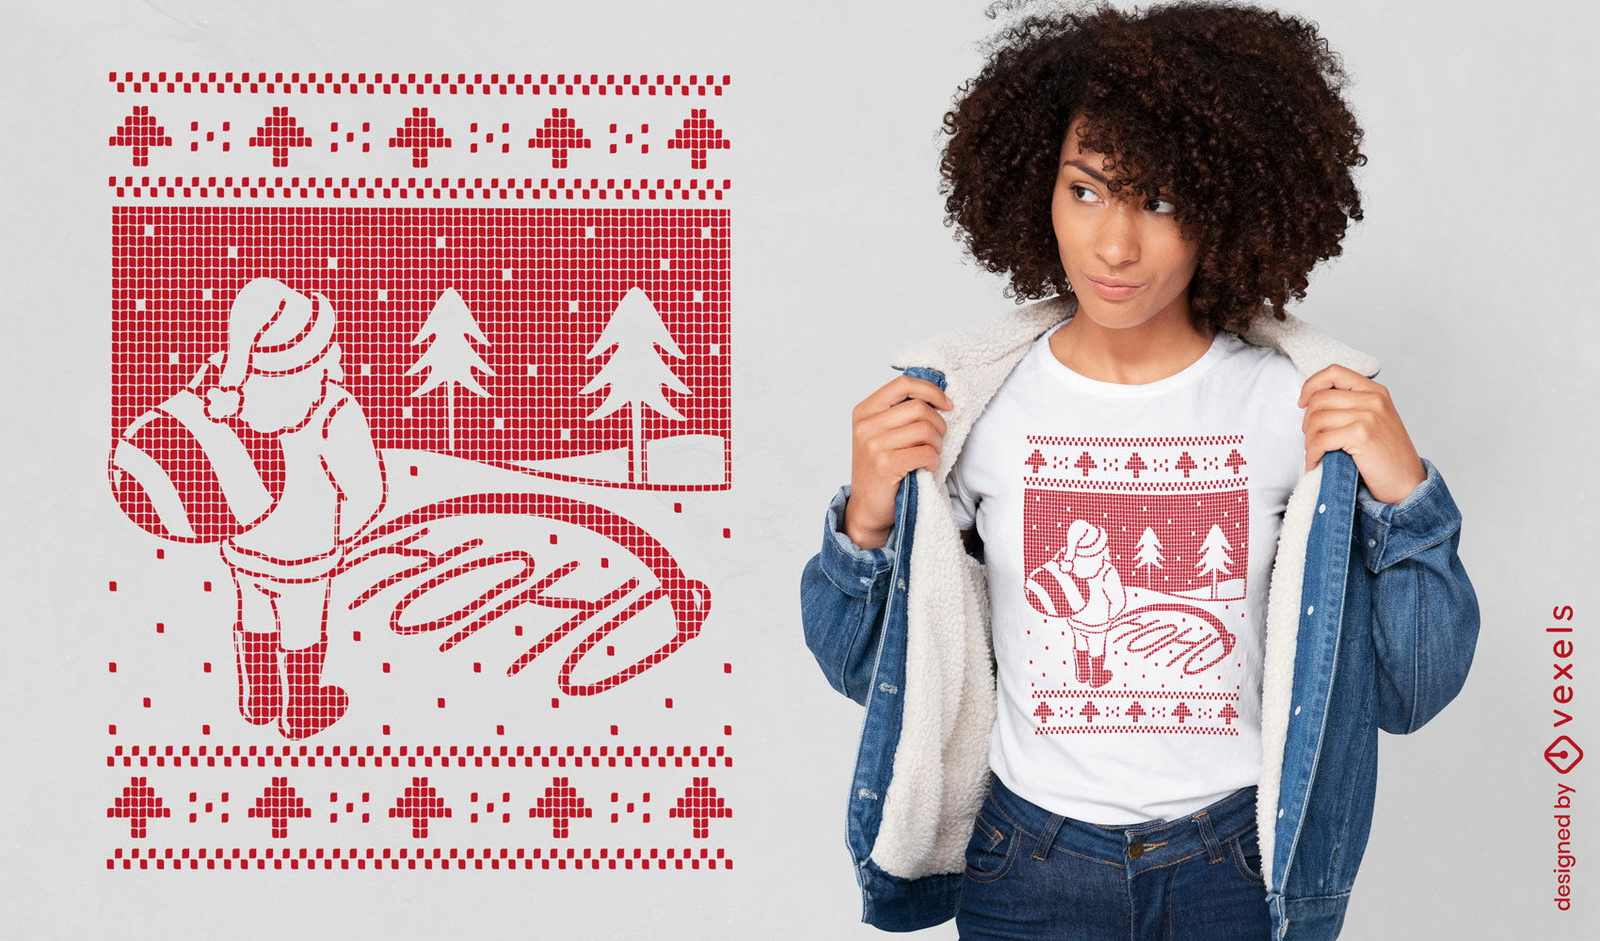
Design de camiseta de suéter feio engraçado de papai noel
Escolha uma pasta
Todos os favoritos
Criar novo
Salvar
Design de camiseta de suéter feio engraçado de papai noel
Pronto para imprimir
para Merch
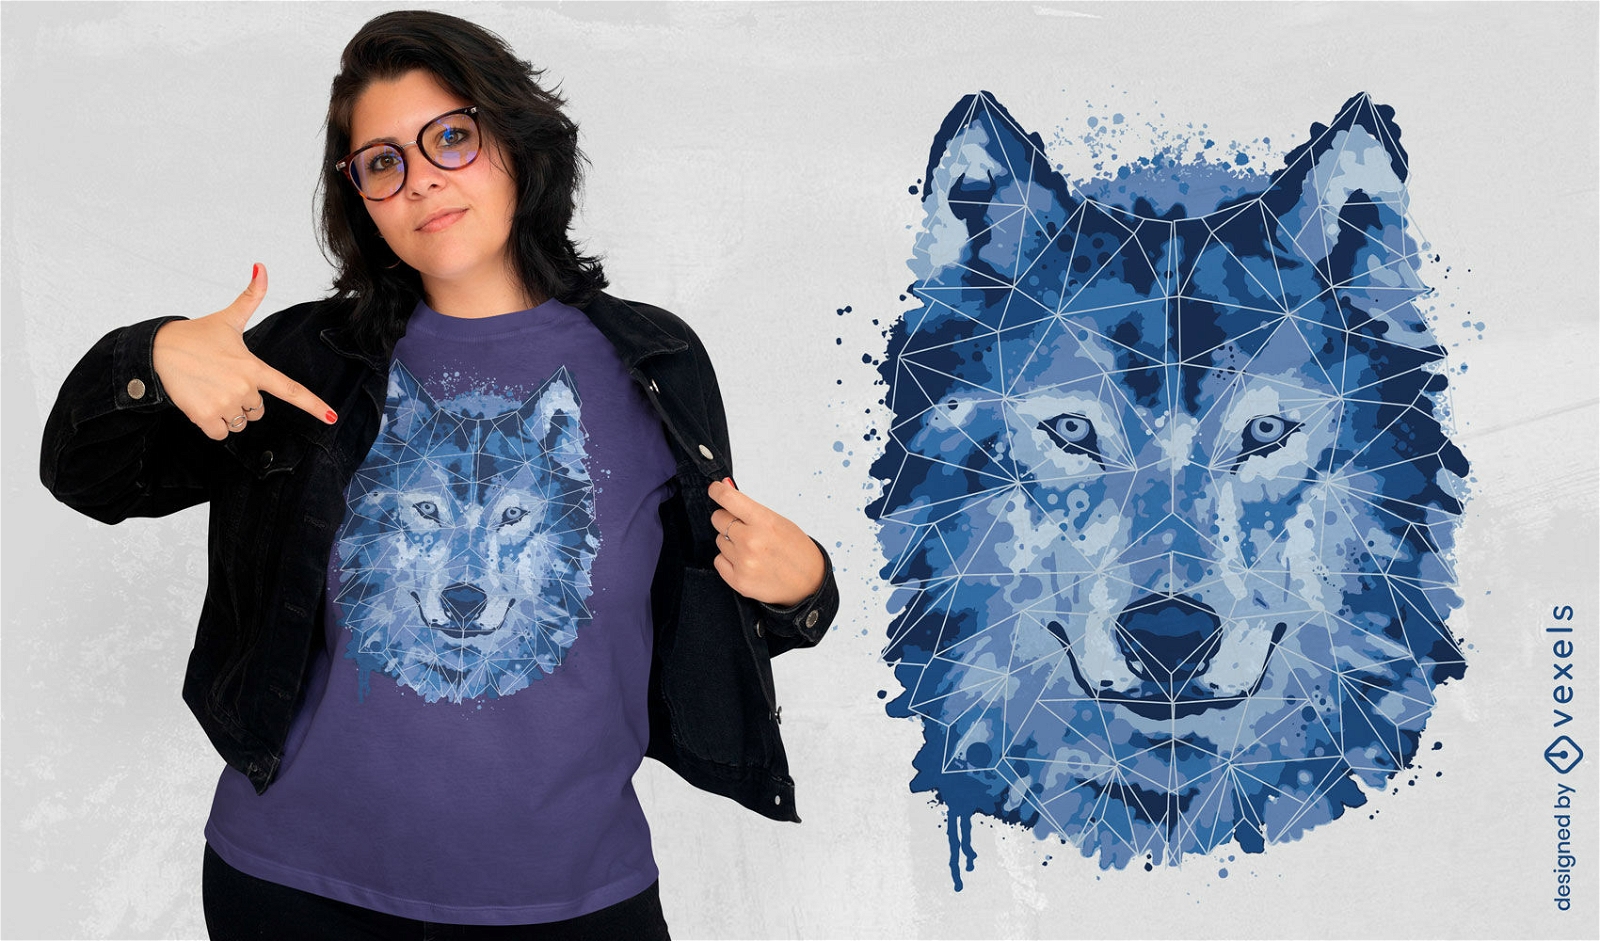
Design de camiseta em aquarela de animal lobo
Escolha uma pasta
Todos os favoritos
Criar novo
Salvar
Design de camiseta em aquarela de animal lobo
Pronto para imprimir
para Merch
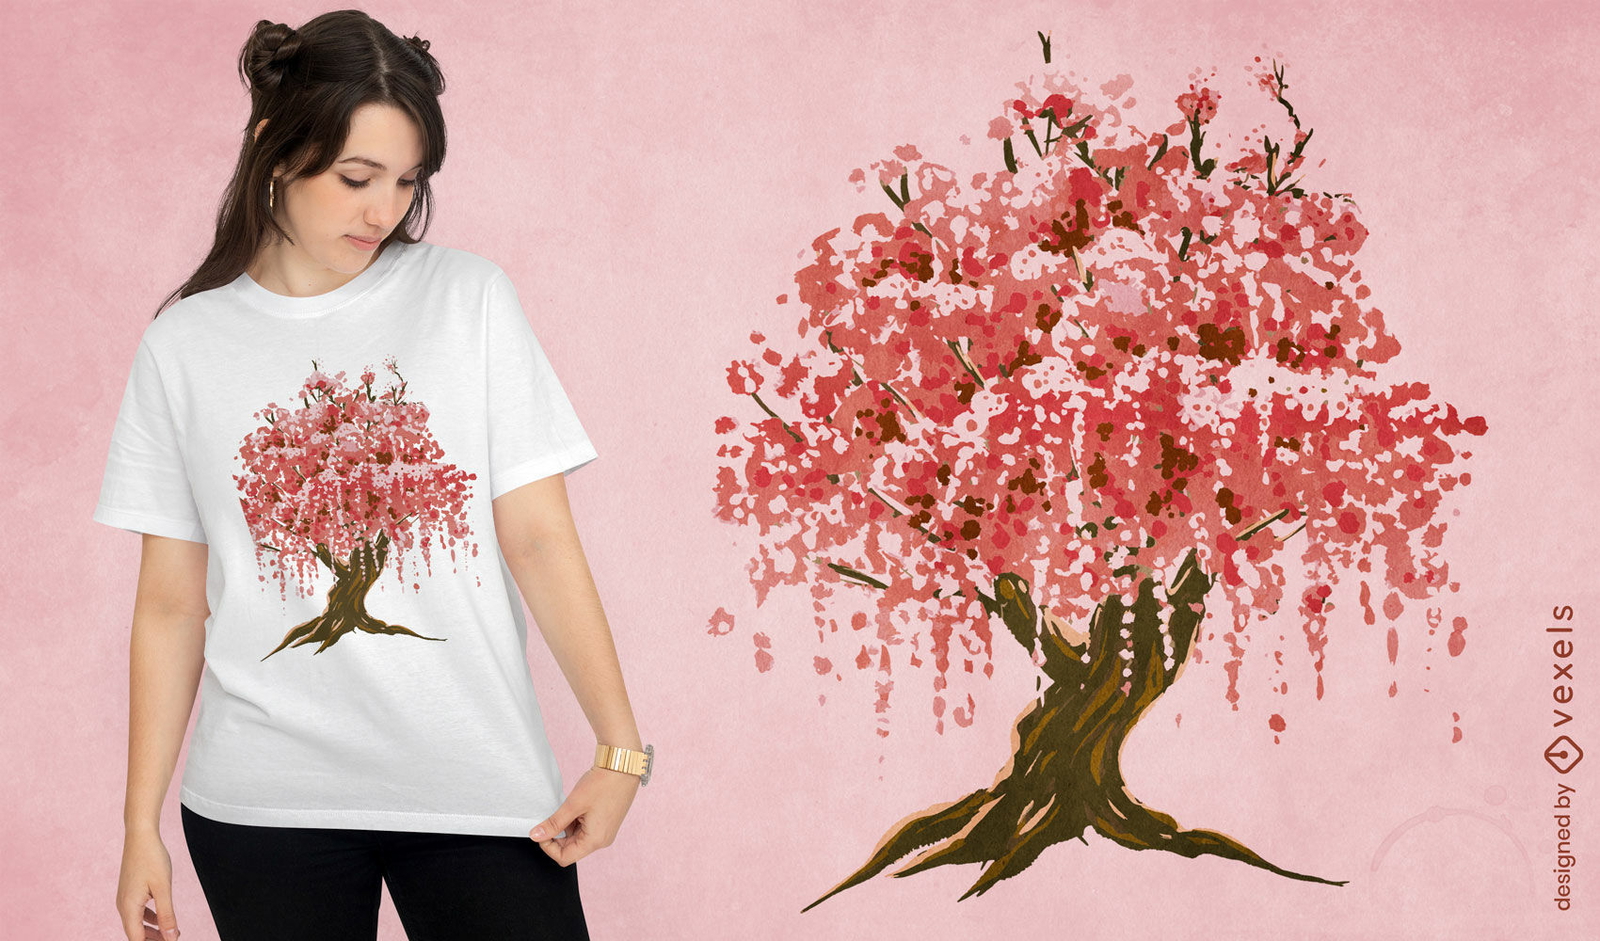
Design de camiseta em aquarela de árvore japonesa Sakura
Escolha uma pasta
Todos os favoritos
Criar novo
Salvar
Design de camiseta em aquarela de árvore japonesa Sakura
Pronto para imprimir
para Merch
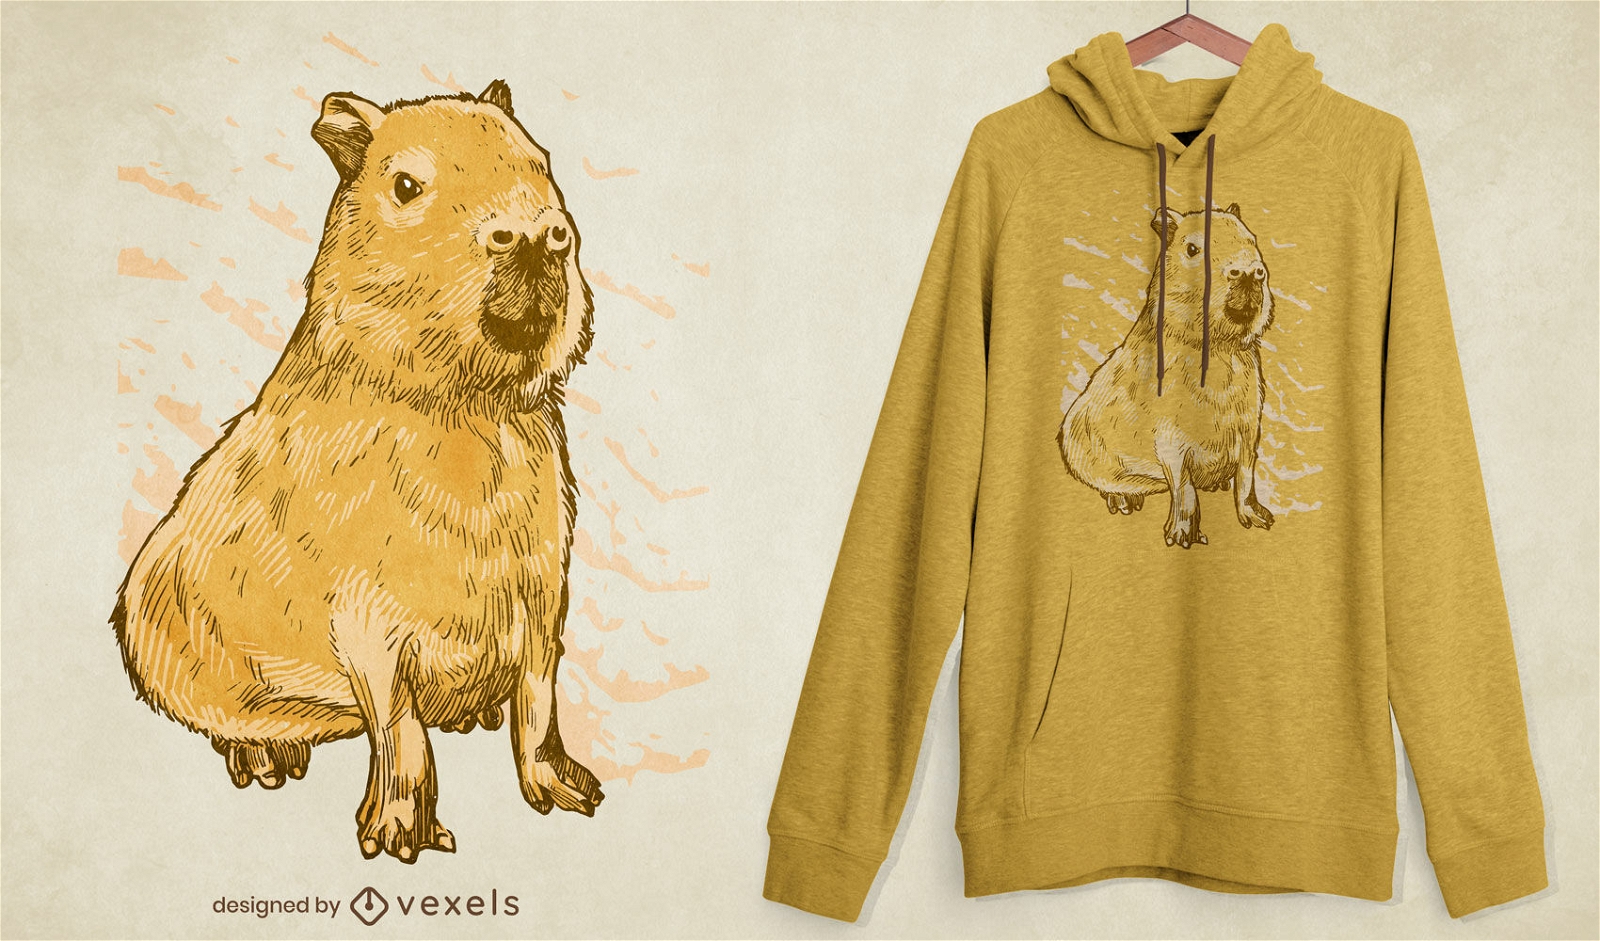
Design realista de camisetas com animais de capivara
Escolha uma pasta
Todos os favoritos
Criar novo
Salvar
Design realista de camisetas com animais de capivara
Pronto para imprimir
para Merch
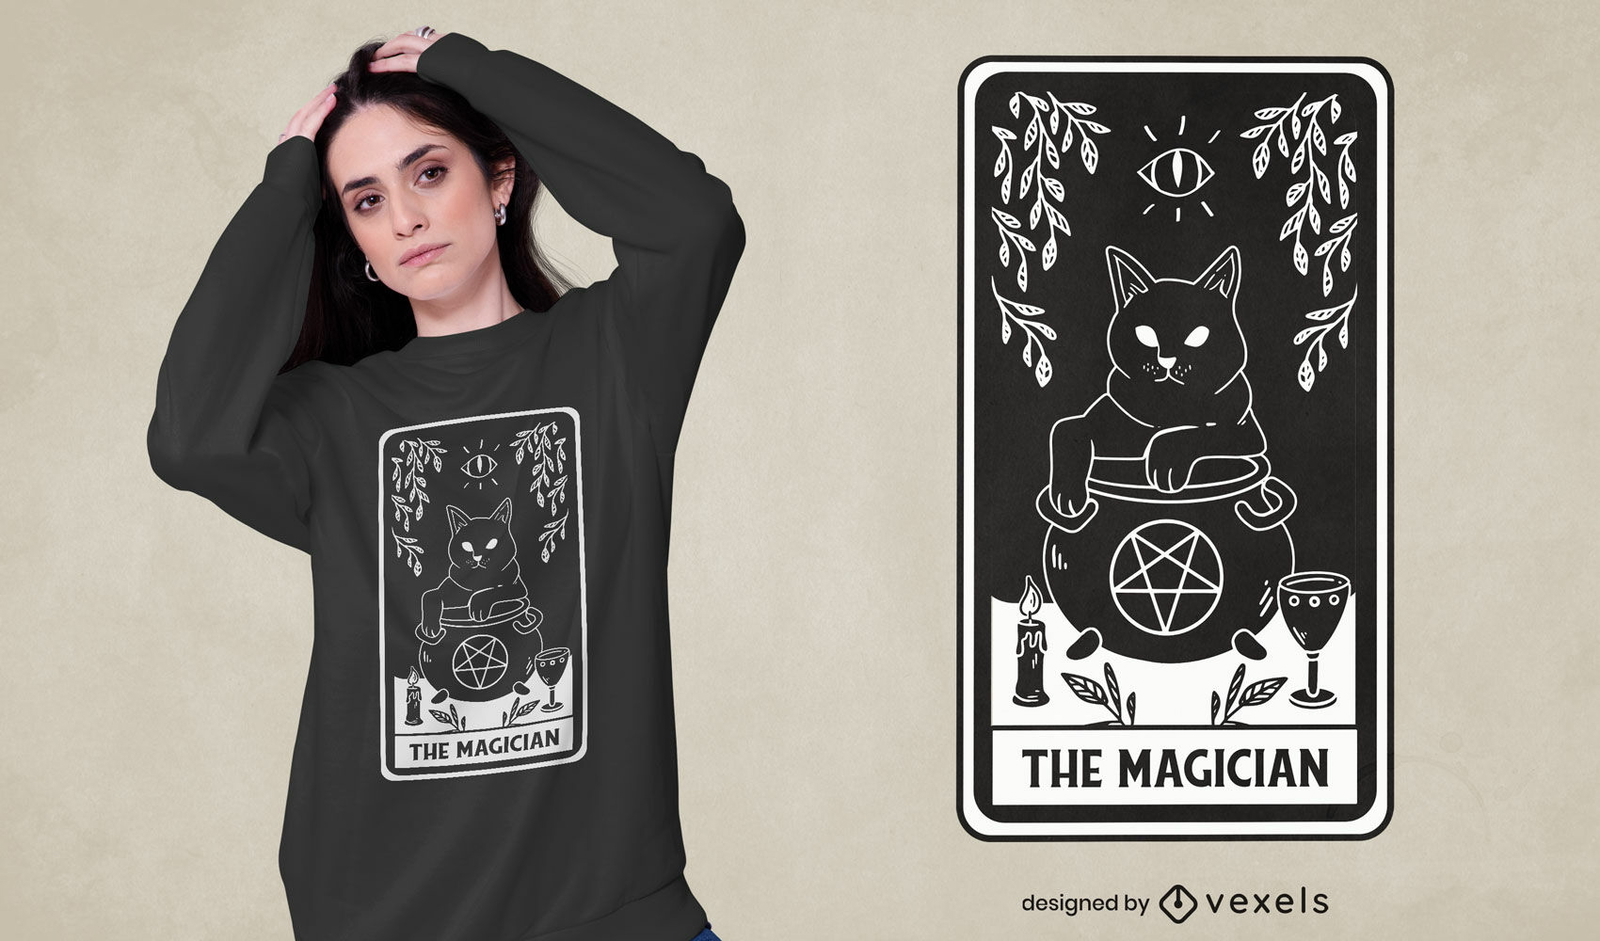
O design de t-shirt de cartão de tarô mágico
Escolha uma pasta
Todos os favoritos
Criar novo
Salvar
O design de t-shirt de cartão de tarô mágico
Pronto para imprimir
para Merch
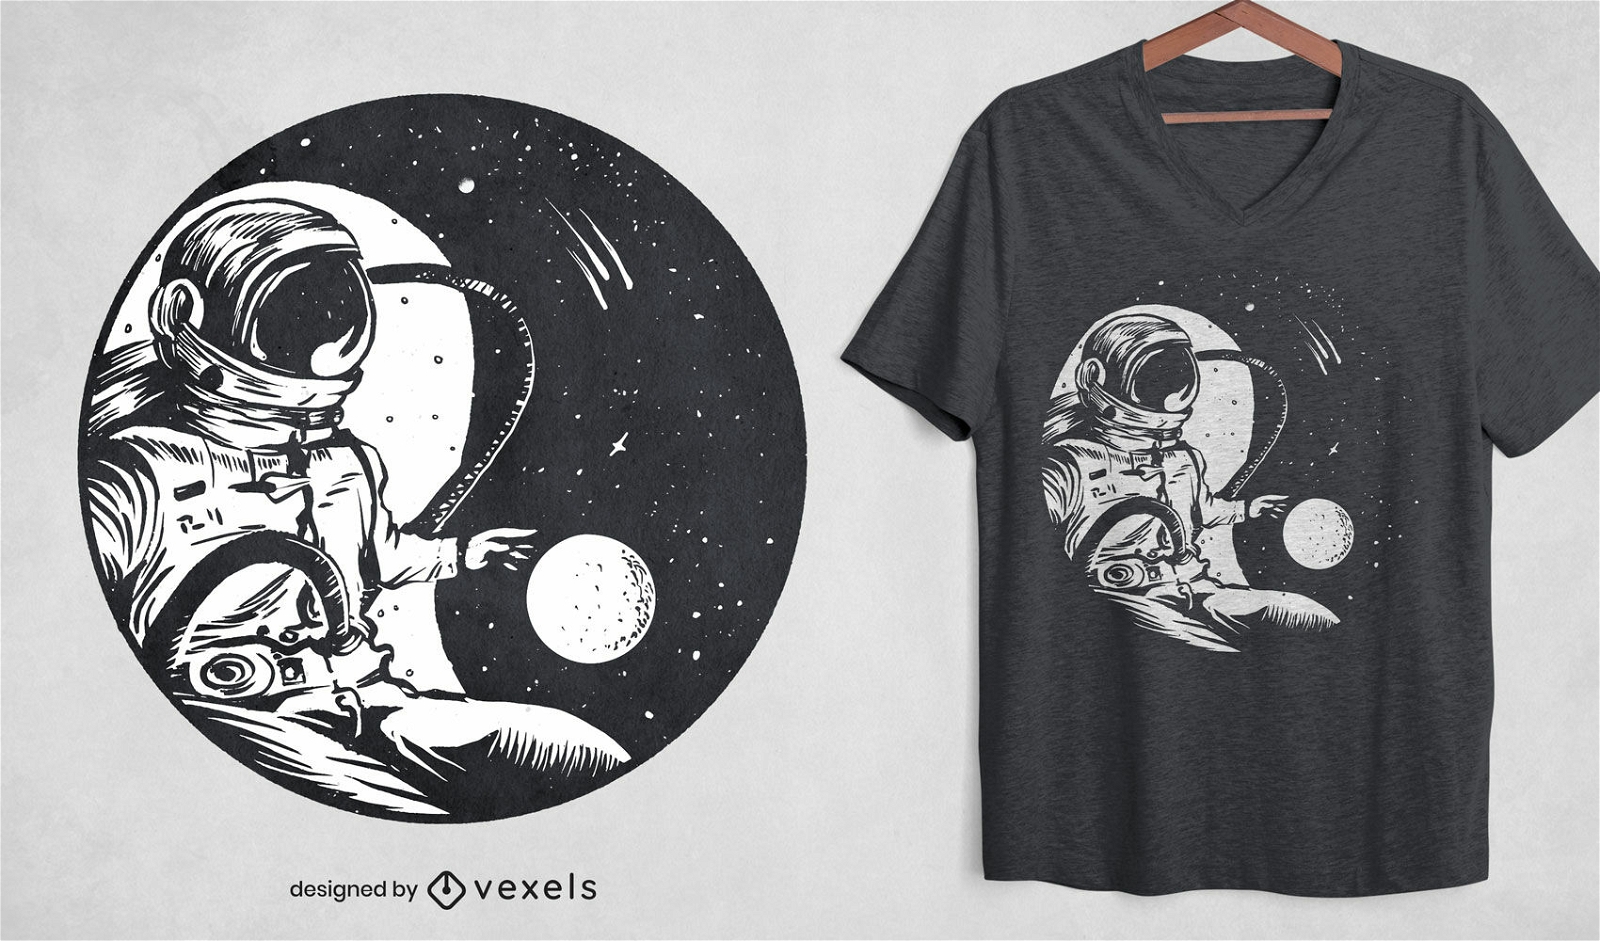
Astronauta yin yang design de camiseta espacial
Escolha uma pasta
Todos os favoritos
Criar novo
Salvar
Astronauta yin yang design de camiseta espacial
Pronto para imprimir
para Merch
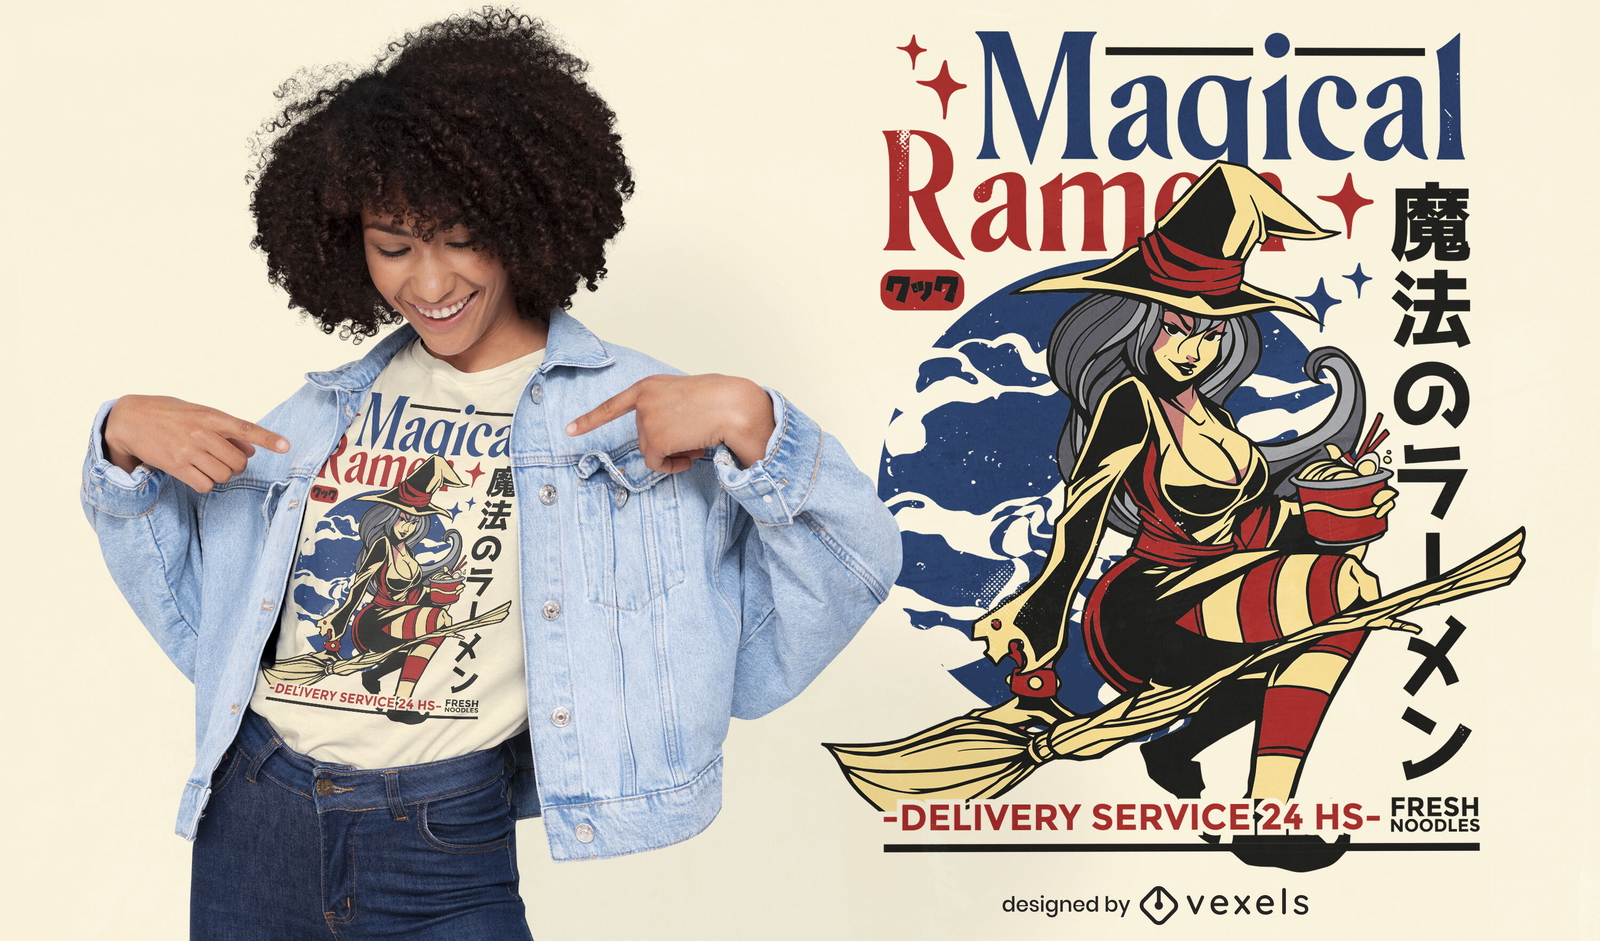
Design de camisetas fanáticas de macarrão com macarrão de bruxa
Escolha uma pasta
Todos os favoritos
Criar novo
Salvar
Design de camisetas fanáticas de macarrão com macarrão de bruxa
Pronto para imprimir
para Merch
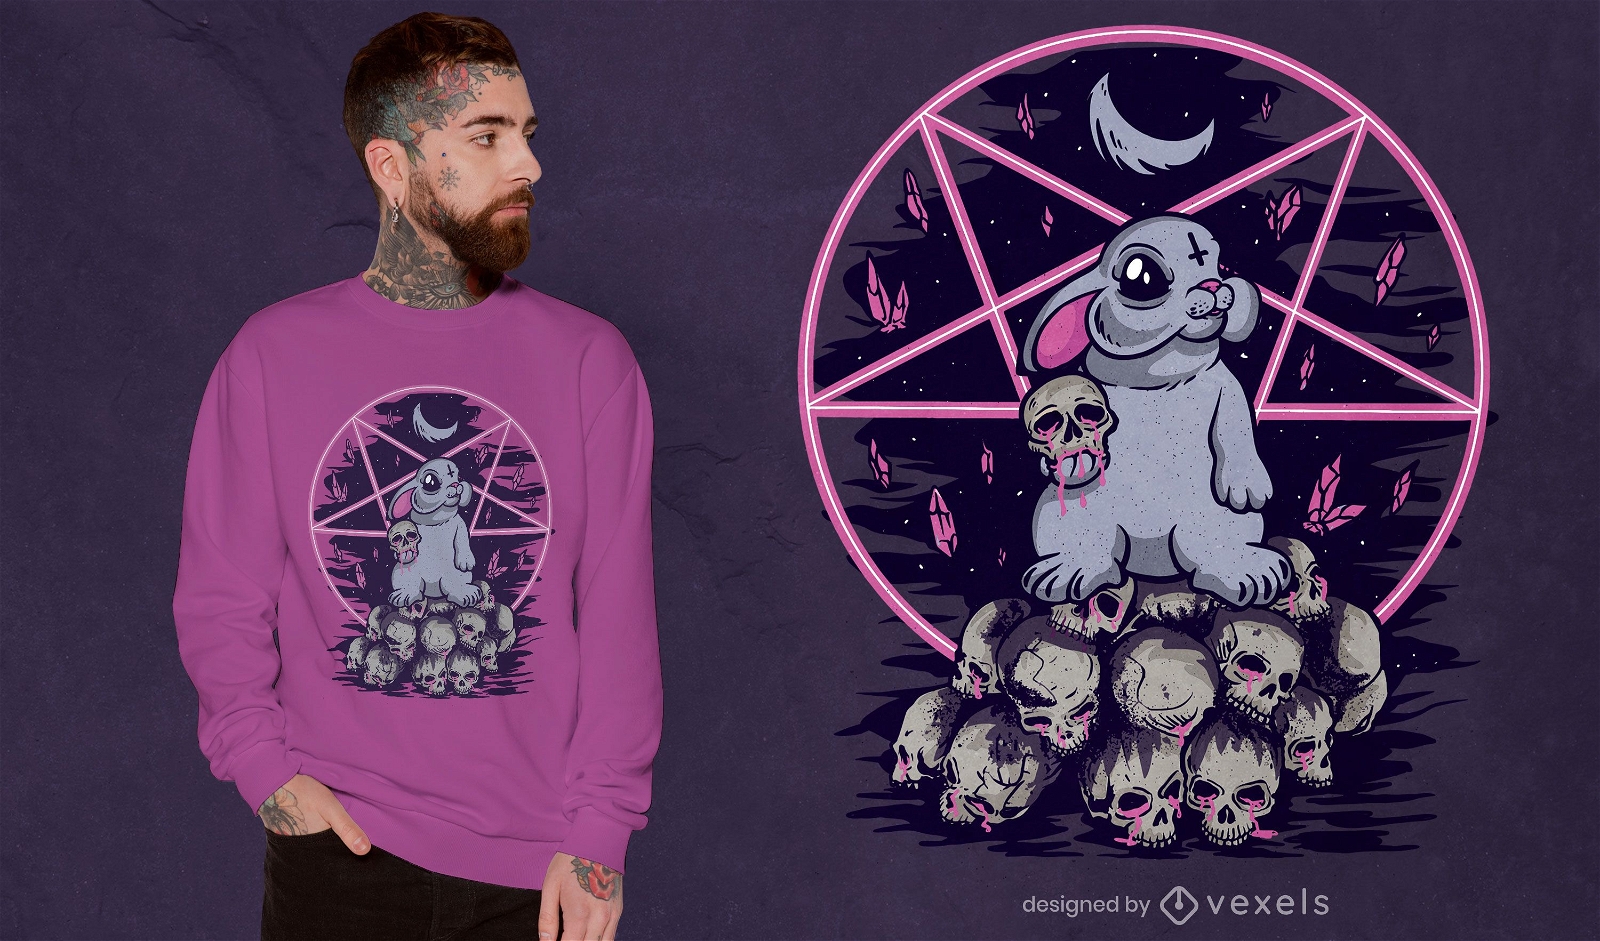
Design esotérico de t-shirt de coelho assustador
Escolha uma pasta
Todos os favoritos
Criar novo
Salvar
Design esotérico de t-shirt de coelho assustador
Pronto para imprimir
para Merch
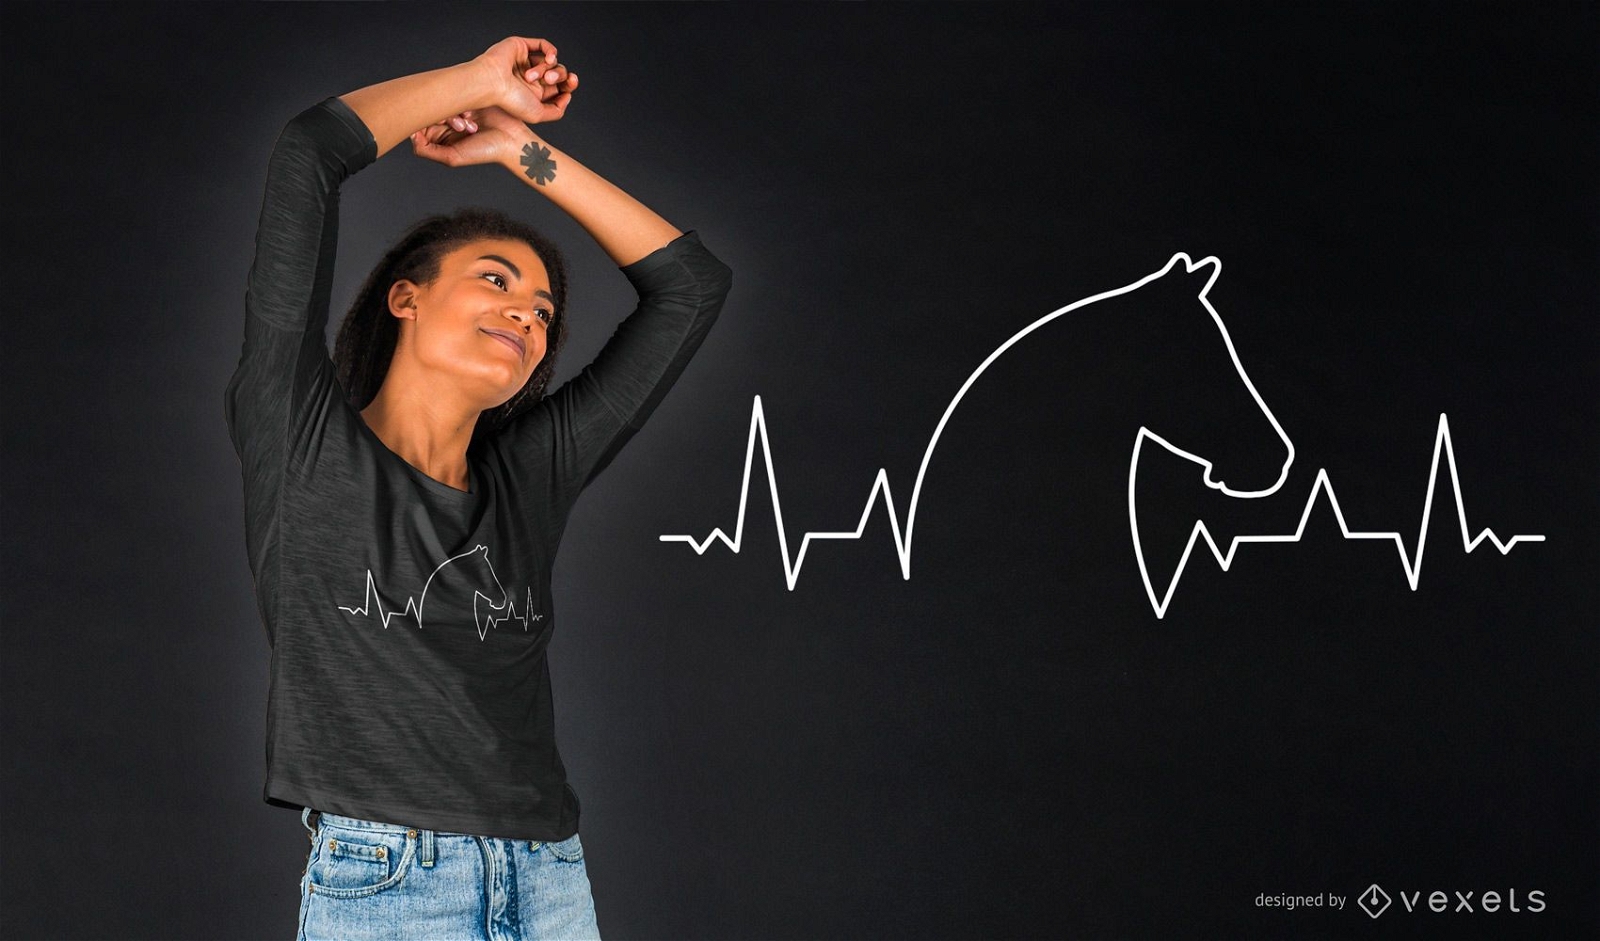
Design de camiseta do Horse Heartbeat
Escolha uma pasta
Todos os favoritos
Criar novo
Salvar
Design de camiseta do Horse Heartbeat
para Merch
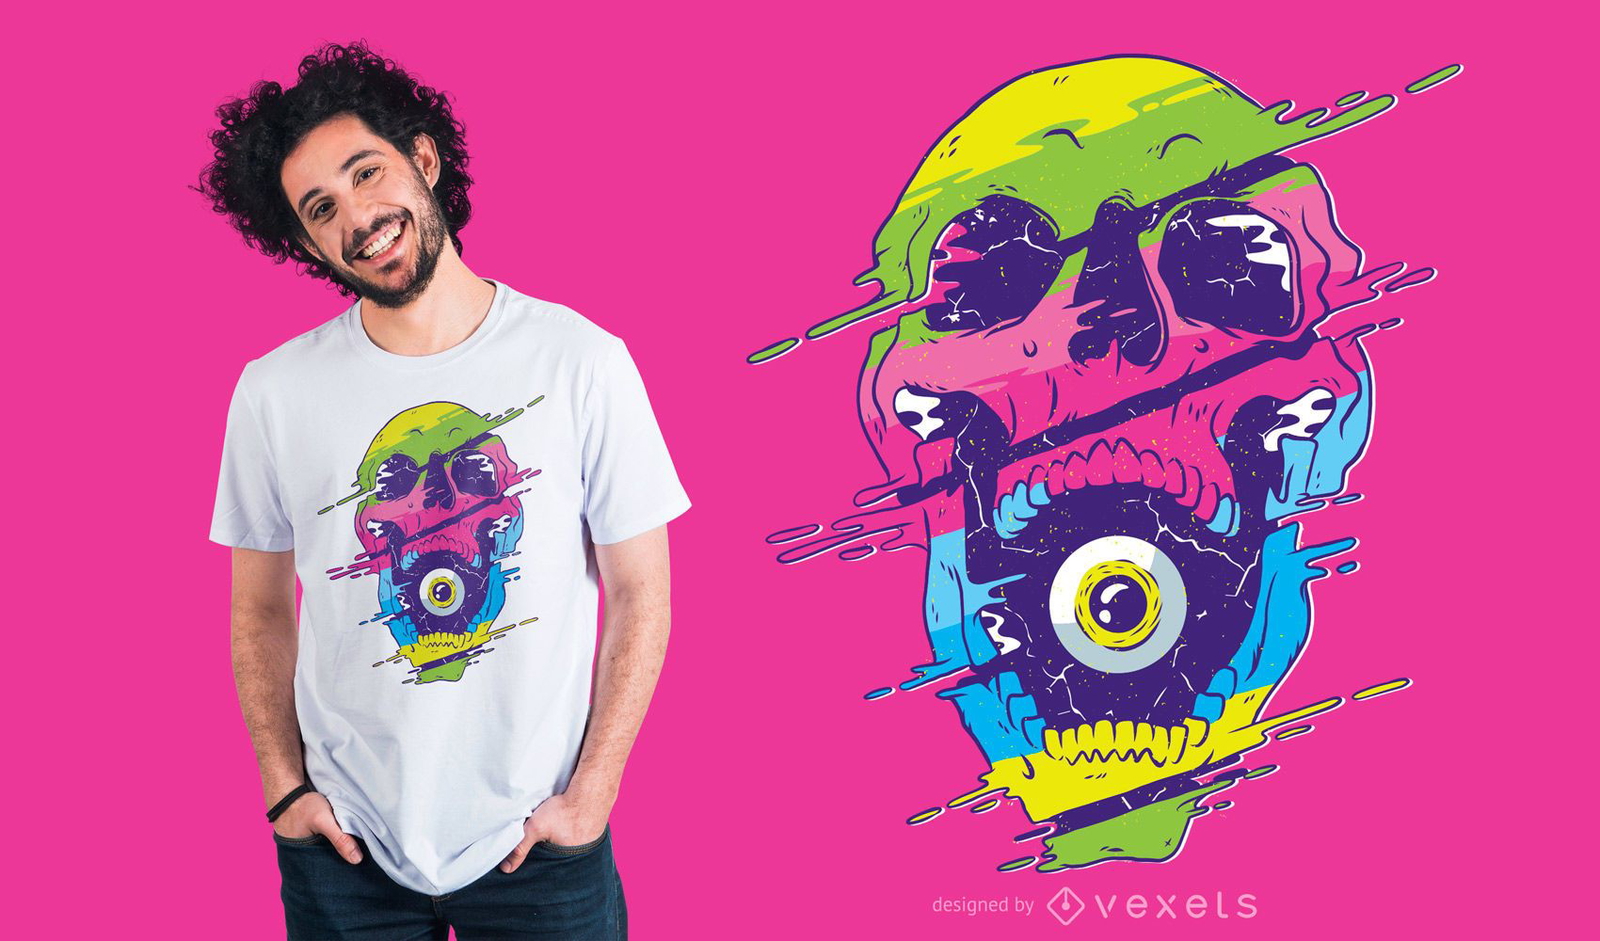
Design de camiseta de caveira psicodélica
Escolha uma pasta
Todos os favoritos
Criar novo
Salvar
Design de camiseta de caveira psicodélica
para Merch
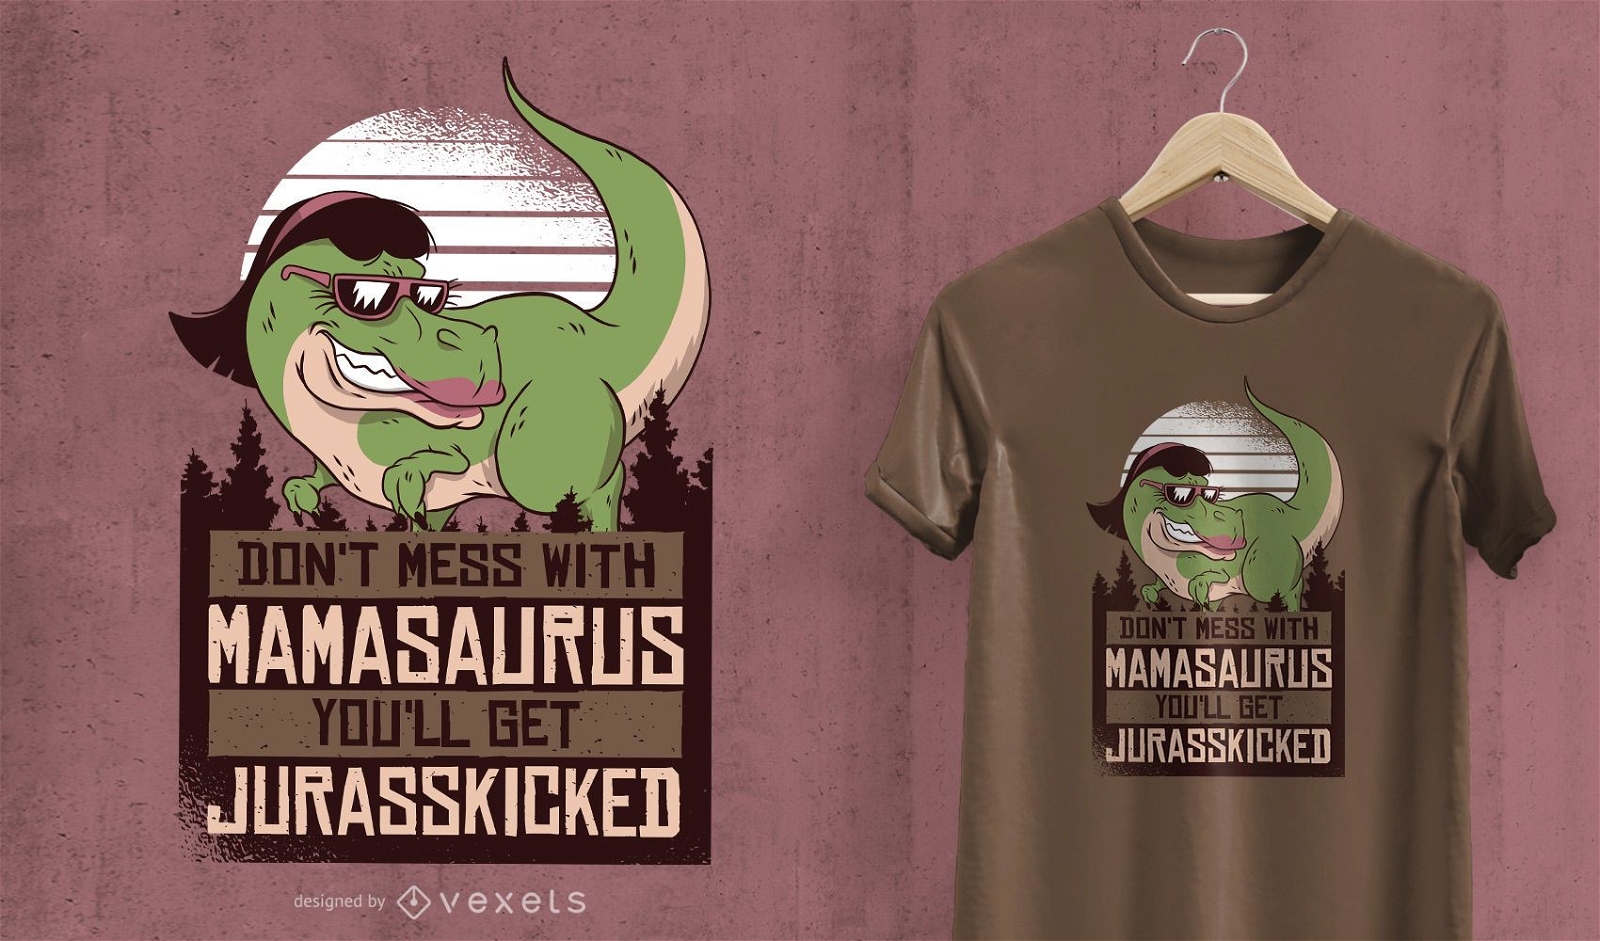
Mamasaurus Mom Dinosaur Design de camisetas
Escolha uma pasta
Todos os favoritos
Criar novo
Salvar
Mamasaurus Mom Dinosaur Design de camisetas
para Merch
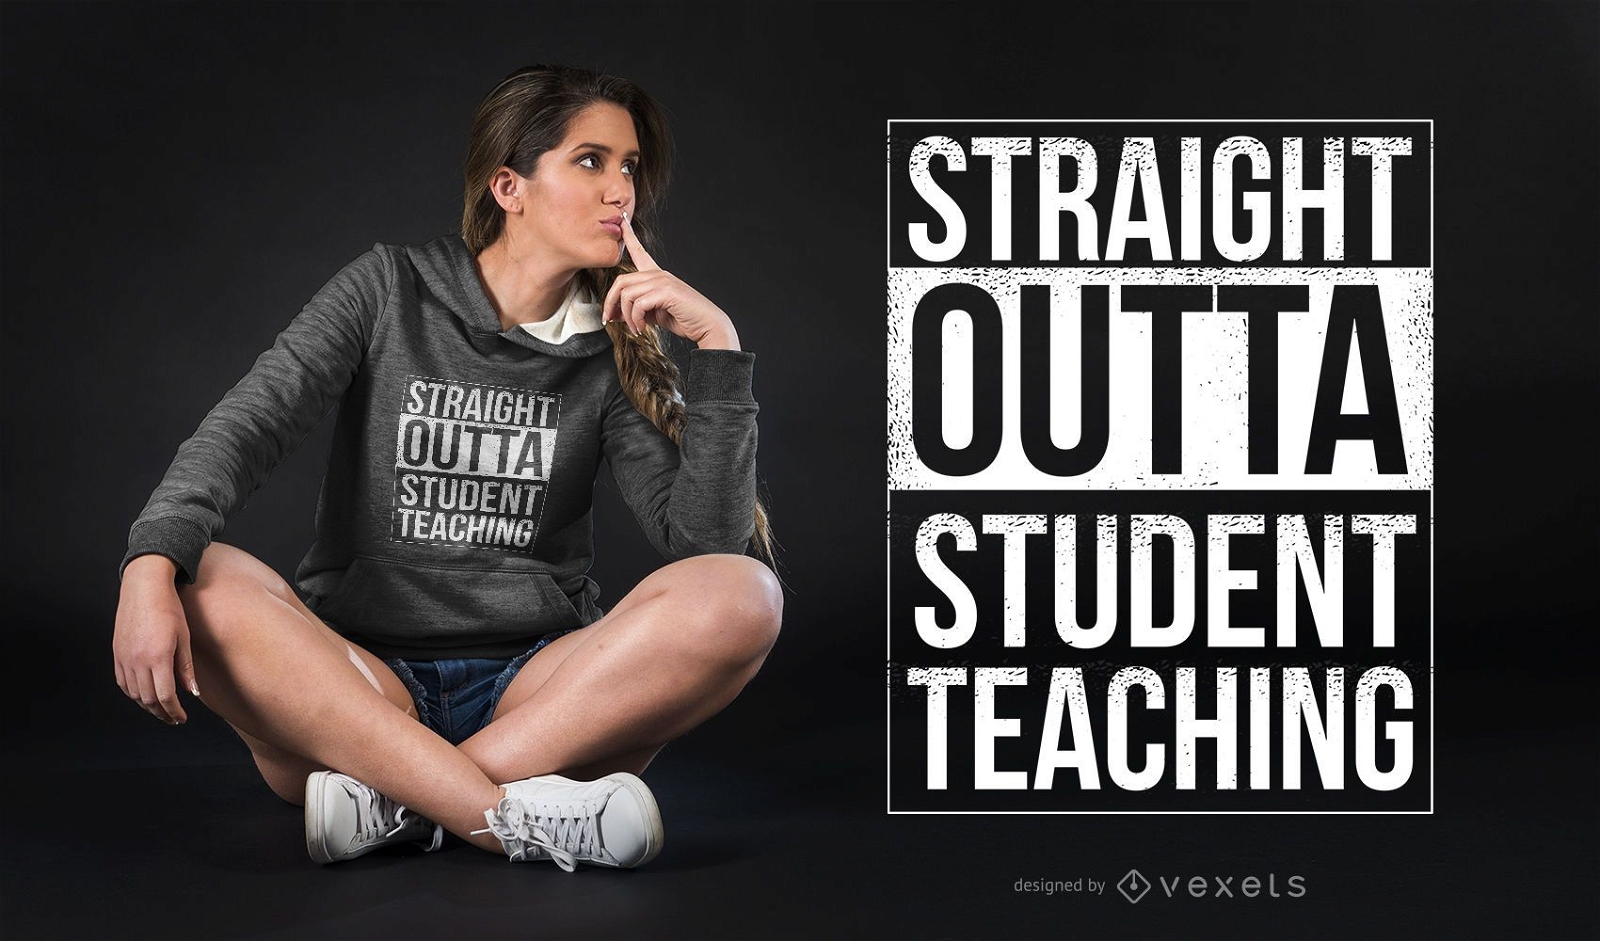
Straight Outta Aluno Ensinando Frase Engraçada Design de Camiseta Paródia
Escolha uma pasta
Todos os favoritos
Criar novo
Salvar
Straight Outta Aluno Ensinando Frase Engraçada Design de Camiseta Paródia
para Merch
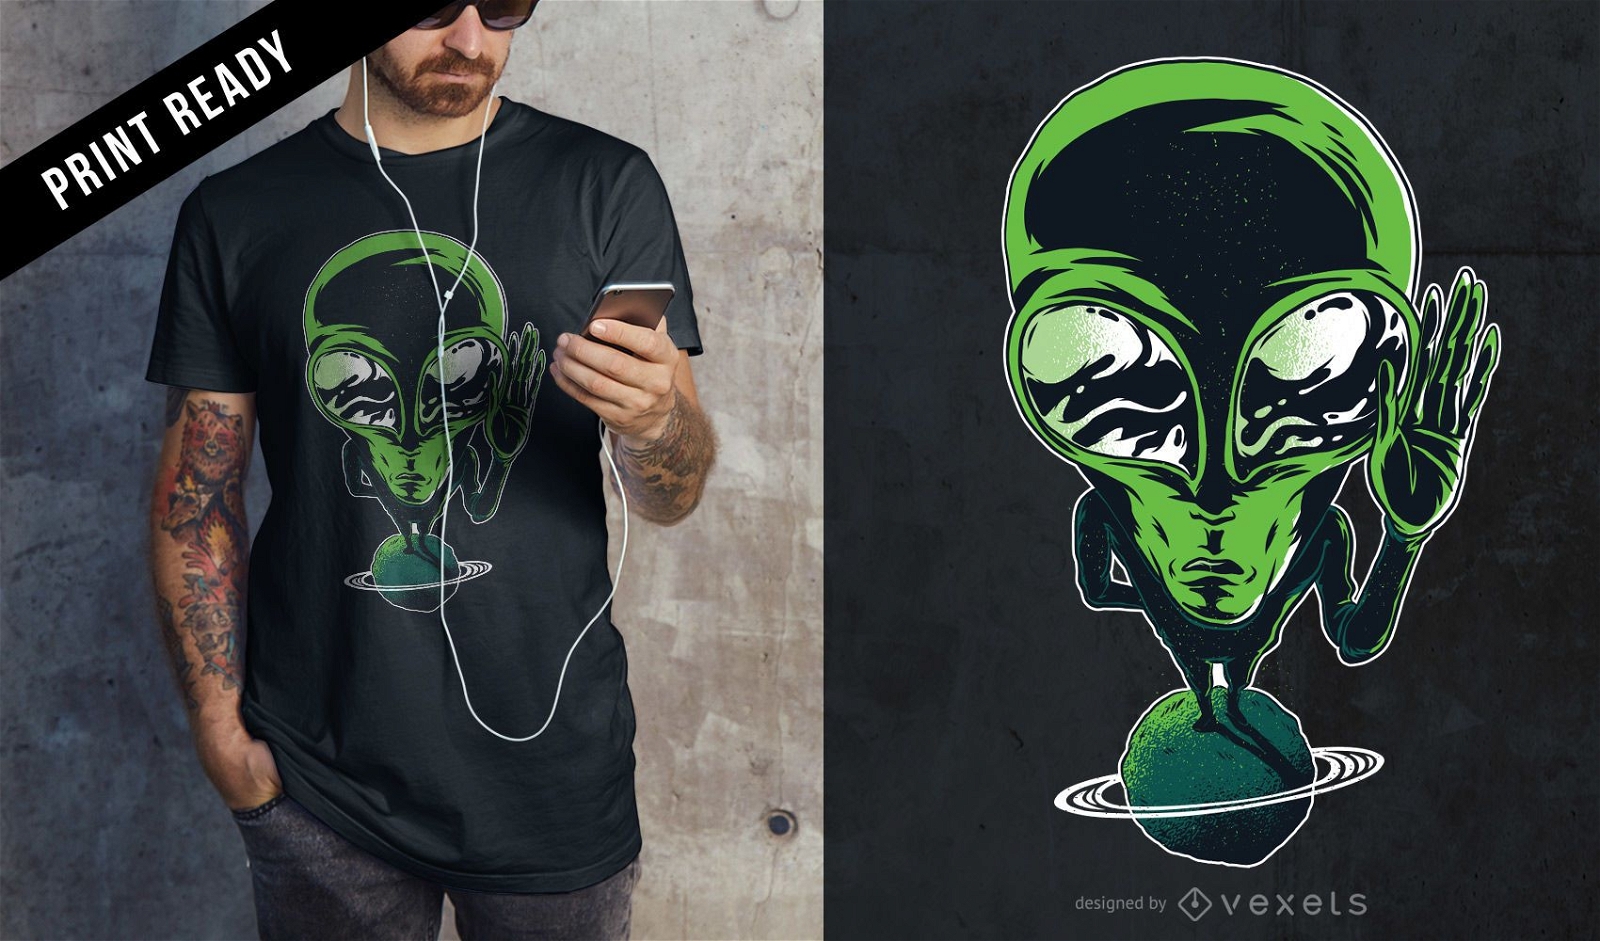
Design de camiseta alienígena no planeta
Escolha uma pasta
Todos os favoritos
Criar novo
Salvar
Design de camiseta alienígena no planeta
para Merch
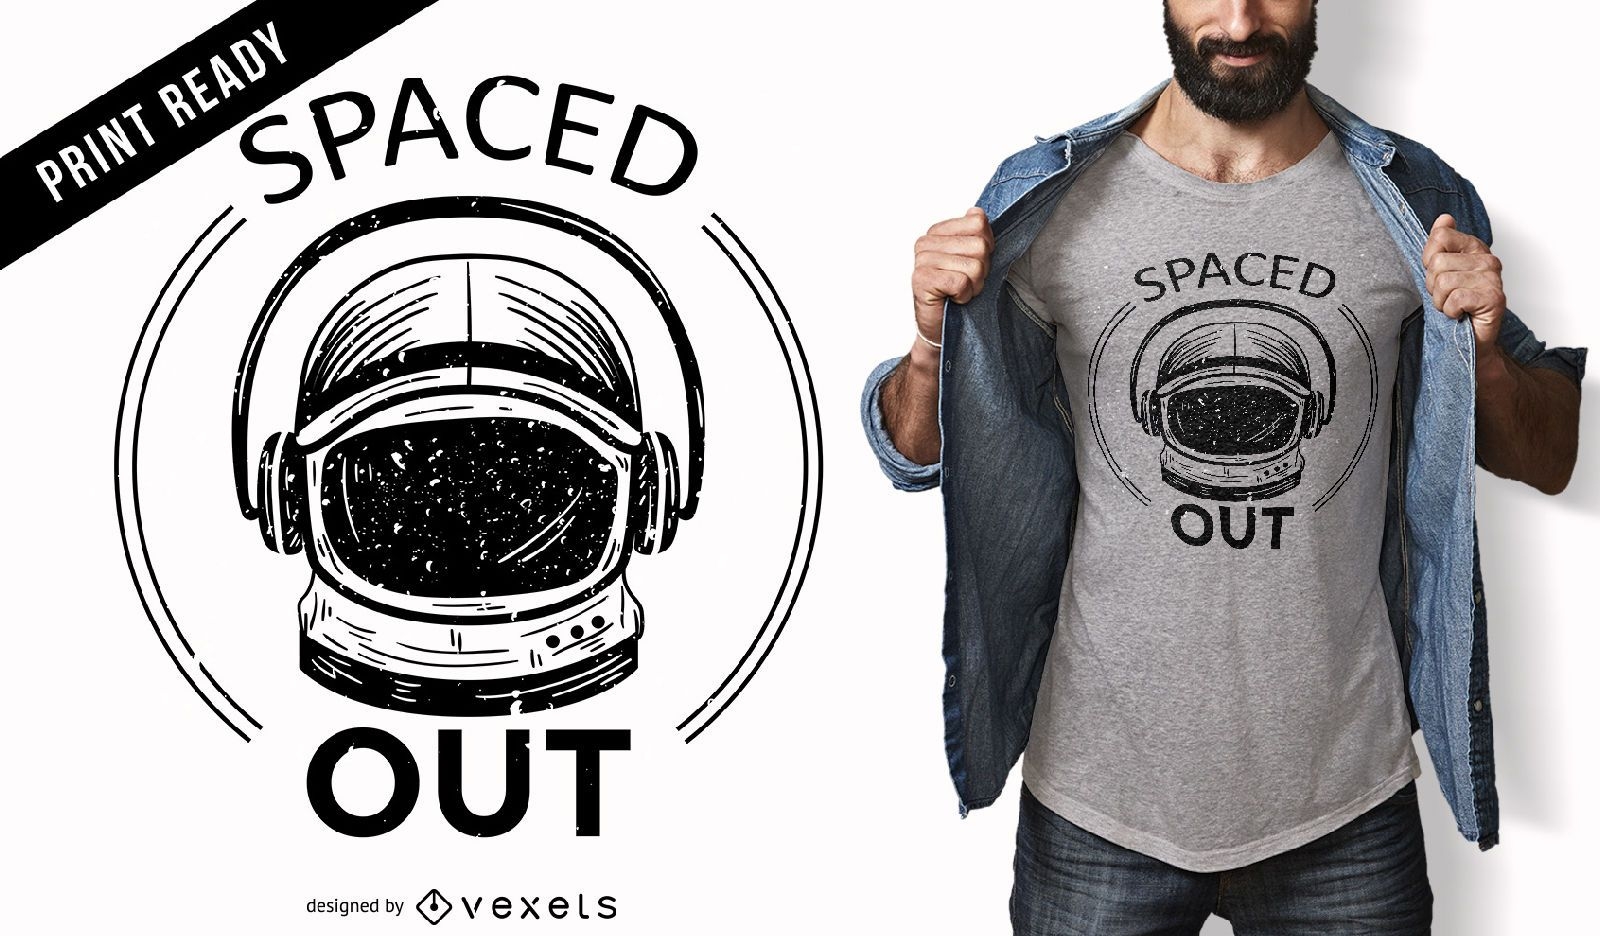
Design espaçado de camisetas
Escolha uma pasta
Todos os favoritos
Criar novo
Salvar
Design espaçado de camisetas
para Merch
Design de t-shirt com padrão moderno
Escolha uma pasta
Todos os favoritos
Criar novo
Salvar
Design de t-shirt com padrão moderno
Impulsione seu negócio
Com a plataforma gráfica líder de mercado.
Ver planos
Próxima
do 546
prev page
next page